development of injectable drugs: technology transfer and ... · development of injectable drugs:...
TRANSCRIPT

Development of Injectable Drugs: Technology Transfer and
Process Validation
Anna Carolina Myers da Silva Luzia
Thesis to obtain the Master of Science Degree in
Pharmaceutical Engineering
Supervisors: Professor José Monteiro Cardoso de Menezes
Specialist Patrícia Alexandre Horta Antunes
Examination Committee
Chairperson: Professor Pedro Paulo De Lacerda e Oliveira Santos
Supervisor: Professor José Monteiro Cardoso de Menezes
Member of the Committee: Professor Helena Isabel Fialho Florindo
October 2017

i
Acknowledgments
Firstly, I would like to express my gratitude to Hikma Pharmaceuticals for the opportunity of attaining
this internship. A special thank you to my Professor Dr. José Cardoso de Menezes, coordinator of the
Master’s degree, for all the support and wisdom transmitted during the course as well as the help
establishing my introduction to the company together with Eng Samuel Camocho.
For the past year, I have learnt so much about how a pharmaceutical company functions, due to all the
people I have had the privilege to work with. Eng. Raquel Marques from the Technical Services
department deserves an enormous amount of credit, for her tireless effort and patience. Teaching me
and answering all my questions about technology transfers/ process validations and allowing me to
accompany the compounding process of new products being manufactured for validation on the
production line. Her intelligence and experience are in fact admirable. A huge thank you to Raquel.
I would also like to thank the professionalism and help of my Supervisor at the Wet-chemistry department
Eng. Patrícia Antunes. For everything I learned from her and for making it possible to conduct my thesis
with the New Projects and Technical Services departments. I would also like to thank Eng. Isabel
Cordeiro (Manager) and Rita Pereira (Supervisor) of the New Projects department for allowing me to
conduct the analytical studies of the new products I accompanied and for later choosing me to take part
in the team.
I wish to convey my appreciation to all my colleagues from the Wet-chemistry team with whom I worked
every day for six months, and to my colleagues at the New Projects with whom I am presently working.
Thank you also to João Sousa, an experienced production operator at Hikma for helping me understand
the functionality of the production line 5.
Last but not least, I would like to thank my parents, my grandparents and my friends for all their support.
A special mention to Catarina Reto, Mariana Rodrigues, Catarina Serra, Catarina Lima, Andreia Revêz,
Rita Saúde, Pedro Gonçalo, Teófilo São Pedro and Joana Leandro.

ii

iii
Abstract
One of the most important aspects in pharmaceutical industries is the manufacturing process. The aim
of the thesis is to contribute to the knowledge about correct validation of processes and successful
technology transfers. Frequently, it is necessary to transfer a technology from a developing site to a
manufacturing site or from one manufacturing site to another for the validation to be completed.
In order to appropriately plan a manufacturing process, quality by design should be followed. Prior
knowledge has to be gained through research and development studies and risk management tools. By
identifying critical quality attributes and critical process parameters it is possible to evaluate risk
scenarios during production and their level of impact. A suitable control strategy is then established
leading to consistent production of quality products. Innovative approaches such as process analytical
technology enable a real-time monitoring and control of the critical aspects of a manufacturing process.
New products transferred to Hikma Portugal are presented including the process design, risk
assessment, evaluation of the preferable conditions for the process at the new site and scale-up.
Keywords: process validation, technology transfer, quality by design, risk assessment, process
analytical technology, scale-up

iv

v
Resumo
Na indústria farmacêutica, definir um processo de produção adequado é um dos aspetos mais
importantes. O objetivo da tese foca-se em contribuir com conhecimento sobre a validação correta de
processos de produção e transferências de tecnologia. De modo a completar uma validação, pode ser
necessário transferir uma tecnologia de um local de investigação e desenvolvimento para um local de
produção, ou de uma fábrica de produção para outra.
A fim de desenvolver adequadamente um processo de produção, a abordagem “quality by design” deve
ser utilizada. O conhecimento prévio relativamente ao produto e ao processo é obtido através de
estudos de investigação e avaliação de risco. Identificando os atributos de qualidade críticos e os
parâmetros críticos do processo é possível avaliar situações de risco que possam ocorrer durante a
produção e o seu nível de impacto. Um sistema de controlo adequado é então estabelecido resultando
em manufatura de produtos com qualidade consistentemente. Abordagens inovadoras, como a
tecnologia analítica de processo, permitem a monitorização e controlo em tempo real dos aspetos
críticos de um processo de produção.
São apresentados dois novos produtos transferidos para a fábrica Hikma em Portugal, incluindo o
desenho do processo, avaliação de risco, análise das condições preferenciais do processo na nova
instalação e aumento de escala.
Palavras-chave: validação de processo, transferência de tecnologia, “quality by design”, avaliação de
risco, tecnologia analítica de processo, aumento de escala

vi
vii
Table of Contents
Acknowledgments .................................................................................................................................. i
Abstract ................................................................................................................................................. iii
Resumo................................................................................................................................................... v
Table of Contents ................................................................................................................................ vii
List of Acronyms .................................................................................................................................. ix
List of Figures ...................................................................................................................................... xii
List of Tables ....................................................................................................................................... xiv
1. Introduction .................................................................................................................................... 1
1.1. Aim of the thesis .................................................................................................................... 1
1.2. Outline of the thesis ............................................................................................................... 1
2. Literature review ............................................................................................................................ 3
2.1. Technology transfer ............................................................................................................... 3
2.1.1. Definition ................................................................................................................... 3
2.1.2. Classification ............................................................................................................. 3
2.1.3. From drug discovery and development process to technology transfer ................... 4
2.1.4. Reasons for technology transfer ............................................................................... 6
2.1.5. Importance of technology transfer ............................................................................ 6
2.1.6. Factors influencing technology transfer .................................................................... 7
2.1.7. Team and training ..................................................................................................... 8
2.1.8. Documentation .......................................................................................................... 8
2.2. Process validation ................................................................................................................. 9
2.2.1. Definition ................................................................................................................... 9
2.2.2. Resources required ................................................................................................ 10
2.2.3. Need and importance ............................................................................................. 10
2.2.4. Approaches to validation ........................................................................................ 10
2.2.5. Scale-up and risk assessment ................................................................................ 12
2.2.6. Process validation stages ....................................................................................... 15
2.2.7. Qualification stages ................................................................................................ 18
2.2.8. Validation team and responsibilities ....................................................................... 19
2.2.9. Documentation ........................................................................................................ 20
3. Technology transfer between Hikma R&D and Hikma PT ....................................................... 23
3.1. Analytical method development .......................................................................................... 24
viii
3.2. Product development ........................................................................................................... 24
3.3. Submission batches manufacture ....................................................................................... 25
3.4. Industrial facility and production lines, line 5 operation ....................................................... 26
4. Practical examples: Technology transfer of injectable drugs on line 5 ................................. 31
4.1. Product A ............................................................................................................................. 31
4.1.1. Description .............................................................................................................. 31
4.1.2. Materials and compatibility ..................................................................................... 32
4.1.3. Product and process precautions ........................................................................... 33
4.1.4. Manufacturing process ........................................................................................... 34
4.1.5. Risk assessment ..................................................................................................... 34
4.1.6. Process evaluation activities and results ................................................................ 35
4.1.7. Problems during submission batches ..................................................................... 37
4.2. Product B ............................................................................................................................. 40
4.2.1. Description .............................................................................................................. 40
4.2.2. Product and process precautions ........................................................................... 41
4.2.3. Manufacturing process ........................................................................................... 42
4.2.4. Risk assessment ..................................................................................................... 43
4.2.5. Process evaluation activities and results ................................................................ 44
4.2.6. Scale-up .................................................................................................................. 46
5. Optimization of submission and commercial batches – PAT.................................................. 49
6. Conclusion ................................................................................................................................... 53
6.1. Contributions ....................................................................................................................... 53
6.2. Future work .......................................................................................................................... 55
7. References .................................................................................................................................... 57
8. Annexes ........................................................................................................................................ A1
ix
List of Acronyms
ANDA Abbreviated New Drug Application
API Active Pharmaceutical Ingredient
AR Analytical Research
CMA Critical Material Attribute
CoA Certificate of Analysis
CPP Critical Process Parameter
CQA Critical Quality Attribute
DMF Drug Master File
DOE Design Of Experiments
EMA European Medicines Agency
EMEA European Medicines Evaluation Agency
EP European Pharmacopeia
FDA Food and Drug Administration
FMEA Failure Mode Effects Analysis
FMECA Criticality Analysis for Bulk Compounding and Filling
GMP Good Manufacturing Practices
HPLC High Performance Liquid Chromatography
HVAC Heating, Ventilation and Air Conditioning
ICH International Council for Harmonisation of technical requirements for
pharmaceuticals for human use
IQ Installation Qualification
MBR Master Batch Record
MFC Master Formula Card
MHRA Medicines and Healthcare products Regulatory Agency
NIR Near-Infrared
NMT Not More Than
OOS Out Of Specification

x
OQ Operational Qualification
PAC Process Analytical Chemistry
PAT Process Analytical Technology
PDR Process Development Report
PPE Personal Protective Equipment
PPQ Process Performance Qualification
PQ Performance Qualification
PT Portugal
PV Process Validation
PVDF Polyvinylidene difluoride
QA Quality Assurance
QbD Quality by Design
QC Quality Control
QU Quality Unit
R&D Research and Development
RLD Reference Listed Drug
SOP Standard Operating Procedure
STP Standard Test Procedure
TTR Technology Transfer Report
UK United Kingdom
US United States
USP United States Pharmacopeia
VMP Validation Master Plan
WFI Water For Injection
WHO World Health Organization

xi

xii
List of Figures
Figure 1 – Flow chart of the manufacturing process of product A ......................................................... 34
Figure 2 – Root cause map for oxygen headspace OOS for 5 mL/vial presentation batch .................. 38
Figure 3 - Root cause map for oxygen headspace OOS for 1 mL/vial presentation batch ................... 39
Figure 4 – Flow chart of the manufacturing process of product B......................................................... 42
Figure 5 – Process map for process parameters, quality and material attributes for product B (Madieh
2015) ...................................................................................................................................................... 43
Figure 6 - Scheme of process monitoring: at-line, on-line, in-line and off-line ...................................... 50
Figure 7 – Sampling scheme of product A manufacturing process ....................................................... A2
Figure 8 - Sampling scheme of product B manufacturing process ....................................................... A4

xiii

xiv
List of Tables
Table 1 – Information contained within technology transfer documentation (Dogra 2013) ..................... 9
Table 2 – Responsibilities of the authorities of each department (Keyur 2014) .................................... 20
Table 3 – Information available in the TTR ............................................................................................ 25
Table 4 – Hikma’s facilities, production lines, product presentations and type of products .................. 27
Table 5 – Product A presentation of the submission batches ................................................................ 31
Table 6 – Process conditions for product A ........................................................................................... 33
Table 7 – Volume specifications for filling of product A ......................................................................... 37
Table 8 – Product B presentation of the submission batches ............................................................... 40
Table 9 - Process conditions for product B ............................................................................................ 41
Table 10 - Volume specifications for filling of product B ........................................................................ 45
Table 11 - Rational for the proposed batch size of product B ................................................................ 47
Table 12 – FMEA for product A .............................................................................................................. A1
Table 13 – FMEA for product B ............................................................................................................. A3
Table 14 - Risk assessment for the technology transfer of product B from Bedford to Hikma regarding
compounding ......................................................................................................................................... A5
Table 15 - Risk assessment for the technology transfer of product B from Bedford to Hikma regarding
filtration and filling .................................................................................................................................. A6
Table 16 - Risk assessment for the scale-up to commercial size regarding the preparation tank,
dissolution times, mixing speeds and filtration of product B .................................................................. A7
Table 17 - Risk assessment for the scale-up to commercial size regarding the filtration and actual
production yield of product B ................................................................................................................. A8

xv

1
1. Introduction
1.1. Aim of the thesis
The aim of the thesis is to contribute to the knowledge about development of injectable pharmaceutical
products. In particular, how technology transfer and Process Validation (PV) is developed and performed
in pharmaceutical industries, specifically Hikma Pharmaceuticals Portugal. The purpose is also to
examine the possibility of improving the control strategy of submission batches, so that the risk of failed
batches for validation is reduced as well as the following commercial batches.
1.2. Outline of the thesis
The thesis will begin by a literature review based on platforms from organisations such as International
Council for Harmonisation of technical requirements for pharmaceuticals for human use (ICHs), World
Health Organisation (WHO), Food and Drug Administration (FDA) and European Medicines Agency
(EMA). The literature review is also based on articles regarding technology transfers, PV concept and
scale-up. Hikma’s documentation – Standard Operating Procedures (SOPs) – concerning this matter
will also be used.
The thesis is followed by a description of Hikma’s facilities and lines of production, in more detail line 5,
because the new products in development that will be mentioned were produced in this line.
Two practical examples of products for validation are presented. Starting by a detailed description about
the transfer of the injectable products to Hikma PT from Hikma located in the United States (US)
denominated Bedford. The process is explained, including the compounding and filling on line 5. The
evaluation activities performed during production of the submission batches are mentioned together with
the relevant results. Scale-up plan for product B is presented.
The last part includes an investigation about the possibility of control strategy improvement, so that the
risk of failures during validation and consequently during commercial manufacturing are reduced.
Process Analytical Technology (PAT) is taken into consideration – the Critical Process Parameters
(CPPs), Critical Quality Attributes (CQAs) and Critical Material Attributes (CMAs) of the selected new
products in development at Hikma are analysed.

2

3
2. Literature review
2.1. Technology transfer
2.1.1. Definition
The term technology transfer can be defined as the movement of knowledge, skill, organisation, values
and capital from the point of generation to the site of adaptation and application. In the pharmaceutical
industry, technology transfer refers to the processes that are needed for successful progress from drug
discovery to product development, to clinical trials, to full scale commercialization or it can be the
process by which a developer of technology makes its technology available to a commercial partner that
will exploit the technology. In general, technology transfer can be used to refer to movements of
technology from the laboratory to industry, developed to developing countries, or from one application
to another domain. (Feifeit 2008)
The transfer is successful if the receiving unit can routinely reproduce the transferred product, process
or method against a predefined set of specifications as agreed with a sending unit or a development
unit. (Al Ghailani 1995)
2.1.2. Classification
Technology transfer can be classified into vertical and horizontal technology transfer. Vertical transfer
refers to transfer of technology from basic research to applied research, then to development and finally
to production. Horizontal transfer refers to the movement and use of technology used in one place,
organisation, or context to another. (Mansfield 1975)
Vertical tech-transfer can be seen as internal technology transfer and horizontal tech-transfer as external
technology transfer. On this point of view, vertical technology transfer is considered a managerial
process of passing a technology from one phase of its lifecycle to another. Horizontally transfer
reinforces that it may be possible to transfer technology in locality terms at any stage of the technology
lifecycle. (Souder 1990)
The transfer can further be divided in other categories: material transfer, design transfer, and capacity
transfer. Material transfer refers to the transfer of a new material or product while design transfer
corresponds to the transfer of designs and blueprints that can facilitate the manufacturing of the material
or product by the transferee. Capacity transfer involves the transfer of know why and know-how to adapt,
and modify the material or product to suit various requirements. (Steenhuis 2002)

4
2.1.3. From drug discovery and development process to
technology transfer
Technology transfer, as explained previously, is a process to transfer information and technologies
necessary to manufacture quality drug product consistently or it can be the process of taking an
invention from its inception in a laboratory to a commercialized product.
The successful technology transfer from Research and Development (R&D) (the transferring site), to
the commercial production site (the receiving site), is a critical process in the development and launch
of a new medicinal product. It can be extremely costly for a company if something goes wrong during
the transfer process, resulting in delays. Furthermore, it can take increased resource, time and cost to
make corrective actions following an unsuccessful transfer. Progressive pharmaceutical companies are
therefore placing more attention to streamlining and optimising their technology transfer process to
ensure the rapid and successful introduction of a new product to the market. The ideal situation is to
complete the transfer to the production site at an affordable cost. (Ghafaripour 1999)
Technology development has to pass by three stages: the development of a new science, the link
between the new science and technology and the technology being put into products. The drug quality
is designed based on data concerning efficacy and safety obtained from various studies in preclinical
phases and data concerning efficacy, safety and stability of drug products obtained from clinical studies.
The phase I, clinical studies involve small scale studies in patients, they are provided in the form of a
non-optimized formulation, quite different from the intended commercial formulation. There is a high
probability that the studies do not proceed to full development due to toxicity findings or clinical findings
(safety, efficacy and pharmacokinetics/bioavailability). Phase II and III involve longer term safety and
clinical studies in larger groups of patients suffering from the targeted disease. During full development,
the synthetic route for the drug substance is optimized and the manufacturing process is scaled up and
fixed.
If sufficient drug substance is available and the phase III supplies are very large, it may be preferable to
scale-up the manufacturing process to production scale and transfer the process to the commercial
production site and use the supplies from there. A potential risk of transferring early to production is that
all the development work has to be done earlier, the formulation has to be completed as well as the
manufacturing process design. After transferring the process to production it is still possible to perform
adjustments, however it involves documented change controls. Starting the technology transfer before
initiating the phase III studies is also a slight unsafe approach because there is still a relatively high risk
involved during phase II caused by failures related to efficacy and clinical safety.
Regulatory authorities such as FDA, the Medicines and Healthcare products Regulatory Agency
(MHRA) in the United Kingdom (UK) and the European Agency for the Evaluation of Medicinal Products
(EMEA), require three phases of clinical trials and sufficient data to show that the new drug product can
be licensed as safe, effective and of acceptable quality. Once the phase III clinical trials are completed
successfully and the commercial manufacturing process has been transferred from R&D to production

5
site, a regulatory submission can be made. It is important to take into consideration that the technology
transfer, apart from the information related to the process manufacturing, also involves the development
and successful transfer of the analytical and microbiological test methods for the drug substance and
drug product that will be used by the Quality Control (QC) departments at the commercial production
site.
To assure the drug quality, it is desired to make sure what, when and why information should be
transferred to where and by whom and how to transfer, then share knowledge and information of the
drug product between transferring and transferred parties. (Gupta 2012)
As a summary, technology transfers happen mainly between these three points: research phase,
development phase and production phase.
Research phase
The research site is responsible for the correct pharmaceutical design of the drug. This phase includes
the study of the components/product efficacy, guarantee the avoidance of adverse reactions, assure the
drug stability and analyse the data available to achieve a better knowledge about the product. (Gorman
2002)
Development phase
In order to manufacture drugs with qualities as designed, it is required to establish an appropriate
manufacturing process at a small scale and detect variability factors to assure that the scale-up for
submission and validation purposes will be performed without difficulties. The upper and lower limits of
the manufacturing process including composition and parameters should be challenged during
development. (Patel 2009)
Production phase
To assure the consistency between development and manufacturing, the transferring party in charge of
development should fully understand what kind of technical information is required by the receiving party
in charge of manufacturing. An appropriate evaluation method to determine whether a drug to be
manufactured meets the quality of design should be executed. In case the product is similar to others
before produced, it is fundamental to study the information about the process maintained by the
manufacturer. (Gibson 2001)

6
2.1.4. Reasons for technology transfer
A developer of technology makes its technology available to another person to exploit for several
reasons. It can occur that the original inventor of technology may have the resources to conduct early-
stage research such as animal studies and toxicology study, but does not have the resources to take
technology through its clinical phases. Another frequent situation is having the resources to develop the
product, however it might not be sufficient to take the technology through its regulatory phases, for this
reason the developer must collaborate with another organization to take the product into market.
The developer of the technology may have developed the product to a state almost ready to launch,
nevertheless the manufacturing capability and resources available may only be suitable for small scale
production. A partnership with an organization with a large scale capability is necessary.
It can also happen that a full development of the technology has been completed with regulatory
approvals and product registrations for the product to be sold, however it can lack the marketing and
distribution channels. Due to this deficiency a collaboration with another organization which has that
capability is necessary. (Patil 2010)
2.1.5. Importance of technology transfer
It has been recognized that the transfer of technology is essential for the process of economic growth,
and that the progress of both developed and developing countries depends on the efficiency of such
transfer. A firm and its partners collaborating in the technology transfer will gain financial and strategic
benefits, the means not available at one site compensates the resources available in another. Working
in partnership makes it possible to accomplish every stage. The importance of technology transfer has
also stimulated university industry technology transfer.
In the pharmaceutical industry, the intersection between business and science is both essential and
critical to the drug discovery and development process for a new medicinal product. Technology transfer
allows the link between R&D, process development and production for commercialization. If it is
implemented thoughtfully then production process runs efficiently, the risks during production are
minimized and a robust process for routine commercial manufacturing is achieved.
Appropriate technology transfer is essential to upgrade the quality of design to be the quality of product,
and ensure stable and high quality of the product. (Osman 1999)

7
2.1.6. Factors influencing technology transfer
Drivers
Technology transfer has several advantages. As mentioned it allows a promising market scale because
if a specific process is transferred to a larger country the business and marketing potential is greater.
The countries have a supportive environment that includes strong intellectual property and enforcement
to successfully attract imported technology, which facilitates the transfer. Factors as skilled workforce
working together such as engineers and managers also contribute to efficiency in the results. Increased
information exchange including effective systems that identify who is interested in purchasing the
technology and entities willing to transfer their technology are easy ways to facilitate the task.
The prospect of technology transfer can be very desirable to local pharmaceutical manufacturers even
in another viewpoint. The technology, new machinery, training, among other transfer additional benefits
can then be applied profitably for other production purposes. (Donald et al 1995) (Akhavan 1995)
Barriers
Technology transfer can face different difficulties. For example, there is a need of skilled labour however
the unattractive conditions of service are a negative contributor.
In the cases where the knowledge and awareness were not accomplished at a high level by the
developer of the technology, the transfer to the new site is more complex. The lack of government focus
at times towards the technology transfer approach and the high cost for prequalification can also bring
complications, monetarily. The funding on important areas of research should also be higher.
Furthermore, there are controls and restrictions on technology exportation established by national
security which makes it harder to perform the transfer internationally. Another problem found is the
reduced access to online scientific journals, for the R&D site it can raise difficulties during the
development process. (Ortega 2009)
Approaches to overcome obstacles
In order to overcome the problems faced by technology transfer certain measures can be taken. For
instance, it is preferable to commercialize publicly funded technologies so that the costs involved are
not as high. Political stability will influence the rate of inward technology transfer and a good leadership
is essential for a strengthened healthcare system. Incentives designed to encourage technology transfer
such as adequate capital markets should be implemented.
Regarding the difficulty of not having access to important scientific discovers online, research tools for
patents and an international treaty on scientific access could solve the problem. (Madu 1989)

8
2.1.7. Team and training
The technology transfer team is meant to develop and implement a methodology that ensures the
effective and efficient transfer of robust and candidate production processes from development to
manufacturing.
The team is trained on the technology transfer process, so that each member is familiar with both the
business methodology to be used and the technical aspects of the process being transferred. Each
member must understand process tools, to help organize and assemble numerical data, assign action
items and identify areas of weakness or omission. Successful technology commercialization depends
on a skilled workforce in management, production, sales, distribution, and support.
In order to obtain a successful project, it is necessary to implement an effective training for all involved
in the new process, including production operators and regulatory team members which will prepare the
submission. The training is applied on the transfer process and consequently provides a good
knowledge about the process technology. In accordance to the current Good Manufacturing Practices
(GMP) requirements, all training has to be documented and all members which interact with the new
technology have to be trained. (Souder 1990)
2.1.8. Documentation
The documentation for technology transfer includes content for transferring and transferred parties, it
should be always available and traceable. Task assignment and responsibilities should be clarified. The
Quality Assurance (QA) department at the manufacturing site checks and approves the technology-
transfer documentation. Information from the transferring site is essential so that the technology transfer
team can better evaluate options and can distinguish the critical from the incidental. The reasons for the
selection of particular unit operations, equipment, and conditions, should be well described in the
documentation so that every step can be clearly understood. (Ali 2012)
In the cases where the transfer happens from R&D site to manufacturing site, the technology transfer
dossier provided to the production site includes documentation for the transfer of the analytical methods.
It contains information about formulation and drug product such as the Master Formula Card (MFC)
which comprises the product name, strength, generic name, shelf life and markets of interest. It also
includes the master formula (formulation, steps of manufacturing process and environment conditions
required) and the master packaging card (packaging type, material used for packaging, stability and
shelf life). The specifications and Standard Test Procedure (STP) have to be included together with
information about the Active Pharmaceutical Ingredient (API) and excipients profile, in-process
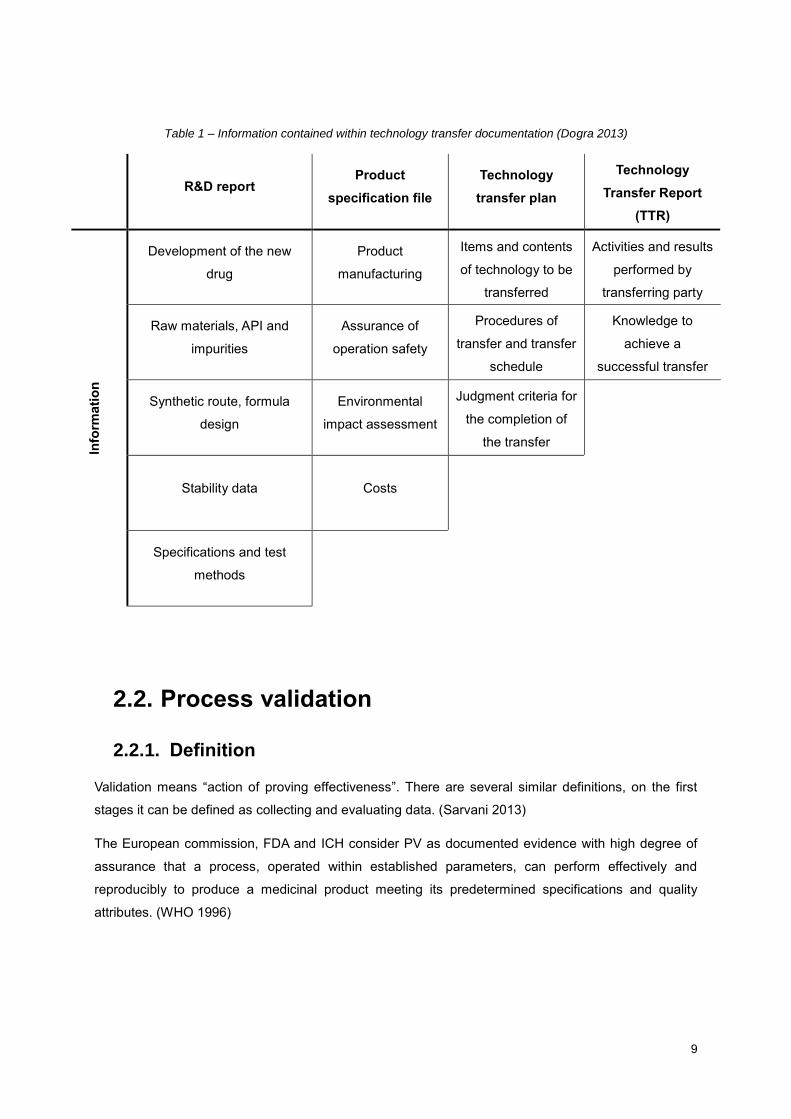
parameters and finished product details. (Dogra 2013)
Table 1 presents the data included in the existing types of documents for technology transfer.
9
Table 1 – Information contained within technology transfer documentation (Dogra 2013)
R&D report Product
specification file
Technology
transfer plan
Technology
Transfer Report
(TTR)
Info
rmati
on
Development of the new
drug
Product
manufacturing
Items and contents
of technology to be
transferred
Activities and results
performed by
transferring party
Raw materials, API and
impurities
Assurance of
operation safety
Procedures of
transfer and transfer
schedule
Knowledge to
achieve a
successful transfer
Synthetic route, formula
design
Environmental
impact assessment
Judgment criteria for
the completion of
the transfer
Stability data Costs
Specifications and test
methods
2.2. Process validation
2.2.1. Definition
Validation means “action of proving effectiveness”. There are several similar definitions, on the first
stages it can be defined as collecting and evaluating data. (Sarvani 2013)
The European commission, FDA and ICH consider PV as documented evidence with high degree of
assurance that a process, operated within established parameters, can perform effectively and
reproducibly to produce a medicinal product meeting its predetermined specifications and quality
attributes. (WHO 1996)

10
2.2.2. Resources required
A validation requires three main aspects: time, financial means and skilled labour. It can take a lot of
time to complete all the stages, however rigorous time schedules will have to be accomplished to assure
the availability of the product in the market when planned. A high financial plafond must be available by
the manufacturing site because validation requires specialized personnel and expensive technology.
The need of a multidisciplinary team depends on the process and product to be validated, it comprises
quality assurance, engineering, manufacturing and other disciplines. (WHO 2006)
2.2.3. Need and importance
Validation in itself does not improve processes however it confirms the efficiency of the developed
processes and proves that they are under control. It can help to reduce the quality costs, which are
divided into four categories: preventive costs, appraisal costs, internal failure costs and external failure
costs.
A scientifically studied and controlled validated process makes it less likely that defective products are
sent to the market and also reduces customer complaints. It is proven that batches fail less, as a
consequence the output is increased and productivity is higher. Another important quality that results
from validation is the increase in safety. Tested and approved equipment and materials during
qualification and validation assure that the product is produced safely. The obligation by regulatory
governments to calibrate certain equipment, and to perform periodic maintenance also improves the
security. Furthermore, there is an advantage for employees, their execution is improved due to the
previous awareness of the process during the validation.
Government regulation obliges compliance with validation requirements to obtain approval for
manufacture and to introduce new products, this helps to assure that all processes implemented are
controlled and suitable. (Keyur 2014)
2.2.4. Approaches to validation
Validation can be prospective, concurrent, retrospective or revalidation depending on when it is
performed in relation to production.
Prospective validation
Prospective validation is adopted for when new drug products are introduced. It is carried out in the
development stage, a risk analysis of the production process is made. The process is broken down into
individual steps which are evaluated based on data from experimentation to determine if they might lead
to critical situations. If critical points are found, the risk is evaluated and the potential causes are

11
investigated. Trials are performed, and if the results are acceptable, the process is suitable. (Sarvani
2013)
Unsatisfactory processes are modified and improved until a validation demonstrates that they are
acceptable. This type of validation limits the risk of errors occurring on the production scale. (WHO 1996)
Concurrent validation
Concurrent validation takes place during normal production. This method is effective if the development
stage has resulted in sufficient knowledge and understanding of the process. The first three production
scale batches must be well monitored, the specifications of subsequent in-process and final tests are
based on the monitoring results. (WHO 1996)
With the documented results the process is proven to be in a state of control. Concurrent validation with
a trend analysis including stability should be done throughout the lifecycle of the product. (Sarvani 2013)
Retrospective validation
Retrospective validation is chosen for established products with stable processes. This type of validation
comprises experience of production, it assumes that composition, procedures, and equipment remain
unchanged. The experience and the results of in-process and final product testing are then evaluated.
Failures that occur in production are analysed to determine the limits of process parameters. (Sarvani
2013)
A trend analysis is conducted to determine the extent which the process parameters are within the
permissible range. This mean of validation should never be applied to new processes or products, it is
used only in special circumstances. Retrospective validation can be useful in establishing priorities for
the validation programme. If the results of a retrospective validation are positive, it indicates that the
process does not need immediate consideration and may be validated normally. (WHO 1996)
Revalidation
Revalidation is used when it is necessary to prove that intentional or unintentional changes in the
process or in the process environment, do not adversely affect process characteristics and product
quality. Revalidation can be executed after a change with impact on product quality, or periodically at
scheduled intervals.
When the revalidation occurs after a change, it is necessary to implement the alterations affecting the
manufacturing or standard procedure and perform again the same tests made in the first validation.
Each modification should be reviewed by a qualified validation group to conclude if it is sufficient to opt
12
by revalidation, and if it is, in which extent. Unexpected changes and deviations can be observed during
self-inspection or audit, or during the continuous trend analysis of process data.
The changes are usually on starting materials, physical properties (density, viscosity, particle size
distribution and crystal type of the active ingredients or excipients), packaging material (for example
replacing plastics by glass), process (changes in mixing time, drying temperature and cooling regime
can affect process steps and product quality), equipment, production area and support system. The
rearrangement of manufacturing areas or support systems such as ventilation may result in changes in
the process, revalidation may be necessary predominantly in sterile products manufacturing.
When the revalidation is periodic, scheduled times for analysis are organised even if no changes have
been made (just for caution). This happens because process changes may occur gradually even if
experienced operators work correctly according to established methods, so as equipment which can
also have continuing changes.
For scheduled revalidation the following points have to be checked: changes in the master formula,
methods, batch sizes, analytical control methods and if it impacts the product; confirmation that
calibrations and preventive maintenance has been made in accordance with the established programme
and time schedule; cleaning programmes have been carried out and SOPs have been updated correctly
and implemented.
Periodic revalidation is based on a review of historical data (in-process and finished product testing after
the latest validation) to verify that the process is under control.
In some processes, such as sterilization, additional process testing is required to complement the
historical data. (Sarvani 2013)
So basically, there are two approaches to validation, one based on evidence obtained through testing
(prospective and concurrent validation), and one based on the analysis of accumulated/ historical data
(retrospective validation). Whenever possible, prospective validation is preferred. Retrospective
validation is no longer encouraged and is, in any case, not applicable to the manufacturing of sterile
products. (WHO 1996)
2.2.5. Scale-up and risk assessment
Scale-up of pharmaceutical manufacturing processes demand a combination of experience, science
and engineering. In order to achieve a successful scale-up between the different phases, it is essential
that the Critical Material Attributes (CMAs) and Critical Quality Attributes (CQAs) of those materials
involved in the formulation of the product together with the Critical Process Parameters (CPPs) of the
manufacturing process are well defined since the beginning. Risk management tools can help controlling
the critical steps of the process.

13
Risk assessment can be defined as the identification of hazards and the analysis and evaluation of risks
associated with exposure to those hazards. It is commonly understood that risk is the combination of
the probability of occurrence of harm and the severity of that harm, risk scenarios are the events that
identify the risks associated with the use of a system. The adoption of effective risk management is
indispensable to create awareness about the critical steps of the process with most probability to cause
failure, and how to control them.
Process mapping should be undertaken to ensure that all possible risks are considered, it is a map
performed by interdisciplinary teams which provides a better understanding of the process and assists
in providing a structured methodology for risk identification (failure modes identification). After identifying
the risk and its scenario, the effects are considered. The next stage is to determine the likelihood of an
adverse event to happen and assigning a value to that estimate. The parameters probability, severity
and detectability should be identified for each risk. Frequency of probability is rated from 1 to 3 in
accordance to its likelihood:
- Level 1 (low): the frequency of the event occurring is once per ten thousand transactions;
- Level 2 (medium): the frequency of the event occurring is once per thousand transactions;
- Level 3 (high): the frequency of the event occurring is once per hundred transactions.
Severity of the potential effect of the failure requires the team to consider which impact the event has
on the product quality or data integrity. The impact of the consequence is rated also from 1 to 3:
- Level 1 (low): expected to have a minor negative impact, the damage is not expected to have a
long term detrimental effect;
- Level 2 (medium): expected to have a moderate impact, the impact can be expected to have a
short to medium term detrimental effect;
- Level 3 (high): expected to have a very high significant negative impact, the impact can be
expected to have significant long-term effects and potentially catastrophic short term effects.
Having assigned the probability of the risk and the level of impact that such an event may have, the risk
can be classified. The risk is a multiplication of probability and severity. It can range from:
- Level 1 (high): the probability that this failure appears is high and that the impact on product
quality or data integrity is high or medium;
- Level 2 (medium): moderate impact on product quality or data integrity;
- Level 3 (low): practically no impact on product quality or data integrity.
The detectability stage is performed to identify if the risk can be recognized or detected by other means
in the system. The probability of a risk being detected is rated 1, 2 or 3 according to its detection
possibilities:
- Level 1 (high): a reliable detection device is continuously used on the system for direct
parameter measurement and leads to alarm activation or automatic system safe reconfiguration
in case of threshold overrunning (secured);

14
- Level 2 (medium): a reliable detection procedure is systematically applied however it gives
delayed results, as another option an indirect measuring device can be used, or a direct
measuring device in line with no alarm (insufficient secured);
- Level 3 (low): no reliable detection device is used nor detection procedure as part of the system
operation or monitoring (not secured).
The risk evaluation can be done by the comparison against qualitative or quantitative criteria. Historical
data and trends should be evaluated. For quantitative evaluation, risks prioritization can be followed.
Risk priority number is a multiplication of three parameters taking into account the potential failure
associated with the potential effect and its detectability.
- High risk priority number: function or component is critical, validation measures are to be taken;
- Medium risk priority number: function or component is potentially critical, validation measures
are to be taken;
- Low risk priority number: function or component is not critical and there are no validation actions
or measures to be taken.
The risk management strategy has been completed and correctly applied as soon as the risk reduced
to an acceptable level and when the risk control process has been accepted. If the evaluation reached
to the conclusion that controls are not enough the risk reduction process should be evaluated. (ICH
2005)
Application of statistical methods such as Design Of Experiments (DOE) together with advances in
measurement tools such as PAT allow improvements in process understanding and control. DOE are a
mean to gain knowledge about the process and design an effective control strategy by allowing the
establishment of multivariate interactions between the variable inputs (material attributes and process
parameters for example) and the outputs (in-process material, intermediates or final product). It makes
it easier to apply risk management. PAT is an innovative mean of control that includes timely analysis
and control loops to adjust the processing conditions so that the output remains constant. Manufacturing
using this system can provide a higher degree of process control, reducing the risks. (FDA 2011)
These advances are expected to cause a shift from trial and error to rational process scale-up following
Quality by Design (QbD) initiative. QbD is a systematic approach to development that begins with
predefined objectives and emphasizes product/process understanding simultaneously with process
control, based on science and quality risk management. (ICH 2009)
The first studies performed to validate a product start at a laboratory scale, following the pilot batches
and finally the scale-up to production batches. (Gibson 2001)
Laboratory scale batches
These batches are produced at the research and early development laboratory stage, they have a very
small size, approximately one tenth of a normal production batch. The production of these batches is

15
helpful to support formulation and packaging development, clinical and pre-clinical studies. The data
that these batches provide are useful to define the products characteristics and enable the choice of
appropriate manufacturing process. (Nandhakumar 2011)
Pilot batches
Pilot batches may be used in the process development or optimisation stage to support formal stability
studies and support pre-clinical and clinical evaluation. The size of the batches corresponds to at least
10% of the production scale batch, the multiplication factor for the scale-up does not exceed ten. The
objective of pilot scale batches is to provide data predictive of the production scale product. To continue
developing and to optimise the manufacturing process, pilot scale batches are essential. They make it
possible to analyse and evaluate the difficulties and critical points of the process together with the
methods most appropriate for large scale production.
The production of pilot batches should assure that the product and manufacturing process are
achievable on an industrial scale. (Nandhakumar 2011)
The batches produced for submission of the product to the authorities depend on the risk of the
product/process. However, the usual situation is three batches for each presentation (strength and
size/quantity). A bracketing approach can be used in certain occasions, for example if different sizes are
produced for the same strength it is only necessary to produce three batches of the biggest size and
three batches of the smallest size, the intermediate quantities require the production of only batch.
Production scale batches
The batches have the normal size for production of the routine commercialization of the product. The
evaluation and characterization of the critical process parameters at laboratory or pilot scale made,
followed by the manufacture of submission batches, is completed by a formal validation programme on
production scale batches for which the validation scheme has been applied. (Nandhakumar 2011)
2.2.6. Process validation stages
Process design
Process design is defining a process suitable for routine commercial manufacturing that will be reflected
in planned master production and control records. The objective is to manufacture a product that meets
its quality attributes. An important step in process design is to build and capture process knowledge and
understanding. For the first design experiments good documentation practises and scientific methods
have to be followed though it is not necessary to follow the current GMP conditions. However, for drugs
that are manufactured during stage 2 (process qualification) and stage 3 (continued process verification)

16
it is obligatory. All information must be documented and reviewed, the data should be used for adaptation
throughout the lifecycle of the product.
During the product development, important aspects which are defined such as quality attributes, dosage
form and manufacturing steps, contribute to the process design. Manufacturing equipment, production
operators, contributors to variability and environmental conditions are considered for the design
Computer simulations of certain manufacturing steps can help avoiding problems during commercial
production, however it is important to take into consideration the differences that might exist between
the models and reality. All information which results in process understanding should be documented, it
is used for process qualification and continued process verification.
In order to guarantee quality production, there are different options of process control, for example
material analysis and equipment monitoring at certain processing points. The type and extent of process
controls are decided by previous risk assessments and improved as process experience is gained.
There is a need of special in-process control when the product attribute is not readily measurable due
to limitations of sampling or detectability, or when intermediates/products cannot be highly characterized
and well-defined quality attributes cannot be identified. The controls are listed in the master production
and control records.
The designed commercial process which includes the operational limits and process control strategy,
should be passed to the next stage for confirmation. (FDA 2011)
Process qualification
The objective of the process qualification stage is to evaluate if the process design is capable of
reproducible commercial manufacture. It is necessary to complete this stage successfully in order to
proceed with commercial distribution, GMP-compliant procedures must be followed.
The process qualification is divided in two fundamentals:
- Design of the facility and qualification of utilities and equipment;
- Process Performance Qualification (PPQ).
A correct design of a manufacturing facility is required by the current GMP regulations on buildings and
facilities. The term qualification refers to the activities undertaken to demonstrate that utilities and
equipment are suitable for their intended use, they are completed before starting production at a
commercial scale. The activities include defining construction materials for utilities and equipment,
operating principles, and testing performance characteristics. Utilities and equipment are built and
installed in compliance with the design specifications. The function of the equipment is challenged to
the expected conditions during routine production including interventions, stoppage, and start-up. The
defined operating ranges should be shown as capable of being used.

17
The project plan for qualification should include timing of qualification activities, studies/tests to be
performed, appropriate criteria to evaluate outcomes, responsibilities of relevant departments,
procedures for documenting and approving the qualification and requirements for the evaluation of
changes. The QC unit must review and approve the qualification plan and report.
The PPQ stage confirms the design stage, it happens after the facility, utilities and equipment are
qualified. The personnel are trained to execute the commercial manufacturing process as designed and
to be aware of the control procedures to produce commercial batches. Before the commercial
distribution of the drug product, data regarding all relevant studies such as designed experiments and
laboratory/pilot/commercial batches are evaluated to establish the manufacturing conditions in the PPQ.
Experience gained with similar products and processes can also be helpful. It is advised that PPQ
documentation include description on how to address deviations from expected conditions and handling
of nonconforming data.
The PPQ has a higher level of sampling, additional testing, and greater examination of process
performance than typical routine commercial production in order to confirm uniform product quality
throughout the batch and to establish frequency of sampling and monitoring for the product and process.
In case the process uses PAT, the approach is slightly different. The design and process qualification
stages will have to focus on the measurement system and control loop of the critical defined attributes,
however the scientific basis is the same: the process will have to consistently deliver quality products.
A PPQ protocol (denominated PV protocol in Hikma) has to be written specifying the manufacturing
conditions. It should include operating parameters, controls, processing limits, samples to be collected,
tests to be performed and acceptance criteria. The sampling plan includes sampling points, frequency
of sampling for each unit operation or attribute and number of samples (should be adequate to provide
sufficient statistical confidence of quality within and between batches). The PPQ protocol should also
include information about the design of the facilities, the qualification of utilities and equipment,
personnel training, verified components, verified containers/closures and the adopted validated
analytical methods. The protocol is reviewed and approved by the Quality Unit (QU).
The execution of the PPQ protocol involves manufacturing the product as described in the document,
under normal conditions (of environment and materials for example) by the personnel routinely expected
to perform each step of each unit operation in the process.
After performing the protocol, a report is written with a discussion of all aspects. The data is presented
and analysed, additional observations are mentioned such as deviations or strange test results and
correspondent corrective actions/changes that should be made to procedures or controls. The report
presents a conclusion specifying if the process met the conditions established and whether the process
is considered to be in a state of control. In case it is not, it should be mentioned what can be done for
improvements with a justification for the approval of the process. The report is reviewed and approved
by the relevant departments and QU. (FDA 2011)

18
Continued process verification
The objective of this stage is to guarantee that the process remains in a state of control - the validated
state - during commercial manufacture. Good process design and development should anticipate
sources of variability and establish appropriate detection, control and mitigation strategies.
Nevertheless, a process is likely to encounter sources of variation that were not previously detected or
to which the process was not previously exposed.
Collecting data and performing statistical trend analysis can be taken in order to verify that the quality
attributes are being appropriately controlled throughout the process and to apply corrective actions in
case problems are detected. Continued monitoring of process parameters and quality attributes during
the process qualification stage is essential until sufficient data is available to generate significant
variability estimates and basis for establishing frequency of routine sampling and monitoring for the
process.
It is also important to be aware of variability through defect complaints, out-of-specification findings,
process deviation reports, batch records, incoming raw material records, and adverse event reports.
Production line operators and QU staff should be encouraged to provide feedback on process
performance. The QU ought to meet periodically with production staff to evaluate data, discuss possible
trends or undesirable process variation, and coordinate any correction or follow-up actions by
production.
The data gathered during this stage can help improve and optimize the process/product, such as the
operating conditions (ranges and set-points), process controls, component, or in-process material
characteristics. When changes are made, a document describing the changed plan must be written with
a well justified rationale for the change, an implementation plan, and QU approval. Depending on how
the proposed change might affect product quality, additional process design and process qualification
activities might be necessary.
It is equally essential to guarantee maintenance of the facility, utilities, and equipment to ensure that the
process remains in control. (FDA 2011)
2.2.7. Qualification stages
Validation and qualification are components of the same concept. The term qualification is normally used
for equipment, utilities and systems, and validation for processes. In this sense, qualification is part of
validation.
All SOPs for operation, maintenance and calibration should be prepared during qualification. Training
should be provided to operators and training records should be maintained. There are four stages of
qualification. (WHO 2006)

19
Design Qualification (DQ)
The first stage of qualification is the DQ which provides documented evidence that the design
specifications were met. (Sharma 2013)
Installation Qualification (IQ)
On this stage evidence must be documented proving that the installation was complete and satisfactory.
The purchase specifications, drawings, manuals, spare parts lists and vendor details should be verified
during IQ. Control and measuring devices are calibrated. (Sharma 2013)
Operational Qualification (OQ)
OQ provides documented evidence that utilities, systems or equipment and all its components operate
in accordance with operational specifications. Tests should be designed to demonstrate satisfactory
operation over the normal operating range as well as at the limits of its operating conditions (including
worst case conditions). Operation controls, alarms, switches, displays and other operational
components should be tested. (Sharma 2013)
Performance Qualification (PQ)
PQ is the final step in qualification processes for equipment, this step involves verifying and documenting
that the equipment is working reproducibly within a specified working range. Rather than testing each
instrument individually, they are all tested together as part of a partial or overall process. (Sharma 2013)
2.2.8. Validation team and responsibilities
The validation team comprises several departments which work together at different stages. Table 2
describes the responsibilities of the authority in each department that actively takes part in the validation
of the process (the department names were actualized to the Hikma denomination).

20
Table 2 – Responsibilities of the authorities of each department (Keyur 2014)
Department Designation Responsibility
Technical
services Executive/Officer
To coordinate the entire validation process by scheduling
meetings and discussions with production, AR, and QA.
Preparation of validation protocol, master formula record,
monitoring the process, analysing data and test results. To
review the validation documents. Preparing the final report.
QA Officer
To coordinate the validation process by scheduling meetings
and discussions with the team. Monitoring the process,
analysing data and test results. To review validation
documents.
Production Officer To participate in performing the validation steps during
manufacturing processes. To assist in collection of data.
AR Officer To test and report the results. To review validation documents.
Production General manager To approve the PV protocol and report. To review of validation
documents. To approve the process.
2.2.9. Documentation
Qualification and validation should be done according to written procedures. The documents include the
SOPs, specifications, plans, protocols, reports, risk assessment outcomes, process flow charts,
operator manuals, training records, calibration procedures and records, sampling plans, testing plans
and methods, statistical methods and results, history of qualification or validation and the plan for
ensuring the maintenance of a validation status.
Data from validation should be available for all products to demonstrate the effectiveness of the process.
It should be held at the manufacturing location and accessible for verification by concerned authorities.
(Nandhakumar 2011)
Validation Master Plan (VMP)
The VMP is one of the key documents in the current GMP regulated pharmaceutical industry. It is a
summary document, brief concise and clear. The VMP should not repeat information documented
elsewhere but has a duty to refer to existing documents such as policy documents, SOPs, validation
protocols and reports.

21
VMP gives an overview of the entire validation operation, its organizational structure, content and
planning. It also provides a written program for achieving and maintaining a qualified facility with
validated processes. All validation/qualification activities related to critical technical operations relevant
to product and process controls within a company are included. (Saudi Food & Drug Authority 2010)
The VMP should start with an introduction describing the validation policy, scope, location and schedule.
The document includes information about the product or products to be validated, process description,
critical steps, microbiological monitoring, cleaning validation approach and acceptance criteria. The
building and plant layout of the facility is included together with information regarding construction
materials. The equipment used is described and calibration/maintenance operations too. Utilities such
as heating, ventilation and air-conditioning (HVAC), water, clean steam, compressed air, gases and
vacuum system are installed in the facility and described in the VMP. The responsibilities of the trained
personnel should be well defined. Suppliers inspection, internal audits, time plans of each validation
project and sub-project, re-validation activities, actual status and future planning are also included in the
document. (Nandhakumar 2011)
The VMP should be reviewed at regular intervals and kept up to date according to current GMP. (WHO
2016)
Validation report
A report is written regarding the validation performed. Reports should reflect the protocols and
procedures followed and include at least the title and objective of the study, make reference to the
protocol and to the appropriate risk assessment, details of materials, equipment, programmes and
cycles used, procedures and test methods. Results have to be recorded and in compliance with good
data and record management practices, they are reviewed, analysed and compared against the justified
predetermined acceptance criteria, interpreted and statistically analysed where appropriate. The results
must meet the acceptance criteria. Deviations, out-of-specification and out-of-limit results are
documented and investigated according to appropriate procedures. If the deviations are accepted, they
have to be justified. When necessary, further studies should be performed.
The conclusion of the report states whether the outcome of the qualification or validation was considered
successful, and should make recommendations for future monitoring and define alerts and action limits
in necessary cases.
The departments responsible for the qualification and validation approve the report, production manager
approves the report after the final review. The criteria for approval should be in accordance to the quality
assurance system of the company. Any deviations found during the validation process are managed and
documented. Corrective actions should be considered. (WHO 2016)
The report has the following structure: title and objective of study, reference to protocol, details of
material, equipment, conditions used, details of procedures, information regarding analytical methods
and results. (WHO 1992)

22

23
3. Technology transfer between Hikma
R&D and Hikma PT
The first step of a technology transfer between Hikma’s R&D site and the manufacturing site of Hikma
pharmaceuticals PT is to select the product. A R&D plan is made annually by the management team
specifying which products will be developed each year. Later on, R&D in US or Jordan and technical
services from Portugal coordinate the dates for the products defined in the plan, together with the project
manager at each site, who decide when each step per product has to be completed.
For the API selection it is essential to analyse the Drug Master Files (DMF) of each manufacturer. If a
DMF is not available, a technical package should be requested with information about the synthetic
route, stability data, specifications, justification of specifications, analytical procedures, impurities profile,
origin of each impurity, certificate of analysis and a quality commitment if required.
When choosing the manufacturer, it is important to make sure that the API is being produced with
consistent quality and in a GMP facility. A material sample from the supplier should be requested to
evaluate the API quality, stability and degradation profile. In case the API is to be used as sterile, a sterile
representative sample ought to be provided to test for sterility and bacterial endotoxin. It should be
confirmed that the packaging meets current plant requirements, if it is going to be used inside the sterile
core. In case it is different in any way, a handling SOP modification is required, new sanitization study
and monitoring. The impurities have to be evaluated so it is important that they are available for analytical
activities. However, the API manufacturer should provide a statement for residual solvents, genotoxic
impurities and elemental impurities.
After selecting the API supplier, which previously has been audited by corporate Hikma compliance
group, it is necessary to send to Hikma PT the most recent DMF/technical package of the API and the
CoA (Certificate of Analysis) which is in compliance with the EU or US guidelines. The price of the API
has to be mentioned for R&D purposes. The necessary quantities for development have to be ordered,
and later on for stability/submission batches.
The TTR is a complete document sent by R&D site at Jordan or USA. It provides a description about
the product that will be submitted, including the description of the analytical studies performed with its
results and the final conclusion: an ideal manufacturing process defined after all the studies. This
document also describes a risk assessment and presents the results, the critical parameters are
mentioned as are the strategies of controlling them.
The PV protocol is developed by technical services Portugal and is based on the TTR. It starts with a
brief description of the product including the strength, the presentation, and where it was developed. It
refers also to the purpose of the protocol: how to produce the necessary batches for validation.

24
Regarding the manufacturing process designed by R&D, several adjustments are made and described
in the protocol, in accordance to the available equipment and means at Hikma PT site. In this document,
each activity is explained in detail as are the sampling requirements needed to complete the evaluation.
A sampling log covering the full testing is included in the protocol appendices. The parameters that are
verified or established during the study, such as specific processing time limits, will be added to the
Master Batch Record (MBR) following the conclusion of the PV. (Marques 2015)
3.1. Analytical method development
The Analytical Research (AR) department in Hikma PT evaluates the validation of the analytical methods
developed in R&D for the API and excipients. United States Pharmacopeia (USP) and European
Pharmacopeia (EP) are taken into account in the transfer. All the methods required for in-process and
finished product testing should be developed and validated/co-validated before the manufacture of the
product. The validated analytical methods are used during the testing of the submission batches and if
everything works as expected, they will continue to be used after the product is approved by the
authorities for commercialization.
The R&D team has to provide a list of the evaluated raw-materials to the technical services department
so that they can be ordered in Portugal by the logistic team.
As part of the development work, Hikma R&D has to provide technical services with information required
by validation department to evaluate if the new product fits within the existing cleaning validation matrix.
A cleaning method should be developed and validated taken into consideration the cleaning limit
established by the manufacturing site. (Marques 2015)
3.2. Product development
After developing a new product in the R&D site, a TTR is written as mentioned. This document includes
information regarding the following aspects described in Table 3.

25
Table 3 – Information available in the TTR
Raw Materials and
API Product Formulation
Manufacturing
process Compounding
Classification of raw-
material and physical
properties of the API
Intellectual property
assessment Equipment description
Product formula and
calculations for the
quantities to weigh
Analysis and
specifications
Excipient supplier,
analysis and
specification
Physiochemical
compatibility studies
with contact surfaces
Sequence of material
addition
Degradation study
towards pH, light,
humidity and oxygen
Free inorganic ions
that are part of the
drug molecule
Results for light,
sensitivity, viscosity
and conductivity
Process temperature
and mixing
time/ranges
Toxicity evaluation and
impurity profile studies Potential degradants
Maximum limit for
dissolved oxygen on
the bulk solution
Dissolution and
appearance of the
product per step
Retest times and shelf-
life Comparison between
Hikma product and
other generics on the
market
Maximum holding
times
Equations, mass
balance, pH ranges,
solubility with
temperature
Material Safety Data
Sheet
Terminal sterilization
evaluation
Sensitivity of product
to atmospheric gases
3.3. Submission batches manufacture
Before submitting a batch, technical services Portugal has access to API DMF, audit report and letter of
access. A list of the originator and all the generics on the market, including strengths, presentations and
container closure is also necessary. The technology transfer or development report has to be sent to
tech-services together with the analytical methods transfer for the AR department. If applicable the
microbiology analytical methods are also included.
Hikma PT is responsible for defining the batch size and perform the scale-up of the batches for
validation. It should follow the TTR or Process Development Report (PDR) sent by R&D, in a way that

26
it mimics as much as possible the industrial scale, using the same equipment when possible. The PV
protocol is prepared by technical services and the submission MBRs regarding the production of the
batches too. The PV report includes a side by side evaluation between submitted batch scale and
proposed batch scale.
Before manufacturing the submission batch or batches the analytical methods validation for the new
product have to be completed by the AR department. All conditions used at the production line where
the validation takes place have to be conform. The containers, closures, filters and equipment have to
be sterilized and in cases where the processes are aseptic a media fill validation is necessary. If
applicable terminal sterilization validation for drug product has to be done too.
After manufacturing the submission batches they are placed in stability for further studies, the product
is then submitted to the regulatory authorities. After their evaluation, it happens that deficiency letters
are sent to improve the product (usually in terms of analytical methods adjustments or process
manufacturing). If no adversities are found, eventually, the product can be manufactured for the first
time in accordance to the commercial scale-up, and approved for routine commercial manufacturing.
(Marques 2015)
3.4. Industrial facility and production lines, line 5
operation
Hikma is a multinational pharmaceutical group with a Jordan background, it has a dimension at a global
scale and is specialized in production and commercialization of branded and non-branded generic and
in-licensed pharmaceutical products for exclusive hospital use. Hikma Pharmaceuticals operations span
twenty-nine manufacturing plants in eleven countries: US, Portugal, Italy, Jordan, Saudi Arabia, Algeria,
Germany, Egypt, Morocco, Tunisia and Sudan.
Portugal is the centre of production in the segment of injectables within the group. The industry is located
in Sintra and is divided in two separate industries, one of them is composed by eight production lines
for injectable manufacturing and the other has three lines for the production of antibiotics in powder
form. At the moment, a new industry is in construction specifically for the production of oncologic drugs.
(Hikma website 2017)
Table 4 resumes the type of products manufactured in each line.

27
Table 4 – Hikma’s facilities, production lines, product presentations and type of products
Facilities Production lines Product presentation Type of products
Hikma 1
1 Lyophilized
Anti-infectives
Cardiovascular and diabetes
Controlled substances
Gastro-intestinal
Central nervous system
Respiratory
Antibiotics
2 Vials
3 Ampoules
4 Bags
5 Vials
7 Bags
9 Lyophilized
10 Lyophilized
Hikma 2
1
Powders Antibiotics 2
3
New Hikma To be defined To be defined Oncological
The two products which will be presented as examples of technology transfers and PVs were produced
on line 5. This line is specific for the production of solutions in vials to be used for injections (hospital
use).
Line 5 usually uses a 1000L and 2000L stainless steel tank for the compounding. It happens a lot that
when the mixture has finished the solution needs to be put on hold because another product has to be
compounded, in these situations the second tank is used as a transference tank if applicable. However,
for the two examples which will be presented, since they were submission batches, smaller tanks were
used.
The API and the excipients are introduced in the compounding vessel together with the WFI which
occupies the major area. A propeller is installed in the tank and assures the complete homogenization
of the solution.

28
There are four machines which work simultaneously when the bulk solution leaves the tank: the vials
washing machine, depyrogenation tunnel, filling machine and capper machine.
The tanks have an outlet where the tubbing fits, the tube carries the bulk solution until the filling machine.
At this point in the manufacturing process the formulated drug product enters the Class A clean room. It
remains under these conditions until the product is filled into the vails and stoppered.
As soon as the bulk solution enters de filling machine they pass by filters which sterilize the product.
There are four primary types of filters used in the parenteral and biopharmaceutical industry, the type of
filter chosen depends on the type of material to be removed. The types of filters include the following:
- Clarifying filters – for large particles;
- Microfilters – suitable for bacteria and yeasts (used for injectable drug products);
- Ultrafilters – used to retain viruses;
- Nanofilters – for small organic compounds and ions.
The injectable drug industry uses microfilters to remove particles in the 0.1 to 10 µm size range from
the formulated drug product. Many types of membranes are available in this pore size range for different
types of formulations, including water based formulations (hydrophilic) and solvent based formulations
(hydrophobic). The development site conducts studies for filter compatibility in order to determine the
correct filter and filter surface area for the particular product. For most parenteral products, a hydrophilic
filter is used, it can be made of: cellulose acetate, cellulose nitrate, regenerated cellulose, modified
regenerated cellulose, polyamide (nylon), polycarbonate, polyethersulfone, polysulfone or
polyvinylidene difluoride (PVDF).
The filters are available as either flat disks or as cartridge filters, which significantly increase the filter
surface area when extremely large volumes need to be filtered. To ensure that the filter membrane is
completely intact with no holes, integrity testing is performed both before and after filtering the product.
This is accomplished through a process known as bubble point testing, a non-destructive integrity test
measuring diffusive flow or water intrusion over the filter membrane. As soon as the filter is chosen and
installed, the solution can be sterilized. If a product is a suspension or large particle-sized emulsion it
cannot be sterile filtered and has to be aseptically formulated, all components are pre-sterilized
individually and then brought together in a sterile environment.
On line 5 the filters which are installed in the filling machine usually have a pore size of 0.2 µm. In the
cases when products need a pre-filter, the size used is normally 1.2 µm. Once the product has been
filtered into a sterile filling container and the filter passes the post fill integrity test, it is ready to fill into
its primary container which was previously washed and pre-sterilized in the depyrogenation tunnel.
Sterile tubing is placed into the tank with the sterile solution, which leads first to pumps and then to filling
needles. The needles descend into the vials and slowly rise as the required amount of product is
dispensed. This method of filling minimizes splashing of product on the sides of the container.
The type of pump used depends on the type of product being filled: piston or peristaltic are used for
either liquids or gases, gravity is used for solids and liquids.

29
The product is generally filled into glass vials using one of three main methods:
- Volumetric – a fixed volume is added;
- Time/pressure – a fixed pressure is administered over a certain amount of time;
- Net weight – each container is weighed while being filled.
For the examples which will be presented the types of pumps chosen were piston and the products were
filled using the volumetric method.
Once the vials have been filled, they travel down the filling line to have pre-sterilized stoppers inserted.
Line 5 has an auto-clave which sterilizes equipment parts and the rubber stoppers. After the stoppering,
the vials leave the sterile room (class A) with laminar flux, and are led to the clean area to be capsulated
in the capper machine.
Caps are comprised of a plastic flip-off and an aluminium skirt, they are used to secure the stopper in
the neck of the vial to prevent the stopper from coming out either over time or during handling. The caps
are loosely placed on the top of each vial, then travel to the crimping station where rotating blades crimp
the bottom of the aluminium skirt around the lip on the neck of the vial, producing a tight fit that locks
the stopper into the neck of the vial. At the time of use the flip-off is removed, exposing the top of the
stopper which is pierced with a needle to remove the content inside the vial. After capsulation, the vials
are ready for inspection and final packaging.

30
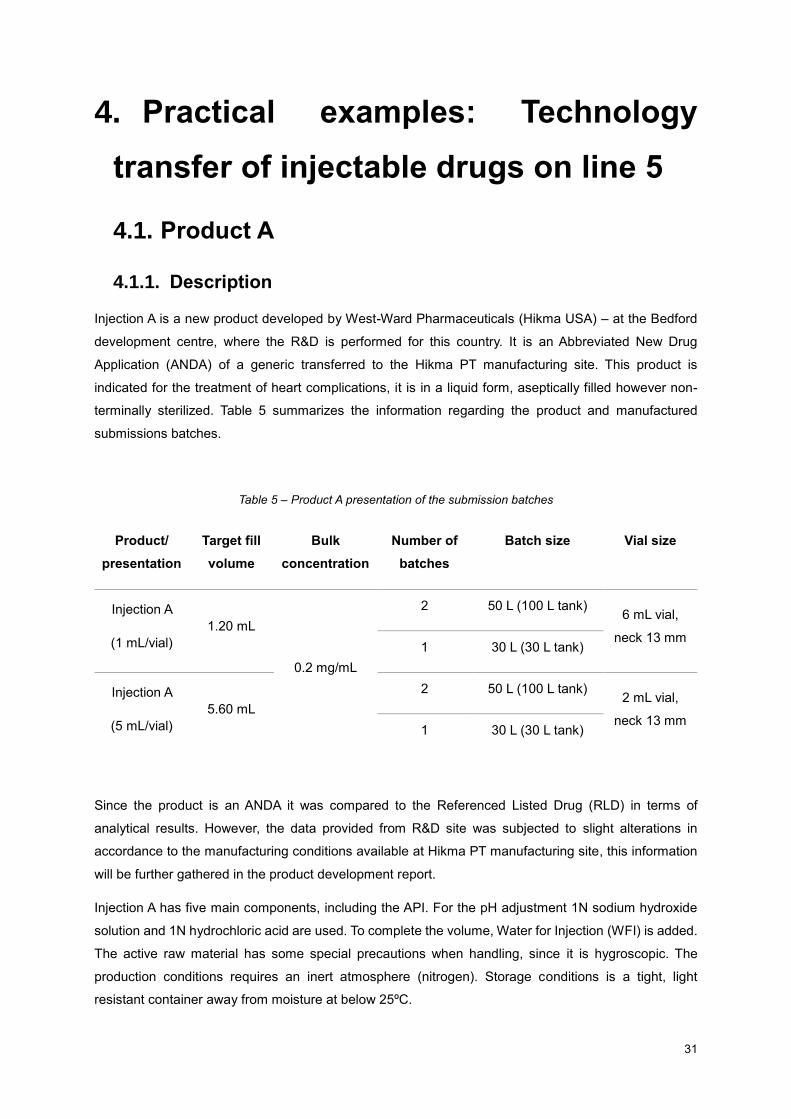
31
4. Practical examples: Technology
transfer of injectable drugs on line 5
4.1. Product A
4.1.1. Description
Injection A is a new product developed by West-Ward Pharmaceuticals (Hikma USA) – at the Bedford
development centre, where the R&D is performed for this country. It is an Abbreviated New Drug
Application (ANDA) of a generic transferred to the Hikma PT manufacturing site. This product is
indicated for the treatment of heart complications, it is in a liquid form, aseptically filled however non-
terminally sterilized. Table 5 summarizes the information regarding the product and manufactured
submissions batches.
Table 5 – Product A presentation of the submission batches
Product/
presentation
Target fill
volume
Bulk
concentration
Number of
batches
Batch size Vial size
Injection A
(1 mL/vial)
1.20 mL
0.2 mg/mL
2 50 L (100 L tank) 6 mL vial,
neck 13 mm 1 30 L (30 L tank)
Injection A
(5 mL/vial)
5.60 mL
2 50 L (100 L tank) 2 mL vial,
neck 13 mm 1 30 L (30 L tank)
Since the product is an ANDA it was compared to the Referenced Listed Drug (RLD) in terms of
analytical results. However, the data provided from R&D site was subjected to slight alterations in
accordance to the manufacturing conditions available at Hikma PT manufacturing site, this information
will be further gathered in the product development report.
Injection A has five main components, including the API. For the pH adjustment 1N sodium hydroxide
solution and 1N hydrochloric acid are used. To complete the volume, Water for Injection (WFI) is added.
The active raw material has some special precautions when handling, since it is hygroscopic. The
production conditions requires an inert atmosphere (nitrogen). Storage conditions is a tight, light
resistant container away from moisture at below 25ºC.
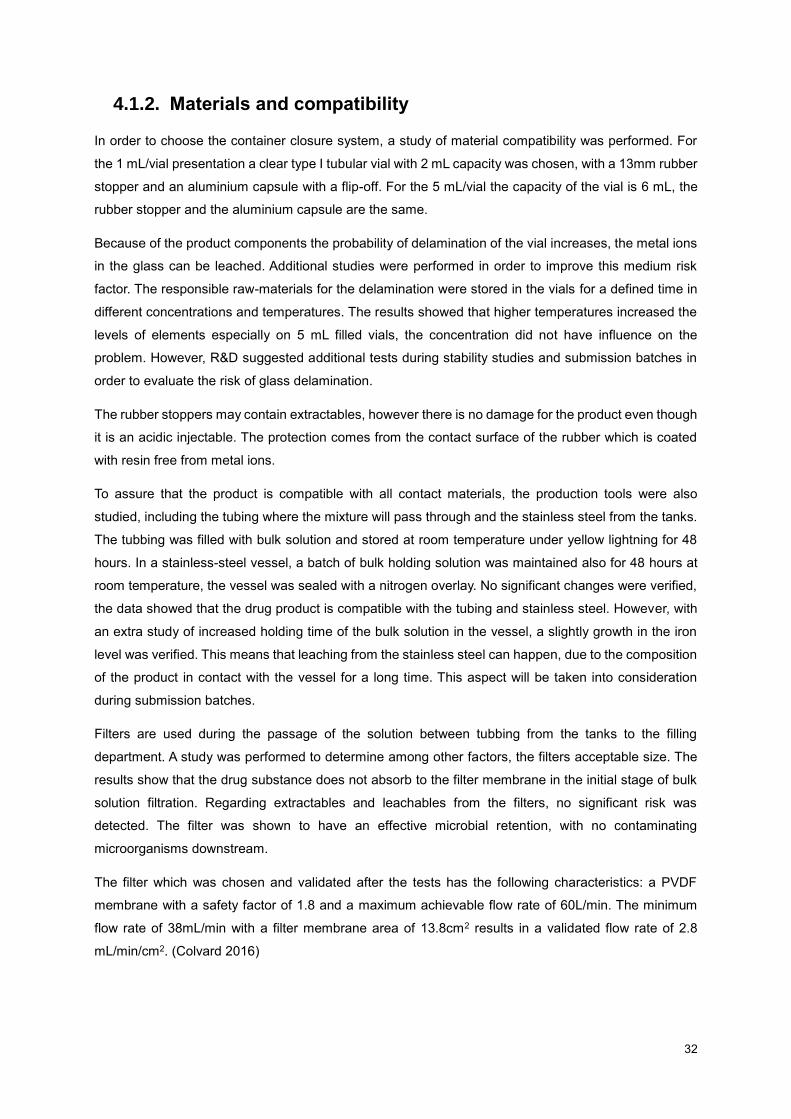
32
4.1.2. Materials and compatibility
In order to choose the container closure system, a study of material compatibility was performed. For
the 1 mL/vial presentation a clear type I tubular vial with 2 mL capacity was chosen, with a 13mm rubber
stopper and an aluminium capsule with a flip-off. For the 5 mL/vial the capacity of the vial is 6 mL, the
rubber stopper and the aluminium capsule are the same.
Because of the product components the probability of delamination of the vial increases, the metal ions
in the glass can be leached. Additional studies were performed in order to improve this medium risk
factor. The responsible raw-materials for the delamination were stored in the vials for a defined time in
different concentrations and temperatures. The results showed that higher temperatures increased the
levels of elements especially on 5 mL filled vials, the concentration did not have influence on the
problem. However, R&D suggested additional tests during stability studies and submission batches in
order to evaluate the risk of glass delamination.
The rubber stoppers may contain extractables, however there is no damage for the product even though
it is an acidic injectable. The protection comes from the contact surface of the rubber which is coated
with resin free from metal ions.
To assure that the product is compatible with all contact materials, the production tools were also
studied, including the tubing where the mixture will pass through and the stainless steel from the tanks.
The tubbing was filled with bulk solution and stored at room temperature under yellow lightning for 48
hours. In a stainless-steel vessel, a batch of bulk holding solution was maintained also for 48 hours at
room temperature, the vessel was sealed with a nitrogen overlay. No significant changes were verified,
the data showed that the drug product is compatible with the tubing and stainless steel. However, with
an extra study of increased holding time of the bulk solution in the vessel, a slightly growth in the iron
level was verified. This means that leaching from the stainless steel can happen, due to the composition
of the product in contact with the vessel for a long time. This aspect will be taken into consideration
during submission batches.
Filters are used during the passage of the solution between tubbing from the tanks to the filling
department. A study was performed to determine among other factors, the filters acceptable size. The
results show that the drug substance does not absorb to the filter membrane in the initial stage of bulk
solution filtration. Regarding extractables and leachables from the filters, no significant risk was
detected. The filter was shown to have an effective microbial retention, with no contaminating
microorganisms downstream.
The filter which was chosen and validated after the tests has the following characteristics: a PVDF
membrane with a safety factor of 1.8 and a maximum achievable flow rate of 60L/min. The minimum
flow rate of 38mL/min with a filter membrane area of 13.8cm2 results in a validated flow rate of 2.8
mL/min/cm2. (Colvard 2016)

33
4.1.3. Product and process precautions
This product needs some precautions with light, compounding and filling must be performed under
yellow light. The containers used must be opaque. However, studies conducted under white light proved
that it is acceptable and has no harm on the product for a limit of seven days. Regarding oxygen, nitrogen
protection is required to protect the product from its high sensitivity to oxygen. The acceptable
temperature range is between 20°C and 25°C.
The ideal pH range (3.5-4.0) was chosen in accordance to the results of the tests performed, certain pH
values increased the impurities. The increase in oxygen in the vials also intensified the pH value, which
meant that the impurities also grew. It was noticed that in-process solution changes to pink as impurities
increase, so a yellowish colour is the acceptable if it is within the limits.
To determine if the product should be terminally sterilized or aseptically filled a heat sterilization was
performed. When terminally sterilized the assay results were critically impacted, which means that the
product is affected by excessive heat from sterilization.
In Table 6 it is possible to find a resume of the most important process conditions for product A.
Table 6 – Process conditions for product A
Under nitrogen overlaying Yes (during compounding and filling)
Tubing to be used Teflon
Filling pumps to be used Piston
Terminal Sterilization No
Use pre-filter No
Maximum bulk holding time 48h
Maximum contact time of filter with product 48h
Product sensitive to light Yes (light protection during compounding and
filling activities by using yellow lights)
Product sensitive to oxygen Yes
Product sensitive to heat sources No
Finished product storage conditions Store at 20ºC - 25ºC

34
4.1.4. Manufacturing process
The production process for product A is described on Figure 1. The mixing times required for dissolution
were defined as ten minutes for the API and excipients, and five minutes for the acid/base addition to
adjust the pH. The packaging includes a pack of twenty-five vials with one insert for the 1 mL/vial
presentation and ten vials one insert for the 5 mL/vial presentation.
Figure 1 – Flow chart of the manufacturing process of product A
4.1.5. Risk assessment
The batches manufactured for validation used qualified facilities, systems and equipment, and were
tested using validated analytical methods. All raw-materials and primary package materials were
analysed and released before production. On line 5, the manufacturing process of aseptically filled
products was evaluated through media fill. These measures reduce the probability of hazards. (Marques
2017)
The critical parameters identified as potential process failure causes were evaluated based on risk
management tools – Failure Mode Effect Analysis (FMEA). Detailed description of CPPs, cause of the
failure, potential effect on the system, severity, probability and control is presented in Annex A – Risk
management tools (FMEA) for product A. Severity and occurrence/probability are categorized in level 1
Add initial WFI 60% of final
weight
Sparge WFI with nitrogen
Begin mixing and maintain temperature
Discontinue purge. Add excipient 1
Rinse with WFI, reinstate purge and mix
Discontinue purge. Add excipient 2
Rinse with WFI, reinstate purge and mix
Add excipient 3 and WFI.
Add to vessel
Rinse solution container with WFI and mix
Prepare a solution with API and WFI. Add to vessel
Rinse solution container with WFI and mix
Discontinue purge. Add excipient 4
Rinse with WFI, reinstate purge and mix
Check and adjust pH with 1N NaOH or
1N HCl
Complete solution with WFI and mix
Check pH
Place a nitrogen
headspace on bulk solution
Filter
Fill solution into vials,
stopper and seal

35
(low), level 2 (medium), level 3 (high). Detection follows the opposite scale: level 3 (low), level 2
(medium), level 1 (high). Severity x occurrence x detection is categorized as: critical – 12, 18 and 27;
medium – 6, 8 and 9; low – 1, 2, 3 and 4.
It was concluded that the calculations for API and excipients are very critical for the process having a
high severity risk. A mistake can cause low or high assay and result in batch failure. As a control, the
calculations are double verified. Other failures that can also result in higher or lower concentration
results include errors in the final adjustment of the solution with WFI and incomplete dissolution of API
or excipients. Controls can consist of pre-dissolution before addition of the materials to the preparation
tank to assure total homogenization and calibration of the balances before compounding to guarantee
that the final volume is correct.
4.1.6. Process evaluation activities and results
In order to validate the process for injection A at Hikma Portugal site, three submission batches were
produced for the 1 mL/vial presentation and other three batches were manufactured for the 5 mL/vial
presentation. Different activities were performed during the manufacturing of these batches, mainly in
the important steps of the process, to evaluate quality consistency and so that it could be possible to
adjust certain parameters of the process, for example mixing times. Annex B – Sampling scheme for
product A includes the samples necessary to be taken at the critical process steps to perform the
analytical studies.
Effects of mixing time and speed on the quality of the bulk solution
The dissolution/homogenization of the bulk solution should be complete and uniform. The range of
mixing speeds and agitation times to be used were evaluated during compounding to assure that
complete dissolution occurs under all approved compounding conditions. The values were chosen in
accordance to experience, and were adjusted during the manufacture to achieve proper dissolution. The
speeds were defined as 200-300 rpm for the 30 L batches and 300-400 rpm for the 50 L batches.
Samples were collected from the top and bottom of the compounding vessel of all batches for
physiochemical analysis to ensure uniformity of the compounded solution, microbiological analysis were
also performed. The results were conform.
Effects of elapsed compounding (bulk holding time)
The bulk solution for the volume of 30L or 50L is manufactured in a stainless-steel compounding tank.
However, it might be necessary to transfer the bulk into another vessel for scheduling production needs.
For this reason, an evaluation of the maximum bulk holding time in a temporary tank is needed.

36
Taken into consideration that all batches have the same bulk concentration, the product is expected to
behave similarly during holding times studies. Therefore, the data generated from the evaluation of one
submission batch was considered applicable to both presentations.
The maximum bulk holding time was studied in a sample of bulk solution left in the preparation tank up
to 48 hours at room temperature. Samples were taken from the bottom of the tank following an elapsed
time period of 24 hours and 48 hours from the end of compounding for physiochemical and
microbiological testing. Results were compared with time zero (0 hours) bulk results. All samples met
in-process physiochemical and microbiological specifications which means that the product can be left
during 48 hours on hold inside the tank.
Effects of initial set up (dead volume) and line stoppages
The purpose of the “dead volume” study (one batch of each presentation tested) is to determine the
minimum volume of solution necessary to be discarded before having manufactured product in-
specification to be kept. The first units are discarded as part of initial line set-up. The procedure includes
priming the pumps and purging the system. The first and last vials filled from a 1st stage were collected
and tested. Since they were not within specifications or aligned with time zero bulk results, which
happens frequently, a 2nd and 3rd stage was performed in the same way. At the 3rd stage the results were
conform.
The line stoppage test is performed on one batch of each presentation, in order to establish acceptable
duration of stoppages, and to determine the minimum quantity of vials to be discarded before restarting
the filling. After two hours of line stoppage, 300mL were filled into vials, the first and last vials of three
stages were collected. Physicochemical tests were performed. It was only necessary to pass to stage 2
which means that the quantity to be discarded before restarting the filling corresponds to the volume
used to fill the vials from the first two stages.
Filling machine speed
To define the ideal speed for the filling machine the maximum and minimum speed was tested during
the filling of the vials. The analysis performed for the control was volume variation of the vials.
No problems were detected. Table 7 shows the requirements for the volumes in the vials of the two
presentations for this product.

37
Table 7 – Volume specifications for filling of product A
Presentation
Individual minimum
(mL)
Average (mL) Individual maximum
(mL)
Minimum
action
Minimum
alert
Minimum Target Maximum Maximum
action
Maximum
alert
1 mL/vial 1.10 1.10 1.15 1.20 1.25 1.30 1.35
5 mL/vial 5.30 5.45 5.50 5.60 5.70 5.75 5.80
Effects of filtration and filling on the quality of the compounded solution
Filled vials after capping were collected for physicochemical analysis from the beginning, middle and
end of the filling process for all batches. Beginning of the filling is considered the point in which the
filtered bulk is no longer discarded and line flush and set up activities have been completed. At every
hour, visible particles and oxygen headspace were checked.
There were no detected physicochemical or particle deviations, however oxygen Out Of Specification
(OOS) were confirmed.
Vial inspection
After capping the vials, they were all inspected visually to detect defects and particles, using a particle
automatic inspection machine. Although the product is sensitive to light, white light is acceptable for the
inspection. All results were in-specification.
4.1.7. Problems during submission batches
As mentioned, injection A is an oxygen sensitive product filled with nitrogen flushing in the vials
headspace. The oxygen headspace is controlled hourly during the manufacturing. The limit is Not More
Than (NMT) 2.5% for 1 mL/vial presentation and NMT 5.0% for 5 mL/vial presentation as per relevant
MBRs and SOPs.
Three batches for the 5 mL/vial presentation were produced with oxygen values found to be very above
the limit of 5.0%. As per the TTR sent by West-Ward Pharmaceuticals, oxygen headspace was also
challenged during R&D stages.
In order to determine the root cause and to investigate the deviation detected, the root cause analysis
methodology was followed as shown on Figure 2.

38
Figure 2 – Root cause map for oxygen headspace OOS for 5 mL/vial presentation batch
The container closure 6 mL is a worst case for the oxygen headspace measurement in the lighthouse
system due to its limited free space between the neck of the vials and the solution within the vial. The
difficulty faced during the oxygen headspace analysis was considered the main cause for the results
obtained. Moreover, several oxygen headspace results were obtained at 0%, the technicians did not
recognize these values as abnormal since line 5 is known to be highly capable. A human error is
considered in this situation in addition to the inadequacy of the equipment towards the 6 mL vials. The
followed procedures and the filling machine capability were not considered to be involved with the
problem.
A decision was made to reject the batches since R&D stability data demonstrated that the product does
not support a higher oxygen headspace specification.
Another three batches were manufactured, this time for the 1 mL/vial presentation. During filling start-
up of the first two batches, vials with oxygen headspace out of the limits were obtained. Adjustments
were done to the needle holders/supports of the nitrogen flushing part and to the nitrogen flows to
improve the oxygen headspace levels until results were conforming. During in-process control vials with
oxygen headspace OOS were still found, consequently the batches were placed on retention. Figure 3
presents the root cause map for the deviated results.

39
Figure 3 - Root cause map for oxygen headspace OOS for 1 mL/vial presentation batch
After further investigation, using new stability data provided by the USA site, a worst-case oxygen
headspace of 3.5% might be considered acceptable in exceptional situations.
However, filling machine from line 5 is highly capable of achieving low oxygen headspace levels.
Qualification studies were conducted before and demonstrated a highly capable process for 2 ml vials.
For this reason, no problems were anticipated with the filling of injection A. The capability of the machine
is not considered the root cause.
It could be considered that the procedures were not clear and affected the system, however this
hypothesis was ruled out because all SOPs and MBR were followed correctly. There was only a slight
alteration on the nitrogen flow to a value out of the range specified in the MBR, nevertheless the
adjustment during filling start-up was done to meet the required oxygen headspace and was considered
to have no impact.
The most probable root cause is equipment related because one of the needle holder/support got broken
a month before the mentioned batches were produced. The holder was replaced by a new one, since
then it is probable that it has been misaligned.
After disassembling the nitrogen system and re-checking all supports one by one, the misalignment was
fixed and the 3rd batch of the campaign was filled without any observations and with consistent oxygen
headspace results.
The statistical analysis of the data generated demonstrated a highly capable process for an oxygen
headspace limit of NMT 3.5% - this new specification was applied. For the 1st and 2nd batch produced,
the trays where the low amount of outliers were found were rejected.

40
Following the completeness of the 1 mL/vial validation, three batches of the 5 mL/vial were
manufactured once again. A new lighthouse system was obtained and optimized for the reading of 6 mL
vials, with improved results and provided less analytical error. The implemented alterations were
successful. A slight problem was detected during production of one of the batches, the nitrogen flushing
part moved from its original fitting position, which had impact on some results. However, not significant.
As a conclusion, frequent maintenance and substitute of parts of the equipment must be made so that
problems as the mentioned do not happen.
4.2. Product B
4.2.1. Description
Injection B is an aseptically filled product for administration during heart surgeries, developed by
Bedford. The API of this product is an isolated protein from salmon. It has only one excipient (excipient
A) that adds to the API, sulfuric acid 0.1N and dibasic sodium phosphate 0.1N are used to adjust the
pH. WFI completes the quantity of the solution.
Table 8 summarizes the information regarding the product and manufactured submissions batches.
Table 8 – Product B presentation of the submission batches
Product/
presentation
Target fill
volume
Bulk
concentration
Number of
batches
Batch size Vial size
Injection B (5
mL/vial) 5.60 mL
10 mg/mL
1 50 L
(100 L tank)
6 mL vial,
neck 13 mm
Injection B (25
mL/vial) 26.30 mL 1
200 L
(200 L tank)
30 mL vial,
neck 20 mm
Injection B is an example of a product which is not “new”, it has been submitted in 2007 by Bedford to
the regulatory authorities, however it was not approved. A major deficiency letter related to the analytical
methods of the API and the final drug product was sent by FDA.
Bedford sent the amended application of the drug, to remove chemistry deficiencies as per the agencies
correspondence. As a response, FDA sent a minor deficiency letter in 2010 regarding some extra small
modifications.
When the characterization studies were conducted it was observed that the proposed ANDA drug
demonstrated foaming when shaken, greater than seen in the RLD. A slight foaming is expected since
the API is a peptide, however the observed foaming was considered unacceptable and undesired. The

41
cause was attributed to the manufacture of the drug substance (reliable). The biopharmaceutical
“reliable” agreed to reduce fatty acid constituents that were identified as the most likely source of
foaming in the formulated drug product. (Madieh 2015)
Bedford developed a TTR so that injection B could be transferred to Portugal manufacturing site,
however the analytical alterations solicited by FDA would have to be conducted in order to get the
product approved. AR department completed the required analytical validation tests and manufactured
the product for validation.
4.2.2. Product and process precautions
This product requires some precautions. Table 9 describes the most important process conditions. In
terms of temperature the API is stored between 2ºC and 8ºC, before opening the container it is
necessary to keep it at room temperature approximately one hour. The product is formulated between
21ºC-23ºC, however it is not necessary to maintain temperature control throughout filtration and filling.
The final drug product is stored between 20ºC to 25ºC.
Injection B is a non-cytotoxic, non-genotoxic product assigned with a hazard category of 3A. When
handling drug substance and product during formulation it is necessary to use a Personal Protective
Equipment (PPE) such as eye protection, gloves and a half mask cartridge respirator. (Madieh 2015)
Table 9 - Process conditions for product B
Under nitrogen overlaying No
Tubbing to be used Teflon
Use pre-filter No
Filter for product filtration Yes
Integrity test for the filter Bubble point > 3180 bar
Filling pumps to be used Piston
Terminal sterilization No
Maximum contact time of filter with product 16h
Product sensitive to: light, oxygen, heat No
Finished product storage conditions Store at 20ºC – 25ºC

42
4.2.3. Manufacturing process
One submission batch of each presentation was produced in Hikma Portugal on line 5 to validate the
process in the new manufacturing site. A 50L batch was manufactured to validate the 5 mL/vial
presentation and a 200L batch was manufactured to validate the 25 mL/vial presentation. Both with the
same bulk concentration (10mg/mL).
The manufacturing process includes the compounding of the bulk solution formula followed by filtration
through a 0.2 µm membrane filter. The filters are integrity tested before sterilization, before filtration and
after filling. The pre-sterilization integrity test is conducted with WFI, pre-filtration and post-filling are
conducted with drug product. Microbial retention, microbial viability, bubble point, filter compatibility and
filtration time duration were included in the filter validation by R&D site. Leachables and extractables
were validated at the manufacturing site.
The filtration is followed by aseptic filing into the respective vials (6 mL and 30 mL vials), stoppering,
capping and inspection. The packaging includes ten labelled vials and one insert per coded shelf carton
for the 5 mL/vial presentation and one labelled vial with one insert per coded unit carton for the 25
mL/vial presentation. Figure 4 presents a flow chart with each step of the process.
Figure 4 – Flow chart of the manufacturing process of product B
Add 80% WFI of the final weight of the vessel. Adjust to temperature
Add excipient A. Rinse weighing container with
WFI and add to the vessel. Mix
Add API. Rinse weighing container with WFI and add to the vessel. Mix
Check pH 6.3-6.7. If pH > 6.7 adjust with 0.1N
sulfuric acid solution, if pH < 6.3 adjust with
0.01N Sodium Phosphate Dibasic
Solution. Mix
Discontinue mixing, seal vessel and transfer to
filtration area
Filling of solution into vials, stopper and
cappsulate.

43
4.2.4. Risk assessment
The TTR includes the process map for the manufacture of injection B, with the material attributes,
process parameters and quality attributes for each unit operation listed in sequence of the manufacturing
process as shown on Figure 5. This information can be used to define the specific CQAs, CMAs and
CPPs.
The CPPs are verified during the manufacturing process to ensure the manufactured product
consistently meets the desired quality specifications. The critical product quality attributes are
considered critical since they can be impacted by the formulation and manufacturing process variables
– the CQAs include the product appearance, assay and degradation products, bacterial endotoxin level,
product sterility and sub-visible particulate matter. Identity, residual solvents and microbial limits are less
critical. These CQAs are ensured through a good pharmaceutical quality system and an effective control
strategy. (Marques 2016).
Figure 5 – Process map for process parameters, quality and material attributes for product B (Madieh 2015)
API
44
The parameters identified as potential process evaluation failures were evaluated based on risk
assessment: Annex C – Risk management tools (FMEA) for product B
The API calculations and weighing were considered critical stages of the process as well as the
dissolution of the bulk solution. Since the product is not light, heat or oxygen sensitive, the packaging
step has a low severity risk.
The side-by-side evaluation regarding the risk of technology transfer from Bedford to Hikma PT is
presented on Table 14 and Table 15, which can be found on Annex E - Risk assessment for the
technology transfer of product B from Bedford to Hikma. This analysis was essential for the transfer to
the new manufacturing conditions at the new site and for the scale-up which will be presented further
on.
4.2.5. Process evaluation activities and results
The following activities were performed during the production of both validation batches in order to define
certain process details and to guarantee that the manufacturing process is suitable for the production of
this injection at Hikma facilities. The sampling scheme for the manufacturing process of product B can
be found on Annex D – Sampling scheme for product B.
Effects of mixing time and speed on the quality of the compounded bulk
solution
The range of mixing speeds and processing durations to be used were evaluated during compounding
to assure that complete dissolution occurred. The speeds were defined as 400 rpm for the 5 mL/vial
presentation and 1200 rpm for the 25 mL/vial presentation.
After the final mixing step was complete, samples from the top and bottom of the compounding vessel
were taken for physiochemical analysis (in plastic sealed bottles) and only from the bottom for
microbiological analysis (in pyrogen free bottles). The samples met in-process physiochemical and
microbiological specifications per the in-process bulk analysis.
Effects of elapsed compounding (bulk holding time)
The bulk solution of one batch presentation was evaluated for the maximum bulk holding time in the
preparation tank. Since all batches have the same bulk concentration, the product is expected to behave
similarly during holding times studies.
At West-Ward Pharmaceuticals the validated maximum holding time from the end of WFI addition to the
tank until the end of filling is 48h at room temperature. For the validation in Hikma PT on line 5, samples
were taken from the bottom of the tank after 24 hours, 48 hours and 72 hours from the end of
compounding for physiochemical testing (in glass vials stoppered and capped or plastic bottles properly

45
sealed) and following 48 hours and 72 hours for microbiological testing (in sterile pyrogen free bottles).
All samples met in-process physiochemical and microbiological specifications. The maximum validated
time for the bulk solution to be left in the tank was defined as 72 hours.
Effects of initial set up (dead volume) and line stoppages
Samples were collected from each batch before starting the filling, after line set up, so that line
adsorption effect could be evaluated.
The objective of the dead volume sampling and correspondent tests was to determine the quantity of
volume to be discarded in order to meet specifications, as explained also for injection A. The system
was purged with 1000 mL following the sampling of the first and last vials of stage 1. Since the results
were within specifications however not aligned with time 0 hours bulk solution, stage 2 and 3 were also
analysed. No OOS was verified, however an extra purge can be defined so that the results approximate
more with the results of 0 hours bulk solution.
To establish an acceptable line stoppage duration and to determine the minimum quantity of vials
needed to be discarded before restarting the filling, a line stoppage of two hours was performed.
Samples were collected for analysis, the first and last vials of the first stage were tested. The results
were within specifications, therefore it was not necessary to analyse the 2nd stage. Two hours was
validated as the maximum line stoppage duration.
Effects of filtration and filling on the quality of the compounded solution
The filtration and the filling uniformity were evaluated in both submission batches. Filled units were
collected for physicochemical analysis from the beginning, middle and end of the filling process, after
capping. The volumes obtained were within the specifications presented in Table 10 for the filling of
vials. No deviations were detected which means that the defined filtration and filling conditions are
suitable for the process. At every hour visible particles were also analysed, the results were conform.
Table 10 - Volume specifications for filling of product B
Presentation
Individual minimum
(mL)
Average (mL) Individual maximum
(mL)
Minimum
action
Minimum
alert
Minimum Target Maximum Maximum
action
Maximum
alert
5 mL/vial 5.30 5.45 5.50 5.60 5.70 5.80 5.75
25 mL/vial 25.75 25.85 26.10 26.30 26.50 27.20 26.85

46
Vials inspection
All the vials after being capped were inspected using the particle automatic inspection machine, the light
box will be used for stability samples. All results were conform.
4.2.6. Scale-up
At the moment, the data compilation report resulting from the validation is being developed. The defined
parameters for the compounding of the 5 mL/vial presentation batch includes a 10 minute dissolution
time after the addition of excipient A as defined in the MBR, the agitation speed was challenged and
established to 400 rpm. After the addition of the API only 1 hour was necessary for complete dissolution,
even though the MBR had 180 minutes registered. The agitation speed was also defined as 400 rpm. In
order to adjust the pH to the range 6.3-6.7, 0.1N sulfuric acid was added (8mL) – the optimal value of
6.5 was achieved. For the final homogenization, the defined 10 minutes of the MBR was followed and
sufficient. Agitation speed of 400rpm continued to be used. The total compounding time was 7 hours
and 24 minutes.
Regarding the manufacturing of the 25 mL/vial presentation batch, a 200 L preparation tank was used
as established on the MBR. Dissolution time after excipient A addition took 10 minutes, the information
registered on the record was a minimum of 10 minutes. No information about the agitation speed was
given, however after challenging the speeds and according to knowledge from production of other similar
injections, 1200 rpm was defined for all stages. After adding the API the same situation happen
compared to the 5 mL/vial batch, after 1 hour total dissolution was achieved, contrarily to the minimum
180 minutes defined on the MBR. To adjust the pH, 40 mL of 0.1N sulfuric acid was added and a pH of
6.3 was obtained. The final homogenization required a minimum of 10 minutes of mixture, it was
sufficient with only 10 minutes. Compounding time took a total time of 4 hours and 55 minutes.
For both batches, the bulk holding time was tested until 72 hours and was stable. The maximum contact
with the filter was defined as 16 hours in the MBR, however the necessary time for filtration did not
overcome 5 hours. The filling duration was 35 minutes for the 5 mL/vial presentation batch and 3 hours
and 30 minutes for the 25 mL/vial presentation batch – including the 2 hours of line stoppage as indicated
in the protocol. The volume to be purged before filling (dead volume) defined in the MBR was established
as superior to 1000 mL. For the 5 mL/vial presentation it was defined as 192 vials (equivalent to around
1075 ml using a fill volume of 5.60 mL per vial) and for the 25 mL/vial presentation 71 vials were defined,
equivalent to around 1867 mL using a fill volume of 26.30 mL per vial.
Based on the results and parameters obtained for the validated batches, it was possible to plan the
scale-up. The proposed commercial batch sizes were established based on the number of viable vials
obtained on the submission batches. It was decided to slightly increase the proposed batch sizes to
accommodate routine bulk losses and to be within 10 times the theoretical submission batch sizes.
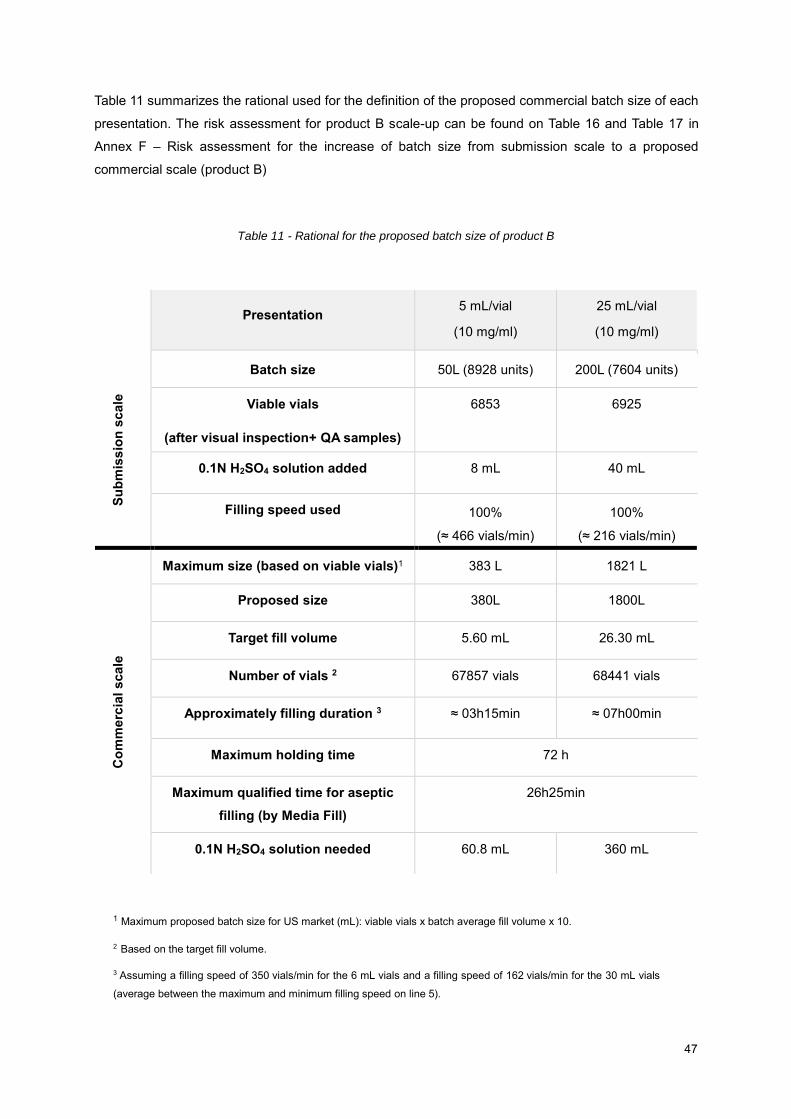
47
Table 11 summarizes the rational used for the definition of the proposed commercial batch size of each
presentation. The risk assessment for product B scale-up can be found on Table 16 and Table 17 in
Annex F – Risk assessment for the increase of batch size from submission scale to a proposed
commercial scale (product B)
Table 11 - Rational for the proposed batch size of product B
Presentation
5 mL/vial
(10 mg/ml)
25 mL/vial
(10 mg/ml)
Su
bm
iss
ion
sc
ale
Batch size 50L (8928 units) 200L (7604 units)
Viable vials
(after visual inspection+ QA samples)
6853 6925
0.1N H2SO4 solution added 8 mL 40 mL
Filling speed used 100%
(≈ 466 vials/min)
100%
(≈ 216 vials/min)
Co
mm
erc
ial
scale
Maximum size (based on viable vials)1 383 L 1821 L
Proposed size 380L 1800L
Target fill volume 5.60 mL 26.30 mL
Number of vials 2 67857 vials 68441 vials
Approximately filling duration 3 ≈ 03h15min ≈ 07h00min
Maximum holding time 72 h
Maximum qualified time for aseptic
filling (by Media Fill)
26h25min
0.1N H2SO4 solution needed 60.8 mL 360 mL
1 Maximum proposed batch size for US market (mL): viable vials x batch average fill volume x 10.
2 Based on the target fill volume.
3 Assuming a filling speed of 350 vials/min for the 6 mL vials and a filling speed of 162 vials/min for the 30 mL vials
(average between the maximum and minimum filling speed on line 5).

48

49
5. Optimization of submission and
commercial batches – PAT
The quality of submission batches is important. If a batch is manufactured correctly and without
unexpected difficulties during validation, the authorities approve the new product without requiring
improvements. Repeating batches which do not have the expected output lead to unpredicted costs by
the manufacturing site and entities involved. Equally, a process which faced several difficulties during
validation and eventually is approved is most likely to become problematic when applied to commercial
production, once again increasing costs and in this case with a probability of a public health risk.
As a solving measure, the development stage has to be effective, the technology transfer if applied must
be done correctly and the control during the submission process has to be well executed. However, it is
important to notice that even if the validated process is suitable for the manufacture of the product and
has a positive result, variability/unpredictability between commercial batches can still occur and face
problems. This can happen because raw materials used to manufacture pharmaceutical products might
vary in their attributes (for example: moisture content, crystal structure etc.) and manufacturing
equipment can have functionality complications, consequently the product is occasionally produced with
variability too. Slight problems during production might seem to have no importance at an initial stage,
nevertheless stability studies occasionally detect unexpected results which lead to withdrawn
medication from the market. If PAT is implemented during validation and for commercial manufacturing,
a wider flexibility for improvements during production is acceptable. FDA is implementing a 21st century
approach to encourage these manufacture progresses.
PAT is intended to support innovation and efficiency in pharmaceutical development, manufacturing,
and quality assurance. It is a mechanism to design, analyse, and control pharmaceutical manufacturing
processes through the measurement of CPPs which affect the CQAs. The concept aims at
understanding the processes by defining their CPPs, and accordingly monitoring them in a timely
manner (preferably in-line or on-line). This way of monitoring is extremely more advantageous than off-
line and at-line analyses characterized by manual sampling followed by discontinuous sample
preparation, measurement and evaluation. Figure 6 shows a scheme with the difference between the
different kinds of sampling. With a consistent control during manufacturing, adjustments can be applied
at real time without a need of extra validations if working within the design space (limits defined for the
parameters). PAT tools can implement a dynamic manufacturing process that compensates for
variability to produce a consistent product, a real-time adjustment is able to save the quality of the
products being manufactured and avoid batch rejection.

50
Figure 6 - Scheme of process monitoring: at-line, on-line, in-line and off-line
A combination of three main PAT tools is essential in order to implement an efficient PAT project:
- Multivariate data acquisition and data analysis software: advanced programs which aid in DOE,
collection of raw data and statistically analysing the data to determine which parameters are
CPPs.
- Process Analytical Chemistry (PAC) tools: in-line and on-line analytical instruments such as
Near-infrared (NIR) spectroscopy, biosensors, raman spectroscopy, fiber optics among others,
which are used to measure parameters that have been defined as critical.
- Continuous improvement and knowledge management tools: paper systems or softwares which
accumulate QC data acquired over time with the aim of defining process weaknesses and
implementing process monitoring initiatives. (FDA 2004)
The practical examples presented – technology transfer and submission of injection A and B, were
subjected to studies in the R&D site in USA as mentioned previously. The research involved the
establishment of the critical quality attributes of the materials and critical process parameters which had
impact on those CQAs. The parameters identified as critical and responsible for potential batch failure
causes were further evaluated based on risk management tools - FMEA. In this point of view, Hikma
Pharmaceuticals follows a QbD approach in order to obtain a better knowledge of the processes and
improve the control of critical steps.
Concerning the example of injection A, the oxygen headspace is one of the most critical parameters of
the process, it is essential to control this CPP in order to guarantee a quality product manufacturing.
OOS results were detected by the In-Process Control (IPC) team when the vials were analysed. To
monitor the oxygen levels, a lighthouse oxygen headspace analyser was used. This equipment can be
considered a PAT tool because it follows the required definitions, it is a process analyser system which
provides non-destructive measurements and delivers information on a critical product attribute.
The instrument utilizes a patented laser absorption technique. Light from a near-infrared diode laser is
tuned to match an internal absorption frequency of the oxygen molecule and passes through the empty

51
container headspace above the product. The amount of laser light absorbed is proportional to the
oxygen concentration in the headspace. Since the sample is not destroyed there are no waste disposal
issues and potentially valuable products can be saved. These characteristics allow multiple
measurements on the same sample enabling the accurate monitoring of the oxidation of a single sample
over time.
Regarding injection B, there were no difficulties during the production of the submission batches. It is a
simple and stable manufacturing process with no concerns about light, oxygen or other parameters.
However, it was noticed that after adding the API to the mixture, a homogenous solution was obtained
after about one hour. The TTR received by Bedford required a three hour duration to obtain the
dissolution of the mixture. The difference was figured out to be related to the API which was improved
by the reliable after the initial studies at the developing site, the foaming verified at Bedford was not
observed in our validation process. Foaming could be interfering with the dissolution rate. As it was
proven, alterations in the materials used have a great impact on the dissolution duration.
It can happen that between commercial batches the raw-materials can present slight alterations or the
equipment can face problems (the propeller in the compounding tank can have difficulties with its
rotation for example), these differences can have an effect on the time needed for complete solution
homogenization. If a one hour duration is always followed the product quality can occasionally be in risk.
Taking into consideration the variability/unpredictability that can occur, an implementation of a PAT tool
such as a NIR probe in the compounding tank can help controlling the dissolution and assure a
consistent quality product output.
The NIR is an analytical technique implemented when an industrial process needs a monitoring system
in real time for the mixing steps. NIR spectroscopy is a precise, fast, mechanically simple and non-
destructive technique that studies the interaction of infrared radiation with matter. This PAT tool
associated to chemometrics techniques, enables the construction of models to monitor the mixture
process. (Rodrigues, 2015)

52

53
6. Conclusion
6.1. Contributions
The literature review presented provides information about technology transfers and PVs. Technology
transfers in the pharmaceutical industry are described as movements of technology from drug discovery
to product development, clinical trials or full-scale commercialization. It can also be the process by which
a manufacturing site makes its technology available to another production site that will exploit the
technology. Appropriate technology transfer is essential to upgrade the quality of design to be the quality
of product.
In order to obtain a successful project, it is necessary to implement an effective training for all involved
in the new process, including production operators and regulatory team members which will prepare the
submission. The information sent by the transferring site is also very important, so that the
understanding of the technology is clear and well implemented.
PVs are considered a mean of proving effectiveness, by assuring that a process operated within
established parameters, can perform effectively and reproducibly to produce a medicinal product
meeting its predetermined specifications and quality attributes.
Before validating a pharmaceutical manufacturing process and defining a commercial process, the R&D
team creates the product at a smaller scale to gain knowledge about the process/product. The first
studies start at a laboratory scale, following pilot batches and finally production scale batches.
The first step of a technology transfer between Hikma’s R&D site and the manufacturing site of Hikma
pharmaceuticals PT is the selection of the product. Hikma PT is responsible for defining the batch size
and perform the scale-up of the batches for submission and validation. It should follow the TTR or PDR
sent by R&D using the same equipment when possible. The PV protocol is prepared by technical
services and the submission MBRs regarding the production of the batches too. The PV report includes
a side by side evaluation between submitted batch scale and proposed batch scale. The batches
manufactured for validation use qualified facilities, systems and equipment, and are tested using
validated analytical methods. All raw-materials and primary package materials are analysed and
released before production.
Hikma’s industrial facility is located in Sintra and is divided in two separate industries, one of them is
composed by eight production lines for injectable manufacturing and the other has three lines for the
production of antibiotics in powder form. Two new products were presented in this dissertation as
examples of technology transfers and submission processes produced on line 5. This line is specific for
the production of solutions in vials to be used for injections.
Injection A is an ANDA indicated for the treatment of heart complications and transferred to the Hikma
PT manufacturing site. Three batches were produced for each presentation (1 mL/vial in 2 mL vials and
5 mL/vial in 6 mL vials), the strength is 0.2 mg/mL for both presentations. The manufacturing conditions

54
defined include compounding and filling under yellow light. Regarding oxygen, nitrogen protection is
required to protect the product from its high sensitivity to oxygen. The ideal pH range (3.5-4.0) was
chosen in accordance to the results of the tests performed, certain pH values increased the impurities.
Different process parameters were challenged during validation in order to establish the best conditions
at the transferred site. Effects of mixing times and speeds were tested as well as effects of initial set up
and line stoppage, the filling machine speed was studied and also the effects of filling on the solution.
The speeds were defined as 200-300 rpm for the 30 L batches and 300-400 rpm for the 50 L batches.
The maximum bulk holding time was established as 48 hours and 2 hours for line stoppage. OOS results
were obtained for oxygen values during filling, for the 5 mL/vial presentation batches, the reason was
attributed to a human error in addition to the inadequacy of the oxygen reading equipment towards 6
mL vials. For the batches produced for the 1 mL/vial presentation batch the most probable root cause
was related to the misalignment of the needle holder/support from the filling machine. Corrections were
implemented and the results were favourable. The physicochemical and microbiological results were in-
specification. The PV report is still in construction for product A, the scale-up plan for commercial sizes
and submission to the authorities has not been concluded.
Injection B is an aseptically filled product transferred to Hikma Portugal. It is not considered a new
product because it has been developed and submitted before by Bedford. One batch of each
presentation was manufactured for the same bulk concentration of 10 mg/mL (5 mL/vial – 6 mL vial
capacity and 25 mL/vial – 30 mL vial capacity). No special concerns are necessary for the manufacturing
process, the product is not sensitive to light, heat or oxygen. The same activities performed for the
evaluation of the submission manufacturing of product A were applied to the manufacturing of product
B. The mixing speeds were defined as 400 rpm for the 5 mL/vial presentation and 1200 rpm for the 25
mL/vial presentation. For both batches the bulk holding time was tested until 72 hours and was stable.
The maximum contact with the filter was defined as 16 hours in the MBR, however the necessary time
for filtration did not overcome 5 hours. The filling duration was 35 minutes for the 5 mL/vial presentation
batch and 3 hours and 30 minutes for the 25 mL/vial presentation batch – including the 2 hours of line
stoppage as indicated in the protocol. The volume to be purged before filling (dead volume) defined in
the MBR was established as superior to 1000 mL. For the 5 mL/vial presentation it was defined as 192
vials (equivalent to around 1075 mL using a fill volume of 5.60 mL per vial) and for the 25 mL/vial
presentation 71 vials were defined, equivalent to around 1867 mL using a fill volume of 26.30 mL
per vial.
Based on the results and parameters obtained for the validated batches, it was possible to plan the
scale-up. The proposed commercial batch sizes were established based on the number of viable vials
obtained on the submission batches. It was decided to slightly increase the proposed batch sizes to
accommodate routine bulk losses and to be within 10 times the theoretical submission batch sizes. The
5 mL/vial presentation batch of 30 L was scaled up to 380 L and the 200 L batch correspondent to the
25 mL/batch presentation was scaled up to 1800 L. For product B the submission to the authorities is
almost ready to be done.

55
Advances in measurement tools (PAT) and quantitative analysis/modelling enables real-time monitoring
of critical steps and the scale-up of pharmaceutical processes with more reliability. These advances are
expected to cause a shift from trial and error to rational process scale-up following a QbD initiative.
The practical examples presented – injection A and B, were subjected to studies in the R&D site in USA.
The research involved the establishment of the CQAs and CPPs which had impact on those CQAs. The
parameters identified as critical and responsible for potential failure causes were further evaluated
based on risk management tools - FMEA. Risk assessment consists of the identification of hazards and
the analysis and evaluation of risks associated with exposure to those hazards.
Concerning the example of injection A, the oxygen headspace is a CPP, to monitor the oxygen levels, a
lighthouse oxygen headspace analyser was used. This equipment can be considered a PAT tool
because it follows the required definitions, it is a process analyser system which provides non-
destructive measurements and delivers information on a critical product attribute.
Regarding injection B, there were no difficulties during the production of the submission batches. It is a
simple and stable manufacturing process. However, it was noticed that after adding the API to the
mixture, a homogenous solution was obtained after about one hour. The TTR received by Bedford
required a three hour duration to obtain the dissolution of the mixture. It can happen that between
commercial batches the raw-materials can present slight alterations or the equipment can face
problems. Taking into consideration the variability/unpredictability that can occur, an implementation of
a PAT tool such as a NIR probe in the compounding tank can help controlling the dissolution and assure
a consistent quality product output.
6.2. Future work
Following the above described work, it would be interesting in future terms, to develop a more in-depth
study of the following aspects:
- Trend analysis of the results and deviations observed during validation and commercial batch
manufacturing at Hikma PT in order to identify the most frequent problems observed;
- Investigation about which could be the most necessary PAT tools to implement at Hikma PT in
accordance to the characteristics of the kind of products manufactured in this site and the most
regular problems detected.

56

57
7. References
Akhavan A. Technology Transfer to Developing Countries: The Iranian Experience, Ph.D. Dissertation,
University of Bradford 1995, UK
Al Ghailani HH, Moor WC. Technology Transfer to developing countries. International Journal of
Technology Management 1995; 10 (7/8): 687-703
Ali S, Pandit V, Chander S. Technology Transfer in Pharmaceuticals. Int Res J Pharm 2012; 3(6): 43-
48.
Colvard B, Jarmusik K, Brown D. Technology Transfer of Injection A. West-Ward Pharmaceuticals 2016;
1-46
Dogra R, Garg R and Jatav P: Technology Transfer in Pharmaceutical Industry: Transfer of process from
Development to Commercialization. Int J Pharm Sci Res 2013; 4(5); 1692-1708.
FDA. Guidance for Industry PAT — A Framework for Innovative Pharmaceutical Development,
Manufacturing, and Quality Assurance; 2004
FDA. Guidance for Industry Process Validation: General Principles and Practices; 2011; 8-16.
Feifei YUE, Yigming YUE. Research on Technology Transfer in the Pharmaceutical Industry, Technology
Transfer Journal of Tongji University. Natural Science 2008; 11-14.
Ghafaripour A. Fundamental Concepts for Technology Transfer Process, Industries Ministry, Tehran
1999.
Gibson M. Pharmaceutical Preformulation and Formulation: A Practical Guide form Candidate Drug
Selection to Commercial Dosage Form, Interpharm/CRC Press, A division of Taylor and Francis Books
2001, Inc, FL, USA.
Gibson M. Pharmaceutical Preformulation and Formulation: A Practical Guide form Candidate Drug
Selection to Commercial Dosage Form, Interpharm/CRC Press, A division of Taylor and Francis Books
2001, Inc, FL, USA.
Gorman ME. Types of knowledge and their roles in technology transfer. Journal of Technology Transfer
2002; 27: 219-231.
Gupta et al. Technology Transfer in pharmaceutical industry: An overview. Novel Science International
Journal of Pharmaceutical Science 2012; 1(7): 430-434
ICH. Guideline for pharmaceutical development Q8(R2); 2009
ICH. Quality Risk Management Q9; 2005

58
Keyur B. Ahir, Khushboo D. Singh, Sushma P. Yadav, Hetal S. Patel, Chetan B. Poyahari Overview of
Validation and Basic Concepts of Process Validation. Sch. Acad. J. Pharm., 2014; 3(2): 178-190
L. Nandhakumar, G. Dharmamoorthy, S. Rameshkumar and S. Chandrasekaran An overview of
Pharmaceutical Validation: Quality Assurance view point. IJRPC 2011; 1(4)
Madieh S, Bucur B, Ali M. Technology Transfer of Injection B. West-Ward Pharmaceuticals 2015; 1-17
Madu CN. Transferring technology to developing countries – Critical factors for success. Long Range
Planning 1989; 22(4): 115-124.
Mansfield E. East-West technological transfer issues and problems, International technology transfer:
forms, resource requirements, and policies. American Economic Review 1975; 65(2): 372-376.
Marques R, Lopes A, Dana L. Technology Transfer between Hikma R&D and Hikma Farmacêutica
Portugal. Hikma Sintra 2015; 1-16
Marques R, Cordeiro I, Campos R. Data Compilation Protocol for Product A (10 mg/mL). Hikma Sintra
2016; 1-30.
Marques R, Cordeiro I, Campos R. Process Validation Protocol for Product B (0.2 mg/mL). New ANDA.
Hikma Sintra 2017; 1-25.
Marques R. Data Compilation Report Draft for Product B (0.2mg/mL). Hikma Sintra 2017; 15-21.
Ortega AJ, Arce NA, Sequeda F, Gribenchenko I. Management of Innovation and Technology Transfer
Process Between University and Industry. The Mater Res Cent Case in Universidad del valle, Colombia
2009; 2: 7-8.
Osman Gani AAM. International technology transfer for competitive advantage: A conceptual analysis
of the role of HRD. Competitiveness Review 1999; 9: 9
Patel DS, Nadiad. Technology Transfer an Overview of Pharmaceutical Industry. Int Biopharm
Association Publ 2009; 2(4): 2-8.
Patil RP. Technology Transfer in Pharmaceutical industry: Objective, Issues and Policy Approaches. Int
J Pharma Res Dev 2010; 2(10): 43-48
Rodrigues, A.; Almeida, J.; Lopes, L.; Menezes, J. Analysis of a pharmaceutical process powder mixture
with NIR spectroscopy and chemometric tools. Instituto Superior Técnico da Universidade de Lisboa,
Faculdade de Farmácia da Universidade de Lisboa, Generis Farmacêutica, S.A.; 2015
Sarvani V, Elisha Raju P, Sreekanth Nama, Leela Madhuri Pola, Chandu Babu Rao Process Validation:
an essential process in pharmaceutical industry, International Journal of Medicinal Chemistry & Analysis,
Vol 3 Issue 2 2013; 49-52
Sharma Sumeet, Singh Gurpreet. Process validation in pharmaceutical industry: an overview. Journal
of Drug Delivery & Therapeutics; 2013, 3(4), 184-188
Souder WE, Nashar AS, Padmanathan V. A guide to the best technology transfer practices. Journal of
Technology Transfer 1990; 15: 1-2.

59
Souder WE, Nashar AS, Padmanathan V. A guide to the best technology transfer practices. Journal of
Technology Transfer 1990; 15: 1-2.
Steenhuis HJ, De Boer SJ. Differentiating between types of technology transfer: the technology building.
International Journal of Technology Transfer and Commercialization 2002; 1(1/2): 187-200.
WHO Expert Comitee on Specifications for Pharmaceutical Preparations WHO technical report
Guidelines on the validation for manufacturing processes. Series no. 863-34th report annex 6 1996; 4-7
WHO Good manufacturing practices for pharmaceutical products. Comitee on specification for
pharmaceutical preparation, report series no. 823, Geneva; 1992, 14-96
WHO Guidelines on Validation. Working document QAS/16.666; 2016
WHO Supplementary guidelines on good manufacturing practices: validation, technical report series.
No. 937, 2006 Annex 4
Saudi Food & Drug Authority. Guidelines for Process Validation of Pharmaceutical Dosage Form Version
2; 2010
http://www.hikma.com/en/about-us/global-presence.html (Accessed at August 2017)

A1
8. Annexes
Annex A - Risk management tools (FMEA) for product A
Table 12 – FMEA for product A
ID Process step Cause failure Potential effect Effect Severity Probability Criticality Detection SPD Control
A API and
excipients
calculation
Incorrect added amount Low or high assay Batch failure 3 1 3 1 3 Calculation of the quantity of API is double verified before weighing.
B API handling Handling instruction
missing
API quality Batch failure 3 1 3 1 3 API is weighed in a glass flask. API is pre-dissolved with WFI before adding to
the compounding tank. The API is weighed in a controlled humidity glove box,
up to a maximum of 24 hours before being used.
C Dissolution of
API/ excipients
Incorrect visual
evaluation
Low or high assay,
homogeneity
Batch failure 3 1 3 1 3 Dissolution steps are double verified. A pre-dissolution is performed before
addition to the preparation tank to avoid powder losses.
D Protect bulk from
light exposure
Human error, handling
instruction missing
Increase of impurities,
product degradation
Batch failure 3 1 3 2 6 The filling room uses yellow lights.
E Protect bulk
solution from
oxygen exposure
Human error, excessive
exposure to ambient
conditions
Increase of impurities,
product degradation
Batch failure 3 2 6 2 12 WFI is continuously sparged with filtered nitrogen throughout the
compounding. Oxygen sensor is calibrated before compounding.
F pH
measurement
and pH
adjustment
pH meter malfunction,
error in pH adjusting
solution quantity
Higher or lower pH
measurement result
Batch failure 3 2 6 1 6 pH meter is calibrated daily to cover the pH range on the MBR. pH adjustment
is performed with acid and basic solutions and checked by IPC pH meters
G Final QS Human error, scale
malfunction
Low or high assay Batch failure 3 1 3 2 6 Balance is calibrated and verified prior to each compounding, the step is
double verified. Final volume is verified with calibrated ruler.
H Filtration Product incompatibility
with filter membrane,
filter clogging
Low assay or high
impurity level
OOS results 3 1 3 1 3 The filter membrane used is the same as tested and validated at the R&D
site.
I Filling Improper nitrogen
headspace purging
Product degradation Batch failure 3 2 6 2 12 Oxygen headspace is monitored by IPC. The product is filled with nitrogen
flushing. The filling machine is qualified to meet product oxygen headspace.
specifications. Error in weights entry or
machine malfunction
Incorrect fill volume Low or high
assay, content
uniformity
affected
2 1 2 1 2 Filling start-up with volume verification by IPC. In-process control of fill volume
by IPC.
Washing machine, tunnel
or filling mal function
Product degradation Quality of the
batch
3 2 6 1 6 Critical holding time study, including the evaluation of the impact of 2 hours
line stoppage during filling.
J Protect product
from light
Human error, handling
instructions missing
Product degradation OOS results 3 2 6 1 6 The product was challenged under normal lights and did not significantly
impact the product quality for an exposure period up to 7 days.
K Inspection Product defects/particles Product degradation Batch failure 1 2 2 1 2 Inspection of the batches for particles. Samples are placed on stability.

A2
Annex B – Sampling scheme for product A
Figure 7 – Sampling scheme of product A manufacturing process

A3
Annex C – Risk management tools (FMEA) for product B
Table 13 – FMEA for product B
ID Process step Cause failure Potential effect Effect Severity Probability Criticality Detection SPD Control
A API calculations Added amount of
API is > or <
Low or high assay Batch failure 3 1 3 1 3 Calculation of the quantity of API is double verified before weighing.
B API handling Handling
instructions missing
API handling, low
or high assay
Batch failure 3 1 3 1 3 The weighing process is performed in a plastic bag.
C pH measurement
and adjustment
pH meter
malfunction, error
in pH adjusting
Higher or lower pH
measurement
result
pH OOS results,
product degradation
3 1 3 1 3 pH meter is calibrated daily to cover the pH range. pH adjustment is performed with
acid or basic solutions. Sample is checked by IPC pH meters.
D API dissolution Incorrect visual
evaluation
Low or high assay,
homogeneity of the
bulk solution
Batch failure 3 1 3 1 3 Dissolution of API is double verified. A minimum dissolution time is stated. A sample
from the bottom of the preparation tank is collected to verify API dissolution.
E Final QS Human error, scale
malfunction
Low or high assay Batch failure 3 1 3 2 6 Balance is calibrated and verified prior to each compounding. This step is double
verified.
F Filtration Product
incompatibility with
filter membrane,
filter clogging
Low assay, high
impurity level
Batch failure 3 1 3 1 3 Filter membranes to be used (0.2 µm) are the same as previously used in West-Ward
(Bedford). Filter validation reports are available.
G Filling Error in filling
weights entry or
machine
malfunction
Incorrect fill
volume;
Low or high
assay
2 1 2 1 2 Filling start-up with volume verification by IPC. In-process control of fill volume by IPC.
Washing machine,
tunnel or filling
machine,
malfunction leading
to line stoppages
Product
degradation
Compromise
quality of the
batch
3 2 6 1 6 The product is not oxygen or light sensitive. Maximum bulk hold time and the impact of
a 2 hours line stoppage is studied.
H Inspection Product defects;
colour or particles
Product
degradation or
process related
Batch failure 3 2 6 1 6 Inspection of the batches. Samples are placed on stability after inspection.
L Labelling and
Packaging
Uncontrolled
exposure to
ambient conditions
Product
degradation
Batch failure 3 1 3 1 3 The product is not light or heat sensitive, submission batches are labelled and packed
under normal lights to challenge the product.

A4
Annex D – Sampling scheme for product B
Figure 8 - Sampling scheme of product B manufacturing process

A5
Annex E - Risk assessment for the technology transfer of product B from Bedford to Hikma
Table 14 - Risk assessment for the technology transfer of product B from Bedford to Hikma regarding compounding
Item Current New Justification for change Risk Categorization
Batch size 80 L and 250 L 50L and 200 L As part of the technology
transfer to the new
manufacturing site. To
generate sufficient vials for
stability
Low
Compounding evaluated during submission
batches. Commercial sizes defined based on
market demand and during process validation.
Compounding
tank
75 gallons stainless
steel tank with a
propeller
100L or 200L stainless
steel
tank with a 4 blade
magnetic stirrer
As part of the Technology
Transfer to the new
manufacturing site
Low
Same material of construction (stainless
steel).
Compounding process evaluated during
submission batches manufacture.
Temperature
Mixing speed
and time
21-23ºC. 8-12 minutes
for excipient
dissolution, 178-182
minutes for API
dissolution. Mixing
speed: 550-600 rpm
20-25ºC (room
temperature). Average
mixing times and speeds
challenged on each step
As part of the Technology
Transfer to the new
manufacturing site
Low
Compounding process evaluated during
submission batches manufacture; New mixing
speeds/times evaluated to ensure efficient
mixing in the new tank without splashing and
without excessive foaming (if any).
API &
Excipients
API from Reliable.
Excipients from
Bedford suppliers
Same API supplier. Hikma
excipients suppliers
As part of the Technology
Transfer to the new
manufacturing site
Low
New mixing speeds/times evaluated during
submission to ensure efficient mixing
dynamics in the new tank without splashing
and without excessive foaming (if any).

A6
Table 15 - Risk assessment for the technology transfer of product B from Bedford to Hikma regarding filtration and filling
Item Current New Justification
for change
Risk categorization (low/medium/high)
Filtr
ati
on
Filtration
train
design
Two filters in parallel for
clarification and two
redundant filters used for
final filtration (0.2 µm)
One final filter inside the
sterile core (0.2 µm)
As part of the
technology
transfer to the
new
manufacturing
site
Low
Two filters in series inside the sterile core does not mean higher
sterility assurance. All the internal standard sterility assurance
controls are in place during submission. Same filter membrane
is used with the same porosity and from the same supplier. Less
extractables are expected by using one filter instead of two.
Fillin
g
Tubing Platinum cured silicone or
teflon
Teflon
Low
Teflon is considered as an inert material. Teflon has lower
extractables.
Automatic weighing is efficient. The filling machine is capable of
filling the product within the specified limit.
Fill volume consistency along the filling process is evaluated
during the manufacture of the submission batch. A proper
extended data compilation is performed during submission and
PV batches in order to evaluate the impact of each
manufacturing step on product quality, which includes extended
in-process analysis during filling in order to validate the entire
filling process and prove that it is not affecting the quality of the
product.
Fill
volume
Target fill weights are
checked every 15 minutes
gravimetrically using the
theoretical density to
ensure that vials are filled
correctly
Fill weight, based on
actual density. Filling line 5
has an automatic IPC.
Manual volume
verification is also
performed
IPC of
bulk
solution
Appearance, assay, pH,
density, osmolality and
bioburden were tested
before filtration
Bulk solution is tested
(before filtration). Routine
IPC tests are performed
(particles)

A7
Annex F – Risk assessment for the increase of product B batch size from submission scale to a proposed commercial
scale
Table 16 - Risk assessment for the scale-up to commercial size regarding the preparation tank, dissolution times, mixing speeds and filtration of product B
Item Submission batch sizes
(50L, 200L)
Proposed batch sizes
(380L, 1800L)
Rational/Risk evaluation
Preparation
tank
100L stainless steel tank.
200L stainless steel tank
600L stainless steel tank
2000L stainless steel tank
Low
Same material of construction (stainless steel).
Dissolution
times and
mixing
speeds
The minimum times were
challenged
The mixing times will be
challenged based on the data
collected on the submission
batches
Low
Typical mixing ranges for the selected tank will be used and evaluated
to assure proper dissolution/homogenization, having as indicative the
data collected during submission batches.
Filtration 0.2 µm PVDF filter
0.2 µm PVDF filter
Low
Same filter reference will be used.
Filter validation studies are available, covering the following
parameters: 16 hours as the maximum contact time of the product with
the filter, a maximum pressure of 2000 mbar and a maximum flow of
11.59 mL/min.cm2 of filter area.
Dead volume (which includes any filter adsorption) was evaluated and
conclusions are applicable to the new batch size.
Maximum contact of the
product with the filter: NA
Maximum contact of the product
with the filter: 16 hours
Filtration pressure ≤ 2.0 bar Filtration pressure ≤ 2.0 bar
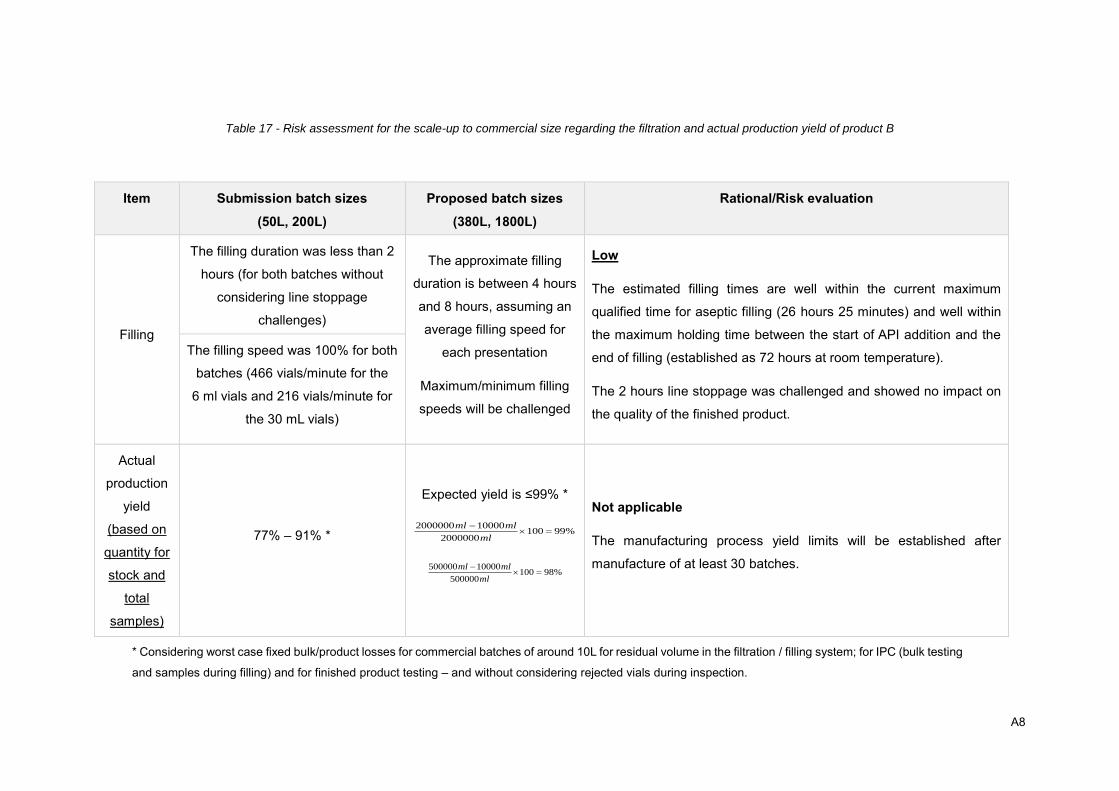
A8
Table 17 - Risk assessment for the scale-up to commercial size regarding the filtration and actual production yield of product B
Item Submission batch sizes
(50L, 200L)
Proposed batch sizes
(380L, 1800L)
Rational/Risk evaluation
Filling
The filling duration was less than 2
hours (for both batches without
considering line stoppage
challenges)
The approximate filling
duration is between 4 hours
and 8 hours, assuming an
average filling speed for
each presentation
Maximum/minimum filling
speeds will be challenged
Low
The estimated filling times are well within the current maximum
qualified time for aseptic filling (26 hours 25 minutes) and well within
the maximum holding time between the start of API addition and the
end of filling (established as 72 hours at room temperature).
The 2 hours line stoppage was challenged and showed no impact on
the quality of the finished product.
The filling speed was 100% for both
batches (466 vials/minute for the
6 ml vials and 216 vials/minute for
the 30 mL vials)
Actual
production
yield
(based on
quantity for
stock and
total
samples)
77% – 91% *
Expected yield is ≤99% *
%991002000000
100002000000
ml
mlml
%98100500000
10000500000
ml
mlml
Not applicable
The manufacturing process yield limits will be established after
manufacture of at least 30 batches.
* Considering worst case fixed bulk/product losses for commercial batches of around 10L for residual volume in the filtration / filling system; for IPC (bulk testing
and samples during filling) and for finished product testing – and without considering rejected vials during inspection.

A9