development of federal aviation new roughness standard … albert larkin erpug... · roughness...
TRANSCRIPT

Presented to: European Road Profiler User
Group Forum
By: Al Larkin, FAA Airport Pavement R & D
Date: October 19, 2017
Federal AviationAdministrationDevelopment of
New Roughness
Standard for In-
Service Airport
Pavement

Federal AviationAdministration
European Road Profiler User Group Forum
October 19, 20172
Presentation Outline
• Background
• Airport Pavement Roughness Simulator
Project
• New Pavement Roughness Index Statistical
Analysis
• Overview of New Pavement Roughness
Index Model Development
• Conclusion

Federal AviationAdministration
European Road Profiler User Group Forum
October 19, 20173
Data Collection
• Background• Current airport pavement surface roughness requires high standards
to control construction quality. Upper limit of straightedge indices
for each pavement type is defined by FAA AC 150/5370-10G,
Standards for Specifying Construction of Airports.
• Identified the need to develop a reliable method to quantify
roughness on in-service airport pavement surfaces.
• The FAA’s B737-800 and A330-200 full flight simulators study at Mike
Monroney Aeronautical Center in Oklahoma City since 2008.
• Test scenarios were developed based on the National Cooperative
Highway Research Program (NCHRP) highway rideability studies.
• Evaluated correlations between the FAA simulator project results at
the FAA’s B737-800 and A330-200 simulators and roughness indices
calculated by ProFAA the FAA’s pavement profile software.

Federal AviationAdministration
European Road Profiler User Group Forum
October 19, 20174
B737-800 Flight Simulator
● FAA Mike Monroney
Aeronautical Center in
Oklahoma City
● Level D Certified Full
Flight Simulator
● Six-degree-of-freedom
motion system
● High resolution visual
display and sound system
Federal AviationAdministration
European Road Profiler User Group Forum
October 19, 20175
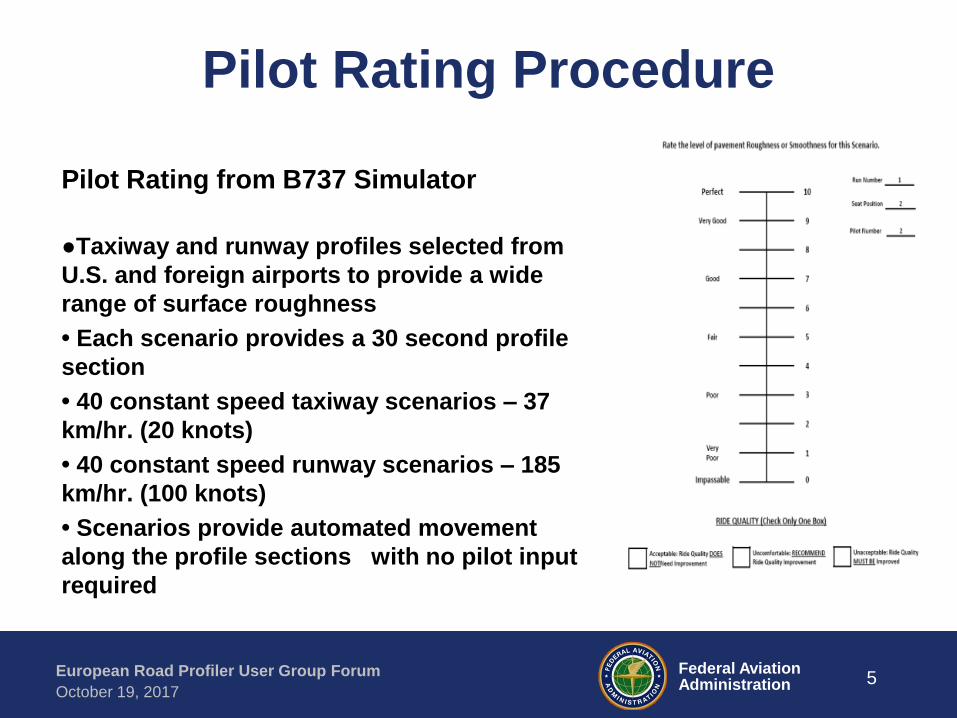
Pilot Rating Procedure
Pilot Rating from B737 Simulator
●Taxiway and runway profiles selected from
U.S. and foreign airports to provide a wide
range of surface roughness
• Each scenario provides a 30 second profile
section
• 40 constant speed taxiway scenarios – 37
km/hr. (20 knots)
• 40 constant speed runway scenarios – 185
km/hr. (100 knots)
• Scenarios provide automated movement
along the profile sections with no pilot input
required
Federal AviationAdministration
European Road Profiler User Group Forum
October 19, 20176
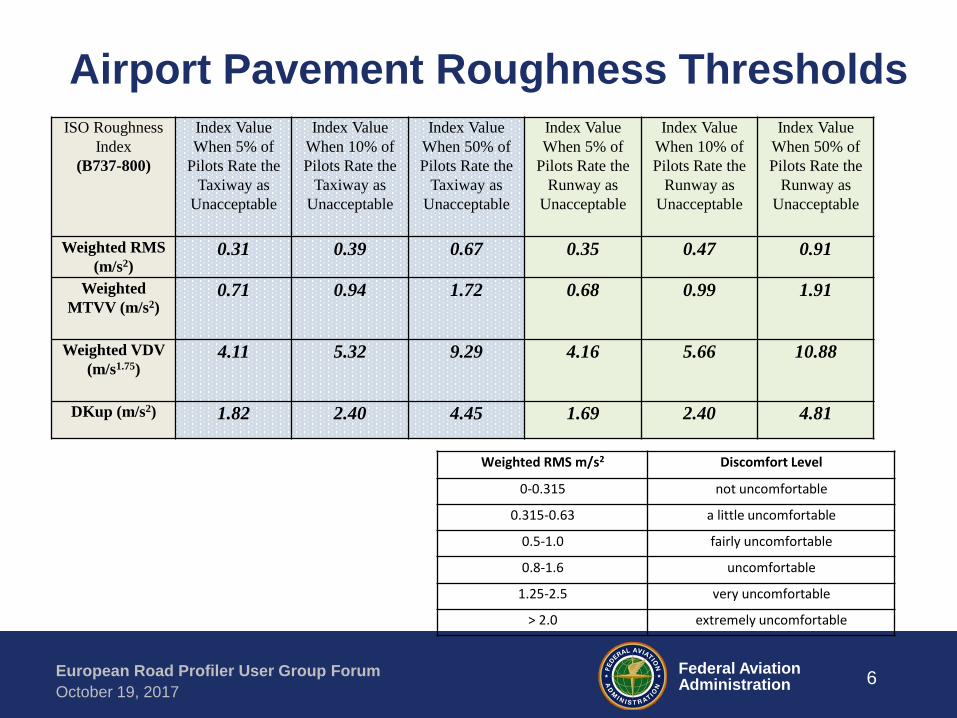
Airport Pavement Roughness ThresholdsISO Roughness
Index
(B737-800)
Index Value
When 5% of
Pilots Rate the
Taxiway as
Unacceptable
Index Value
When 10% of
Pilots Rate the
Taxiway as
Unacceptable
Index Value
When 50% of
Pilots Rate the
Taxiway as
Unacceptable
Index Value
When 5% of
Pilots Rate the
Runway as
Unacceptable
Index Value
When 10% of
Pilots Rate the
Runway as
Unacceptable
Index Value
When 50% of
Pilots Rate the
Runway as
Unacceptable
Weighted RMS
(m/s2)0.31 0.39 0.67 0.35 0.47 0.91
Weighted
MTVV (m/s2)0.71 0.94 1.72 0.68 0.99 1.91
Weighted VDV
(m/s1.75)4.11 5.32 9.29 4.16 5.66 10.88
DKup (m/s2) 1.82 2.40 4.45 1.69 2.40 4.81
Weighted RMS m/s2 Discomfort Level
0-0.315 not uncomfortable
0.315-0.63 a little uncomfortable
0.5-1.0 fairly uncomfortable
0.8-1.6 uncomfortable
1.25-2.5 very uncomfortable
> 2.0 extremely uncomfortable

Federal AviationAdministration
European Road Profiler User Group Forum
October 19, 20177
Statistical Analysis for New
Roughness Index Development
• Evaluate the correlations between ProFAA indices
and ISO indices.
• Divide data into groups: runway/taxiway and
B737/A330.
• Develop regression models between ProFAA
indices and ISO indices for each data group using
linear regression analysis techniques.
• Choose the best regression model for the new
roughness index development
• New roughness index may be developed using ISO
indices based on the regression models

Federal AviationAdministration
European Road Profiler User Group Forum
October 19, 20178
Statistical Analysis
• Comparison Between B737 and A330 Simulation Results
• It is not recommended to mix the simulation results from
B737 and A330 together since different types of aircraft have
different acceleration response to the runway profiles.
• Therefore, a comparative study was performed.
• It was found that the simulation results from each simulator
are strongly correlated with R2 > 0.98. The B737 has a higher
acceleration rate and lower pilot subject rating than A330,
which is reasonable since bigger aircraft has smaller
acceleration response and better pilot rating.

Federal AviationAdministration
European Road Profiler User Group Forum
October 19, 20179
Wavelength Analysis
• Artificial Haversine Single Bump
• Acceleration at Center of Gravity
• Acceleration at Cockpit• Acceleration at Cockpit

Federal AviationAdministration
European Road Profiler User Group Forum
October 19, 201710
Proposed Steps for the Statistical Analysis of
the New Index Development
1. Consider both user’s rideability and pavement surface conditions for in-service airport pavements.
2. Correlate Cockpit Accelerations (g) from aircraft simulator with current pavement roughness indices in ProFAA using statistical analysis.
3. Select the ProFAA index with the best correlation model as a baseline for new index development.
4. Compare wavelength sensitivity reflecting constructability (+drainage) with aircraft simulation studies.
5. Select appropriate independent parameters for runway/taxiway.
6. Refine the correlation model for new index development
Federal AviationAdministration
European Road Profiler User Group Forum
October 19, 201711
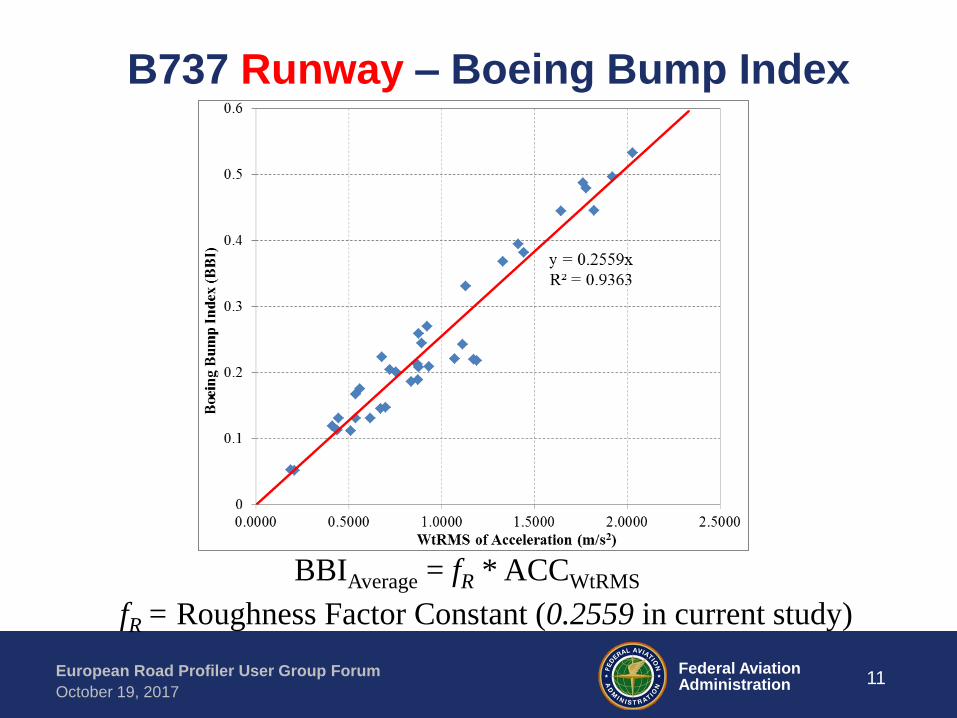
B737 Runway – Boeing Bump Index
BBIAverage = fR * ACCWtRMS
fR = Roughness Factor Constant (0.2559 in current study)

Federal AviationAdministration
European Road Profiler User Group Forum
October 19, 201712
Statistical Analysis Summary and Conclusions
• Statistical regression analysis was conducted to correlate
ProFAA computed indices with Boeing 737-800 and Airbus A330-
200 aircraft simulators test results.
• It can be found that the indices are directly related to WtRMS of
acceleration. WtRMS shows good correlation with ProFAA
computed indices.
• Due to travel speed, consider runways and taxiways separately.
• Boeing Bump Index (BBI) has a very good linear relationship with
WtRMS for runways. This correlation model can be used for the
new roughness index development.
• For taxiways, IRI and Profile Index have good correlations with
simulator data.

Federal AviationAdministration
European Road Profiler User Group Forum
October 19, 201713
Aircraft Simulation Model – to be Improved
• Known Parameters
– Aircraft type
• Weight
• Wheel Base Dimensions
• Gear Configuration
– Aircraft Speed
– Wavelength of pavement profile
• Unknown Parameters
– Aircraft Gear Dynamics

Federal AviationAdministration
European Road Profiler User Group Forum
October 19, 201714
Proposed Steps for New Index Model
Development
1. Simulate the vertical acceleration at the aircraft cockpit using the aircraft simulation model by considering all the parameters.
2. Validate the simulation model using field test of the FAA owned B727 airplane at the Atlantic City (ACY) airport.
3. Implement the simulation model into ProFAA to improve the aircraft simulation function.
4. In ProFAA, for each input runway profile, the vertical acceleration at the cockpit will be calculated using aircraft simulation for each sample spacing (user can define).
5. The vertical acceleration will then be converted to new roughness index by the roughness factor constant fR.

Federal AviationAdministration
European Road Profiler User Group Forum
October 19, 201715
Proposed Steps for New Index Model
Development
6. The new index at each sample spacing will be calculated. The average value for the whole runway section will also be computed.
7. Evaluate the new roughness index threshold criteria.
– Single Event
– Multiple Events
Federal AviationAdministration
European Road Profiler User Group Forum
October 19, 201716
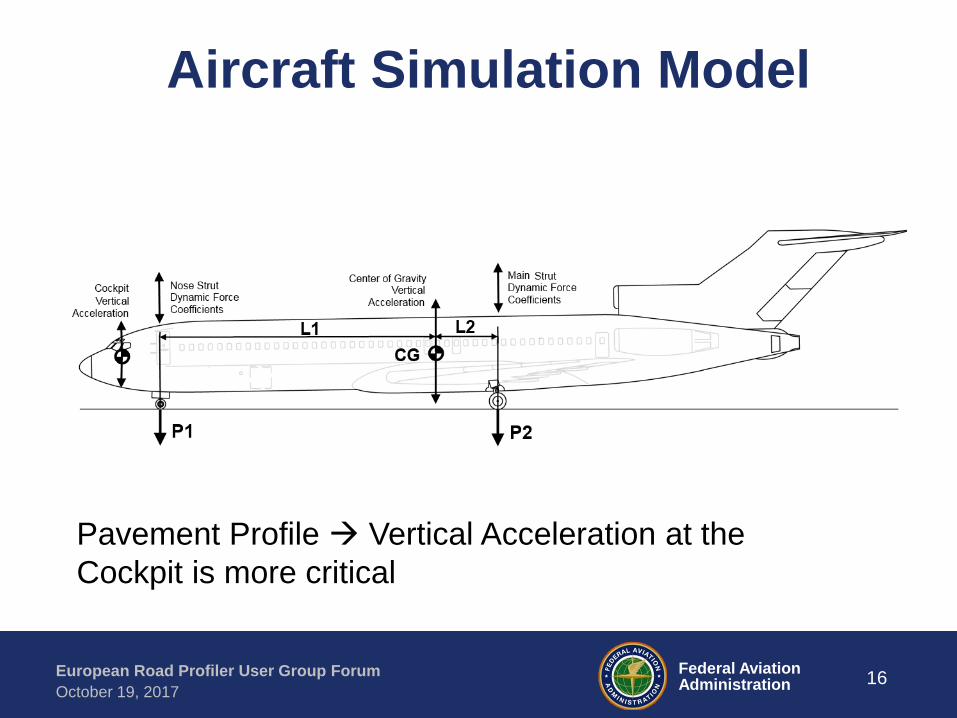
Aircraft Simulation Model
Pavement Profile Vertical Acceleration at the
Cockpit is more critical

Federal AviationAdministration
European Road Profiler User Group Forum
October 19, 201717
Model Validation – B727 in ACY
FAA Owned Boeing 727

Federal AviationAdministration
European Road Profiler User Group Forum
October 19, 201718
Model Validation – B727 in ACY

Federal AviationAdministration
European Road Profiler User Group Forum
October 19, 201719
Model Implementation in ProFAA
Federal AviationAdministration
European Road Profiler User Group Forum
October 19, 201720
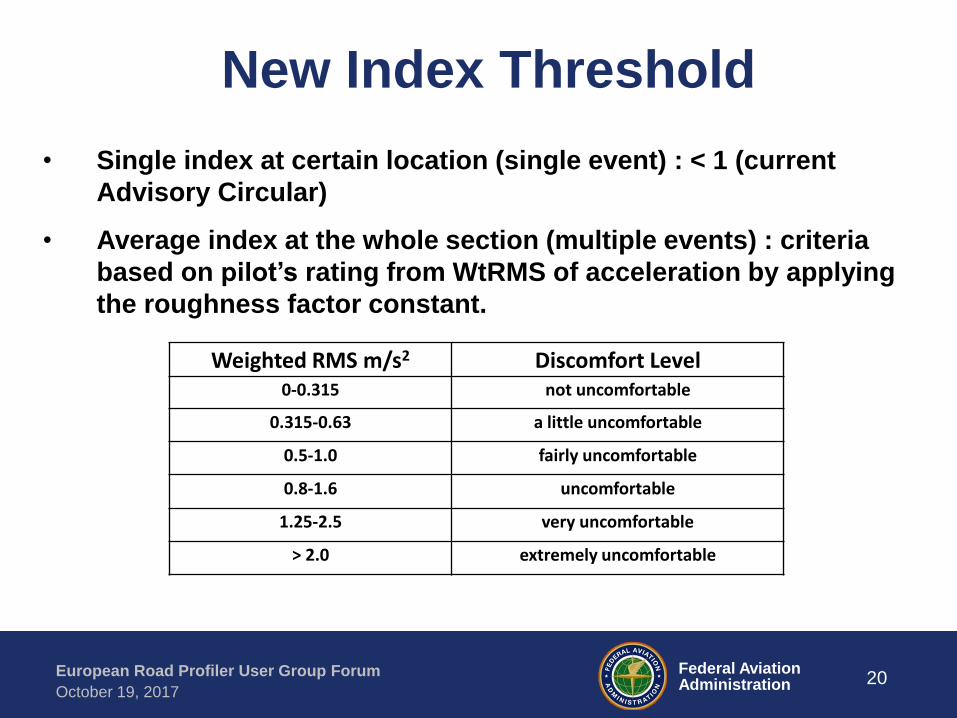
New Index Threshold
• Single index at certain location (single event) : < 1 (current
Advisory Circular)
• Average index at the whole section (multiple events) : criteria
based on pilot’s rating from WtRMS of acceleration by applying
the roughness factor constant.
Weighted RMS m/s2 Discomfort Level0-0.315 not uncomfortable
0.315-0.63 a little uncomfortable
0.5-1.0 fairly uncomfortable
0.8-1.6 uncomfortable
1.25-2.5 very uncomfortable
> 2.0 extremely uncomfortable
Federal AviationAdministration
European Road Profiler User Group Forum
October 19, 201721
Conclusion• It is recommended to separate runway and taxiway data.
• Regression Results on Runways
– For the runway, ProFAA computed indices have good correlation with the WtRMS of
acceleration from aircraft simulation for both B737 and A330 simulators.
– B737 models have good agreement with A330 models respectively on the runways.
A conversion factor on WtRMS can be applied between B737 models and A330
models.
– Boeing Bump Index has the best correlation with the WtRMS on the runways
compared to the other ProFAA computed indices (R2 > 0.98). Therefore, it is
recommended to use Boeing Bump Index model for new roughness index
development for runways.
• Regression Results on Taxiways
– For the taxiway, IRI, SE, PI, and BP have good correlations with the aircraft
simulation results, which can be used for new roughness index development.
However, the correlation between BB and aircraft simulation results was not good.
• Based on the regression analysis, WtRMS was selected as the independent predictor to
correlate with ProFAA computed indices. It is recommended to use the runway data only
for the new roughness index development based on acceleration response at this stage.

Federal AviationAdministration
European Road Profiler User Group Forum
October 19, 201722
Contact
• Albert Larkin
• Airport Technology R & D
• William J. Hughes Technical Center
• ANG - E262
• (609) 485 – 5552