development of european ecolabel and green public ...susproc.jrc.ec.europa.eu/heating/docs/policy...
TRANSCRIPT

Development of European Ecolabel and
Green Public Procurement Criteria forHydronic Central Heating Generators
Draft Report
Policy analysis
November 2011

2
Authors:
Martijn van Elburg (coordinator), VHK (Van Holsteijn en Kemna BV)
Roy van den Boorn, VHK
René Kemna, VHK
Reviewers:
Elena Rodriguez Vieitez, JRC – IPTS
Oliver Wolf, JRC – IPTS

3
Contents
Contents ............................................................................................................................................. 3 Executive Summary ............................................................................................................................ 7 0 Introduction ............................................................................................................................... 9
0.1 Background and aim........................................................................................................... 9 0.2 Scope .................................................................................................................................. 9 0.3 Methodology .................................................................................................................... 10
1 Task 4: Policy analysis [draft] ................................................................................................... 12 1.1 Method............................................................................................................................. 12 1.2 Quantitative analysis on energy and emissions (aka 'stock model')................................ 12
1.2.1 Appliance categories ................................................................................................ 13 1.2.2 Sales and stock ......................................................................................................... 14 1.2.3 Energy input ............................................................................................................. 16 1.2.4 CO2 emissions .......................................................................................................... 26 1.2.5 NOx emissions .......................................................................................................... 32 1.2.6 CO emissions ............................................................................................................ 36 1.2.7 PM emissions............................................................................................................ 38 1.2.8 OGC emissions.......................................................................................................... 41
1.3 Qualitative analysis .......................................................................................................... 44 1.3.1 Issues related to installation (feasibility and costs) ................................................. 44 1.3.2 Impacts on energy-infrastructure ............................................................................ 45 1.3.3 Impacts on noise ...................................................................................................... 46 1.3.4 Impacts on affordability / running costs .................................................................. 46
2 Task 5: Criteria [to elaborate with IPTS]................................................................................... 47 2.1 EU Ecodesign .................................................................................................................... 47
Annex I - Overview of emissions by category and source................................................................ 49 Annex II - Working documents Ecodesign/Energy labelling ............................................................ 55 Annex III - Energy labelling of boilers ............................................................................................... 63 Annex IV - Emissions from combustion............................................................................................ 70

4
List of figures
Figure 1: Energy losses central heating.............................................................................................................................. 17
Figure 2 Calculation of correction on ETAboiler for medium temperature heat pumps (for average climate) ................. 22
Figure 3 energy input to STOCK (primary fuel) .................................................................................................................. 25
Figure 4 CO2 emissions per kWh thermal output .............................................................................................................. 30
Figure 5 CO2 emissions of boiler STOCK in 2030................................................................................................................ 31
Figure 6 overall development of CO2 emissions of boiler STOCK ...................................................................................... 32
Figure 7 NOx emissions per kWh thermal output NEW ..................................................................................................... 34
Figure 8 NOx emissions of boiler STOCK in 2030 ............................................................................................................... 35
Figure 9 CO emissions per kWh thermal output NEW ....................................................................................................... 37
Figure 10 CO emissions of boiler STOCK in 2030................................................................................................................ 38
Figure 11 PM emissions per kWh thermal output NEW..................................................................................................... 39
Figure 12 PM emissions of boiler STOCK in 2030............................................................................................................... 40
Figure 13 OGC emissions per kWh thermal output NEW................................................................................................... 42
Figure 14 OGC emissions of boiler STOCK in 2030 ............................................................................................................. 43
Figure 15 Gas/oil boiler fiche ............................................................................................................................................. 65
Figure 16 Cogeneration boiler fiche................................................................................................................................... 66
Figure 17 Heat pump boiler fiche....................................................................................................................................... 67
Figure 18 Low Temperature heat pump boiler fiche.......................................................................................................... 68
Figure 19 Sanitary water heating fiche .............................................................................................................................. 69

5
List of tables
Table 1 Overview of boiler categories................................................................................................................................ 13
Table 2 boiler sales per category ....................................................................................................................................... 14
Table 3 boiler sales absolute values................................................................................................................................... 15
Table 4 boiler product life .................................................................................................................................................. 15
Table 5 boiler STOCK absolute value.................................................................................................................................. 16
Table 6 Rated capacity of boilers ....................................................................................................................................... 17
Table 7 equivalent hours.................................................................................................................................................... 19
Table 8 reference thermal output STOCK .......................................................................................................................... 19
Table 9 example of calculation etas ................................................................................................................................... 20
Table 10 seasonal efficiency (etas) per boiler category NEW ............................................................................................ 23
Table 11 seasonal efficiency of boiler STOCK..................................................................................................................... 24
Table 12 energy input per boiler category NEW and STOCK.............................................................................................. 24
Table 13 specific CO2 emission factors .............................................................................................................................. 26
Table 14 contribution of direct emissions to annual emission........................................................................................... 27
Table 15 CO2 emissions per unit in boiler STOCK .............................................................................................................. 31
Table 16 specific NOx emission factors .............................................................................................................................. 33
Table 17: Share of otto-engine driven cogeneration boilers in NEW sales and STOCK...................................................... 34
Table 18 NOx emissions per unit in boiler STOCK .............................................................................................................. 35
Table 19 specific CO emission factors ................................................................................................................................ 36
Table 20 CO emissions per unit in boiler STOCK ................................................................................................................ 37
Table 21 specific PM emission factors ............................................................................................................................... 38
Table 22 PM emissions per unit in boiler STOCK................................................................................................................ 40
Table 23 specific OGC emission factors.............................................................................................................................. 41
Table 24 OGC emissions per unit in boiler STOCK.............................................................................................................. 42
Table 25: Overview of specific emissions by boiler category and source .......................................................................... 49
Table 26 correction by turndown ratio .............................................................................................................................. 58

6
Table 27 correction by pilot flame ..................................................................................................................................... 59
Table 28 overall etas calculation........................................................................................................................................ 59
List of equations
Equation 1: energy input = reference thermal output / etas............................................................................................. 16
Equation 2: reference thermal output = rated capacity * equivalent hours...................................................................... 16
Equation 3 Basics of calculation of ETAS for hybrid boilers ............................................................................................... 21
Equation 4: GWP * mass * (annual loss + EOL loss/life).................................................................................................... 27
Equation 5: calculation of specific CO2 emissions per kWh thermal output - oil/gas/solid fuel boilers ............................ 28
Equation 6: calculation of specific CO2 emissions per kWh thermal output - gas hybrid boilers ...................................... 28
Equation 7: calculation of specific CO2 emissions per kWh thermal output - electric heat pump boilers ........................ 29
Equation 8: calculation of specific CO2 emissions per kWh thermal output - cogeneration boilers ................................. 29

7
Executive Summary
[to complete once draft is accepted]


9
0 Introduction
0.1 Background and aim
This report is the second interim report of the technical background study in support of an environmental product policy for heating systems.
The background study is part of the IPTS (Institute for Prospective Studies in Seville, Spain) effort to support Directorate General Environment (DG ENV) in the development of Ecolabel and Green Public Procurement (GPP) criteria for the specific product group “hydronic central heating systems”. The context of this study is the European Sustainable Consumption and Production (SCP) Action Plan (EC, July 2008) 1, which mentions as pillars the Ecodesign ErP Directive2 , Ecolabel Regulation3 and the Communication on GPP4 .
The technical background study aims to provide:
- a technical/economical/environmental analysis of hydronic central heating systems; - a discussion on which approach to take for setting of criteria levels; - a proposal for criteria levels for hydronic central heating systems; - all other information, calculation, explanation required by the description of tasks.
The study scope, methodology and planning were discussed during the kick-off meeting which took place on February 3rd 2011 at the IPTS premises in Seville, Spain. This deliverable takes the conclusions of that meeting, as discussed in the Inception Report5, into account.
0.2 Scope
In the tender specifications the actual product group within the generic product group ‘heating systems’ was not defined. In the kick-off meeting the following specification of the scope was agreed.
Included are:
- Hydronic central heating boilers, either electric, gas, oil or biomass-fired; - ‘Block heating’ boilers (i.e. a central heating boiler serving multiple apartments within the
same building), providing heat to individual apartments by ‘flat stations’ (tapping heat from the central loop to the individual dwelling) are included.
- Solar thermal heating, heat pumps as well as (micro) CHP systems providing heat to hydronic heating systems. CHP units (combined heat and power units) that serve a single building (as in block heating) are also included;
- As indicated above hydronic central heating systems of which the heat is generated by biomass-boilers are considered within the scope of this study. The main source of information will be the finalized Ecodesign preparatory study 'Lot 15'. The underlying study will give consideration to the discussions regarding the technical standards for measuring efficiency and emissions. The Lot 15 approach on how to consider CO2 emissions and the renewable nature of many fuels (wood pellets, logs) will be adopted. Since several environmental label schemes address these products these labels and other
1 COM (2008) 397 final. 2 Directive 2009/125/EC establishing a framework for the setting of Ecodesign requirements for energy related products. 3 Regulation (EC) No 66/2010 of the European Parliament and the Council of 25 November 2009 on the EU Ecolabel. 4 Communication from the Commission to the European Parliament, the Council, the European Economic and Social Committee and the Committee of the Regions Public Procurement for a better environment (COM/2008/0400). 5 Inception Report of 15 march 2011.

10
relevant developments will be considered, including a discussion on the environmental criteria developed for these products;
The maximum nominal power input6 of boilers considered within this scope is 400 kW (see also discussion regarding Ecodesign proposals in task 2).
Excluded are:
- 'Dedicated water heaters', ie. products specifically designed for production of heated sanitary water (for bathing, showering, cleaning);
- Large scale collective central heating facilities, providing heat to individual end-users by means of ‘district heating’. The reason is that the heat generator itself and the distribution system are outside the sphere of influence of the end-user.
- Central heating systems that provide air-based central heating (where hot air is generated centrally and transported through ducts) are not included as primary subject of the study, since the relevant Ecodesign preparatory study has not been finalized yet. However, some methodological elements (related to stratification and distribution losses) are shared with -but not identical to- hydronic central heating systems. Therefore the developments (if any) will be noted so that if agreement on the issues mentioned is achieved, this shall be reflected in the report, including a discussion on how these products can be considered in the light of the underlying study.
The scope of the study covers central heating in household, commercial and industrial buildings.
0.3 Methodology
The methodology to be applied in the study follows five tasks, as defined in the study tender specifications.
Task 1: Definition and scope
In this task the product scope will be defined, by describing applicable product definitions, product categories and legislation and standards that apply to the product group. Consideration will be given especially to the application of renewable energy in hydronic heating systems (solar thermal systems, heat pumps and biomass as fuel) and micro-CHP.
Task 2: Economic and market analysis
This task covers an economic and market analysis according to the Ecolabel regulation (EC 66/2010 of 25 November 2009). The market analysis will include general trends within the product group as regards product features, the current and future potential for market penetration of the product group, and will consider possible trade issues.
Task 3: Technical analysis
In this task a life cycle model will be constructed which will allow comparison of environmental aspects of central heating systems across various categories (electric, gas, oil, biomass-fired, including consideration of solar heating, heat pumps and micro-CHP).
6 The maximum nominal power input of large boilers, refers to the energy input (eg. m3 of gas per hour, expressed as kW, or electric power consumption in kW electric) at nominal conditions. Nominal conditions are standardized test conditions (aka standard rating conditions) and usually refer to the maximum power input of the boiler (which may occur in normal operating conditions and can be sustained over a certain length of time) for certain set system parameters (flow rate of medium, etc.). It is therefore not the same as the maximum power output, because the boiler introduces generator losses (except for heat pumps, where the nominal power input in electric kW is lower than the power output in kW of heat, since the renewable energy input is not counted). However, for smaller boilers (e.g. <50 kW) the nominal rating often refers to OUTPUT power.

11
Task 4: Policy analysis
In this task the possible impacts of Ecolabel and GPP requirements are described.
Task 5: Elaboration of draft criteria and technical reports
In this task the possible criteria for Ecolabel and GPP requirements, plus the supporting analysis will be described.
The project deliverables will meet the criteria for such documents as established by the Ecolabel Regulation EC 66/2010.
This second Interim report covers:
- Task 4 (policy analysis); - Task 5 (elaboration of draft criteria and technical reports),
The task are not finalized yet, awaiting feedback from the second stakeholder meeting to be held in Brussels at 29th November 2011.

12
1 Task 4: Policy analysis [draft]
This task comprises an impact analysis of various policy options. The impacts shall cover both the technical aspects of products as well as the environmental impacts of applying policy measures.
1.1 Method
The main goal of this task is the setting up of scenario's that describe "a possible future" in which Ecolabels and GPP criteria change the current trends. These scenarios will be set up in close collaboration with IPTS/DG ENV so that the conclusions are shared by all involved.
The analysis is split up into a quantitative task, in which a stock model is applied to quantify savings on energy consumption and emissions, and a qualitative task, in which the impacts of possible criteria on feasibility/applicability are discussed.
Quantitative impact analysis on energy and emissions
The "Business-as-usual" scenario is set up as a stock model calculation, which calculates the effects of changes in the stock ("STOCK") through changes in sales and product characteristics of new products entering the stock ("NEW"). The analysis is quantitative because the model calculates for the years 2010-20307 the environmental aspects of the stock (energy consumption and environmentally relevant emissions) :
1. Energy consumption (TWh/year); 2. CO2 eq. emissions (mton/year); 3. NOx emissions (kton/year); 4. CO emissions (kton/year); 5. PM emissions (kton/year); 6. OGC emissions (kton/year).
SOx is not considered since the emissions are solely due to the presence of Sulphur in the fuel and are not influenced by boiler parameters.
Alternative scenario's are calculated by changing the product characteristics of a certain percentage of sales of new products.
The calculation of other scenario's will follow the establishment of potential Ecolabel/GPP criteria according Task 5.
Qualitative impact analysis on technical aspects
This analysis describes the technical changes of products (if applicable) in the alternative scenario's and what other effects can be expected. It will address issues such as technical feasibility of alternative central heating technologies, affordability, requirements relating to energy infrastructure, etc.
1.2 Quantitative analysis on energy and emissions (aka 'stock model')
The analysis is for the moment limited to boilers only. The effects of applying solar thermal systems will be added to the calculations at a later stage.
7 Preceding years, as of 1990 (or even 1980 for certain products/aspects), are also calculated, but this is mainly done to produce a realistic stock as of 2010.

13
1.2.1 Appliance categories
Following comments by stakeholders during the first stakeholder meeting, the range of product categories is expanded compared to the life-cycle calculation (see previous report on Task 3).
The category gas/oil boilers in M/XXl class has been split up into a separate gas and oil boiler category. Additions are:
- Gas absorption heat pumps: GAHP - Gas engine compressor heat pumps (using internal combustion engine = ICE): gas ICE HP - Coal boilers,
Together wit the previously defined categories, there are now 12 boiler categories considered in the stock model. For each category a representative rated capacity has been established (kW thermal output). The contribution of solar thermal system will be modelled on the basis of their overall contribution (to complement].
Table 1 Overview of boiler categories Fuel/energy type
Category Remark
Oil 01_oil boiler The energy consumption, emissions and improvement potential can be represented by a single category.
02_gas boiler The category energy consumption, emissions and improvement potential can be represented by a single category.
Gas
03_gas hybrid
Electricity 04_elec.HP
05_gas abs. HP Gas
06_gas ICE HP
The analysis considers four types of different heat pumps. The "03_" is the hybrid heat pump, combined with a gas-fired boiler. Current sales are very low, but this type of product is believed to be a good improvement upon the already very efficient gas condensing boilers. The "04_" is the electric (compressor) heat pump, that covers both ground coupled (water, brine, DX) and air-based heat pumps. The efficiencies and emissions are assumed to represent the average (by sales) of all these categories. The "05_" group is the gas absorption heat pump, which is slowly entering the market and offers better efficiency than gas fired condensing boilers. The "06_" type is the gas (internal combustion engine) driven compressor heat pump, which has different characteristics to the gas absorption heat pump.
Coal 07_coal boiler
08_small/wood manual
09_small/wood autom.
10_small/pellet
Biomass
11_large/chips
Of the category solid fuel boilers, the coal boiler has been added at specific request. although sales and significance at EU level (as applied in central heating systems) are minute. Of the biomass options, the range of categories is represented by small manual stoked wood (log) boilers (currently the largest share in sales and stock, although envisaged to be surpassed by pellet boilers), small automatically stoked wood (log) boilers (with draught assist), small pellet-fired boilers (also automatically stoked) and large wood chip boilers. These boilers represent the most popular types of biomass boilers and are considered representative for central heating based energy consumption and emissions by biomass boilers.
Gas 12_cogeneration This category applies to both Stirling-based micro-CHP (e.g. Remeha's eVita') as well as small ICE-based micro-CHP (e.g. Senertec DACHS). The capacity, efficiency and emissions are calculated on the basis of estimated share of products in overall cogeneration sales.
Solar 13_solar thermal ('000 m2) Solar systems can be in principle combined with any product, at various sizes, but this leads to a proliferation of options that can not be handled. in order to simplify the calculations the effects of solar thermal systems will be based on the EU wide sales/stock of m2 solar systems, and not combined with individual appliance categories.

14
1.2.2 Sales and stock
The stock or the total of boilers installed (indicated by the designation "STOCK") is calculated on the basis of annual sales or the total of new boilers enterring the stock (indicated by the designation "NEW") and the average product life (which is used to calculate the removal of boilers from stock).
The annual sales have been estimated as follows: For non-solid fuel boilers, including electric heat pumps, the sales have been kept identical to what has been established in the Lot 1 study. These sales range from 6.6 million boilers in 2005 to an expected 8 million boilers in 2020-2030. The sales share of electric heat pumps in the overall boiler sales has been tuned to most recent absolute sales data and indications of installed stock of electric heat pumps (EHPA, 2011).
The sales of gas absorption heat pumps take into account the information provided by Robur. The sales of hybrid boilers and gas ICE heat pumps have been estimated.
The sales of solid fuel boilers have been added to the total and follow the expectations established in the lot 15 study.
The sales of cogeneration boilers have been based on current sales data of the Senertec DACHS units and estimates regarding future sales of Stirling based wall hung cogeneration units.
Table 2 boiler sales per category Sales NEW (% and '000) 1990 1995 2000 2005 2010 2015 2020 2025 2030
Total 'non-solid' fuel Lot 1 ('000) 4778 5520 5993 6600 6952 7432 7911 8100 8200
Heat pump share, of total CH boiler (%) 0% 0,1% 0,7% 1,7% 7% 11% 15% 20% 25%
- of which electric HP 100% 100% 100% 100% 100% 99% 98% 95% 84%
- of which GAHP 0% 0% 0% 0% 0,3% 0,6% 1,8% 5,4% 15,0%
- of which gas ICE 0% 0% 0% 0% 0,02% 0,04% 0,06% 0,08% 1,00%
Fossil share, of total CH boiler (%) 100% 100% 99% 98% 94% 89% 85% 80% 75%
- of which gas 82% 84% 86% 88% 90% 91% 90% 88% 81%
- of which gas hybrid 0% 0% 0% 0% 0,05% 0,8% 4,0% 7,5% 15%
- of which oil 18% 16% 14% 12% 10% 8% 6% 5% 4%
Solid fuel total ('000) 217 241 265 289 356 389 343 296 250
- of which coal CH 5% 4% 4% 4% 1% 1% 1% 1% 1%
- of which small_wood manual 85% 77% 70% 64% 23% 22% 14% 10% 3%
- of which small_wood autom. 10% 13% 16% 18% 62% 58% 64% 69% 75%
- of which small_pellet 0% 1% 2% 2% 13% 18% 20% 20% 21%
- of which large_chips 0% 5% 9% 12% 0% 0% 0% 0% 0%
Cogeneration 0 0 0,5 1,75 3,5 10 40 54 73
Solar thermal ('000 m2) 42,9 250 750 2100 2454 3121 3788 4455 5122

15
The table below shows sales in absolute values ('000).
Table 3 boiler sales absolute values Sales ('000) 1990 1995 2000 2005 2010 2015 2020 2025 2030
01_oil boiler 860 882 833 779 650 529 403 324 246
02_gas boiler 3918 4632 5118 5709 5847 6036 6052 5670 4982
03_gas hybrid 0,0 0,0 0,0 0,0 3 50 269 486 923
04_elec.HP 0 6 42 112 451 812 1165 1531 1722
05_gas abs. HP 0 0 0 0 1 5 21 87 308
06_gas ICE HP 0 0 0 0,0 0,1 0,3 0,7 1,3 20,5
07_coal boiler 11 11 11 11 4 4 3 3 2
08_small/wood manual 185 185 185 185 83 87 50 28 6
09_small/wood autom. 22 32 42 53 222 226 220 205 187
10_small/pellet 0 2 4 7 46 71 69 59 53
11_large/chips 0 11 23 34 2 1 1 1 1
12_cogeneration 0 0 0,5 1,75 3,5 10 40 54 73
13_solar thermal ('000 m2) 42,9 250 750 2100 2454 3121 3788 4455 5122
Product life
In order to quantify the stock, the sales have been cumulated according the product life. The calculation takes into account the trend in reduced product life (older boilers had longer product lives). Modern boilers currently have an average product life of 15 years.
The table below present the average product life assumed for the boiler categories.
Table 4 boiler product life Product life of boiler, years
1990 1995 2000 2005 2010 2015 2020 2025 2030
01_oil boiler 23 22 21 20 19,5 19 18,5 18 17,5
02_gas boiler 22 20,5 19 17,5 17 16,5 16 15,5 15
03_gas hybrid 15 15 15 15 15 15 15 15 15
04_elec.HP 15 15 15 15 15 15 15 15 15
05_gas abs. HP 15 15 15 15 15 15 15 15 15
06_gas ICE HP 15 15 15 15 15 15 15 15 15
07_coal boiler 26 24 22 20 20 20 20 20 20
08_small/wood manual 26 24 22 20 20 20 20 20 20
09_small/wood autom. 26 24 22 20 20 20 20 20 20
10_small/pellet 26 24 22 20 20 20 20 20 20
11_large/chips 26 24 22 20 20 20 20 20 20
12_cogeneration 15 15 15 15 15 15 15 15 15
13_solar thermal ('000 m2) 20 20 20 20 20 20 20 20 20

16
Stock (installed base)
The accumulation of sales over the product life produces the stock of boilers. The table below presents the quantification.
Table 5 boiler STOCK absolute value Stock ('000) 1990 1995 2000 2005 2010 2015 2020 2025 2030
01_oil boiler 17967 17708 17469 17037 15810 13979 11671 9241 7049
02_gas boiler 55090 67121 76160 81911 88884 92977 94229 92119 86153
03_gas hybrid 0 0 0 0 8 140 937 2816 6205
04_elec.HP 0 14 132 518 1911 4950 9507 14839 19815
05_gas abs. HP 0 0 0 0 3 18 84 353 1325
06_gas ICE HP 0 0 0 0 0 1 4 9 62
07_coal boiler 215 215 215 215 198 162 125 86 62
08_small/wood manual 3697 3697 3697 3697 3442 2942 2361 1631 1048
09_small/wood autom. 116 250 433 640 1244 2230 3159 3984 4278
10_small/pellet 0 6 22 50 181 467 799 1090 1239
11_large/chips 0 28 113 255 344 324 245 109 25
12_cogeneration 0 0 1 7 20 53 172 395 678
13_solar thermal ('000 m2) 107 840 3340 10465 21741 34944 49716 63198 75756
Total stock (excl. solar) 77085 89039 98243 104330 112044 118244 123292 126672 127940
1.2.3 Energy input
In order to quantify the energy consumption and emissions the approximate energy input for each boiler category is calculated. This energy input is calculated on the basis of two main boiler characteristics (rated capacity and seasonal efficiency 'etas') and assumptions regarding the reference thermal output (calculation using equivalent hours) according the equations below:
Equation 1: energy input = reference thermal output / etas where:
Equation 2: reference thermal output = rated capacity * equivalent hours
The thermal output is an intermediate output and not an indicator for final useful heat demand as defined by Lot 1, since it includes energy that is lost elsewhere in the system, either as distribution or control (stratification, fluctuation) losses.
17
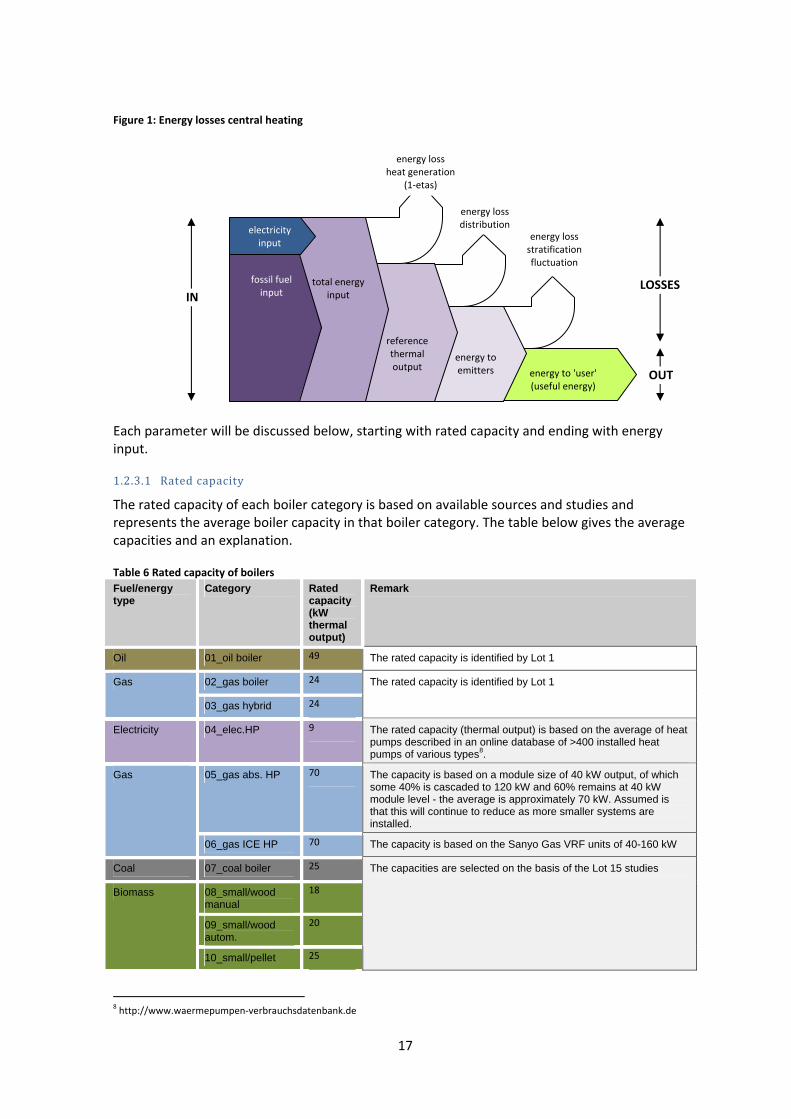
Figure 1: Energy losses central heating
Each parameter will be discussed below, starting with rated capacity and ending with energy input. 1.2.3.1 Rated capacity The rated capacity of each boiler category is based on available sources and studies and represents the average boiler capacity in that boiler category. The table below gives the average capacities and an explanation.
Table 6 Rated capacity of boilers Fuel/energy type
Category Rated capacity (kW thermal output)
Remark
Oil 01_oil boiler 49 The rated capacity is identified by Lot 1
02_gas boiler 24 Gas
03_gas hybrid 24
The rated capacity is identified by Lot 1
Electricity 04_elec.HP 9 The rated capacity (thermal output) is based on the average of heat pumps described in an online database of >400 installed heat pumps of various types8.
05_gas abs. HP 70 The capacity is based on a module size of 40 kW output, of which some 40% is cascaded to 120 kW and 60% remains at 40 kW module level - the average is approximately 70 kW. Assumed is that this will continue to reduce as more smaller systems are installed.
Gas
06_gas ICE HP 70 The capacity is based on the Sanyo Gas VRF units of 40-160 kW
Coal 07_coal boiler 25
08_small/wood manual
18
09_small/wood autom.
20
Biomass
10_small/pellet 25
The capacities are selected on the basis of the Lot 15 studies
8 http://www.waermepumpen-verbrauchsdatenbank.de
energy to 'user' (useful energy)
energy loss stratification fluctuation
energy to emitters
energy lossdistribution
reference thermal output
energy lossheat generation
(1-etas)
total energy input
fossil fuel
input
electricity input
IN
OUT
LOSSES

18
11_large/chips 160
Gas 12_cogeneration 18 This capacity for 2010 applies to the DACHS units, and reduces up to 2030 due to increasing sales of smaller Stirling units (gas driven, wall hung) of some 6 kW output.
Solar 13_solar thermal ('000 m2)
m2 The capacity of the solar system varies according the system size installed. This study will base savings on the overall EU installed sales and installed capacity (not per installation, but per m2).
1.2.3.2 Equivalent hours The equivalent hours are a representation of the number of hours the boiler will run at rated capacity to produce the reference thermal output.
In reality the number of actual running hours primarily depend on (heating season kept equal) the modulation range of the boiler, which also affects the average capacity provided: Boilers with a relatively large modulation range will run longer hours, but at lower capacities. Boilers with a very small modulation range will run less hours, but at high (rated )capacity - usually such boilers are combined with a thermal storage to allow even distribution of energy. And then there are numerous other aspects that determine running hours in real life as well, such as control strategy, thermal mass of building, etc. .
The stock model can not take incorporate all these aspects and determine equivalent hours for each boiler specifically. Therefore it is assumed that the equivalent hours for each boiler is 1250 hours per year, for the reference year 2010. This value corresponds to numbers that have been found for boilers (like gas boilers, but also heat pumps) in other studies and closely resembles the value applied in prEN14825, in the calculation of the seasonal performance of heat pumps9.
The equivalent hours are also used to model another aspect that governs the total energy input of boilers: the diminishing heat demand of buildings.
The current average heat demand of buildings has decreased over the last decades and it is expected to continue to do so. This is because continued efforts to improve the thermal performance of buildings and by reducing heat losses due to ventilation (more buildings with heat recovery) and infiltration (less air leaks). In order to take this effect of reducing heat demand into account, the equivalent hours for the years after 2010 are reduced (and vice versa for preceding years). The rate of demand reduction is estimated to be 0.5%. This is of course a simplification of reality, but for the purpose of introducing in the calculation these lower heat demands in future buildings it is considered adequate.
This leads to the following approximation of equivalent hours over the period 1990-2030.
9 prEN 14825 uses 1400 hours as equivalent hours, but applying this value to all boilers in the stockmodel led to high energy consumption which distorted the overall calculation of energy input to CH boilers. Therefore the value of 1250 hours was selected as most representative accross the whole range in boiler categories.

19
Table 7 equivalent hours Equivalent full load hrs. (is factor representing reducing heat demand)
% demand increased by % left value
reference hrs./a, average climate
demand reduced by % right value %
01_oil boiler 0,5% 1417 1382 1348 1314 1282 1250 1219 1189 1159 1131 1103 0,5%
02_gas boiler 0,5% 1417 1382 1348 1314 1282 1250 1219 1189 1159 1131 1103 0,5%
03_gas hybrid 0,5% 1417 1382 1348 1314 1282 1250 1219 1189 1159 1131 1103 0,5%
04_elec.HP 0,5% 1417 1382 1348 1314 1282 1250 1219 1189 1159 1131 1103 0,5%
05_gas abs. HP 0,5% 1417 1382 1348 1314 1282 1250 1219 1189 1159 1131 1103 0,5%
06_gas ICE HP 0,5% 1417 1382 1348 1314 1282 1250 1219 1189 1159 1131 1103 0,5%
07_coal boiler 0,5% 1417 1382 1348 1314 1282 1250 1219 1189 1159 1131 1103 0,5%
08_small/wood manual 0,5% 1417 1382 1348 1314 1282 1250 1219 1189 1159 1131 1103 0,5%
09_small/wood autom. 0,5% 1417 1382 1348 1314 1282 1250 1219 1189 1159 1131 1103 0,5%
10_small/pellet 0,5% 1417 1382 1348 1314 1282 1250 1219 1189 1159 1131 1103 0,5%
11_large/chips 0,5% 1417 1382 1348 1314 1282 1250 1219 1189 1159 1131 1103 0,5%
12_cogeneration 0,5% 1417 1382 1348 1314 1282 1250 1219 1189 1159 1131 1103 0,5%
1.2.3.3 Reference thermal output The reference thermal output of the boilers can now be calculated by multiplying the rated capacity with the equivalent hours.
Table 8 reference thermal output STOCK Thermal output, kWh_th/yr per unit
1990 1995 2000 2005 2010 2015 2020 2025 2030
01_oil boiler 66522 64876 63270 61704 60177 58687 57235 55818 54436
02_gas boiler 16255 15852 15460 15077 14704 14340 13985 13639 13301
03_gas hybrid 32509 31704 30920 30154 29408 28680 27970 27278 26603
04_elec.HP 14554 13405 12305 11250 10484 9749 9044 8368 7719
05_gas abs. HP 94333 91998 89721 87500 76801 66578 56814 47492 38597
06_gas ICE HP 94333 91998 89721 87500 85334 83222 81162 79153 77194
07_coal boiler 33690 32856 32043 31250 30477 26750 23479 20608 17700
08_small/wood manual 24257 23657 23071 22500 21943 19260 16905 14838 12744
09_small/wood autom. 26952 26285 25634 25000 24381 21400 18783 16487 14160
10_small/pellet 33690 32856 32043 31250 30477 26750 23479 20608 17700
11_large/chips 215617 210281 205076 200000 195050 171200 150266 131892 113277
12_cogeneration 24257 23657 23071 22500 18286 14267 10435 10177 9925
13_solar thermal ('000 m2)
0 0 0 0 0 0 0 0 0
The thermal output for NEW and STOCK boilers is kept identical since many boilers sales are replacement sales.

20
1.2.3.4 Efficiency The conversion factor between the reference thermal output and the energy input is the boiler seasonal efficiency, 'etas'.
The 'etas' is calculated where possible according the latest ecodesign proposals.
Gas, oil and (monovalent) heat pumps
'Etas' of gas, oil and heat pump boilers (monovalent, ie. using only fossil fuel OR electricity, not both) was established/calculated using the formulas to be used by the ecodesign/energy labelling requirements for central heating boilers.
The calculation (version March 2011) is based upon/takes into account the useful steady-state efficiency at full load and part load, corrected by contributions accounting for turndown ratio, temperature control, auxiliary electricity consumption, standby heat loss, ignition flame energy consumption, and in addition for cogeneration boilers the seasonal electric efficiency.
The overall seasonal space heating energy efficiency ‘etas’ for the gas boiler example is then:
Table 9 example of calculation etas etas etason F(1) F(2) F(3) F(4) F(5) F(6)
correction for: seasonal space heating energy efficiency
seasonal steady state thermal efficiency turndown
ratio control protocol
auxiliary electricity
standby heat loss
pilot flame
cogeneration
etas = 0.972 0 0.025 0.01 0.004 0 0
etas = 97.2% 2.5% 1% 0.4%
etas = 93.2%
etas = etason - sumF(1-6) = 93.6%
For electric heat pumps the etas is is expressed in primary energy and can be corrected by a conversion factor of 2.5 to represent the ratio of electric input versus thermal output.
For gas-driven heat pumps the etas is also expressed in primary energy and the auxiliary electric energy input (if applicable) is assumed to be incorporated in the etas (suing the same 2.5 conversion factor between primary and secundary energy).
Solid fuel (incl. biomass) boilers
For biomass boilers the etas was approximated on the basis of useful efficiency at full load (100%) and part load (30%) and then reduced by 15% to correct for various losses (from cycling, auxiliary energy consumption, control losses, standby losses). The value of 15% is as applied in the Lot 15 study, but may need to be tuned/aligned with the actual calculation as applied in the ecodesign /energy label for CH boilers. This can only be done after the 'ecodesign calculation' has been made definite.
Gas hybrid boiler
The gas hybrid boiler is bivalent because it uses both gas and electricity as energy input. Therefore, when calculating the energy input (and related emissions) the total energy input must be split up into a share for gas and a share for electricity.
The calculation principle is based on a switch-over point ("T_BE" in figure below), the temperature below which the gas boiler takes over the heat supply from the heat pump. This point should

21
ideally be at the point below which the primary efficiency of the gas boiler is higher than that of the heat pump.
The calculation of the overall efficiency is then according the equations below:
Equation 3 Basics of calculation of ETAS for hybrid boilers
Where:
ETAS = Seasonal space heating energy efficiency for bivalent or hybrid system
T_BE = Temperature at which the (primary) heatpump efficiency equals the primary boiler efficiency . Value depends on climate (warm, average, cold) and heat pump temperature application (medium, low). Below this temperature it is assumed the boiler will fulfill the heat demand, above this temperature the heat pump will supply the heat demand.
Tdesign = The lowest outside temperature pertaining to the assumed climate (heating season) profile.
16 = is the outside temperature above which no heat demand is assumed pertaining to the assumed climate (heating season) profile (ºC).
ETAboiler = Reference boiler energy efficiency (significant for the energy part supplied by the boiler) (%).
ETAheatpump = Reference heat pump efficiency COP (significant for the energy part supplied by the heat pump). Value depends on climate (warm, average, cold) and temperature application (medium, low)=hybrid coefficient of performance (%).
According the 'bin-method' the representative COP is at T = +7ºC as this temperature occurs most frequently.

22
In order to introduce this concept in the calculation of the "ecodesign installer label' the following correction on ETAboiler ("I") is proposed. Note: It is possible to apply the same principle to 'low temperature' heat pump application, which would result in a higher overall efficiency, but for the stock model the calculation is limited to medium applications only.
Figure 2 Calculation of correction on ETAboiler for medium temperature heat pumps (for average climate)
The etas of this configuration (example) is thus: 94% + 27% = 121%
For the purpose of this study it is assumed that an average hybrid boiler has a gas share in the thermal output of 50%, which primarily depends on the identification of the bivalent point (this is the outside temperature point below which the gas boiler takes over from the heat pump, here chosen at +3ºC)10. The remaining 50% of thermal output is delivered by the heat pump part.
This calculation of the gas/heat pump share is in line with indicative calculations by a supplier of a hybrid boiler 11 in which the share of gas in the thermal output is between 40-50% depending on assumptions regarding supply/return temperatures, overall heat demand, energy content of gas, etc.
Note that for the boiler efficiency of the configuration a relative high etas is chosen (94%) which is more representative than the average NEW boiler (etas is 87% in 2010). Also the efficiency of the heat pump part is higher, since the heat pump does not operate in the coldest conditions, which increases efficiency. The efficiency of the heat pump part of the hybrid boiler is set at SCOP 3.7 (comparable to etas 148%, instead of 140% for an average NEW heat pump in 2010).
Combined this results in an overall primary efficiency of 122% (NEW appliance 2010). This 'etas' needs to be confirmed by the final method for calculating 'etas' as defined in the ecodesign measures, possibly supplemented by supporting calculations by suppliers.
10 The calculationis based on the 'average climate / heating season' as identified in the prEN14825 standard for calculating the seasonal performance of heat pumps.
11 http://www.techneco.nl/besparingsberekening

23
Cogeneration
The model uses one single set if inputs to cover the two most popular types of cogeneration (micro-CHP) boilers. The highest sales are currently achieved by the Senertec DACHS, with some 5-5,5 kW electric output and 12-15 kW thermal output, indicating an average electric efficiency of over 25%. Sales of this unit are over 3000 units per year, and the model assumes a modest increase in sales.
On the other side there are wall hung gas boilers combined with Stirling generators, which produce on average about 0.9 kW electric power and 5 kW thermal power, indicating an electrical efficiency of some 15% (a gas backup boiler can boost the power capacity to average gas boiler values of 22 kW, but the Stirling power unit is sized to meet average base load demands). Expectations for the Stirling engine powered unit are much higher, with forecasts predicting sales in excess of 10.000 units per year. Therefore the stock model is tuned towards this latter product, although in a future version more detail may be added.
For the cogeneration boiler it is assumed that the thermal efficiency is 67%. This is relatively low, but this value does not yet include the production of electricity as output. The overall energy efficiency, including the electricity generation part is much higher: some 67% thermal efficiency and 15% electric efficiency, gives 82% overall efficiency. If the production of electricity is corrected for the displacement of electricity from the public grid, the overall efficiency on primary basis increases (grid conversion losses are avoided) and reaches some 105%. This is congruent with the calculation of 'etas' according the ecodesign proposals.
***
The table below shows the efficiencies for the boiler categories considered in the stock model calculation.
Table 10 seasonal efficiency (etas) per boiler category NEW Efficiency NEW, etas (GCV)
1990 1995 2000 2005 2010 2015 2020 2025 2030
01_oil boiler 71% 74% 77% 80% 82% 84% 84% 84% 84%
02_gas boiler 76% 79% 82% 85% 87% 89% 89% 89% 89%
03_gas hybrid 111% 115% 118% 121% 122% 123% 123% 123% 123%
04_elec.HP 131% 134% 137% 140% 140,5% 140% 140% 140% 140%
05_gas abs. HP 131% 134% 137% 140% 140% 140% 140% 140% 140%
06_gas ICE HP 131% 134% 137% 140% 140% 140% 140% 140% 140%
07_coal boiler 68% 66% 65% 64% 64% 64% 64% 64% 64%
08_small/wood manual
65% 60% 55% 50% 50% 50% 50% 50% 50%
09_small/wood autom.
65% 66% 66% 66% 66% 66% 66% 66% 66%
10_small/pellet 67% 67% 68% 69% 69% 69% 69% 69% 69%
11_large/chips 67% 68% 69% 70% 70% 70% 70% 70% 70%
12_cogeneration 67% 67% 67% 67% 67% 67% 67% 67% 67%
The efficiencies of appliances using or producing electric power are calculated using an overall primary energy factor of 2.5. This factor is of course different per Member State but in order to keep the calculations and conclusions for the EU straightforward, only the factor 2.5 is used in the calculation (representative for EU average).

24
The efficiency of the stock is based on the efficiency of NEW boilers, but then corrected for their average age.
Table 11 seasonal efficiency of boiler STOCK Efficiency STOCK, etas (GCV)
1990 1995 2000 2005 2010 2015 2020 2025 2030
01_oil boiler 64% 67% 71% 74% 77% 80% 82% 84% 84%
02_gas boiler 69% 73% 76% 80% 83% 86% 88% 89% 89%
03_gas hybrid 106% 110% 113% 116% 120% 122% 123% 123% 123%
04_elec.HP 127% 130% 133% 136% 139% 140% 140% 140% 140%
05_gas abs. HP 127% 130% 133% 136% 139% 140% 140% 140% 140%
06_gas ICE HP 127% 130% 133% 136% 139% 140% 140% 140% 140%
07_coal boiler 71% 69% 68% 66% 65% 64% 64% 64% 64%
08_small/wood manual 78% 72% 66% 60% 55% 50% 50% 50% 50%
09_small/wood autom. 65% 65% 65% 66% 66% 66% 66% 66% 66%
10_small/pellet 65% 65% 66% 67% 68% 69% 69% 69% 69%
11_large/chips 64% 66% 67% 68% 69% 70% 70% 70% 70%
12_cogeneration 67% 67% 67% 67% 67% 67% 67% 67% 67%
1.2.3.5 Energy input With the reference thermal output and the efficiency known, the actual (primary) energy input can be calculated. The table below shows the primary energy input per boiler per year for both NEW boilers and STOCK boilers for 2010-2030.
Note that boiler category 04_electric heat pump is already converted to electricity, whereas for 03_gas hybrid the input still refers to primary energy only (because the energy input is bivalent, the electric energy input is expressed in primary fuel).
For the cogeneration boiler the energy input is not corrected for the electricity production because the energy input value is needed to calculate the emissions of the gas input. Later on, the emissions of the cogeneration boiler will also be corrected for the electricity production part.
Table 12 energy input per boiler category NEW and STOCK NEW STOCK
Energy input kWh energy (fuel/electric)/yr per unit
2010 2015 2020 2025 2030 2010 2015 2020 2025 2030
01_oil boiler kWh_fuel input
103.779
96.255 89.491 83.383 77.999 73.176 69.544 66.450 64.805 103.779
02_gas boiler kWh_fuel input
23.422 21.760 20.262 18.906 17.737 16.733 15.928 15.325 14.945 23.422
03_gas hybrid kWh_fuel input, not allocated to primary and electricity
30.555 28.904 27.368 25.935 24.597 23.555 22.766 22.104 21.557 30.555
04_elec.HP kWh_electricity
4.600 4.136 3.708 3.313 3.018 2.776 2.575 2.382 2.198 4.600
05_gas abs. HP kWh_fuel input
74.571 71.041 67.714 64.576 55.452 47.556 40.581 33.923 27.569 74.571

25
06_gas ICE HP kWh_fuel input
74.571 71.041 67.714 64.576 61.613 59.444 57.973 56.538 55.139 74.571
07_coal boiler kWh_fuel input
47.639 47.425 47.233 47.063 46.743 41.797 36.686 32.200 27.656 47.639
08_small/wood manual
kWh_fuel input
31.099 32.856 34.956 37.500 39.897 38.520 33.810 29.676 25.487 31.099
09_small/wood autom.
kWh_fuel input
41.542 40.364 39.220 38.110 37.054 32.424 28.460 24.980 21.454 41.542
10_small/pellet kWh_fuel input
52.217 50.178 48.229 46.365 44.687 38.768 34.028 29.867 25.652 52.217
11_large/chips kWh_fuel input
334.810
320.550
307.000
294.118
282.681
244.571 214.666 188.417 161.824 334.810
12_cogeneration
kWh_fuel input, uncorrected for electricity output
36.204 35.308 34.434 33.582 27.292 21.294 15.575 15.189 14.813 36.204
1.2.3.6 Energy consumption by boiler STOCK The energy input of the stock is clearly dominated by the share of gas boilers in the stock, and the decline of oil boilers is also clearly visible. Of the alternative boiler options the share of electric and gas hybrid boilers is most visible by 2030 (see assumptions on sales), followed by electric and gas driven heat pumps. The energy input of biomass boilers remains modest, due to the low share in sales/stock.
The overall EU energy input is influenced by both improvements in energy efficiency of boilers and by reductions in the average heat demand of buildings.
Figure 3 energy input to STOCK (primary fuel)

26
This graph includes the necessary corrections from primary energy input to primary and electric energy input/output (for electric heat pumps, hybrid boilers and cogeneration).
With the energy input known for all boiler categories, the emissions can be calculated.
1.2.4 CO2 emissions 1.2.4.1 Specific emission factors - CO2 The CO2 emissions per boiler are characterised by the 'carbon intensity' of the specific fuel (or in case of electricity, the production including transport/distribution). The specific emission values include upstream processes such as the winning, processing and -if applicable- transport of these energy carriers and are expressed on the basis of kWh energy INPUT (not thermal output, the ratio is the seasonal efficiency).
Most values are based upon the [DEFRA 2011] calculation of specific CO2 emissions, except from electricity, which uses the Ecoreport vales from [MEErP 2011]. The factors for 03_gas hybrid and 12_cogeneration are derived from the respective gas input and electric input/output factors.
The emission factor is expressed as emissions per kWh fuel combusted. Since this is mainly dependent on the amount of carbon contained in the fuel, the factors do not change over time (unless a change in upstream factors is taken into account , but in this analysis this is neglected). For electricity the change in time is relevant as the average electricity production is becoming 'cleaner' over the years.
Table 13 specific CO2 emission factors Specific CO2 emission (kg CO2 eq. per kWh input)
1990 1995 2000 2005 2010 2015 2020 2025 2030
01_oil boiler per kWh energy input 0,292
02_gas boiler per kWh energy input 0,202
03_gas hybrid calculated per kWh gas/electric energy input combined
0,336
04_elec.HP kWh electricity as input 0,584 0,52 0,458 0,426 0,394 0,384 0,374 0,365 0,36
05_gas abs. HP per kWh energy input 0,202
06_gas ICE HP per kWh energy input 0,202
07_coal boiler per kWh energy input 0,392
08_small/wood manual
per kWh energy input 0,019
09_small/wood autom.
per kWh energy input 0,019
10_small/pellet per kWh energy input 0,039
11_large/chips per kWh energy input 0,016
12_cogeneration calculated per kWh energy input, excl. correction for electric power output
0,202

27
Direct CO2 eq. emissions from refrigerant leakage
For heat pumps the CO2 equivalent emissions caused by leakage of refrigerants (fugitive emissions) are also taken into account.
These are calculated on the basis of the GWP of the refrigerant, the mass (charge) of the refrigerant, the annual leakage and end-of-life leakage (% of total mass) and the product life (see above). The emission per year is calculated (in which end-of-life leakage is divided by product life)
Equation 4: GWP * mass * (annual loss + EOL loss/life) where:
GWP = the global warming potential of the refrigerant (kg CO2 eq./100 year horizon)
mass = the mass of the nominal refrigerant charge (kg)
annual loss = the annual loss of refrigerant(s) (% of nominal charge)
EOL loss = the end-of-life loss of the refrigerant(s) (% of nominal charge)
The refrigerant applied (in all compression cycle heat pumps) is assumed to be R410a with a GWP of 1890 kgCO2 eq. The refrigerant for the 05_gas absorption heat pump is Ammonia with a GWP of 0 (zero).
The mass is calculated on the basis of the assumption that for each kW thermal heat pump output 0.3 kg refrigerant is needed. For the 03_gas hybrid the thermal output of 24 kW relates to the combined gas boiler part and heat pump part and is divided by 4 on the basis that only 1/4 of the total thermal output is related to the heat pump part (24kW/4 = 6 kW thermal output).
For the 03_gas hybrid a leakage rate of 2% is applied, since this is the average between leakage of 3% by split package systems (with separate indoor and outdoor unit) and 1% annual leakage by single-package units (refrigerant cycle is hermetically sealed).
For the electric heat pump, it is assumed that most units are single package and have a annual leakage of 1%.
For the 05_gas absorption heat pump, 0% leakage is assumed, since the refrigerant is usually ammonia and leakage would be noticed fairly quickly.
For the 06_gas ICE HP the annual leakage is assumed to 4% since this category uses a rotating shaft seal between the engine and the compressor circuit.
The end-of-life leakage is assumed to be identical for all appliances and set at 5%. Higher eol-leakage may occur if no correct infrastructure for handling such appliances exist.
The annual emissions are calculated as:
Table 14 contribution of direct emissions to annual emission INPUTS GWP (kgCO2eq. per kg refrigerant) mass (kg) annual los EOL loss kgCO2 eq. per unit
per year
03_gas hybrid 1890 1,8 3,0% 5% 114
04_elec.HP 1890 2,7 1,5% 5% 94
05_gas abs. HP 0 21,0 0,0% 5% 0
06_gas ICE HP 1890 21,0 4,0% 5% 1687
These emissions are added to the total energy input related emissions of CO2 for those appliances that use refrigerants.

28
1.2.4.2 Emissions NEW per kWh thermal output The CO2 emission per kWh thermal output is an indicator that allows cross category comparison since all emission data is broken down to 1 kWh thermal output.
It is calculated by dividing the CO2 emission per NEW boiler unit, by the thermal output of that unit (applicable to year).
For 01/02/05-11 oil/gas/solid fuel boilers the CO2 emissions per kWh thermal output are calculated as:
Equation 5: calculation of specific CO2 emissions per kWh thermal output - oil/gas/solid fuel boilers
directCO2ηβ
outputheat kWh equiv.kgCO
outputheat kWh emission CO2
boiler
fuel2 +=⎟⎟⎠
⎞⎜⎜⎝
⎛ −
where
fuelβ = the specific CO2 emission factor per specific boiler type (kgCO2eq./kWh fuel input)
boilerη = is the seasonal efficieny (etas) of the specific boiler, calculated as indicated in section 1.2.3
(%)
directCO2 = the contribution of direct emissions (refrigerant loss), expressed per kWh heat output, if applicable (kg.CO2eq./kWh heat output)
For the 03_gas hybrid boiler:
Equation 6: calculation of specific CO2 emissions per kWh thermal output - gas hybrid boilers
directCO2hp
elec
gb
gas2
5.2ηβ%gb)-(1
ηβ * %gb
outputheat kWh equiv.kgCO
outputheat kWh emission CO2
+∗∗
+=⎟⎟⎠
⎞⎜⎜⎝
⎛ −
where:
%gb = the share of the gas boiler in the total heat output (%)
gasβ = the specific carbon emission of the gas boiler part (kg.CO2eq./kWh fuel input)
elecβ = the specific carbon emission of the electric heat pump part (kg.CO2eq./kWh electric input)
gbη= eta_boiler or the seasonal efficiency (etas) of the boiler part for the typical operating
conditions (outside temperature below +3ºC) (%)
hpη= eta_heat pump or the seasonal efficiency (etas, in primary energy) of the heat pump part
for the typical operating conditions (outside temperature above (outside temperature above +3ºC) (%)

29
2.5 = a conversion factor to convert the efficiency relating to primary energy hpη into an efficiency
applicable to electricity.
directCO2 = the contribution of direct emissions (refrigerant loss), expressed per kWh heat output (kg.CO2eq./kWh heat output)
For 04_electric heat pump boiler the CO2 emissions per kWh thermal output are calculated as:
Equation 7: calculation of specific CO2 emissions per kWh thermal output - electric heat pump boilers
directCO25.2*η
βoutputheat kWh equiv.kgCO
outputheat kWh emission CO2
boiler
elec2 +=⎟⎟⎠
⎞⎜⎜⎝
⎛ −
where
elecβ = the specific CO2 emission factor per specific boiler type (kgCO2eq./kWh fuel input)
boilerη = is the seasonal efficieny (etas) of the specific boiler, calculated as indicated in section 1.2.3
(%)
2.5 = a conversion factor to convert the efficiency relating to primary energy boilerη into an
efficiency applicable to electricity.
directCO2 = the contribution of direct emissions (refrigerant loss), expressed per kWh heat output (kg.CO2eq./kWh heat output)
For the 12_cogeneration boiler:
Equation 8: calculation of specific CO2 emissions per kWh thermal output - cogeneration boilers
5.2ηβη
ηβ
outputheat kWh equiv.kgCO
outputheat kWh emission CO2
thermal
eleccogen
thermal
fuel2
∗
∗+=⎟⎟
⎠
⎞⎜⎜⎝
⎛ −
where
fuelβ = the specific CO2 emission factor applicable to the fuel input (here: gas) (kgCO2eq./kWh fuel
input)
thermalη = etason - F(1-5)
cogenη= F(6) {note: F6 is a negative value!}
electricβ = the specific CO2 emission factor applicable to the electricity output (here: kWh electricty)
(kgCO2eq./kWh electricity)
2.5 = a conversion factor to convert the efficiency relating to primary energy cogenη into an
efficiency applicable to electricity.

30
The 12_cogeneration boiler has a relative low thermal efficiency leading to higher gas consumption and therefore higher gas related CO2 emissions. However, it is assumed that 15% of this primary input is converted by the appliance to electric kWh's. This electric output displaces the same amount of electric energy from the electricity grid, the effect of which is introduced in the calculation as a reduction of emissions. The total emissions are the gas related emissions, minus the emissions from electricity produced
On the basis of the calculations above, the CO2 emissions per kWh thermal output are claculated as shown below.
Figure 4 CO2 emissions per kWh thermal output
The comparison shows that the lowest CO2 emissions are achieved by biomass boilers, which is mainly due to political default of zero CO2 combustion emissions.
The best non-biomass boiler emissions are by the electric heat pump due to its high energy efficiency and relatively low CO2 emissions per kWh output12, followed closely by gas heat pumps and the gas hybrid solutions.
The oil boiler is relatively more polluting than the gas boiler due to lower average efficiency and a higher specific emission factors. The most polluting is the coal boiler, which has the worst efficiency and specific emission factor.
12 If the 0.394 kgCO2/kWh input for the electric heat pump (year 2010) is divided by 2.5, the specific emission per primary input is 0.158 kgCO2/kWh, which is lower than that for gas.
31
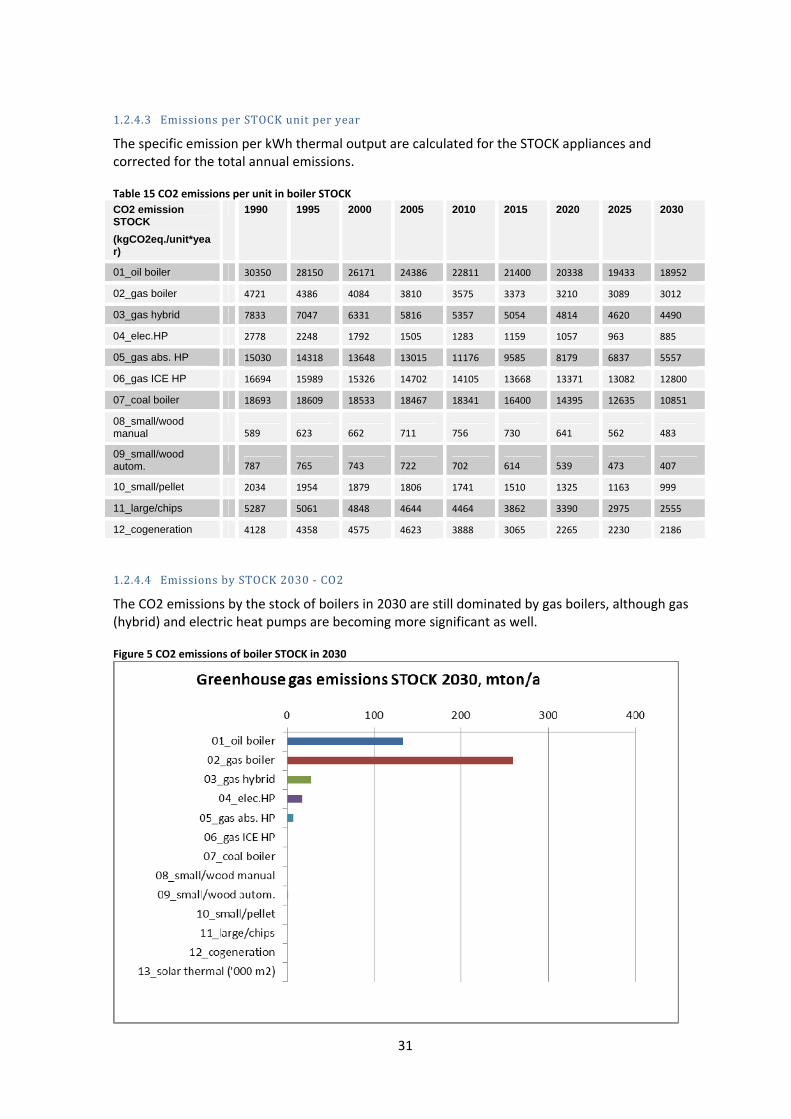
1.2.4.3 Emissions per STOCK unit per year The specific emission per kWh thermal output are calculated for the STOCK appliances and corrected for the total annual emissions.
Table 15 CO2 emissions per unit in boiler STOCK CO2 emission STOCK (kgCO2eq./unit*year)
1990 1995 2000 2005 2010 2015 2020 2025 2030
01_oil boiler 30350 28150 26171 24386 22811 21400 20338 19433 18952
02_gas boiler 4721 4386 4084 3810 3575 3373 3210 3089 3012
03_gas hybrid 7833 7047 6331 5816 5357 5054 4814 4620 4490
04_elec.HP 2778 2248 1792 1505 1283 1159 1057 963 885
05_gas abs. HP 15030 14318 13648 13015 11176 9585 8179 6837 5557
06_gas ICE HP 16694 15989 15326 14702 14105 13668 13371 13082 12800
07_coal boiler 18693 18609 18533 18467 18341 16400 14395 12635 10851
08_small/wood manual
589 623 662 711 756 730 641 562 483
09_small/wood autom.
787 765 743 722 702 614 539 473 407
10_small/pellet 2034 1954 1879 1806 1741 1510 1325 1163 999
11_large/chips 5287 5061 4848 4644 4464 3862 3390 2975 2555
12_cogeneration 4128 4358 4575 4623 3888 3065 2265 2230 2186
1.2.4.4 Emissions by STOCK 2030 - CO2 The CO2 emissions by the stock of boilers in 2030 are still dominated by gas boilers, although gas (hybrid) and electric heat pumps are becoming more significant as well.
Figure 5 CO2 emissions of boiler STOCK in 2030

32
The overall development of CO2 emissions for all boiler categories is indicated in the graph below.
Figure 6 overall development of CO2 emissions of boiler STOCK
Note that the reduction in emissions is both due to an increase in efficiency of boilers, but also by a decrease of heating demand of buildings (due to non-boiler related energy saving measures, such as better thermal insulation, better windows and energy efficient ventilation).
1.2.5 NOx emissions 1.2.5.1 Specific emission factors - NOx
Similar to the calculation of CO2 emissions is the calculation of NOX emissions.
The specific emission factors are indicated below.

33
Table 16 specific NOx emission factors NOx emission NEW, mg/kWh_energy input
1990 1995 2000 2005 2010 2015 2020 2025 2030
01_oil boiler 200 180 160 140 120 120 120 120 120
02_gas boiler 120 107,5 95 82,5 70 70 70 70 70
03_gas hybrid 498 366 298 241 210 198 191 188 185
04_elec.HP 875 625 500 400 350 325 312,5 305 300
05_gas abs. HP 44 44 44 44 44 44 44 44 44
06_gas ICE HP 275 275 275 275 275 275 275 275 275
07_coal boiler 300 300 300 300 300 300 300 300 300
08_small/wood manual
42 42 42 42 42 42 42 42 42
09_small/wood autom.
42 42 42 42 42 42 42 42 42
10_small/pellet 170 170 170 170 170 170 170 170 170
11_large/chips 170 170 170 170 170 170 170 170 170
12_cogeneration 250 250 250 250 228 145 138 138 138
The sources for the factors are indicated in Annex I.
For the electric input (04-electric heat pump) the emissions are based upon EU average emission profile (Annex I)
For the 03_gas hybrid boiler the NOX emissions are based upon the relative gas share / heat pump share in energy input.
For the 12_cogeneration boiler it is assumed that the emissions are based on the respective shares of otto-engine and Stirling-engine driven cogeneration boilers in the stock. .The reason lies in the fact that the cogeneration boilers that use an ('lean burn') otto-engine driving a generator produce relatively high emissions: 500-600 mg/Nm3. However, if a catalyst in the flue exhaust is applied (comparable to car exhaust treatment), emissions could be reduced drastically to <10 mg/Nm3 13. For the calculation of otto-engine driven cogeneration appliances an average emission of 250 mg/kWh is assumed.
The stirling-based cogeneration boilers are more similar to catalytic combustion but appear to remain slightly higher 13 14. For the calculation of Stirling-engine driven cogeneration appliances an average emission of 100 mg/kWh is assumed.
The emissions in the table above have been calculated assuming the presence of otto-engine driven equipment in the stock as indicated below.
13 ProEcoPolyNet - Best Practice Sheet "Experimental examination of different micro-CHP's", May 2005
14 Austrian Energy Agency, "Micro-CHP systems: state-of-the-art", Vienna, March 2006.

34
Table 17: Share of otto-engine driven cogeneration boilers in NEW sales and STOCK Otto-engines in "12_cogeneration" 1990 1995 2000 2005 2010 2015 2020 2025 2030
Total cogeneration NEW sales ('000) 0 0 0,5 1,75 3,5 10 40 54 73
share of otto-engine in NEW sales 100% 100% 100% 100% 85% 30% 25% 25% 25%
share of otto-engine in STOCK 100% 100% 100% 100% 93% 62% 34% 27% 25%
1.2.5.2 Emissions NEW per kWh thermal output The emissions when harmonised per kWh thermal output show large differences over appliance types. Lowest emissions are achieved by the gas absorption heat pump, since this appliance combines a high efficiency with a very low pollution specific emission factor.
NOx emissions from wood biomass boilers are relatively low due to their low specific emission factor (42 mg/kWh fuel input)15. Emissions by pellet and chips boiler apparently emit more NOx, as do other fossil fuel fired boilers.
The gas internal combustion engine and the cogeneration unit have relatively high specific NOx emission factors (more difficult to reduce emissions in these appliances, unless catalyst is used).
Figure 7 NOx emissions per kWh thermal output NEW
15 Boersma, A, et al, "Emissions of the use of biomass fuels in stationary applications", ECN/TNO, table 4-22, p.38, ECN-BKM-2008-81 (assumesNOx emissions of 150 mg/MJ input)

35
1.2.5.3 Emissions per STOCK unit per year For the calculation of STOCK emissions the factors are corrected for the average age of the boiler.
Table 18 NOx emissions per unit in boiler STOCK NOx emission STOCK kg/unit
1990 1995 2000 2005 2010 2015 2020 2025 2030
01_oil boiler 2,08 1,93 1,79 1,50 1,24 1,01 0,83 0,80 0,78
02_gas boiler 0,34 0,26 0,24 0,20 0,16 0,13 0,11 0,11 0,10
03_gas hybrid 0,79 0,57 0,47 0,37 0,31 0,26 0,24 0,23 0,22
04_elec.HP 0,40 0,26 0,19 0,13 0,11 0,09 0,08 0,07 0,07
05_gas abs. HP 0,33 0,31 0,30 0,28 0,24 0,21 0,18 0,15 0,12
06_gas ICE HP 2,05 1,95 1,86 1,78 1,69 1,63 1,59 1,55 1,52
07_coal boiler 2,28 1,42 1,42 1,41 1,40 1,25 1,10 0,97 0,83
08_small/wood manual 0,21 0,14 0,15 0,16 0,17 0,16 0,14 0,12 0,11
09_small/wood autom. 0,28 0,17 0,16 0,16 0,16 0,14 0,12 0,10 0,09
10_small/pellet 1,42 0,85 0,82 0,79 0,76 0,66 0,58 0,51 0,44
11_large/chips 9,09 5,45 5,22 5,00 4,81 4,16 3,65 3,20 2,75
12_cogeneration 0,43 0,55 0,60 0,64 0,51 0,31 0,16 0,14 0,14
In this table the values for 04_gas hybrid have been corrected for electric power input and the values for 12_cogeneration have been corrected for electricity output. 1.2.5.4 Emissions by STOCK 2030 - NOx The NOX emissions of the boiler stock in 2030 are still very much dominated by gas boilers, although the increased penetration of heat pumps, makes their emissions also more significant.
Figure 8 NOx emissions of boiler STOCK in 2030

36
1.2.6 CO emissions 1.2.6.1 Specific emission factors - CO Similar to the calculation of CO2 emissions is the calculation of CO emissions.
The specific emission factors are indicated below.
Table 19 specific CO emission factors CO emission NEW mg/kWh_energy input
1990 1995 2000 2005 2010 2015 2020 2025 2030
01_oil boiler 120 100 80 60 37,32 6,6 6,6 6,6 6,6
02_gas boiler 50 50 50 50 43,8 19 19 19 19
03_gas hybrid 33 30 28 26 22 14 14 14 14
04_elec.HP 25 22 19 16 12,5 12,5 12,5 12,5 12,5
05_gas abs. HP 50 50 50 50 43,8 19 19 19 19
06_gas ICE HP 200 200 200 200 175,2 76 76 76 76
07_coal boiler 738 738 738 738 738 738 738 738 738
08_small/wood manual
1600 1600 1600 1600 1600 1600 1600 1600 1600
09_small/wood autom.
160 160 160 160 160 160 160 160 160
10_small/pellet 400 400 400 400 400 400 400 400 400
11_large/chips 400 400 400 400 400 400 400 400 400
12_cogeneration 85 85 85 85 74 32 32 32 32
The sources for the factors are indicated in Annex I.
For the gas hybrid the emissions are actually calculated on the basis of energy input per energy source (primary: gas and secondary: electric)
For the cogeneration boiler it is assumed that the CO emissions are 1,7 * gas boiler emissions.
1.2.6.2 Emissions NEW per kWh thermal output The CO2 emissions for NEW boilers, relative to 1 kWh thermal output, are indicated in the graph below.
The emissions are highest for biomass boilers and lowest for gas absorption and electric heat pumps.
When compared per kWh thermal output the emissions appear largest for the manual stoked wood log boiler.

37
Figure 9 CO emissions per kWh thermal output NEW
1.2.6.3 Emissions per STOCK unit per year For the calculation of STOCK emissions the factors are corrected for the average age of the boiler.
Table 20 CO emissions per unit in boiler STOCK CO emission STOCK, kg/unit*a
1990 1995 2000 2005 2010 2015 2020 2025 2030
01_oil boiler 1,62 1,16 1,07 0,83 0,62 0,42 0,23 0,04 0,04
02_gas boiler 0,14 0,11 0,10 0,09 0,09 0,08 0,05 0,03 0,03
03_gas hybrid 0,15 0,12 0,11 0,10 0,09 0,09 0,06 0,03 0,03
04_elec.HP 0,01 0,01 0,01 0,01 0,00 0,00 0,00 0,00 0,00
05_gas abs. HP 0,37 0,36 0,34 0,32 0,28 0,22 0,13 0,06 0,05
06_gas ICE HP 1,49 1,42 1,35 1,29 1,23 1,12 0,73 0,43 0,42
07_coal boiler 5,62 3,50 3,49 3,47 3,45 3,08 2,71 2,38 2,04
08_small/wood manual
7,96 5,26 5,59 6,00 6,38 6,16 5,41 4,75 4,08
09_small/wood autom.
1,06 0,65 0,63 0,61 0,59 0,52 0,46 0,40 0,34
10_small/pellet 3,34 2,01 1,93 1,85 1,79 1,55 1,36 1,19 1,03
11_large/chips 21,41 12,82 12,28 11,76 11,31 9,78 8,59 7,54 6,47
12_cogeneration
0,14 0,29 0,28 0,28 0,23 0,17 0,08 0,05 0,05
In this table the values for 04_gas hybrid have been corrected for electric power input and the values for 12_cogeneration have been corrected for electricity output.

38
1.2.6.4 Emissions by STOCK 2030 - CO The CO emissions for the complete stock in 2030 are dominated by the small manual stoked wood boilers, even if their presence in stock is limited to <1%, the second most significant group is the gas boiler (representing 67% of boilers in stock).
Figure 10 CO emissions of boiler STOCK in 2030
1.2.7 PM emissions 1.2.7.1 Specific emission factors - PM Similar to the calculation of CO2 emissions is the calculation of PM emissions.
The specific emission factors are indicated below.
Table 21 specific PM emission factors PM emission NEW, mg/kWh_ energy input
1990 1995 2000 2005 2010 2015 2020 2025 2030
01_oil boiler 18,0 18 18 18 18 18,0 18,0 18,0 18,0
02_gas boiler 1,8 2 2 2 2 1,8 1,8 1,8 1,8
03_gas hybrid 31 27 23 20 16 16 16 16 16
04_elec.HP 60 53 45 38 30 30 30 30 30
05_gas abs. HP 1,8 1,8 1,8 1,8 1,8 1,8 1,8 1,8 1,8
06_gas ICE HP 3,6 3,6 3,6 3,6 3,6 3,6 3,6 3,6 3,6
07_coal boiler 180 180 180 180 180 180 180 180 180
08_small/wood manual
70 70 70 70 70 70 70 70 70
09_small/wood autom.
50 50 50 50 50 50 50 50 50

39
10_small/pellet 30 30 30 30 30 30 30 30 30
11_large/chips 37 37 37 37 37 37 37 37 37
12_cogeneration 3,1 3,1 3,1 3,1 3,1 3,1 3,1 3,1 3,1
The sources for the factors are indicated in Annex I.
For the gas hybrid the emissions are actually calculated on the basis of energy input per energy source (primary: gas and secondary: electric).
For the cogeneration boiler it is assumed that the PM emissions are 1,7 * gas boiler emissions.
1.2.7.2 Emissions NEW per kWh thermal output When compared on kWh thermal output the emissions appear largest for solid fuel boilers, especially the coal-fired boiler.
Figure 11 PM emissions per kWh thermal output NEW

40
1.2.7.3 Emissions per STOCK unit per year For the calculation of STOCK emissions the factors are corrected for the average age of the boiler.
Table 22 PM emissions per unit in boiler STOCK PM emission STOCK, kg/unit*a
1990 1995 2000 2005 2010 2015 2020 2025 2030
01_oil boiler 0,24 0,17 0,16 0,15 0,14 0,13 0,13 0,12 0,12
02_gas boiler 0,01 0,00 0,00 0,00 0,00 0,00 0,00 0,00 0,00
03_gas hybrid 0,04 0,03 0,02 0,02 0,02 0,02 0,01 0,01 0,01
04_elec.HP 0,03 0,02 0,02 0,01 0,01 0,01 0,01 0,01 0,01
05_gas abs. HP 0,01 0,01 0,01 0,01 0,01 0,01 0,01 0,01 0,00
06_gas ICE HP 0,03 0,03 0,02 0,02 0,02 0,02 0,02 0,02 0,02
07_coal boiler 1,37 0,85 0,85 0,85 0,84 0,75 0,66 0,58 0,50
08_small/wood manual
0,35 0,23 0,24 0,26 0,28 0,27 0,24 0,21 0,18
09_small/wood autom.
0,27 0,17 0,16 0,16 0,15 0,13 0,12 0,10 0,09
10_small/pellet 0,25 0,15 0,14 0,14 0,13 0,12 0,10 0,09 0,08
11_large/chips 1,98 1,19 1,14 1,09 1,05 0,90 0,79 0,70 0,60
12_cogeneration -0,02 -0,02 -0,01 -0,01 0,00 0,00 0,00 0,00 0,00
1.2.7.4 Emissions by STOCK 2030 - PM The emissions by boilers in STOCK in 2030 are still dominated by oil-boilers, which still have a relative large share in the stock compared combined with relatively high PM specific emission factors. Also wood boilers show relative high PM emissions, notwithstanding their relative small share in the stock of boilers.
Figure 12 PM emissions of boiler STOCK in 2030

41
1.2.8 OGC emissions 1.2.8.1 Specific emission factors - OGC Similar to the calculation of CO2 emissions is the calculation of OGC emissions.
The specific emission factors are indicated below.
Table 23 specific OGC emission factors OGC emission NEW, mg/kWh_energy input
1990 1995 2000 2005 2010 2015 2020 2025 2030
01_oil boiler 1 1 1 1 1 1 1 1 1
02_gas boiler 10 10 10 10 10 10 10 10 10
03_gas hybrid 25 23 20 18 15 15 15 15 15
04_elec.HP 40 35 30 25 20 20 20 20 20
05_gas abs. HP 10 10 10 10 10 10 10 10 10
06_gas ICE HP 20 20 20 20 20 20 20 20 20
07_coal boiler 432 432 432 432 432 432 432 432 432
08_small/wood manual
70 70 70 70 70 70 70 70 70
09_small/wood autom.
22 22 22 22 22 22 22 22 22
10_small/pellet 5 5 5 5 5 5 5 5 5
11_large/chips 12 12 12 12 12 12 12 12 12
12_cogeneration 17 17 17 17 17 17 17 17 17
The sources for the factors are indicated in Annex I.
For the gas hybrid the emissions are actually calculated on the basis of energy input per energy source (primary: gas and secondary: electric).
1.2.8.2 Emissions NEW per kWh thermal output When compared on kWh thermal output the emissions appear largest for solid fuel boilers, especially the coal-fired boiler. Interestingly the cogeneration boiler shows negative OGC emissions, which means that the boiler saves emissions due to the relative efficient production of electricity.

42
Figure 13 OGC emissions per kWh thermal output NEW
1.2.8.3 Emissions per STOCK unit per year For the calculation of STOCK emissions the factors are corrected for the average age of the boiler.
Table 24 OGC emissions per unit in boiler STOCK OGC emission STOCK, kg/unit*a
1990 1995 2000 2005 2010 2015 2020 2025 2030
01_oil boiler 0,02 0,01 0,01 0,01 0,01 0,01 0,01 0,01 0,01
02_gas boiler 0,03 0,02 0,02 0,02 0,02 0,02 0,02 0,02 0,01
03_gas hybrid 0,05 0,04 0,03 0,03 0,03 0,02 0,02 0,02 0,02
04_elec.HP 0,02 0,01 0,01 0,01 0,01 0,01 0,01 0,00 0,00
05_gas abs. HP 0,07 0,07 0,07 0,06 0,06 0,05 0,04 0,03 0,03
06_gas ICE HP 0,15 0,14 0,14 0,13 0,12 0,12 0,12 0,11 0,11
07_coal boiler 3,29 2,05 2,04 2,03 2,02 1,81 1,58 1,39 1,19
08_small/wood manual
0,35 0,23 0,24 0,26 0,28 0,27 0,23 0,21 0,18
09_small/wood autom.
0,15 0,09 0,09 0,08 0,08 0,07 0,06 0,06 0,05
10_small/pellet 0,04 0,02 0,02 0,02 0,02 0,02 0,02 0,01 0,01
11_large/chips 0,65 0,39 0,37 0,36 0,34 0,30 0,26 0,23 0,20
12_cogeneration 0,01 0,04 0,04 0,04 0,04 0,03 0,02 0,02 0,02

43
1.2.8.4 Emissions by STOCK 2030 - OGC The emissions by boilers in STOCK in 2030 are dominated by gas boilers boilers, because of their share in the boiler STOCK, followed by solid fuel boilers with modest shares in STOCK but significant emissions. Gas hybrid boilers and heat pumps boilers also show relative high scores due to emissions related to production of electricity (20 mg VOC/kWh_electricity16), which is also why cogeneration boilers show a significant saving on these emissions.
Figure 14 OGC emissions of boiler STOCK in 2030
16 source: Service contract on ship emissions; Assignment, abatement and market-based instruments, Task 2a - Shore-side electricity, final report, August 2005, Entec UK limited - values based on RAINS and DG TREN pocketbook

44
1.3 Qualitative analysis
This analysis will consider issues that relate to the application of Ecolabel/GPP criteria on the boiler sales and application (installation).
1.3.1 Issues related to installation (feasibility and costs)
Each boiler category has some specific issues to take into account when installing / putting into practice of the boiler.
Condensate run off of condensing boilers
Gas and oil condensing boilers produce significant amounts of condensate that needs to be discharged through proper treatment facilities (the condensate is fairly acidic, due to presence of nitric acid and even sulphuric acid if oil with sulphur content is combusted). These acids may deteriorate components of buildings and sewage treatment. discharge into septic tanks may kill the bacteria that process the waste17.
Therefore either proper dilution and treatment is required when installing such boilers.
Wet flue gases in the chimney
Gas and oil condensing boilers produce flue gases of very low temperatures and relative high moisture content. this could lead to condensate formation on the inside of chimneys/flue stacks, whereas old (non-condensing) boilers emitted flue gases that were still so hot, that condensation only occurred after discharge into the atmosphere.
This means that such boilers need to consist of air and water tight materials, which in certain retrofit situations requires and overhaul or application of lining of the flue stack. This involves extra costs for the installation.
Installation requirements of heat pumps
Heat pumps extract heat from the ambient, either from soil (ground coupled), or air (ventilation or outside air). To achieve this relatively large heat exchangers need to be applied.
Especially ground coupled heat pumps with horizontal collectors require substantial ground area. Although this area can be used as parking lot or garden, careful treatment in order to avoid damage to the collectors is required.
Another aspect is that heat pumps are relatively sensitive to correct installation (control strategy, amount of refrigerant, sizing of heat output versus demand, use of timers and delay options, etc.). The installation requires adequate knowledge of heat pump installation, which is more complex than that of (for example) relatively simple wall hung gas boilers.
Space demand of energy supply of solid fuel and oil boilers
Solid fuel boilers and oil boilers (and LPG boilers) require a dedicated fuel storage that is periodically filled (batch process). Such storage facilities need to comply with regulations as
17 http://www.wte-ltd.co.uk/condensing_boilers.html

45
regards safety and risks related to environmental damages. Such facilities come at extra costs compared to continuous forms of energy supply such as gas grid and electricity.
Low temperature heat emitters required
Condensing boilers and heat pumps even more so, function more efficiently if the supply/return temperature of the heating systems is kept as low as possible. This requires either oversized radiators or, more often applied, under floor heating (variants that heat wall or ceiling exist as well). The heat demand and the capacity of the heat emitting system (at given low temperatures) need to be balanced, which is complex and in some cases only achievable at very high extra costs in existing buildings (retrofit of heat emitter system).
Cogeneration - heat driven
If cogeneration boilers are applied as central heating boilers it is assumed these are heat demand driven, ie. they react on a heat demand and deliver the surplus electricity (if any) to the public grid.
The economic benefits of such installations depend very much on the feed-tariffs that are applicable and the costs of the fuel source.
1.3.2 Impacts on energy-infrastructure
Several experts have noted that a large scale introduction of electric heat pumps may lead to "winter black-outs", a situation where a simultaneous demand for heat (on a very cold winter day) may lead to such a high electric power consumption that the electric grid will experience operating difficulties.
Such difficulties have been reported for instance in a building site in The Netherlands (Teuge, Zutphen). Ex-post studies have shown that the power demand can increase by a factor 5 to 6 compared to an 'normal' grid demand if the electric backup heating is included in the calculations 18.
Increasing the capacity of the electrical power network is possible at extra costs and depending on assumptions regarding backup power and simultaneous demand, this could be twice or three times as high as 'normal' installation.
Gas-fired heat pumps (absorption and gas internal combustion) and hybrid heat pumps (which do not operate at lowest outdoor temperatures, since the gas boiler part is then functional) do not have an such an effect on the energy infrastructure, the gas consumption is at maximum the same as for a conventional layout with gas boilers.
The effect is very much dependent on the 'economy of scale' and is therefore difficult to asses on product level. The electric grid capacity (at current time and in the future), and the type of backup heating, is certainly an aspect to consider when purchasing electric heat pumps.
18 http://issuu.com/deteuge/docs/kema.rap.alliander_impact_wp_op_het_net

46
1.3.3 Impacts on noise
Air-to-water heat pumps use outside air or ventilation air as heat source. The air flow over the heat exchanger (in heating mode: evaporator side) will result in airborne noise, expressed as sound power level.
For split-package units with an outdoor unit, the effects of such airborne noise is very local and determined by local circumstances (position of outdoor unit, dampening applied etc.).
For single-package units, for instance using ventilation air, the effects may be more prone, since the noise is produced indoors and is related to the ventilation system.
Such effects in outdoor or indoor noise can not yet be quantified, since they are very susceptible to local circumstances, but the effect is present and should be addressed by manufacturers/procurers.
1.3.4 Impacts on affordability / running costs
Heat pumps are still relatively expensive boiler options, especially if the necessary works for the complete installation (realisation of heat source system and heat sink / emitter/ system) are incorporated.
The total life cycle costs of the boiler options (purchase, maintenance and running costs) are very susceptible to current energy costs. Some studies 19 have shown that governmental decisions on energy tariffs may render a boiler option from positive economic effects to negative economic effects. Especially electric heat pumps and cogeneration boilers appear sensitive to such effects.
[to complement]
[this section is not complete and will be finalised after the second stakeholder meeting. The text is just to provide an introduction of the aspects that will be covered by this task].
19 magazine VV+, March 2010, p.178

47
2 Task 5: Criteria [to elaborate with IPTS]
This section will be elaborated following consultation with IPTS.
2.1 EU Ecodesign
For information purposes only, the section below presents the latest proposal (March 2011) for Ecodesign requirements for central heating boilers, except solid fuel/biomass fuel:
1 years after entry into force
3 years after entry into force

48
5 years after entry into force

49
Annex I - Overview of emissions by category and source
emissions electricity production NOx SO2 VOC PM CO2 CO CH4
350 460 20 30 (was 330000 - but is replaced by Ecoreport Value MEErP 2011)
12,5 28 mg/kWh
source: Service contract on ship emissions; Assignment, abatement and market-based instruments, Task 2a - Shore-side electricty, final report, August 2005, Entec UK limited - values based on RAINS and DG TREN pocketbook
Table 25: Overview of specific emissions by boiler category and source
source
01_o
il bo
iler
02_g
as b
oile
r
03_g
as h
ybri
d
04_e
lec.
HP
05_g
as a
bs. H
P
06_g
as IC
E H
P
07_c
oal b
oile
r
08_s
mal
l/w
ood
man
ual
09_s
mal
l/w
ood
auto
m.
10_s
mal
l/pe
llet
11_l
arge
/chi
ps
12_c
ogen
erat
ion
NOx table 4-22, wood boiler/household/<50kWth 150
mg/MJ
table 4-16, autom/40kW 52 mg/MJ
table 4-18, wood boiler 101 mg/MJ
table 4-21, manual wood boiler 150
mg/MJ
table 4-21, autom. wood boiler 150 mg/MJ
table 2-2, kettle/gas or liquid/new and piston/gas/new 120
mg/Nm3 70
mg/Nm3 165
mg/Nm3
RAL-UZ 61, Blauer Engel, Uberarbeitung der vergabegrundlagen gas-brennwert and oil brennwert 80
mg/kWh 35
mg/kWh

50
source
01_o
il bo
iler
02_g
as b
oile
r
03_g
as h
ybri
d
04_e
lec.
HP
05_g
as a
bs. H
P
06_g
as IC
E H
P
07_c
oal b
oile
r
08_s
mal
l/w
ood
man
ual
09_s
mal
l/w
ood
auto
m.
10_s
mal
l/pe
llet
11_l
arge
/chi
ps
12_c
ogen
erat
ion
RAL-UZ 121 / RAL-UZ 118, Blauer Engel, Expertise elektrische und gasgetriebene Waermepumpen , entwurf 31-10-2011 60
mg/kWh 275
mg/kWh
1.BImSchV 110-185
mg/kWh
60-120
mg/kWh
RAL-UZ 112, Blauer Engel, Expertise holzpellet kessel, hackschnitzelanlage, p. 15/16 150
mg/Nm3
Lot 15 in RAL-UZ 112 expertise 140
mg/m3 140
mg/m3
RAL-UZ 112, Blauer Engel, Expertise holzpellet kessel, hackschnitzelanlage, p. 95-96 and table 4.9 p. 103
122 FL, 115 PL
mg/Nm3
118 FL, 103 PL
mg/Nm3
RAL-UZ 61, Blauer Engel, Expertise Gasbrennwertgeraete, table 14 p.34 and table 15, p. 35 79,8
mg/kWh 35,2
mg/kWh
Emissions of oil and gas appliances and requirements in European standards, table 1, p.4 120
mg/kWh 100
mg/kWh
wood conversion
INPUTS CHOSEN for NEW boiler (not 'BAT") 120
mg/kWh 70
mg/kWh
calculated n.a. 44
mg/kWh 275
mg/kWh 300 42
mg/kWh 42 mg/kWh 170
mg/kWh 170
mg/kWh
calculated
mg/kWh
1,22
CO table 4-18, wood boiler 4975 mg/MJ
table 4-21, manual wood boiler 3000
mg/MJ
table 4-21, autom. wood boiler 300 mg/MJ

51
source
01_o
il bo
iler
02_g
as b
oile
r
03_g
as h
ybri
d
04_e
lec.
HP
05_g
as a
bs. H
P
06_g
as IC
E H
P
07_c
oal b
oile
r
08_s
mal
l/w
ood
man
ual
09_s
mal
l/w
ood
auto
m.
10_s
mal
l/pe
llet
11_l
arge
/chi
ps
12_c
ogen
erat
ion
Blauer Engel, Uberarbeitung der vergabegrundlagen RAL-UZ 61 gas-brennwert and oil brennwert 6,6
mg/kWh 19
mg/kWh
Blauer Engel, Expertise elektrische und gasgetriebene Waermepumpen RAL-UZ 121 and RAL-UZ 118, entwurf 31-10-2011 50
mg/Nm3 300
mg/Nm3
RAL-UZ 112, Blauer Engel, Expertise holzpellet kessel, hackschnitzelanlage 180
mg/Nm3
1.BImSchV
0,4-0,25 g/m3
0,4-1,0
g/m3
Lot 15 in RAL-UZ 112 expertise 170
mg/m3 170
mg/m3
RAL-UZ 112, Blauer Engel, Expertise holzpellet kessel, hackschnitzelanlage, p. 95-96 and table 4.9 p. 103 6,6
mg/kWh 19
mg/kWh
59 FL, 160 PL
mg/Nm3
81 FL, 131 PL
mg/Nm3
Nordic Swann Stoves vs 3, 12 Oct 2010 800
mg/Mm3
Emissions of oil and gas appliances and requirements in European standards, table 1, p.4 90
mg/kWh 90
mg/kWh
gas conversion
INPUTS CHOSEN for NEW boiler (not 'BAT")
between 60
and 6.6 mg/kWh
between 50 and
19 mg/kWh
calculated
mg/kWh n.a.
mg/kWh
see 02_
mg/kWh 175
mg/kWh
738
mg/kWh 1600
mg/kWh 160 mg/kWh 400
mg/kWh 400
mg/kWh
calculated
mg/kWh
1,01

52
source
01_o
il bo
iler
02_g
as b
oile
r
03_g
as h
ybri
d
04_e
lec.
HP
05_g
as a
bs. H
P
06_g
as IC
E H
P
07_c
oal b
oile
r
08_s
mal
l/w
ood
man
ual
09_s
mal
l/w
ood
auto
m.
10_s
mal
l/pe
llet
11_l
arge
/chi
ps
12_c
ogen
erat
ion
"BAT" ? 6.6 19 834 83.4 207 207 303
OGC (NMVOC, TGC)
table 4-21, manual wood boiler 250
mg/MJ
table 4-21, autom. wood boiler 80 mg/MJ
Blauer Engel, Uberarbeitung der vergabegrundlagen RAL-UZ 61 gas-brennwert and oil brennwert 1,2
mg/kWh 10
mg/kWh
Blauer Engel, Uberarbeitung der vergabegrundlagen RAL-UZ 112 holzpellet kessel 3
mg/Nm3 (13% O2, 1013 mbar dry flue gas), < 50 kW 1,4
mg/Nm3 (13% O2, 1013 mbar dry flue gas), < 50 kW
RAL-UZ 112, Blauer Engel, Expertise holzpellet kessel, hackschnitzelanlage 10
mg/Nm3
Lot 15 in RAL-UZ 112 expertise 4
mg/m3 10
mg/m3

53
source
01_o
il bo
iler
02_g
as b
oile
r
03_g
as h
ybri
d
04_e
lec.
HP
05_g
as a
bs. H
P
06_g
as IC
E H
P
07_c
oal b
oile
r
08_s
mal
l/w
ood
man
ual
09_s
mal
l/w
ood
auto
m.
10_s
mal
l/pe
llet
11_l
arge
/chi
ps
12_c
ogen
erat
ion
RAL-UZ 112, Blauer Engel, Expertise holzpellet kessel, hackschnitzelanlage, p. 95-96 and table 4.9 p. 103
3FL, 3,9 PL
mg/Nm3
1,4 FL, 2,2 PL
mg/Nm3
Nordic Swann Stoves vs 3, 12 Oct 2010 60
mg/m3
http://www.biomassenergycentre.org.uk/portal/page?_pageid=77,109191&_dad=portal&_schema=PORTAL 5
mg/MJ 0.5
mg/MJ
120
mg/MJ
10-70
mg/MJ
10-70 mg/MJ
10-70
mg/MJ
10-70
mg/MJ
INPUTS CHOSEN for NEW boiler (not 'BAT") 1.2
mg/kWh 10
mg/kWh 20 10
mg/kWh 10
mg/kWh 69,5
mg/kWh 22,24 mg/kWh 4,9
mg/kWh 12
mg/kWh 10
mg/kWh
PM (dust)
table 4-22, wood boiler/household/<50kWth 500
mg/MJ
table 4-16, autom/40kW 35 mg/MJ
table 4-21, manual wood boiler 250
mg/MJ
table 4-21, autom. wood boiler 20 mg/MJ
Blauer Engel, Expertise elektrische und gasgetriebene Waermepumpen RAL-UZ 121 and RAL-UZ 118, entwurf 31-10-2011
mg/Nm3
RAL-UZ 112, Blauer Engel, Expertise holzpellet kessel, hackschnitzelanlage 25
mg/Nm3
1.BImSchV
0,05-0,02 g/m3
0,02-0,10
g/m3
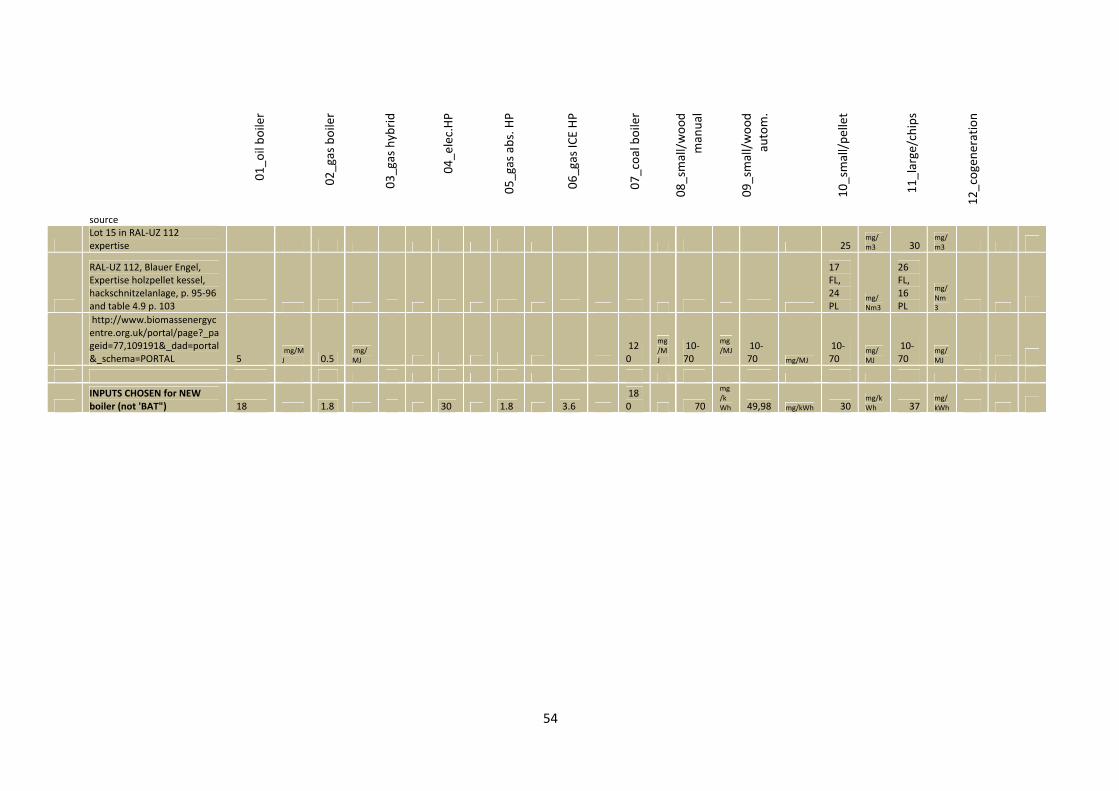
54
source
01_o
il bo
iler
02_g
as b
oile
r
03_g
as h
ybri
d
04_e
lec.
HP
05_g
as a
bs. H
P
06_g
as IC
E H
P
07_c
oal b
oile
r
08_s
mal
l/w
ood
man
ual
09_s
mal
l/w
ood
auto
m.
10_s
mal
l/pe
llet
11_l
arge
/chi
ps
12_c
ogen
erat
ion
Lot 15 in RAL-UZ 112 expertise 25
mg/m3 30
mg/m3
RAL-UZ 112, Blauer Engel, Expertise holzpellet kessel, hackschnitzelanlage, p. 95-96 and table 4.9 p. 103
17 FL, 24 PL
mg/Nm3
26 FL, 16 PL
mg/Nm3
http://www.biomassenergycentre.org.uk/portal/page?_pageid=77,109191&_dad=portal&_schema=PORTAL 5
mg/MJ 0.5
mg/MJ
120
mg/MJ
10-70
mg/MJ
10-70 mg/MJ
10-70
mg/MJ
10-70
mg/MJ
INPUTS CHOSEN for NEW boiler (not 'BAT") 18 1.8 30 1.8 3.6
180 70
mg/kWh 49,98 mg/kWh 30
mg/kWh 37
mg/kWh
55
Annex II - Working documents Ecodesign/Energy labelling
Overview of Ecodesign / Energy labeling requirements
In the latest working documents of the Commission significant changes have occurred as regards the approach taken in the lot 1 study and previous working documents: not only in the way how the energy efficiency of the central heating product is calculated, but also regarding what aspects of the central heating product are regulated.
What remains is that the scope of the measures not only address gas and oil fired boilers, but also competing technologies (such as heat pumps), complementing technologies (such as cascading boilers, storage tanks, temperature controls and solar thermal systems) and combined functions (water heating and also cogeneration) and combinations of the aforementioned products. The calculation model developed in Lot 1 took these market trends into account, except for solid fuel boilers and boilers specifically designed for biomass fuel which are subject to separate preparatory studies.
The former working documents calculated the overall central heating efficiency on the total configuration of the products as supplied to the market. This gave manufacturers freedom of choice in how to meet the requirements: A manufacturer could opt to meet the minimum Ecodesign requirements by either improving the boiler itself, but also by adding other energy-saving technologies like solar assist or better temperature controls to the package. The CE marking and therefore entry to the EU market involved an assessment of the efficiency of the complete configuration.
The current proposals for Ecodesign requirements and Energy labelling apply a different method.
The Ecodesign requirements are now based upon the ‘seasonal space heating efficiency’ as determined for the central heating product only, without consideration of (unavoidable) system losses (from distribution, fluctuation and stratification), complementary equipment (cascade of boilers, storage tanks, solar thermal assist and temperature controls), the combined operation of fossil fuel boilers and heat pumps (so-called ‘hybrid’ systems) or cogeneration boilers. The requirements for the Ecodesign product information fiche does require more information on product test results and product characteristics but do not address the other aspects.
The Energy labelling requirements are currently quite elaborate and offer a diverging range of options for product information and here the other aspects (complementary equipment and/or combined operation) is included in some way:
− The main energy label (Annex II of the proposed Regulation) considers the seasonal space heating energy efficiency as determined without the effects of complementary equipment, similar to the Ecodesign requirements, and some other information on key product characteristics;
− The product fiche - sheet 1 adds to the information provided on the label, information on annual energy consumption and the efficiency/capacity of heat pumps in other climates;
− The product fiche - sheet 2 resembles the original approach of the Lot 1 study the best. Here the combined effects of various equipment (a configuration) is calculated and presented. The overall ‘configuration space heating efficiency’ takes into account the benefits of combining the product with storage tanks, solar heating, type of temperature control20, boiler cascading, solar thermal assist, heat pump (assist), low temperature
20 This is not the same as the control protocol' as included in the calculation of the product space heating efficiency. The control protocol is an inherent characteristic of the boiler, whereas the temperature control (the room thermostat if you will) can be a

56
emitters and (for heat pumps) the effects of operating in a colder and warmer climate. The result is a ‘seasonal space heating efficiency’ of the complete configuration, however still without consideration of system losses.
It is believed that the main Energy label information will be compiled by the manufacturer (or other person responsible for placing on the market), since this requires information produced by testing according technical standards. The product fiches (sheet 1 and 2) can be compiled by the ‘supplier’ which is not necessarily the manufacturer. This opens up possibilities for retailers, including installers, to bring to the market configurations of products (possibly from different manufacturers) and calculate by themselves the space heating efficiency of that configuration. This adapts to the current market trend of offering combined sets of central heating boilers supplied with a thermostat, solar thermal systems, storage tanks and/or ‘hybrid’ systems that employ a boiler and a heat pump.
Transitional method for calculating seasonal space heating efficiency
The following text is a copy of the ‘ Working document for a Commission communication in the framework of the implementation of Commission Regulation (EC) No …/… implementing Directive 2009/125/EC of the European Parliament and of the Council with regard to ecodesign requirements for central heating equipment, and of the implementation of Commission Delegated Regulation (EU) No …/… implementing Directive 2010/30/EU of the European Parliament and of the Council with regard to energy labeling of central heating equipment’.
The Commission Communication is intended to explain in more detail how the product parameters relevant for the Ecodesign requirements and Energy Labeling, should be calculated. The calculation is based upon test results from current technical standards and elaborated with calculations developed by a working group to enable the calculation of seasonal space heating efficiency etcetera.
etas= etason - ΣF(i),
where
• etason is the seasonal steady-state thermal efficiency in on-mode calculated
according to point 2(4),
• F(i) are corrections calculated according to point 2(5).
The seasonal steady-state thermal efficiency in on-mode is calculated as
etason = 0,85•eta1 + 0,15•eta4
(eta1 = 30% rated input and low temperature regime)
(eta4 = 100% of rated input and high temperature regime)
(1) The correction F(1) accounts for the turndown ratio td as set out in Table 2.
Table 2: values for F(1)
separately supplied product, from a different manufacturer. Of course if the boiler offers the 'open protocol' it may allow a better communication with certain types of temperature controls.

57
(2) The correction F(2) accounts for controls. For boilers which are compatible
with an open communication protocol F(2)=0,025. For boilers which are not
compatible with an open communication protocol F(2)=0,03.
(3) The correction F(3) accounts for auxiliary electricity consumption and is
given as follows:
F(3)=2,5*(0,15•elmax+0,85•elmin+3,3•fossb)/Pfos4; OR a default value as
set out in EN 15316-4-1 may be applied.
(4) The correction F(4) accounts for stand-by heat loss and is given as
F(4)= 0,5•Pstby/Pfos4; OR a default value as set out in EN 15316-4-1 may be
applied.
(5) The correction F(5) accounts for pilot flame energy consumption and is given
as
F(5) = Pign/Pfos4.
(6) The correction F(6) accounts for the seasonal electric efficiency. For fossil
fuel boilers F(6)=0. For cogeneration boilers F(6) is given as follows.
[NB: negative, to result in an overall positive contribution]
F(6)=-2,5•(0,57•chp1+0,09•chp2+0,34•chp4).
Alternative suggestion of EHI received just before sending out working
documents: The seasonal steady-state thermal efficiency in on-mode of
cogeneration boilers is calculated as
etason = eta1 • (1+x+x2+x3),
EN 6 EN
with x = 2,5 • chp1.
Also defined are the calculation for heat pumps, controls, passive flue heat recovery devices and storage tanks.
Example calculation of space heating efficiency
Fossil fuel boilers (including cogeneration boilers)
In the earliest proposals for rating of central heating boilers, the energy efficiency was based on a calculation of the ‘performance’ of the boiler (the useful heat output) In the latest Working Documents (March 2011) the boiler efficiency is no longer calculated on the basis of a ‘heating demand’ and the total energy input required to fulfil this heat demand. Instead the seasonal space heating energy efficiency is calculated on the basis of two test points (at 30% load and low return temperature and full load at high return temperature) and including a correction based on 5 parameters.

58
The corrections are reductions on the seasonal steady-state efficiency.
etason = 0.85 * eta1 + 0.15*eta4
With eta1 is 0.99 and eta4 is 0.87, etason becomes:
etason = 0.85 * 0.99 + 0.15 * 0.87 = 0.972 or 97.2%
Correction parameters:
1) the turndown ratio addresses the fact that if the boiler is able to run at very low capacity, significant start-stop losses are avoided. The boiler can run continuously at part load for an extended time, often making optimal use of low return temperatures.
The corrections are:
Table 26 correction by turndown ratio td 1.00 < td <
0.80 0.80 < td < 0.66
0.66 < td < 0.50
0.50 < td < 0.30
0.30 < td 1.00 < td < 0.80
F(1) 0.07 0.04 0.02 0.01 0
If the boiler maximum output is 24 kW and the minimum output is 4 kW, the turndown ratio td is 4/24 = 0.17. The correction is zero.
If the boiler maximum output is 24 kW and the minimum output is 12 kW, the turndown ratio is 12/24 = 0.50 and the correction (reduction of seasonal steady-state efficiency) is 0.01 (or 1%). If the boiler offers no turndown (td = 1.00) then the reduction is 7 percentage points (0.07 or 7%).
2) the control correction addresses the way the room thermostat and the boiler communicate. An ‘open communication protocol’ allows the thermostat to convey information regarding actual room temperature and set temperature on the basis of which the boiler control can decide to operate at lower or higher part load (or full load).
If the boiler is compatible with ‘open communication protocol’ controls, the reduction is 0.025, if the boiler is not compatible the reduction is 0.03.
3) Almost every boiler consumes some auxiliary electricity in order to operate. This electricity consumption reduces the seasonal efficiency. The following parameters are included in the correction:
elmax = the electric power consumption (kW) at full load (100% rated input)
elmin = the electric power consumption (kW) at part load (30% rated input)
fossb = the electric standby power consumption (kW)
Pfos4 = the nominal output (kW) at 100% rated input
F(3) = 2.5 * (0.15*elmax + 0.85 * elmin + 3.3 * fossb) / Pfos4
If for an average 24 kW combi boiler the elmax is 0.145 kW (total 145 W, of which 45 W for combustion fan, 90 W for circulator and 10 W for boiler controls), the elmin is 0.050 kW (total 50 W, of which 15 W for combustion fan, 25 W for circulator and 10 W for boiler controls), the fossb is 0.010 kW and the Pfos4 is 22 kW, the F(3) becomes:
F(3)=2,5*(((0,15*0,145) + (0,58*0,05) + (3,3* 0,01))/22) = 0.01
One can also apply the default value as defined in EN 15316-4-1.
4) Correction F(4) corrects for standby heat loss. Each boiler cools down after providing heat. This is called standby heat loss. manufacturers may improve upon this value by providing

59
better thermal insulation in the boiler, minimising heat loss. A flue draught preventer (preventing escape of accumulated heat, by venting this to the chimney/flue pipe) is also a often applied measure.
Suppose the boiler example above has a standby loss of 0.2 kW (200 W), the formula calculates a correction as follows:
F(4) = 0.5 * Pstby/Pfos4
F(4) = 0.5 * 0.2/22 = 0.004
5) Correction F(5) corrects for pilot flame energy consumption. Suppose the equipment has a pilot flame with a capacity of (approximate value) 0.02 kW, the correction (with Pfos4 is 22 kW) is calculated as:
F(5) = Pign/Pfos4
F(4) = 0.02/22 = 0.001
Modern boilers all use electronic ignition and therefore have zero pilot flame consumption.
6) Correction F(6) accounts for the seasonal electric efficiency, generated during the heating process and is therefore dedicated to (small scale) cogeneration boilers. For heat-only boilers F(6) is zero by default. For cogeneration boilers F(6) is calculated as:
F(6) = -2.5 * (0.57*chp1 + 0.09*chp2 + 0.34*chp4).
Assuming a cogeneration boiler with following characteristics
Table 27 correction by pilot flame eta chp 15%
30%, low temp eta1 0,99 chp1 0,15
100%, low temp eta2 0,94 chp2 0,15
100%, high temp eta4 0,87 chp4 0,15
The correction then becomes:
F(6) = -2,5*((0,57*0.15)+(0,09*0.15)+(0,34*0.15)) = -0.375
EHI has provided an alternative calculation, but details are not known yet.
For the calculation example we assume that the boiler is not a cogeneration unit (otherwise the eta 1 and eta4 would be very different, as well as elmax and elmin).
The overall seasonal space heating energy efficiency ‘etas’ for the example boiler is then:
etas = etason - sumF(1-6) = 93.6%
Table 28 overall etas calculation etas etason F(1) F(2) F(3) F(4) F(5) F(6)
correction for: seasonal space heating energy efficiency
seasonal steady state thermal efficiency
turndown ratio control protocol
auxiliary electricity
standby heat loss
pilot flame
cogeneration
etas = 0.972 0 0.025 0.01 0.004 0 0
etas = 97.2% 2.5% 1% 0.4%

60
etas = 93.2%
Heat pumps (electric and gas fired)
For heat pumps the general principle is the same: a seasonal thermal efficiency, corrected for control and other losses. The corrections are limited with respect to fossil fuel boilers since the thermal efficiency may already include turndown losses and auxiliary electricity (if the heat pump is electric) and that standby heat losses, pilot flame losses and cogeneration surplus energy are not relevant (for current state-of-play).
Therefore the seasonal steady state thermal efficiency is based on the establishment of the reference SCOP. The reference SCOP of a heat pump can be calculated for a specific heating season (the reference heating season) and taking into account certain boundary conditions (for instance at what outdoor temperature a backup heater is assumed to take over the heating capacity, etc.).
Since the seasonal space heating energy efficiency is given in primary energy units, the efficiency of the electric heat pump is converted to primary efficiency by a value of 2.5. seasonal space heating energy efficiency thus becomes:
etas = (1/prim)*referenceSCOP - sumF(1-2)
where prim = primary energy factor. For electric equipment the value is 2.5, for equipment using primary fuels (gas-fired heat pumps) the value is 1.0.
referenceSCOP is established on the basis of the reference heating season
F(1-2) are correction factors F(1) and F(2)
1) F(1) is a correction for control operation similar to that of fossil fuel boilers: the correction involves the way the room thermostat and the boiler communicate.
If the heat pump is compatible with ‘open communication protocol’ controls, the reduction is 0.025, if the boiler is not compatible the reduction is 0.03.
An ‘open communication protocol’ allows the thermostat to convey information regarding actual room temperature and set temperature on the basis of which the boiler control can decide to operate at lower or higher part load (or full load).
2) Correction F(2) accounts for auxiliary electricity consumption (e.g. by a fan, or pump) in active heating mode and is zero for electric heat pumps (assumed included in referenceSCOP) and is calculated for heat pumps using fossil fuels as follows:
F(2) = (prim - auxrecov) * 0.5 * hpaux/DC4
where:
prim is the primary energy factor (is 2.5 for electrical equipment)
auxrecov is the amount of heat from electric equipment that can be recovered (is useful heat) and is by default 0.55
hpaux is the electric power input, in kW, during active heating mode at testpoint A (standard rating condition). This value can be for instance some 900-1000 W for gas heat pumps providing 35-40 kW of heating capacity.
DC4 is the heat pump capacity at standard rating condition, eg. 35 kW.
For a readily available gas fired heat pump the F(2) is therefore:
F(2) = (2.5 - 0.55) * 0.5 * 0.95/35 = 0.026

61
COP stands for coefficient of performance and is a measure of how much units of heat can be produced per unit of electrical energy. A COP of 4 means that 4 units of heat are produced with 1 unit of electrical energy. The heat pump method requires establishment of COP values for the whole heating season, the combined and weighted average is then called SCOP - for Seasonal coefficient of performance.


63
Annex III - Energy labelling of boilers
Label design
fossil fuel boilers cogeneration boilers heat pumps (other than LT)
LT heat pumps
Not shown (to add) are the labels for sanitary water production (for combination boilers)
Seasonal space heating efficiency classes for boilers, cogeneration and normal heat pumps:
Seasonal space heating efficiency classes for LT heat pumps:

64
Water heating efficiency classes (to align with Dedicated Water Heaters Labeling):

65
Product fiche - sheet 2 ("installer labels")
Figure 15 Gas/oil boiler fiche

66
Figure 16 Cogeneration boiler fiche

67
Figure 17 Heat pump boiler fiche

68
Figure 18 Low Temperature heat pump boiler fiche

69
Figure 19 Sanitary water heating fiche

70
Annex IV - Emissions from combustion
Emissions of air pollutants from the combustion process in gas- and oil-fired CH boilers are carbon dioxide (CO2), nitrogen oxides (NOx), carbon monoxide (CO) and methane (CH4). In oil-fired boilers you have these emissions plus sulphur oxides (SOx), Volatile Organic Compounds (CxHy) and “soot” (Particulate Matter, PM).
When looking at the combustion emissions from the angle of their relative environmental impact. there are a number of categories.
Global Warming Potential (GWP). These include CO2, CO and CH4 emissions. Legal basis is the Kyoto protocol and the weighting factors for the GWP-100 are prescribed by the Intergovernmental Panel on Climate Change (IPCC). The unit of GWP-100 is CO2-equivalent (CO2=1). Carbon monoxide has –per weight unit— a CO2-equivalent of 1,57. Methane (CH4) has a significantly higher GWP at CH4=21.
Acidification Potential (AP). These include SOx and NOx emissions. The policy framework for regulating acidification consists of several European Community directives and the so-called Gothenburg Protocol . This protocol considers SO2 to be 50% more harmful in terms of acidification than NOx (weighting factor 1 versus 0,7 respectively. This relationship is also reflected in the emission limit values of the 1999/30/EC daughter directive of the Ambient Air Quality Directive (AAQD) . The AAQD is an interesting framework directive, because the collection of –so far— 4 daughter directives show the relative importance that the legislator gives to very different types of emissions, which are all assessed in a similar (grid-based) method.
From this comparison (see table 3) it is clear that the legislator thinks NOx some 50 times more harmful than CO-emissions from the viewpoint of ambient air quality. This is very significant, because up till now the boiler sector has mostly treated the emission limits for CO as equivalent to NOx (see Task 1 report). This is not in line with EU environmental policy. If the sector —and the governments in Member States—have treated CO equally stringent this must be due to other reasons, e.g. historical safety reasons when boilers were not room sealed and CO-poisoning was a real danger with open (not room-sealed) units.
Volatile Organic Compounds (VOC). These include the CxHy emissions from oil-fired boilers. Strictly also methane (CH4) is part of VOCs, but because the effect on the environment is different it is excluded. For this reason VOCs are often called NMVOCs (non-methane VOCs).
VOCs appear in Directive 2002/3/EC of 12 Feb. 2002 due to their role in (ground level) ozone and in Directive 1999/13/EC dealing with organic solvents. Furthermore, the European IMPEL network is monitoring fugitive NMVOCs, amongst others from combustion processes. There are no weighting factors mentioned and the MEEUP study proposes to simply make an inventory on a weight basis.
Formation of VOCs in commercial and industrial boilers primarily result from poor or incomplete combustion due to improper burner set-up and adjustment. To control VOC emissions from commercial and industrial boilers, no auxiliary equipment is needed; properly maintaining the burner/boiler package will keep VOC emissions at a minimum. Proper maintenance includes keeping the air/fuel ratio at the manufacturer's specified setting, having the proper air and fuel pressures at the burner, and maintaining the atomizing air pressure on oil burners at the correct levels. An improperly maintained boiler/burner package can result in VOC levels over 100 times

71
the normal levels. Furthermore, as VOC emissions mainly occur at start-up and the end of a burning cycle, a very important measure is a reduction of the number of cycles.
Heavy Metals (Toxicity). Although not a Heavy Metal, the MEEUP classifies CO as a toxic agent, albeit –as an outdoor emission—with a very low weighting factor. Carbon monoxide is a pollutant that is readily absorbed in the body and can impair the oxygen-carrying capacity of the hemoglobin. Impairment of the body's hemoglobin results in less oxygen to the brain, heart, and tissues. Even short-term over exposure to carbon monoxide can be critical, or fatal, to people with heart and lung diseases. It may also cause headaches and dizziness in healthy people.
Particulate Matter (PM). This refers to ‘soot’ from oil-fired boilers. Emission limit values are mentioned in Directive 1999/30/EC, which indicate that the European legislator takes PM 10-emissions very serious indeed (see table 4). In fact, the emission limits on a weight basis are 4 times more stringent than the ones for NOx.
PM emissions are primarily dependent on the grade of fuel fired in the boiler. Generally, PM levels from natural gas are significantly lower than those of oils. Distillate oils result in much lower particulate emissions than residual oils.
When burning fuels, especially oil and solid fuels, particulate levels mainly depend on four fuel constituents: sulfur, ash, carbon residue, and asphalenes. These constituents exist in fuel oils, particularly residual oils, and have a major effect on particulate emissions. By knowing the fuel constituent levels, the particulate emissions for the oil can be estimated.
Methods of particulate control vary for different types and sizes of boilers. For utility boilers, electrostatic precipitators, scrubbers, and baghouses are commonly utilized. For industrial and commercial boilers, the most effective method is to utilize clean fuels. The emission levels of particulate matter can be lowered by switching from a residual to a distillate oil or by switching from a distillate oil to a natural gas. Additionally, through proper burner set-up, adjustment and maintenance, particulate emissions can be minimized, but not to the extent accomplished by switching fuels.
The above refers to emissions to air. To complete the picture it must be mentioned that in some regions of the EU there are strict regulations regarding the emissions to water, which –when using heating oil with a higher sulphur content—can apply to affluent of condensate to the sewer.
Taking the angle of their origin, the emissions from gas-and oil-fired boilers can be split into four groups:
Unavoidable products from the combustion reaction. As already explained in the previous chapter water vapor and carbon dioxide (CO2) are the main combustion products from the reaction between a hydrocarbon and oxygen. The CO2 production is completely linked with a) the specific fuel and b) the energy efficiency of combustion. Regarding the fuel the CO2 emissions per MJ gas are 20-30% lower21 than with oil. Regarding the efficiency, it depends very much on the design. At best the oil-fired boilers in the top-end of the market can keep up (but not surpass) the best gas-fired boilers.
Pollutants that are unavoidable because they are already contained in the fuel. This is the case with SOx production from sulphur. In principle, without end-of-pipe measures, the sulphur emissions are independent of the design of the combustion process. If we use heavy fuel oil with 3% sulphur, this amount will also result from the combustion process. If we use low-sulphur (<50
21 Eurogas mentions a figure of 24%, citing the International Gas Union. The MEEUP table shows even higher differences (>30%) for comparable boilers.

72
ppm) heating oil the corresponding lower amount will result. The only design-measure that a boiler designer can take is to make sure that the boiler (also) works with low-sulphur oil, but it is the user —or the regulations on the sulphur content of heating oil in a particular country— that will determine the outcome.
Emissions that are a consequence of incomplete combustion. Basically, these are all other carbon-containing compounds, besides CO2: Carbon monoxide (CO), Methane (CH4), hydrocarbons (CxHy) and soot (PM). The carbon in these compounds comes from the fuel and is an indicator of how much fuel was subject to incomplete combustion. The most well known cause of this is the lack of sufficient air/oxygen. But there may be other causes, such as the temperature of the fuel is too low to permit oxidation (combustion) to occur. It can occur as a result of flame impingement (flame in contact with metal) because parts of the flame are cooled—quenched—below the burn temperature of the fuel. For instance, on a gas range burner, flame impingement always occurs when a pot is on a burner. As the pot becomes hotter, the carbon monoxide production decreases because the flame is not cooled as much by the impingement. This makes measurement of carbon monoxide difficult; as impingement surfaces change temperature, the carbon monoxide emissions change. Quenching of a flame can also occur if air blows across a flame rapidly enough to cool it to below its burn temperature. A rule of thumb is that –in order to keep the CO-emissions low—the combustion temperature should be well above 900°C. Finally, the most obvious cause of non-CO2 carbon emissions is during start- and stop of combustion, i.e. when unburned fuel remains in the combustion chamber. This causes of course a considerable amount of unburned fuel emissions (CH4 or CxHy), but also gives peaks in CO-emissions as the circumstances at start-up (cold heat exchanger) are so favorable for CO-formation. As mentioned in chapter 2, 80-90% of the non-CO2 carbon emissions occur not during steady-state but during start-up and stop.
Emissions that do not involve the fuel, but are chemical reactions between air molecules triggered by the specific combustion conditions. This relates to emissions of nitrogen oxides (NOx), NO and NO2, from the reaction between the oxygen and nitrogen molecules in the air. This occurs only when there is enough air around (excess air, e.g. air factor > 1,4), when the temperature is high enough (above 1200°C) and when there is enough time for the reaction to take place at this high temperature (the so-called ‘residence time’ should be long enough).
Basically the above is about all there is to tell about the amount of CO2 and SOx emissions (point 1 and 2). Once the fuel is chosen22, the amount of SOx and CO2 emissions follow directly from the fuel input per functional unit.
Low NOx
The term low NOx technology used in the industry has a broad range in terms of the NOx emission level achieved. In some instances, an emission of 70 - 80 ppm at 0% O2 on dry basis is regarded as "low". In other instances, it may be down to 10 - 15 ppm or less. In the EU the threshold level of <40 ppm (70 mg/kWh) seems the most appropriate, being used in the German Blue Angel labeling scheme and the Dutch ‘Low- NOx’ label and it is the lowest class limit (class 5) in the European Standard prEN 267.
22 And a minute amount is subtracted for unburned fuel (<1,5%, see Chapter 2)

73
Conversions: Europe: 1 ppm (at 3% O2) = 1,83 mg/kWh = 0,508 mg/MJ = 0,508 ng/J. US: 100 ppm (at 3% O2) = 0,118 lb/MMBtU (1 lb= 0,4535 kg; 1 Btu= 1,0546 kJ) = 183 mg/kWh. ppm (at 3% O2) = (21-3)/(21 – O2 actual) ppm actual. 1 ppm (at 3% O2) = 18/21= 0,857 ppm (at 0% O2).
What effect does NOx control technology ultimately have on a boiler's performance? Certain NOx controls can worsen boiler performance while other controls can appreciably improve performance. Aspects of the boiler performance that could be affected include turndown, capacity, efficiency, excess air, and CO emissions.
Failure to take into account all of the boiler operating parameters can lead to increased operating and maintenance costs, loss of efficiency, elevated CO levels, and shortening of the boiler's life.

74
[end]