development of dynamic simulators using pasco models equipped with labview · development of...
TRANSCRIPT

Development of dynamic simulators using Pasco models equipped
with LabVIEW
A Major Qualifying Project Report completed as required of Bachelor of Science degree at Worcester Polytechnic Institute
Submitted to the Faculty of Worcester Polytechnic Institute
By
Tu Hoang
Date April, 14th
Professor Yeesock Kim, Ph.D., Project Advisor
1

Abstract
This paper proposes a systematic integration of PASCO scientific models, National
Instruments hardware, LabVIEW, sensors and analysis software to simulate and
analyze earthquake signal using in structural dynamics and structural health
monitoring education. This reconfigurable software-hardware platform is a novel
approach because even though it has been done before by other research groups, very
few could overcome the drawbacks of high price and un-customizable control system,
which are the keys for education purpose applications. In this project, the limit in initial
design of PASCO scientific models was redesigned to greatly reduce the price and
make it adaptable to National Instruments (NI) data acquisition system, including NI
hardware, sensors and LabVIEW software as the control system. Frequency response
analyses are also demonstrated in the proposed laboratory activities to confirm the
precision, stability and flexibility of this toolbox. Based on the frequency analysis,
features of natural frequencies are extracted to determine the structure condition. A
structural dynamics course with detailed syllabus combining theory and experiment
aspects was designed to familiarize students with this innovative tool. With further
study, this toolbox will become a cost-effective solution for educational purpose of
structural dynamics and structural health monitoring.
2

Table of Contents Abstract ..................................................................................................................................... 2
Table of Contents ..................................................................................................................... 3
Table of Figures........................................................................................................................ 4
1. Introduction ...................................................................................................................... 5
1.1 Smart Structures and Structural Health Monitoring in engineering practice and education ............................................................................................................................... 5
1.2 Recent developments of educational shake table projects in the United States ....... 6
1.3 Proposed solution and current project ........................................................................ 7
2. Physical models ................................................................................................................. 8
2.1 Pasco high-rise building ............................................................................................ 8
2.2 Pasco bridge structure ................................................................................................... 9
2.3 Actuators ....................................................................................................................... 10
2.4 Sensors .......................................................................................................................... 11
2.5 Soil Model – Mini shake table ..................................................................................... 13
3. Function Generator, Data acquisition and analysis system ........................................... 14
3.1 Function Generator ..................................................................................................... 14
3.1 Pasco hardware and software ..................................................................................... 15
3.2 National Instruments hardware and LabVIEW software ....................................... 16
3.3 Matlab-based analysis software .................................................................................. 17
4. Project descriptions ........................................................................................................... 17
4.1 Frequency response analysis ....................................................................................... 18
4.2 Structural health monitoring ...................................................................................... 19
5. Proposed course experimental activities .......................................................................... 19
5.1 Proposed course description and syllabus ................................................................. 19
5.2 Time domain response – MDOF Structure testing under applied ground motion 23
5.2 Frequency domain response – Fourier Analysis Using Matlab ............................... 24
5.3 Modal analysis - Development of numerical model of structural in Matlab .......... 25
5.4 Structural Health Monitoring – Final Project .......................................................... 26
6. Limitations .......................................................................................................................... 31
7. Conclusions ......................................................................................................................... 32
Reference Lists ....................................................................................................................... 33
3

Table of Figures
Figure 1: Dimension of PASCO beam members (Pasco.com, 2014) ........................................ 9 Figure 2: PASCO 4-story structure and original design (Pasco.com, 2014) ............................. 9 Figure 3: PASCO Bridge structure (Pasco.com, 2014) ........................................................... 10 Figure 4: Mechanical Wave Driver SF-9324 (Pasco.com, 2014) ............................................ 11 Figure 5: Accelerometers: Left - Wilcoxon Research models 780C (wilcoxon.com, 2014); Right - PCB 302A (pcb.com, 2014)......................................................................................... 12 Figure 6: Load cell and Motion Censor and their applications (Pasco.com, 2014) ................. 13 Figure 7: Design of mini shake-table ....................................................................................... 14 Figure 8: Connection between mechanical driver and structure base/soil model .................... 14 Figure 9: Proposed course laboratory activities ....................................................................... 22 Figure 10: Time history of acceleration data ........................................................................... 23 Figure 11: Frequency domain response laboratory .................................................................. 24 Figure 12: Output data of acceleration in frequency domain .................................................. 25 Figure 13: Modal analysis laboratory ...................................................................................... 25 Figure 14: Final Project ........................................................................................................... 27 Figure 15: Natural frequencies of different structure conditions ............................................. 27 Figure 16: First natural frequency distribution ........................................................................ 28 Figure 17: Second natural frequency distribution .................................................................... 28 Figure 18: Third natural frequency distribution....................................................................... 29 Figure 19: Forth natural frequency distribution ....................................................................... 29 Figure 20: Normalized data of natural frequencies .................................................................. 30 Figure 21: Normalized data of natural frequencies .................................................................. 31
4

1. Introduction
1.1 Smart Structures and Structural Health Monitoring in engineering practice and
education
With current technology, every structural dynamics experiment for education purpose
can be simulated using computer programs, but it cannot replace real experiment. In
engineering education, even though real hands-on experiments have effects such as
measurement errors that can be programmed, experience gained from real activities does
not come from simulation laboratories (Goodwin and Medioli et al., 2011). Laboratories
experiments help student assimilate complex theoretical concepts in an easier and more
interesting way and provide them experience working with laboratory instruments and
equipment that they will work with in the future (Torrey, 1994). Therefore, the best solution
to link between theory and practice for engineering education is to combine simulation with
real laboratories (Froyd and Wankat et al., 2012).
Some major recent concepts to civil engineering field of high-rise buildings including
vibration control (SVC), system identification (SI), and structural health monitoring (SHM)
were introduced in the society of civil engineering in 1970 but these ideas have only recently
gained worldwide recognition in the academic arena (Hurlebaus and Stocks et al., 2012). In
general, in high-rise buildings, large-scale excitations like earthquakes, hurricances, and blasts
apply external engery on structures and this source of energy is then transformed into both
kinetic and potential energy. It is essential to mitigate the hazardous effect of earthquakes by
distributing input energy within the structure. To mitigate the effect, a damper system must
be installed to absorb the energy, preventing structure from collapsing. Technique that
controls performance of these dampers is called SVC (Constantinou, 1994). Another crucial
process that is involved in this approach is SI and SHM, which is the process of implementing
a damage detection strategy for aerospace, civil, and mechanical engineering infrastructure
(Sohn and Farrar et al., 2004).
Although these revolutionary concepts are attracting attentions from researchers,
engineers, property owners and decision makers, educatiors still cannot make them popular
to students to make them aware of the importance of the technology (Zhang and Lu, 2008).
The reason for this is that these technologies mostly require not only substantial background
5

on actuators, sensors, data acquisition systems, and various computational models but also
great amount of investments. This costly investment is mostly spent on laboratory facility,
consisting of specialized equipment, which are essential for the educational as well as
research purposes in small scale (Albu and Holbert et al., 2004). Thus, to design a simpler,
cheaper simulator which does not require such extensive knowledge on the subject but still
produces good results is one of the solutions for undergraduate level of structural dynamics
and SHM education.
1.2 Recent developments of educational shake table projects in the United States
In the United States, many colleges have been researching on educational tools of this
simulator for structural dynamics and earthquake engineering using shake table. A vast
majority of these tables are used to test scaled structures of new concepts and techniques
before their real-life implementation. Despite their effectivenesess, they still have different
drawbacks that prevent their project to become a major intrument for educational purpose.
(Turner and Shaw et al., 2011).
One of the most well-known is Purdue University Consortium on Instructional Shake
Tables (UCIST) project which concentrates on the emerging technology of tele-operation
capability. Following the fifth major shift in current engineering education which includes
Remote Laboratories (Froyd and Wankat et al., 2012), this feature makes it possible to a
broader set of students at institutions to access by remotely controlling the structure and
collecting the data, recording video in real-time via internet (Dyke and Christenson et al.,
2007). This solution also allows a community share expensive equipment and reduce the
equipment downtime. Although remote labs will probably become a major component in
engineering education (Orduna and Garcia-Zubia et al., 2012), whether or not it could replace
in-person labs is still questionable (Froyd and Wankat et al., 2012). Another major drawback
of tele-participation capability of this projects and others similar ones from Lehigh Unversity
and University of California at San Diego is that it is difficult to demonstrate independent
experiments that require modifying the structure. Also, price of the whole system, which is
$10,000-$25,000, is much higher than other products (Dyke and Christenson et al., 2007)
(Elgamal and Fraser et al., 2005) (Zhang and Lu, 2008).
6

The second well-known project is Colorado University- Network for Earthquake
Engineering Simulation (CU-NEES) Instructional Shaking Table. It is also designed for
educational outreach purpose with tele-operation potential. The control software is LabVIEW
environment, which can maximize the flexibility of the control system for a variety of research
purposes. On the other hand, the drawback of this project is due to weight of structure, the
actuators need to be strong to provide enough force for moving the shake table at desired
amplitude and frequency. As a result, the price of actuator devices and the structure is still
high for a non-comercial product (Wallen and Larson, 2007).
Last but not least, large-scale high-performance shake tables at other universities such as
University of California, San Diego; University of California, Berkeley; University at Buffalo,
The State University of New York are not suitable for our small-scale model study and research
purposes (Nees.ucsd.edu, 2014) (Nees.ubuffalo.edu, 2014) (Peer.berkeley.edu, 2014) .
1.3 Proposed solution and current project
As a result, currently there is no solution that comprises of all factors including cost-
efficiency, functionality, flexibility, stability and precision for educational purposes. The most
noticable drawbracks of the present commercial products is the high price of model and
control system. The most well-known equipment provided by Quanser has price of at least
$10,000 (Dyke and Christenson et al., 2007). To solve this problem, a new system must have
low-price actuators but still need to provde enough capacity to shake a structure at desired
amplitude and frequency. Therefore, the solution would be to design a system that integrates
both structure and shake table to maximize the potential of both components. In this paper,
a simple, small-scale 4-story structure is examined to serve a purpose of testing the
integration of PASCO and LabVIEW. The set includes PASCO Scientific Structural model, PASCO
Mechanical Driver and National Instruments devices and LABVIEW software for data
acquisition and analysis. The two major notable factors of our structure are the creative
design of soil model, and flexible and customizable LabVIEW controller.
First of all, including sensors, the total mass of our plastic structure is only 2.6 lbs. (1.2 kg)
so a high-capacity and expensive mechanical driver is unnecessary. After various designs and
modifications, the final solution of the soil model using PASCO model was accepted. This
model has enough capacity to move the structure smoothly on 2 long PASCO axles. This soil
7

model using PASCO is not originated from PASCO. It is innovatively yet simply designed by
altering the connection between the first floor and the mounting bars. More details of this
design will be provided in section 2.5.
Second, LabVIEW environment was chosen as the computational tool for the control
program due to it advantages of being able to be programmed to serve any purpose. Despite
this feature of a graphical programming language, the final product is a customizable and
flexible user interface that could help students perform all of the work easily. Also, some of
its other advantages include: it is a language developed for use in lab applications such as this
one; it has a rich set of user interface options for controlling experiments an processes; there
was already a body of work done which acquired and displayed sensor data; it is a graphical
programming language that is easier for non-computer scientists to modify while performing
further experiments and it was already integrated with the National Instruments input and
output devices. (Karstaedt and Lauer et al., Year).
The final result of this solution is expected to be able to perform funadamental structural
dynamics laboratory and also study of SHM. As mentioned above, although the concept of
SHM is not new, it is not popular among undergraduate study due to various constraints of
laboratory equipment including both softwares and hardwares, instruments. Using this
toolbox, instructors are able to perform SHM as a laboratory activities, helping students gain
hands-on experience on this concept. The proposed approach is to use the change in
structural paramenters to acknowledge the change in structural health.
2. Physical models
2.1 Pasco high-rise building
The structure was built using PASCO ME-6992 Advanced Structures set. This set included
plastic beams, flat beams (used as columns) and corner connectors. Due to the plastic
material, any component of the model could be altered or redesigned to extend the research
purposes such as changing the stiffness of the columns, adding mass to each floor, adding a
pendulum functioning as a damper. Every component has a precise dimensions and the same
material properties: Young's modulus of the material is 2.29 GPA (424 ksi), cross section of
the beam is in the pictures below. The flat members have nominal cross section dimensions
8

of 0.4 in x 0.1 in (Pasco.com, 2014). From this, the users could create a mathematics model
of this structure.
Figure 1: Dimension of PASCO beam members (Pasco.com, 2014)
Figure 2: PASCO 4-story structure and original design (Pasco.com, 2014)
2.2 Pasco bridge structure
PASCO ME-6991 Bridge included beams, brackets, screws, cord tensioning clamps, a Mini-
car, and a flexible road bed for building various trusses and bridges. Dynamics tracks could
9
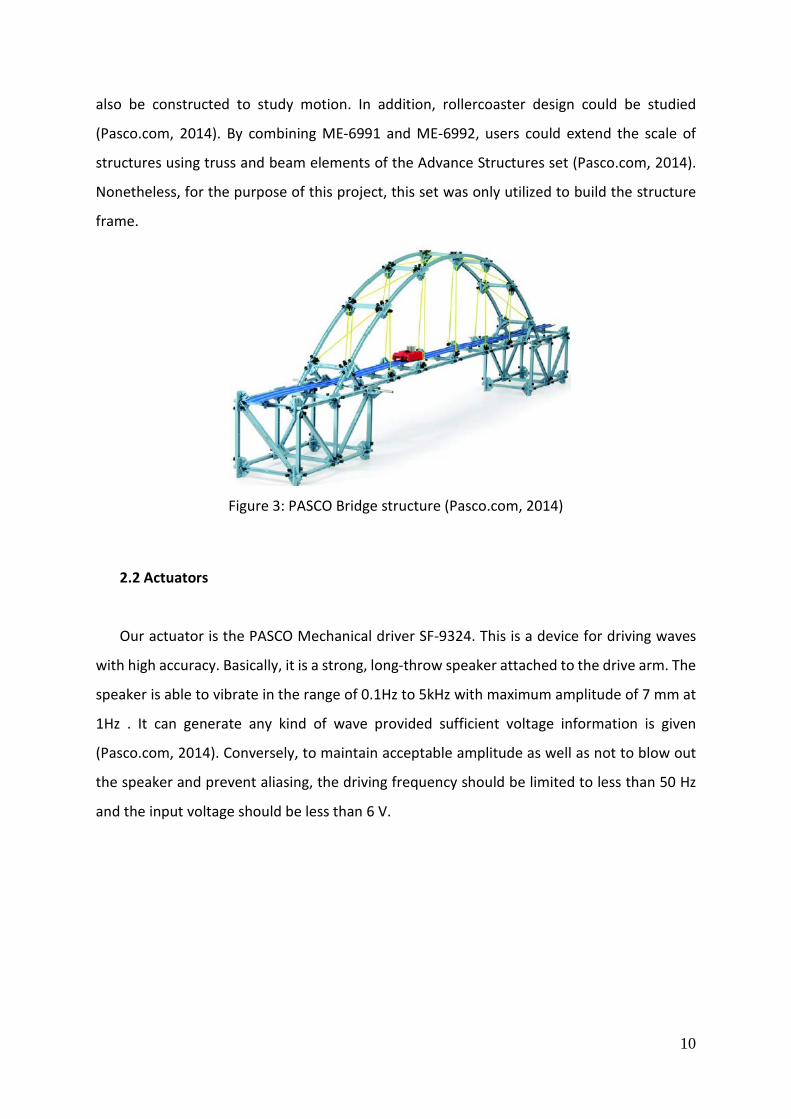
also be constructed to study motion. In addition, rollercoaster design could be studied
(Pasco.com, 2014). By combining ME-6991 and ME-6992, users could extend the scale of
structures using truss and beam elements of the Advance Structures set (Pasco.com, 2014).
Nonetheless, for the purpose of this project, this set was only utilized to build the structure
frame.
Figure 3: PASCO Bridge structure (Pasco.com, 2014)
2.2 Actuators
Our actuator is the PASCO Mechanical driver SF-9324. This is a device for driving waves
with high accuracy. Basically, it is a strong, long-throw speaker attached to the drive arm. The
speaker is able to vibrate in the range of 0.1Hz to 5kHz with maximum amplitude of 7 mm at
1Hz . It can generate any kind of wave provided sufficient voltage information is given
(Pasco.com, 2014). Conversely, to maintain acceptable amplitude as well as not to blow out
the speaker and prevent aliasing, the driving frequency should be limited to less than 50 Hz
and the input voltage should be less than 6 V.
10

Figure 4: Mechanical Wave Driver SF-9324 (Pasco.com, 2014)
Table 1: Specification of Mechanical driver SF-9324 (Pasco.com, 2014)
Property Specification
Frequency Range 0.1 Hz to 5.0 kHz
Amplitude (peak-to-peak) 7 mm at 1Hz
Input Impedance 8 ohms
Maximum Current 1 ampere (fuse limited)
Nominal Current Required <0.25 A
Maximum Input 6 V at 0.8 A
In addition, PASCO provided an acturator mounting rod with diameter of 0.5 inch, which
was not a good choice for the substantial vibration frequency and amplitude. A new mounting
bar was designed using light-weight fiber reinforced material. This bar was then fixed to the
vibration-isolated table, functioning as a damper, diminishing most of the potential reaction
force and vibration from the structure that might cause noise in the output signal.
2.4 Sensors
Four accelerometers including two PCB 302A and two Wilcoxon Research models 780C
were the sensors used for measuring accelerations of 4 floors of the structure. PCB 302A has
11
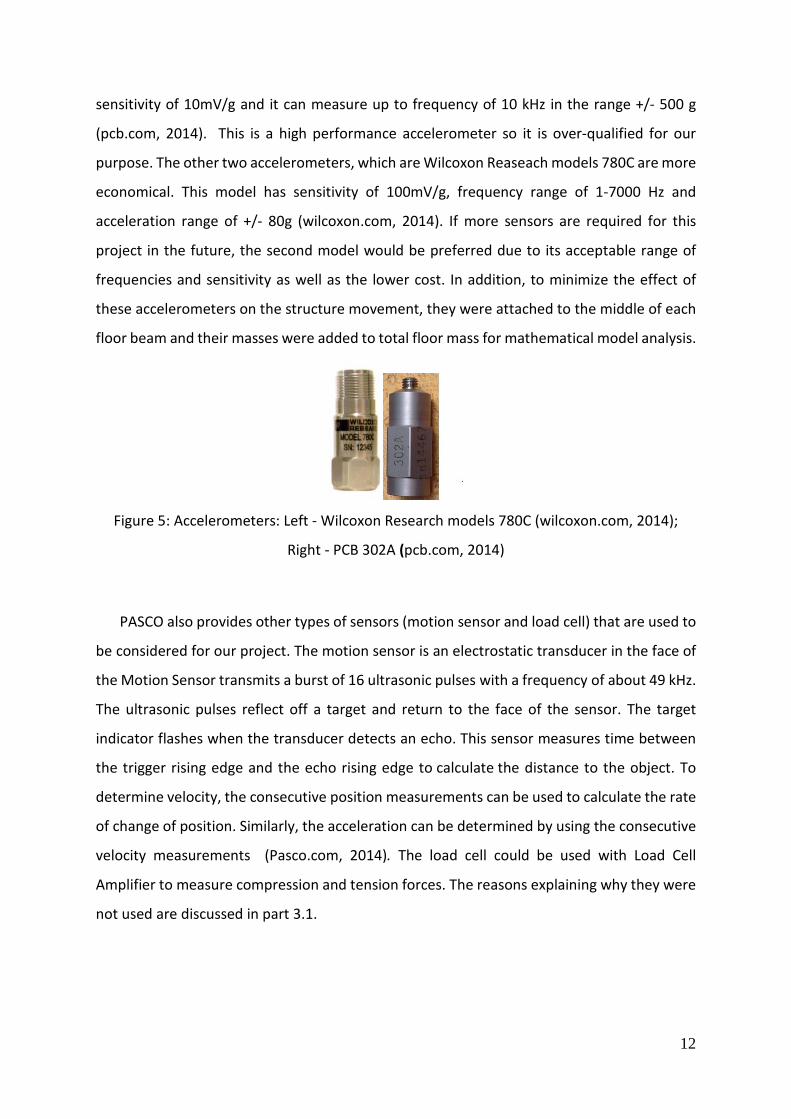
sensitivity of 10mV/g and it can measure up to frequency of 10 kHz in the range +/- 500 g
(pcb.com, 2014). This is a high performance accelerometer so it is over-qualified for our
purpose. The other two accelerometers, which are Wilcoxon Reaseach models 780C are more
economical. This model has sensitivity of 100mV/g, frequency range of 1-7000 Hz and
acceleration range of +/- 80g (wilcoxon.com, 2014). If more sensors are required for this
project in the future, the second model would be preferred due to its acceptable range of
frequencies and sensitivity as well as the lower cost. In addition, to minimize the effect of
these accelerometers on the structure movement, they were attached to the middle of each
floor beam and their masses were added to total floor mass for mathematical model analysis.
Figure 5: Accelerometers: Left - Wilcoxon Research models 780C (wilcoxon.com, 2014);
Right - PCB 302A (pcb.com, 2014)
PASCO also provides other types of sensors (motion sensor and load cell) that are used to
be considered for our project. The motion sensor is an electrostatic transducer in the face of
the Motion Sensor transmits a burst of 16 ultrasonic pulses with a frequency of about 49 kHz.
The ultrasonic pulses reflect off a target and return to the face of the sensor. The target
indicator flashes when the transducer detects an echo. This sensor measures time between
the trigger rising edge and the echo rising edge to calculate the distance to the object. To
determine velocity, the consecutive position measurements can be used to calculate the rate
of change of position. Similarly, the acceleration can be determined by using the consecutive
velocity measurements (Pasco.com, 2014). The load cell could be used with Load Cell
Amplifier to measure compression and tension forces. The reasons explaining why they were
not used are discussed in part 3.1.
12
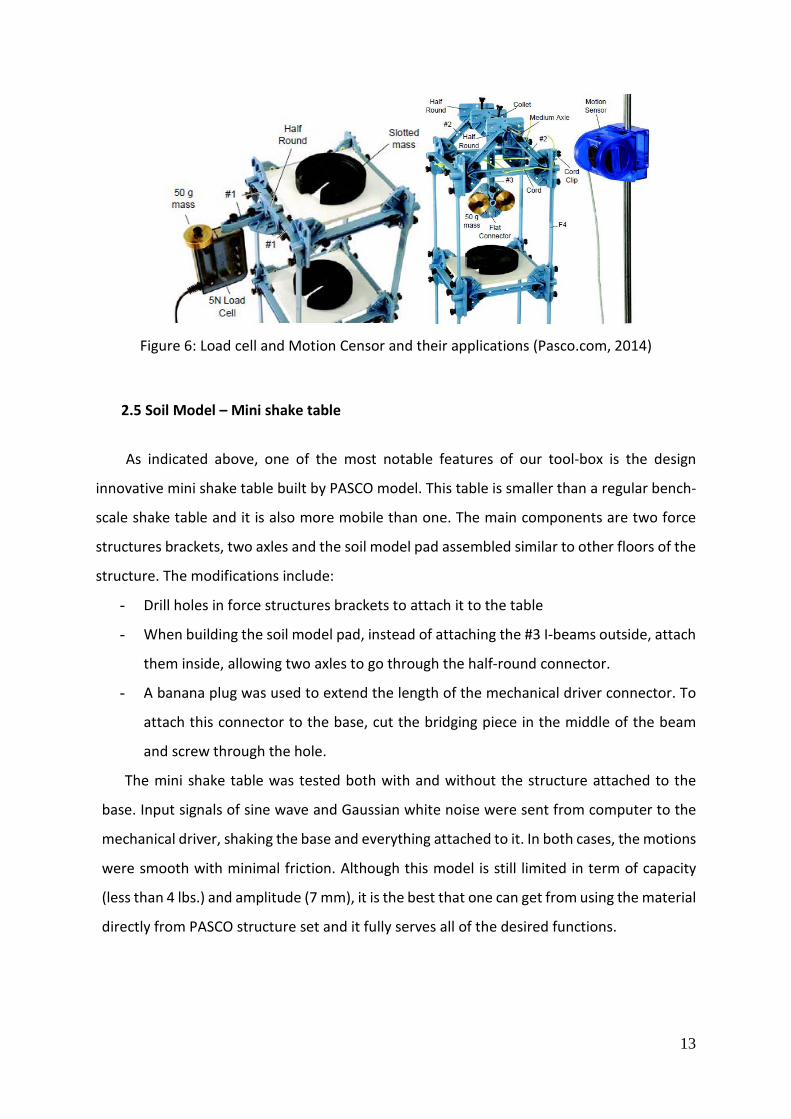
Figure 6: Load cell and Motion Censor and their applications (Pasco.com, 2014)
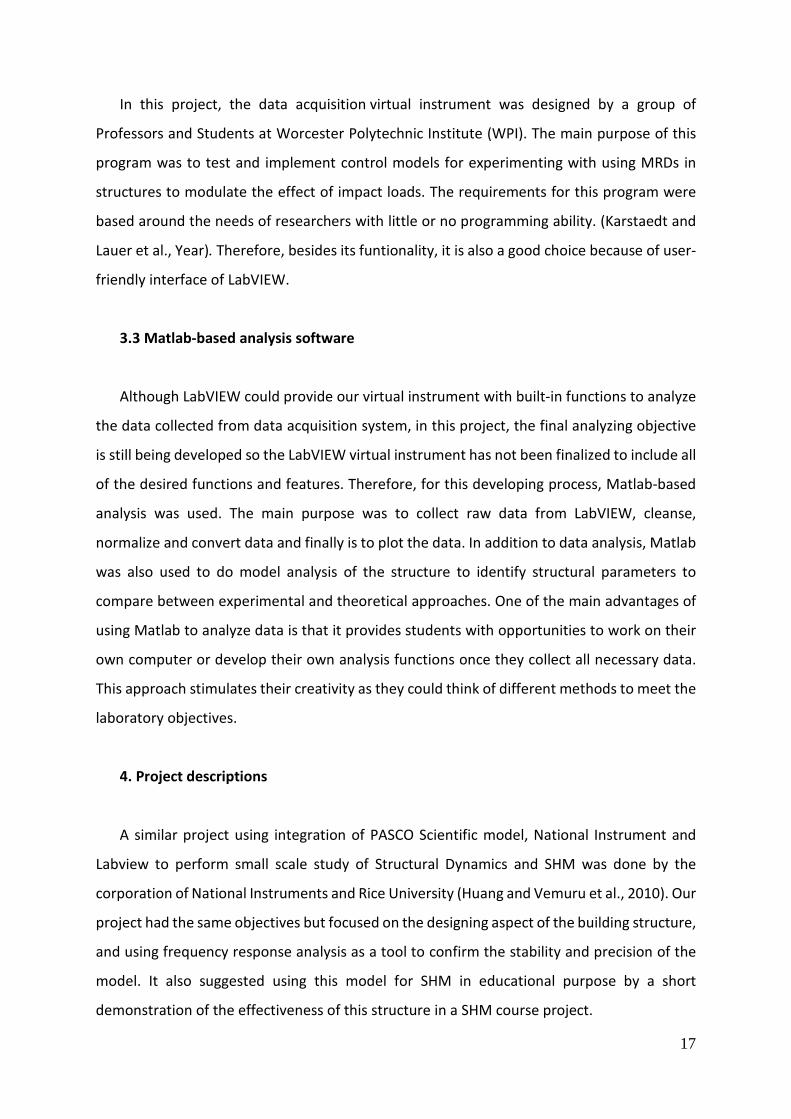
2.5 Soil Model – Mini shake table
As indicated above, one of the most notable features of our tool-box is the design
innovative mini shake table built by PASCO model. This table is smaller than a regular bench-
scale shake table and it is also more mobile than one. The main components are two force
structures brackets, two axles and the soil model pad assembled similar to other floors of the
structure. The modifications include:
- Drill holes in force structures brackets to attach it to the table
- When building the soil model pad, instead of attaching the #3 I-beams outside, attach
them inside, allowing two axles to go through the half-round connector.
- A banana plug was used to extend the length of the mechanical driver connector. To
attach this connector to the base, cut the bridging piece in the middle of the beam
and screw through the hole.
The mini shake table was tested both with and without the structure attached to the
base. Input signals of sine wave and Gaussian white noise were sent from computer to the
mechanical driver, shaking the base and everything attached to it. In both cases, the motions
were smooth with minimal friction. Although this model is still limited in term of capacity
(less than 4 lbs.) and amplitude (7 mm), it is the best that one can get from using the material
directly from PASCO structure set and it fully serves all of the desired functions.
13

Figure 7: Design of mini shake-table
Figure 8: Connection between mechanical driver and structure base/soil model
3. Function Generator, Data acquisition and analysis system
3.1 Function Generator
Although it is recommended by PASCO to send signal to the machincal driver using a
PASCO function generator (Pasco.com, 2014), this option was disregarded due to the inability
14

to produce vibration signals with different patterns other than just basic signal patterns.
Therefore, the solution for function generator was to use LabVIEW and National Instruments
device to send voltage signals. This option provided more options, including all of the desired
signals, not just limited to the basic signals. Also, the most notable advantage of this option is
the capability of generating simulated earthquake signals using input data from MATLAB. As
a result, this virtual instrument can produce any earthquake signal, both periodic and
aperiodic, which is a helpful function for both studying and researching.
3.1 Pasco hardware and software
For the data acquisition system software, PASCO sensors were our first option (with the
capacity of measuring load, displacement, acceleration and velocity) because of the time
capability to demonstrate output signal. Despite this potential, it has a low sampling rate and
inability to customize. More detailed reasons are listed as the advantages and disadvantages
of the system below:
Table 2: Advantages and disadvantages of PASCO system
Advantages of PASCO + Mechanical Driver can excite the model at desiable amplitute (+/-
7mm) and desirable range of frequency (0-5kHz) for cheap price
Disadvantages of
PASCO
+ Acceleration and velocity measurements are derived from
differentiations of displacement, causing noisy data.
+ The laboratory operator cannot customize the control and data
acquisition software to do more advanced functions.
+ Function Generator PI-8127 cannot generate random or more
complex waveforms. It only generates sine, square, triangle,
positive ramp, and negative ramp with a frequency range of 0.001
Hz to 100 kHz (Pasco.com, 2014).
+ The laboratory operator must manually start the function
generator and data acquisition system simultaneously because it is
impossible to integrate PASCO function generator and labVIEW
data aquisition system. As a result, the input and output data
would not perfectly match in time-domain.
15

3.2 National Instruments hardware and LabVIEW software
A better and more practical solution for data acquisition devices and controlling software
was necessary, and National Instruments devices and LabVIEW software were used instead
of PASCO software. By doing this, it was possible to customize our own virtual instruments,
maximizing the potential of the PASCO model as well as making use of high sampling rate of
the sensors, producing valuable information. National Instruments LabVIEW software
originally did not support doing SHM for the building/bridge model but it can be programmed
to function as a data acquisition and analysis system. Thus, National Instruments and labVIEW
were chosen to be our solution for data acquisition system despite the lack of capability to
demonstrate data in real-time due to hardware limit. More details behind this choice are
listed below.
Table 3: Advantages and disadvantages of National Instruments
Advantages of
National
+ Compatible with labVIEW and other devices including PASCO
mechanical driver.
+ Make use of the high sampling rate of accelerometers and PASCO
mechanical driver.
Disadvantages of
National
+ Requires using of GLX Power Amplifier PS-2006 to connect the
mechanical driver of PASCO to NI 9269 for signal/Function
generating
+ Cannot analyze data in real-time due to hardware limitation
(Karstaedt and Lauer et al., Year)
The National Instruments hardware system was specified as: Input and output was
handled by data acquisition and generation hardware from National Instruments. The sensors
received information from control program via a National Instrument SCXI-1000 data
acquisition module. From the LabVIEW control program, signal was converted from digital to
analog by a NI-9174 and a NI-9269. These two devices National Instruments (NI) cDAQ-9174
USB Chassis and NI-9269 Analog Output module work in conjunction to receive a signal from
the computer and send out an analog voltage signal.” (Karstaedt and Lauer et al., Year).
16
In this project, the data acquisition virtual instrument was designed by a group of
Professors and Students at Worcester Polytechnic Institute (WPI). The main purpose of this
program was to test and implement control models for experimenting with using MRDs in
structures to modulate the effect of impact loads. The requirements for this program were
based around the needs of researchers with little or no programming ability. (Karstaedt and
Lauer et al., Year). Therefore, besides its funtionality, it is also a good choice because of user-
friendly interface of LabVIEW.
3.3 Matlab-based analysis software
Although LabVIEW could provide our virtual instrument with built-in functions to analyze
the data collected from data acquisition system, in this project, the final analyzing objective
is still being developed so the LabVIEW virtual instrument has not been finalized to include all
of the desired functions and features. Therefore, for this developing process, Matlab-based
analysis was used. The main purpose was to collect raw data from LabVIEW, cleanse,
normalize and convert data and finally is to plot the data. In addition to data analysis, Matlab
was also used to do model analysis of the structure to identify structural parameters to
compare between experimental and theoretical approaches. One of the main advantages of
using Matlab to analyze data is that it provides students with opportunities to work on their
own computer or develop their own analysis functions once they collect all necessary data.
This approach stimulates their creativity as they could think of different methods to meet the
laboratory objectives.
4. Project descriptions
A similar project using integration of PASCO Scientific model, National Instrument and
Labview to perform small scale study of Structural Dynamics and SHM was done by the
corporation of National Instruments and Rice University (Huang and Vemuru et al., 2010). Our
project had the same objectives but focused on the designing aspect of the building structure,
and using frequency response analysis as a tool to confirm the stability and precision of the
model. It also suggested using this model for SHM in educational purpose by a short
demonstration of the effectiveness of this structure in a SHM course project.
17

Figure 2: Project setup
4.1 Frequency response analysis
In this paper, frequency response analysis was a major tool used in the proposed projects
to prove the qualities of the model. The dynamic characteristics of a structure
(eigenfequencies and corresponding loss factors) can be obtained using the results of
frequency reponse analysis. However, the scope of this paper was limited to demonstrating
the potential of this project based on frequency response analysis. Therefore, our method
considered the change in frequency response of the structure a proof of change in structure
properties without analyzing of the finite element model.The main tool used to do frequency
response analysis was Fast Fourier Transform. This is the method that transforms the signal
from one domain to another domain in which many characteristics of the signals are revealed.
The domain of the original signal is usually the time or spatial while the transformed domain
is the spectral or frequency. The data collected from the accelerometers were initially in time
domain, then were applied Fourier Transform to convert frequency domain for further studies.
18
Various methods including modal analysis and applying Gaussian white noise ground motion
to measure natural frequencies were applied to confirm the precision and stability of the
model.
4.2 Structural health monitoring
SHM was demonstrated based on frequency response analysis to present the potential of
this toolbox in education. Two conditions of the structure including healthy and modifed (or
damaged) were investigated. First, the case of a healthy structure was developed for
reference. Such a case represented the response of the structure without any structural
modification. This was established by using frequency response analysis to determine the
natural frequencies of a un-damaged structure. After that, all possible cases of damage at
different locations causing damage severity ranging from 8% to 25% stiffness reduction were
simulated. Any change would help detecting and evaluating the location and severity of
damages. The damages were simulated by loosening the bolts in the connection between
columns and beam, assuming that these connections carried no force or moment.
5. Proposed course experimental activities
After the structure and its testing system were built, they were tested. It is demonstrated
from both testing and its analysis that the proposed testing framework is useful in teaching
undergraduate students.
5.1 Proposed course description and syllabus
The theoretical concepts of a Structural Dynamics course are proposed in Table 4. The
concepts are very similar to the outline of the book Dynamics of Structures by Anil K Chopra
(Chopra, 2011). Every course and laboratory activity must have clear learning objectives,
which are essential in designing an efficient learning system and also in applying an effective
system of assessment (Feisel and Rosa, 2005). The major intended objectives that students
should achieve at the end of each lab as well as at the end of the course include:
19

1) Instrumentation: Know how to use sensors, National Instruments data acquisition
system and LabVIEW virtual instrument for each experimental purpose.
2) Models: Identify the difference between a theoretical and real model; be able to
create a numerical model in Matlab or Simulink using material properties, section
properties and other structures properties to do computer simulation and mathematical
modal analysis.
3) Data analysis: Demonstrate the ability to collect, analyze and interpret data for each
experimental purpose.
4) Design: Be able to build and assemble the 4-story structure model, develop a
simulation system that could simulate structure response of various input scenario.
5) Basic understanding of structural dynamics, sensor technology and structural health
monitoring.
Table 4: Proposed course syllabus
Theory Experiments
1. Equation of Motion, Problem Statement,
and Solution Methods
- Introduction to data acquisition and
analyzing system
2. Single Degree of Freedom
- Free vibration of undamped system
- Free vibration of damped system
- Free vibration test
- Develop a numerical model of structural in
MATLAB to calculate structure features and
compare with later experiment results
- Free vibration of damped system
experiment
3. Single Degree of Freedom
- Forced vibration of undamped system
- Forced vibration of damped system
- Resonance analysis
- Forced vibration of damped system
experiment (Using Impact Hammer
connected to LabVIEW data acquisition
system)
4. Multi Degree of Freedom
- Free vibration of damped system
- Free vibration of undamped system
- Computer simulation – Simulink of damped
and undamped systems
- Develop a numerical model of structural in
MATLAB to calculate structure features and
compare with later experiment results
20

- Free vibration of damped system
experiment
5. Multi Degree of Freedom
- Forced vibration
- Computer simulation of Earthquake
response of structure
- Test structure under the same earthquake
signal
6. Modal Analysis - Fourier Analysis using Matlab or LabVIEW
- Transform time-domain data to frequency-
domain data
7. Additional topic: Structural Health
Monitoring
- Structural Health Monitoring and Assessing
using frequency response analysis.
Examples of the laboratory activities using this toolbox is presented below. Some of them
require using of additional devices such as impact hammer, or PASCO load cells and motion
sensors (to measure force, acceleration, velocity and deflection under sine wave vibration
input). All of the laboratories are closely tied to course projects and the final project to help
students keep track and be responsible for their work to achieve the final objective of the
whole course. This approach enhances their interest in laboratory activities because they
would have fewer, clearer and more interesting but also more demanding goals for the whole
course. The final project for the course is similar to the SHM example below, in which students
will have an opportunity to design and test a complete case study of SHM, using everything
they have learnt from the course. Before starting this final project, students should be familiar
with the course materials, lab equipment and the other experiment procedure and results.
By then they could fulfill all of the proposed objectives of this course, such as: be able to use
sensors, data acquisitions and analyzing systems; be able to create a numerical model using
computer simulation and observe the difference between simulated and real experiments;
be able to analyze data to assess the structure condition.
21

Figure 9: Proposed course laboratory activities
Collect necessary structural
properties to do modal analysis
Develop Matlab code to perform modal
analysis
Calculate theoretical structural
natural frequencies
Collect data from
LabVIEW and National
Instruments data acquisition
system
Save the data into
appropriate format to be
used in Matlab
Convert time-domain to frequency-
domain using Fast Fourier Transform
(FFT)
Structure
Estimate and dentify structural
natural frequencies
Collect data of different
conditions of structure
Identify structural
natural frequencies of each condition
Clean and normalize
data of natural
frequencies
Compare to experimental
results
Assess structural conditions
using natural
frequencies
22
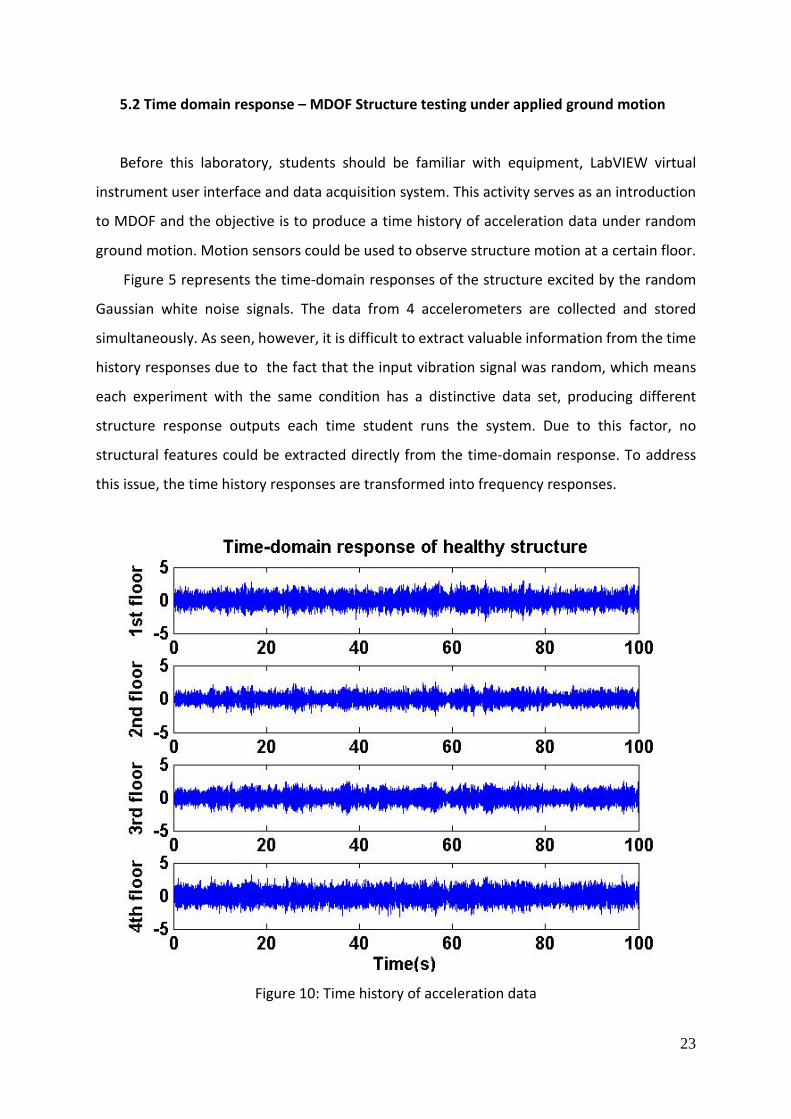
5.2 Time domain response – MDOF Structure testing under applied ground motion
Before this laboratory, students should be familiar with equipment, LabVIEW virtual
instrument user interface and data acquisition system. This activity serves as an introduction
to MDOF and the objective is to produce a time history of acceleration data under random
ground motion. Motion sensors could be used to observe structure motion at a certain floor.
Figure 5 represents the time-domain responses of the structure excited by the random
Gaussian white noise signals. The data from 4 accelerometers are collected and stored
simultaneously. As seen, however, it is difficult to extract valuable information from the time
history responses due to the fact that the input vibration signal was random, which means
each experiment with the same condition has a distinctive data set, producing different
structure response outputs each time student runs the system. Due to this factor, no
structural features could be extracted directly from the time-domain response. To address
this issue, the time history responses are transformed into frequency responses.
Figure 10: Time history of acceleration data
23

5.2 Frequency domain response – Fourier Analysis Using Matlab
This laboratory introduces students to analyzing/transforming data using Matlab. Before
this activity, students should understand the basic concepts of Discrete Fourier Transform,
frequency domain, sampling rate, aliasing and the algorithm of Fast Fourier Transform.
Matlab interface and simple functions are also designed in the theory part prepared for this
course.
To achieve the objective of this laboratory, students should have a fundamental
background in Matlab or any programming language or be able to learn in a short time. Most
of the Matlab functions are provided by the instructor but students still need to understand
the given codes to develop new ones by themselves to do their final project. The main steps
of the provided Matlab analysis are shown below:
Figure 11: Frequency domain response laboratory
Figure 12 shows the frequency responses obtained using Fast Fourier Transform. Due to
resonance, the structure had a tendency to respond with greater amplitude to the input
frequencies that matched its four natural frequencies. Thus, when all of the frequency and
amplitude of responses were added up together in frequency domain, only the peaks at
natural frequencies of the structure were noticeable and useful for determining the condition
of structure. By transforming the original data into another domain, more useful and precise
decisions to determine the condition of structure could be made. After doing this, 4 natural
frequencies of this structure were estimated to be 2.548 Hz, 8.058 Hz, 13.139 Hz and 16.769
Hz.
Collect data from
LabVIEW and National
Instruments data acquisition
system
Save the data into
appropriate format to be
used in Matlab
Convert time-domain to frequency-
domain using Fast Fourier Transform
(FFT)
Identify structural
natural frequencies
24

Figure 12: Output data of acceleration in frequency domain
5.3 Modal analysis - Development of numerical model of structural in Matlab
After getting familiar with Matlab, students approach this laboratory in a more advanced
level, which requires knowledge of both MDOF structure dynamics analysis and Matlab
programing. They need to measure and calculate structure properties to get values for
inputting in their Matlab code to do modal analysis of the structure.
Figure 13: Modal analysis laboratory
Collect necessary structural
properties to do modal analysis
Develop Matlab code to perform modal
analysis
Calculate theoretical structural
natural frequencies
Compare to experimental
results
25

The result of modal analysis of structure was calculated to compare to the experimental
result to confirm the precision of this structure. The PASCO structure was modeled as a 4-
story 2-dimensional structure. Every property of this structure is calculated and measured
from the real case or from PASCO manual and recorded in table 5.
Table 5: Structure properties
Mass (lb.s2/in) Stiffness (lb./in) Damping
1st floor 0.590 4.184 0.504
2nd floor 0.590 4.184 0.504
3rd floor 0.618 4.184 0.518
4th floor 0.588 4.184 0.503
Although only mass and stiffness contributed to natural frequencies calculation in
frequency response analysis, the damping was still approximated using Rayleigh damping
with coefficients of 0.5 and 0.05. The eigenfrequencies of the equations were calculated and
compared to the result of the experimental approach:
Table 6: Natural frequencies from experimental approach and analytical approach
Experimental Method Analytical approach
1st natural frequency (Hz) 2.548 2.814
2nd natural frequency (Hz) 8.058 7.894
3rd natural frequency (Hz) 13.139 12.142
4th natural frequency (Hz) 16.769 14.840
5.4 Structural Health Monitoring – Final Project
Basically, this laboratory activity is a review of all previous experiments, in which the final
objective is to understand the basic concept of SHM using what students have learnt in the
whole course. Additionally, new concepts that are introduced in this final project include SHM,
data cleansing, data normalization and structure condition assessment using collected data.
26

Figure 14: Final Project
There were 8 conditions of a structure considered, including one healthy condition and
7 damaged conditions with severity ranging from 8% to 25% stiffness reduction. For
determining the frequency response of each condition, a Gaussian white noise random signal
was driven for 100 seconds using the PASCO mechanical driver. This process was done 60
times for each condition. Each experiment produced 4 sets of 4 natural frequencies (from 4
floors). As a result, after 60 experiments, 240 values of each natural frequency of each case
were collected. The result then was recorded for observing the shifting in natural frequencies
of each case:
Figure 15: Natural frequencies of different structure conditions
Collect data of different
conditions of structure
Identify structural
natural frequencies of each condition
Clean and normalize
data of natural
frequencies
Assess structural conditions
using natural
frequencies
27

For better visualization, collected acceleration data were assumed to be normally
distributed:
Figure 16: First natural frequency distribution
Figure 17: Second natural frequency distribution
28
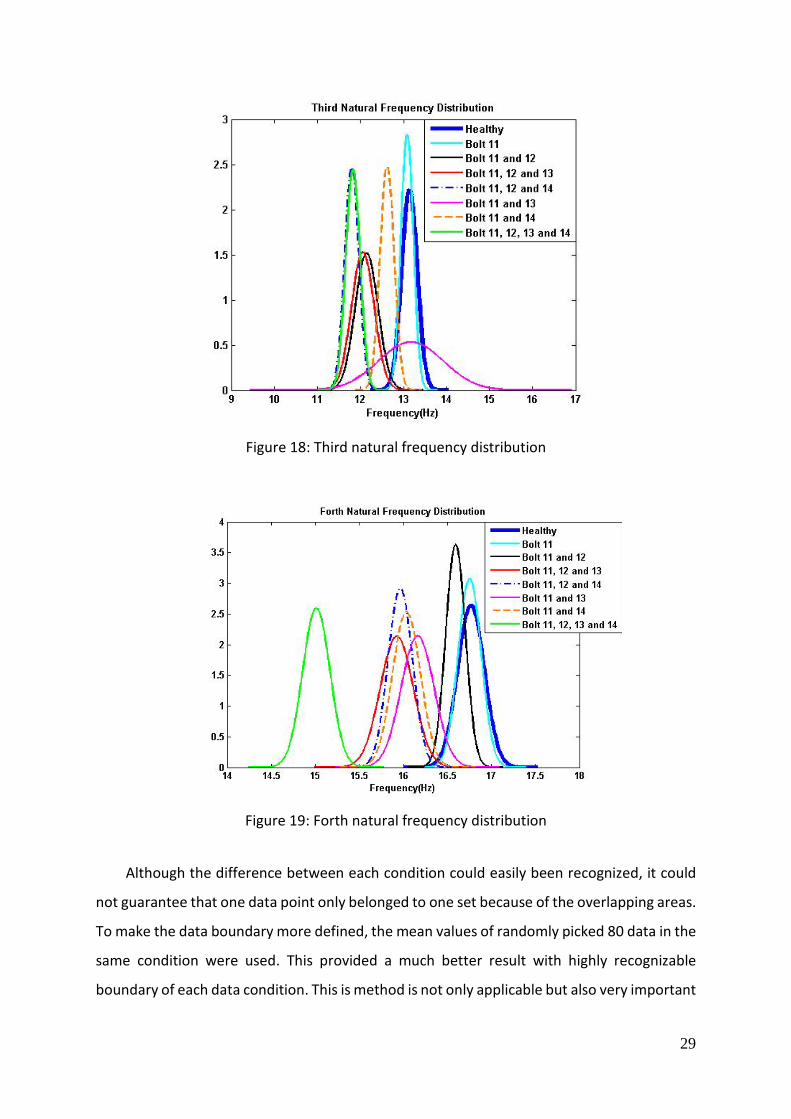
Figure 18: Third natural frequency distribution
Figure 19: Forth natural frequency distribution
Although the difference between each condition could easily been recognized, it could
not guarantee that one data point only belonged to one set because of the overlapping areas.
To make the data boundary more defined, the mean values of randomly picked 80 data in the
same condition were used. This provided a much better result with highly recognizable
boundary of each data condition. This is method is not only applicable but also very important
29

in real life. Data size and standard deviation are so large due to various conditions of
operations and environment that normalization is essential to reduce the spread-out of data
but still convey the general characteristics of the structure (Farrar and Worden, 2007). This
could be observed in figure 20 and figure 20, which show highly separated sets. Using this
result as a reference, decision could be made to determine structure condition.
Figure 20: Normalized data of natural frequencies
30

Figure 21: Normalized data of natural frequencies
6. Limitations
As a matter of fact that our approach was the first design and it emphasized on both
functionality and cost-effectiveness, there were still some limitations that, in our opinion, did
not affect the output but should be eliminated in the next studies. First, due to the fact that
the PASCO structure set was not optimized for modeling the soil model, our structure
connection to the soil model was not perfect. This resulted in a connection to the ground that
did not carry all of the moment. Although this was negligible when the input vibration
frequency was high, it caused a small torsion in the top of structure under low input vibration
frequency (less than 2Hz). The solution to this could be to use a bigger rod that fits perfectly
inside the truss hole to make the soil model. Second, as the price of sensors was high and the
goal of this project was to produce a cost-effective package, it was compromised by
minimizing the number of sensors. For example, the shake table project of Colorado
University, the authors used Analog Device Accelerometers (Wallen and Larson, 2007) instead
of the PZT ones. This could increase our number of accelerometers by 3-4 times while still
maintaining the cost-effective factor.
31

7. Conclusions
A hands-on activity-based educational module is developed in this paper. It is developed
through the integration of PASCO models, LabView, NI hardware, sensors, and MATLAB
software. Despite some existing limitations, the results successfully showed that this
structure worked precisely and stably, producing good output data. It was proved as a
potential tool for Structural Dynamics as well as SHM education and study in which, each case
of damaged structure had a distinctive property (in this paper, the property was
demonstrated in term of natural frequencies) and could be separated using classifying
algorithms. In conclusion, this project successfully proposed the development of a novel
hands-on toolbox for advanced educations. This toolbox is expected to serve as a link between
theory and practice in Structural Dynamics education. Moreover, the tool would enhance
student motivation by providing them valuable experience working with physical model and
collecting real data. The toolbox was developed through the extensive integration of PASCO
models, LabVIEW computational program, sensors, and actuators. Although there still exist
some limitations, it plays an important role in proposing the potentials of this toolbox with its
cost-effective, user friendly and stable factors. Further studies should concentrate on
optimizing, making the system more reliable and stable to increase the potential. Also, this
tool would be used as an additional laboratory activity for students in Structure Dynamics
related courses. The results and feedbacks will be monitored and analyzed for future
improvement.
32

Reference Lists
Albu, M. M., Holbert, K. E., Heydt, G. T., Grigorescu, S. D. and Trusca, V. 2004. Embedding
remote experimentation in power engineering education. Power Systems, IEEE
Transactions on, 19 (1), pp. 139--143.
Chopra, A. K. 2011. Dynamics of structures. Englewood Cliffs, N.J.: Prentice Hall.
Constantinou, M. 1994. Principles of friction, viscoelastic, yielding steel and fluid viscous
dampers: Properties and design. In: Soong, T. and Constantinou, M. eds. 1994. Passive
and Active Structural Vibration Control in Civil Engineering. New York: Springer-Verlag,
Wien. 209-240.
Dyke, S., Christenson, R., Jiang, Z., Gao, X. and Feinstein, Z. 2007. Teleoperation Tools for
Bench-scale Shake Tables for Instruction in Earthquake Engineering. n Seismological
Research Letters, 78 (4), Available at:
https://engineering.purdue.edu/UCIST/publications/publications/EDUquake_UCIST_fin
al.pdf [Accessed: 5th Feb 2014].
Turner, Alyn, Sandra Shaw Courter, and Shirley Dyke. 2011. Innovative shake table laboratory
instruction:
Implementation and assessment of student learning. American Society for Engineering
Education, Conference, Proceedings, AC 2011-1505.
Elgamal, A., Fraser, M. & McMartin, F. 2005, "On-Line Educational Shake Table
Experiments", Journal of Professional Issues in Engineering Education and Practice,vol.
131, no. 1, pp. 41-49.
Farrar, C.R. & Worden, K. 2007, "An introduction to structural health
monitoring", Philosophical Transactions of the Royal Society A: Mathematical, Physical
and Engineering Sciences,vol. 365, no. 1851, pp. 303-315.
Feisel, L. D. and Rosa, A. J. 2005. The role of the laboratory in undergraduate engineering
education. Journal of Engineering Education, 94 (1), pp. 121--130.
Froyd, J. E., Wankat, P. C. and Smith, K. A. 2012. Five major shifts in 100 years of engineering
education.Proceedings of the IEEE, 100 (Special Centennial Issue), pp. 1344--1360.
33
Goodwin, G. C., Medioli, A. M., Sher, W., Vlacic, L. and Welsh, J. S. 2011. Emulation-based
virtual laboratories: a low-cost alternative to physical experiments in control engineering
education. Education, IEEE Transactions on, 54 (1), pp. 48--55.
Huang, C., Vemuru, S., Nagarajaiah, S., Marwar,, R., Sharad, S., Potter,, D., Young, N., Hanks,
A. and Stogner, D. 2010. Brid g g e Structural Health Monitorin g : Enhanced Learning
Experience with PASCO and NI CompactDAQ. [report].
Hurlebaus, S., Stocks, T. & Ozbulut, O.E. 2012, "Smart structures in engineering
education", Journal of Professional Issues in Engineering Education and Practice, vol. 138,
no. 1, pp. 86.
Karstaedt, S., Lauer, H., Kim, Y. and El-Korchi, T. n.p. Dynamic Control of Magnetorheological
Dampers in Concrete Bars.
Nees.buffalo.edu. 2014. nees@Buffalo - George E Brown Network for Earthquake Engineering
Simlation - Buffalo Node. [online] Available at: http://nees.buffalo.edu/ [Accessed: 10
Apr 2014].
Nees.ucsd.edu. 2014. NEES @ UC San Diego. [online] Available at: http://nees.ucsd.edu/
[Accessed: 10 Apr 2014].
Orduna, P., Garcia-Zubia, J., Rodriguez-Gil, L., Irurzun, J., Lopez-de-Ipiña, D. & Gazzola, F. 2012,
"Using LabVIEW remote panel in remote laboratories: Advantages and disadvantages",
IEEE, , pp. 1.Pasco.com. 2014. Tech Note 1060 - Cross section and material properties for
structure system beams.. [online] Available at:
http://www.pasco.com/support/technical-
support/technote/techIDlookup.cfm?TechNoteID=1060 [Accessed: 6 Feb 2014].
Pasco.com. 2014. PASCO Structures System Advanced Structures Set ME-6992B. [online]
Available at: http://www.pasco.com/file_downloads/product_manuals/Advanced-
Structures-Set-Manual-ME-6992B.pdf [Accessed: 6 Feb 2014].
Pasco.com. 2014. PASCO Structures System Advanced Structures Set ME-6992B. [online]
Available at: http://www.pasco.com/file_downloads/product_manuals/Advanced-
Structures-Set-Manual-2-ME-6992.pdf [Accessed: 6 Feb 2014].
Pasco.com. 2014. Motion SensorPS-2103A. [online] Available at:
http://www.pasco.com/file_downloads/product_manuals/PASPORT-Motion-Sensor-
Manual-PS-2103A.pdf [Accessed: 6 Feb 2014].
34

Pasco.com. 2014. PASCO Structures System Load Cell, 5 N PS-2201. [online] Available at:
http://www.pasco.com/file_downloads/product_manuals/5N-Load-Cell-Manual-PS-
2201.pdf [Accessed: 6 Feb 2014].
Pasco.com. 2014. Function Generator PI-8127. [online] Available at:
http://www.pasco.com/file_downloads/product_manuals/Function-Generator-
Manual-PI-8127.pdf [Accessed: 6 Feb 2014].
Pasco.com. 2014. Bridge Set Manual. [online] Available at:
http://www.pasco.com/file_downloads/product_manuals/Bridge-Set-Manual-ME-
6991.pdf [Accessed: 6 Feb 2014].
Pasco.com. 2014. PASCO Waves and Sound Mechanical Wave Driver SF-9324. [online]
Available at: http://www.pasco.com/file_downloads/product_manuals/Mechanical-
Wave-Driver-Manual-SF-9324.pdf [Accessed: 6 Feb 2014].
pcb.com. 2014. Product catalog. [online] Available at:
http://www.pcb.com/linked_documents/vibration/vib300e_1204.pdf [Accessed: 6 Feb
2014].
Peer.berkeley.edu. 2014. UC Berkeley Shaking Table. [online] Available at:
http://peer.berkeley.edu/laboratories/shaking_table.html [Accessed: 10 Apr 2014].
Sohn, H., Farrar, C. R., Hemez, F. M. and Czarnecki, J. J. 2002. A Review of Structural Health
Review of Structural Health Monitoring Literature 1996-2001.
Torrey, D. A. 1994. A project-oriented power electronics laboratory. Power Electronics, IEEE
Transactions on, 9 (3), pp. 250--255.
Wallen, R. and Larson, K. 2007. CU-NEES Instructional Shaking Table. [report].
wilcoxon.com/. 2014. General purpose, compact accelerometer 780B and 780C. [online]
Available at:
http://www.wilcoxon.com/prodpdf/780B%20and%20780C%20spec%20(99014)B.pdf
[Accessed: 6 Feb 2014].
Zhang, Y. & Lu, L. 2008, "Introducing Smart Structures Technology into Civil Engineering
Curriculum: Education Development at Lehigh University", Journal of Professional Issues
in Engineering Education and Practice, vol. 134, no. 1, pp. 41-48.
35