development of descriptors for color image browsing …sahil/data/cbir-report.pdf · development of...
TRANSCRIPT

Sahil Narang 2011
1
Development of Descriptors for Color
Image Browsing and Retrieval
Report Submitted in partial fulfillment of the requirement for the degree of
Bachelor of Technology
In
Computer Science and Engineering
By
Sahil Narang
To
MAHARAJA SURAJMAL INSTITUTE OF TECHNOLOGY
Affiliated to Guru Gobind Singh Indraprastha University Janak Puri, New Delhi-110058.
July 2011

Sahil Narang 2011
2
Acknowledgement
I thank my respected guide, Mr. D. N. Verma, Scientist, E-grade, DTRL, DRDO,
Ministry of Defence, Delhi from the bottom of my heart for his excellent guidance and
supervision through all the phases of the development of this project. I would also like
to thank my fellow internee, Bhawana Juneja, 3rd
Year Undergraduate, B.E. (I.T.),
NSIT, for her cooperation and work in this project.
It was due to Mr. Verma‟s toiling efforts that we worked towards submission of a
research paper in an international conference. He encouraged us to gather the
professional knowledge and material for the completion of this project. He helped us
with his invaluable and finest suggestions to give shape and finesse to the work done.
I sincerely hope that users will find this project useful. Whatever intellectual effort
may be reflected from this report is the direct result of the informative and stimulating
discussions that I have had in the course of this internship. Given the time constraint
and continuous nature of a research activity, there is always a scope to ameliorate
image retrieval techniques.
Sahil Narang

Sahil Narang 2011
3
Defence Research and Development
Organization I. ABOUT DRDO
DRDO was formed in 1958 from the amalgamation of the already functioning Technical development Establishment (TDEs) of the Indian Army and the Directorate of Technical Development and Production (DTDP) with the Defence Science Organization (DSO). DRDO was then a small organization with 10 establishments or laboratories. Over the years, it has grown multi directionally in terms of the variety of subject disciplines, no. of laboratories, achievements and stature.
Today, DRDO is a network of 51 laboratories which are deeply engaged in developing Defence technologies covering various disciplines, like aeronautics, armaments, electronics, combat vehicles, engineering systems, instruments, missiles, advanced computing and simulation, special materials, naval systems, life sciences, training, information systems and agriculture. Presently, the organization is backed by over 5000 scientists and about 25,000 other scientific, technical and supporting personnel. Several major projects for the development of missiles, armaments, light combat aircrafts, radars electronic warfare systems etc are on hand and significant achievements have already been made in several such technologies.
II. ABOUT DTRL
A. Historical Background
Terrain evaluation activities were initiated in Defence Research and Development Organization (DRDO) with the creation of Terrain Evaluation Cell (TEC) in Feb. 1964 with the objectives of development of techniques for terrain evaluation, and assessment of mobility potential of inaccessible areas. TEC over a period of 17 years completed a number of assignments. In view of the potential and vitality of terrain information, TEC was expanded and accorded to the status of a full fledged laboratories in December, and was renamed as Defence Terrain and Research Laboratory (DTRL).
B. Areas of work
Development of a reliable system for assessment of terrain characteristics through modern techniques of terrain evaluation.
Development of infrastructure, competence and instrumentation in the latest techniques of terrain evaluation.
Development of terrain information database.
Ground water study, landslide and hazard zonation, and geo-environmental studies.

Sahil Narang 2011
4
C. Achievements
Improvement in mapping by using better resolution data (5.6m in PAN Mode and 23.5m in LISS III mode) from IRS_IC and IRS_ID satellites.
Use of digital information data of satellite imagery for preparation of different thematic maps.
Use of geographic information system (GIS) to achieve automation of information mobility maps.

Sahil Narang 2011
5
Synopsis
Name of Student: Sahil Narang
Enrollment No.: 07415002709
Degree: B.Tech. (C.S.E.)
Department: Defence Terrain Research Laboratory (DTRL)
Organization: Defence Research and Development Organization (DRDO), Ministry of Defence, Delhi
Project Title: “Development of Descriptors for Color Image Browsing and Retrieval”
Name of Project Supervisor: Mr. D. N. Verma, Scientist „E‟, DTRL, DRDO
Month and Year of Project Completion: July, 2011
Project Description:
Content Based Image Retrieval (CBIR) provides efficient and effective means to extract most similar images stored in the database based on image contents. It is a technique which aims at retrieving images which are perceptually and semantically meaningful by making the best use of a single or combination of visual content descriptors. The major steps are feature extraction and similarity comparison.
This research based project expands along the four approaches. An overview of the entire work done is presented here.
Texture Based Image Retrieval using Correlation
Texture analysis is one of the widely used operations for feature extraction. The first method computes the features by calculating weighted standard deviation on Haar Discrete Wavelet Transform of image along with correlation between the bands. The texture features thus extracted are subjected to similarity comparison and few images with higher similarity value are retrieved. It depicts the improved precision of the proposed texture approach over the previously tested WSD, GLCM and Gradient methods.

Sahil Narang 2011
6
Image Retrieval based on Multi-feature Fusion
Computer-assisted search for an image can be done by extracting one or more salient characteristics like shape, colour, texture, and pattern. It is done through a search of exactly or relatively similar images considering a fusion of two prominent descriptors namely, texture and colour as search criteria.
An image is searched for given query image on the basis of collaborated similarity of colour and texture features. Experiments have shown that search results were accurate and impressive on all types of images. Concluding, this approach is practically useful in searching for similar images.
A rigorous and in-depth exploration of color and texture feature descriptors is performed to attain desired performance accuracy in image browsing. The project can be further extended to include other visual descriptors such as shape to further enhance the quality of Content based Image Retrieval System.
Image Browsing based on Multi-feature Fusion
Object/region identification and search form challenging tasks in image interpretation which is itself a hot research area under the broad spectrum of CBIR.
Thus, this is a novel distributed approach for searching parts of images. An image is searched for given small image on the basis of collaborated similarity of color and texture features. Experiments have shown that search results were accurate and impressive on all kinds of images. Concluding, this approach is practically useful in searching and highlighting multiple occurrences of some given object anywhere in the image along with the near similar regions.
A rigorous and in-depth exploration of color and texture feature descriptors is performed to attain desired performance accuracy in image browsing. The project can be further extended to include other visual descriptors such as shape to further enhance the quality of Content based Image Retrieval System.

Sahil Narang 2011
7
Table of Contents
SERIAL. NOS. TOPICS PAGE NOS.
I Introduction 8
II Software Requirements Specification 13
III Research and Exploration 21
IV Software Design Specification 36
V Software Testing 58
VI Experimental Results 64
VII Software Planning and Execution 79
VIII User Interface Design and Testing 82
IX Research Papers Submitted 95
X Appendix 96
XI References 115

Sahil Narang 2011
8
Introduction
SERIAL. NOS. TOPICS PAGE NOS.
I Digital Image Processing 9
A Introduction 9
B Image File Formats 9
C Image File Size 9
II CBIR 9
A Text Based Image Retrieval 9
B Content Based Image Retrieval 10
B.1 Steps followed in CBIR 10
C Image Content Descriptors 10
C.1 Color 11
C.2 Texture 11
C.3 Shape 12
D Similarity/Distance Measure 12
G Performance Evaluation 12

Sahil Narang 2011
9
I. DIGITAL IMAGE PROCESSING
A. Introduction
An image may be defined as a two dimensional function f(x, y) where x & y are spatial coordinates and the amplitude of function f at any pair of coordinates (x, y) is called intensity of image at that point (also known as a pixel). When x, y, f(x, y) are all finite discrete quantities we call the image a digital image. Digital image processing encompasses processes whose inputs and outputs are images and processes that extract attributes from images, up to and including the recognition of individual objects. These processes fall under three broad categories:
1. Low Level: These involve primitive operations such as image manipulation to reduce noise, contrast enhancement and image sharpening.
2. Mid Level: It involves tasks such as segmentation, description of objects to reduce them to a form suitable for computer processing and classification of individual objects. Mid-level processes are characterized by the fact that their inputs generally are images, but outputs are attributes extracted from those images.
3. High Level: It deals with making sense of an ensemble of recognized objects extracted from the mid-level processes.
The mid-level and high level operations can be exploited for extracting useful information from a digital image which opens the way to Content Based Image Retrieval.
B. Image File Formats
Image file formats are standardised means of organising and storing images. The digital image formats are used to store photographic and other images. Image files are composed of either pixel or vector (geometric) data. The pixels that compose an image are ordered as a grid (columns and rows); each pixel consists of numbers representing magnitudes of brightness and color. Major graphic file formats are:
Raster Formats: JPEG, TIFF, BMP, RAW, PNG, GIF.
Vector Formats: CGM, SVG.
C. Image File Size
It is expressed as the number of bytes that increases with:
1. The number of pixels composing an image- the greater the number of rows and columns, the greater the image resolution and the larger the file
2. Color depth of pixels- each pixel of an image increases in size when its color depth increases-an 8-bit pixel (1 byte) stores 256 colors, a 24-bit pixel (3 bytes) stores 16 million colors, the latter known as true color.
II. CONTENT BASED IMAGE RETRIEVAL
The term CBIR can be properly studied by focusing on two aspects.
A. Text based Image Retrieval
As the term image retrieval denotes, it deals with searching images from a vast database fulfilling a user specified criterion. A traditional way of specifying search criteria is Query by Text (QbT). In QbT, queries are texts and targets are images. To access the desired image data, the seeker can construct queries using homogeneous descriptions, such as keywords while the images in the database have to be annotated

Sahil Narang 2011
10
with words, such as time, place, or photographer. Such retrieval is known as annotation/text based image retrieval. This annotation scheme comes with certain inherent disadvantages which cannot be overlooked as the size of image database increases. The disadvantages are:
1. Since automatically generating descriptive texts for a wide spectrum of images is not feasible, most text-based image retrieval systems require manual annotation of images which is a cumbersome and expensive task for large image databases, and is often subjective, context-sensitive and incomplete. As a result, it is difficult for the traditional text-based methods to support a variety of task-dependent queries.
2. The efficient management of rapidly expanding visual information poses an urgent problem.
B. Content Based Image Retrieval
The disadvantages mentioned above formed the driving force behind the emergence of CBIR. Content-based image retrieval (CBIR) uses visual information of the images to retrieve them from large image databases according to user‟s interest. The approach where user‟s interest can be expressed by an example image is called Query by Example (QbE). Here, both query and targets are images. In this type of retrieval, the image database can be efficiently managed by using the properties of the visual information.
B.1) Steps followed in CBIR:
1. The visual contents of the images in the database are extracted and described by multi-dimensional feature vectors. The feature vectors (Image Content Descriptors) of the images in the database form a feature database.
2. Users provide the retrieval system with example images, which are changed into internal representation of feature vectors.
3. The similarities/ distances between the feature vector of the query example and those of the images in the database are calculated.(Similarity Metric)
4. Indexing scheme is used to retrieve images according to the similarity values by providing an efficient way to search the image database.(Indexing Schemes)
5. User‟s relevance feedback can be incorporated to modify the retrieval process in order to generate perceptually and semantically more meaningful results. (Relevance Feedback)
C. Image Content Descriptors
The purpose of image content descriptors is to transform human perceptible qualitative features (content) of an image into an approximate quantitative measure. For example, if we consider the color content of an image, we wan well distinguish a red rose from a white one by calculating the amount of redness or whiteness present in them. The content of an image can be categorically divided as shown in the diagram below.

Sahil Narang 2011
11
C.1) Color
Colors that human perceive in an object are determined by the nature of light reflected from the object. Color is the most widely used visual content for image retrieval. Its extensive use can be attributed to the following factors:
1. It is a descriptor that simplifies feature identification and extraction.
2. Its 3 dimensional values make its discrimination potentially superior to the single dimensional gray values of images.
To facilitate the representation of colors in some standard, generally accepted way, color models are used. A color model is a specification of a coordinate system and a subspace within that system where each color is represented by a single point. Commonly used color space for image retrieval include RGB, Munsell, CIE L*a*b*, CIE L*u*v*, HSV and opponent color space. RGB color space corresponds closely with the way humans describe and interpret color.
Color descriptors: Color Histogram, Color Coherence Vector, Color Correlogram, Color Moments
C.2) Texture
Texture can be defined by certain constant, slowly varying or periodic local statistical properties computed over different regions of an image. This descriptor, intuitively, provides measures of properties such as smoothness, coarseness, and regularity of an image. Three principal approaches used in image processing to describe the texture of a region are:
1. Statistical Approach characterizes texture as smooth, coarse, grainy and so on.
Statistical descriptors: Fourier power spectra, co-occurrence matrices, Tamura features (coarseness, contrast, directionality, regularity, roughness, line likeness), Markov random field, Wold features (harmonic, evanescent, indeterministic), fractal model, multi-resolution filtering techniques such as Gabor and Wavelet transform.
2. Structural techniques deal with the arrangement of image primitives such as the description of texture based on regularly spaced parallel lines
Structural descriptors: morphological operator, adjacency graph.
Image Content
Visual Semantic
Texture Color Shape
General Domain Specific
Application Dependant
Fig.1. Categories of Image Content Descriptors

Sahil Narang 2011
12
3. Spectral techniques are based on properties of the Fourier spectrum and are used primarily to detect global periodicity in an image by identifying high-energy, narrow peaks in the spectrum.
C.3) Shape
Shape features are usually described after images have been segmented into regions or objects. Since robust and accurate image segmentation is difficult to achieve, the use of shape features for image retrieval has been limited to special applications where objects or regions are readily available. The state-of-art methods for shape description can be categorized into boundary-based (rectilinear shapes, polygonal approximations, etc.) and region-based (statistical moments) methods.
Shape descriptors: Moment Invariants, Turning Angles, Fourier descriptors, Circularity, Eccentricity and Major Axis Orientation.
D. Similarity/Distance Measures
Image content descriptors describe the image content in terms of multi-dimensional feature vectors. A comparison of feature vectors of two different images gives the degree of similarity between them. Instead of exact matching of descriptors, content-based image retrieval calculates visual similarities of a query image with images in a database. Accordingly, the retrieval result is not a single image but a list of images ranked by their similarities with the query image. Many similarity measures have been developed for image retrieval based on empirical estimates of the distribution of features in recent years. Different similarity/distance measures will affect retrieval performances of image retrieval system significantly.
Similarity Metrics: Minkowski-Form distance, Quadratic Form distance, Mahalanobis Distance, Kullback-Leibler Divergence and Jeffrey-Divergence.
E. Performance Evaluation
The performance of a retrieval system should be evaluated to determine the efficiency of retrieving relevant images according to the query given by the user.
Performance Measures: Recall, Precision (retrieval accuracy), Average Normalised Modified Retrieval Rank (ANMRR),

Sahil Narang 2011
13
Software Requirements Specification
SERIAL. NOS. TOPICS PAGE NOS.
I Introduction 14
A Purpose 14
B Scope 14
C Definitions, Acronyms & Abbreviations 14
D References 14
E Overview 14
II Problem/Overall Description 15
A Product Perspective 15
A.1 Software Interfaces 15
A.2 User Interface 15
B Product Functions 16
C User Characteristics 16
D Constraints 16
E Assumptions & Dependencies 16
III Specific Requirements 16
A External Interfaces 16
B Functions 16
B.1 Searching & Retrieving whole images 17
B.2 Browsing & Retrieving parts of images 19
B.3 Validity checks on Inputs 19
C Logical Database Requirements 19
C.1 Entity Relationship Diagram 19
D Other 20
D.1 Research 20
D.2 Test Data 20

Sahil Narang 2011
14
I. INTRODUCTION
A. Purpose
The SRS is a technical specification of requirements for the software products. The goal of software requirement definition is to completely and consistently specify the technical requirements for the software product in a concise and unambiguous manner.
Thus, the purpose of this document is to describe the external requirements for the research and development of color, texture and shape (visual content) descriptors for content based image retrieval. It is a culmination of requirements that arose at the various phases of development.
B. Scope
The scope of this SRS document encompasses the following: -
1. It serves as a good reference to study, analyze and understand the need for the development of low-level descriptors for CBIR.
2. It acts as a verification tool for the final specification.
3. The functionalities derived from the requirement analysis and mentioned in this document are further refined in the design phase.
The scope of the application to be developed expands over research area of CBIR. It concentrates on exploration of the already accomplished research work on image content descriptors, focussing mainly on color and texture. Also, contribution to the enhancement of efficiency of such techniques is to be made for improved content based image retrieval. The application of the work to be done covers the following fields:
1. Military: locating and recognizing remotely sensed objects, interpreting satellite data.
2. Crime prevention and Security Check: Automatic face recognition systems, finger print or retina scanning for access privileges.
3. Medical Diagnosis: Using CBIR in a medical database of medical images aid diagnosis by identifying similar past cases.
4. Intellectual Property: Trademark image registration, where a new candidate mark is compared with existing marks to ensure no risk of confusing property ownership.
C. Definitions, Acronyms and Abbreviations
See Appendix
D. References
See Appendix
E. Overview
An in-depth research on CBIR has to be done keeping in mind the objective of proficiently retrieving digital images or parts of digital images from a huge image database. Also a study on application of visual content-based descriptors has to be carried out to find certain desired regions within an image. Owing to the well known fact that such tasks consume a considerable amount of time and memory, there arises an obvious requirement of working towards minimizing such constraints. A specification of all the requirements from the user‟s as well as developer‟s perspective has been made in the following sections of the document.

Sahil Narang 2011
15
II. PROBLEM/ OVERALL DESCRIPTION
A. Product Perspective
In the early 1990s, as a result of advances in the Internet and new digital image sensor technologies, the volume of digital images produced by scientific, educational, medical, industrial, and other applications increased dramatically. The difficulties faced by text-based retrieval became more and more severe. The efficient management of the rapidly expanding visual information became an urgent problem. This need formed the driving force behind the emergence of content-based image retrieval techniques. The content of a color image can be analyzed by extracting its low level features such as color, texture, shape.
The conversion of color images to gray level is a good start for determining texture of an image. There are many ways for extracting textural properties of an image. One of them is to first transform an image from spatial domain to frequency domain and then apply appropriate statistical tools on it. The theory of Multi-resolution Analysis which includes Discrete Wavelet Transforms can be useful in this task.
An insight into color content of an image can be gained by working in a certain color space. Thereafter color information can be obtained by using the standard color moments or experimenting with some novel approaches or aptly combining both.
Images are displayed to the user on the basis of similarity of features.
In military applications, there often arises a requirement of searching out satellite imagery for objects or regions with certain characteristics. Similar requirements may also arise in other application domains. The above stated strategy can be modified to perform a pixel by pixel search on an image thus fulfilling the mentioned requirement.
Since search on a pixel by pixel basis takes computation time of the order of hours, a time reduction scheme such as multitasking comes into picture. Further reduction in time can be obtained by implementing this scheme for a large digital image collection in a distributed environment.
In certain cases, a single content descriptor may not suffice for correct retrieval rather a fusion of two or more descriptors can prove to be a good choice.
The computation of the features for images comprising the database can be done either offline or online. Offline computation requires feature computation to be done and stored prior to query submission by the user. Online computation is time consuming and is done for every new query submitted.
A.1) Software Interfaces
A database management system
Image processing package in Java with the specifications as given below:
Name: Java Advanced Imaging (JAI)
Version: 1_1_2 or higher
Java Runtime Environment (JRE)
A.2) User Interface
GUI

Sahil Narang 2011
16
B. Product Functions
According to user‟s perspective, the product should provide two facilities:
1. Searching and Retrieval of whole images
2. Browsing and Retrieval of parts of images(especially from satellite imagery)
The facilities are detailed in the block diagram presented in Fig.2.in the next page.
A thorough research and analysis of existing image content descriptors coupled with the exploration and experimentation of some novel and efficient low level descriptors is a prerequisite to the development of product functions.
C. User Characteristics
The users are categorized into the following three constituencies: -
Researchers – people interested in research on CBIR.
Defence Personnel – people interested in developing projects for defence use.
Geologists and people working on satellite data.
D. Constraints
Performance and extensibility must be taken care of while developing the system.
E. Assumptions and Dependencies
For testing and development purposes, the following should be considered:
Image size: Image width must be equal to its height; images of even (or in powers of 2) dimensions are to be taken.
Color space: RGB color space should be considered for images.
Color Depth: 24-bit True color images must be taken into account.
Image Format: Images stored in BMP and TIFF formats should be taken up for analysis and testing.
III. SPECIFIC REQUIREMENTS
A. External Interfaces
TABLE I MAJOR INPUT, OUTPUT OF THE SYSTEM
Item Name Category Format Source
Image File Name Input Text Keyboard/
Mouse (GUI)
Input Image Input Digital Image
(BMP,TIFF) Hard Disk
Feature Extraction Method
(for Searching function)
Input Text Keyboard/
Mouse (GUI)
Image features computed
offline (for Searching
function)
Input Numeric Database stored
on hard disk
Retrieved Images Output Digital Image (Internal
Representation) Monitor (GUI)
B. Functions
The product shall perform two key functions:

Sahil Narang 2011
17
B.1) Searching and Retrieval of whole images
The product function of searching and retrieval of whole images shall be viewed as a sequence of following sub tasks:
Inserting images and their offline computed features in a database
Accepting a query image from the user
Preprocessing of query image
Computation of features of query image using a method depending on the color or texture feature being extracted
Ranking of database images according to similarity/ distance measure between the query image features and features of each image present in the database
Presenting few images of higher ranks(most similar ones) to the user

Sahil Narang 2011
18

Sahil Narang 2011
19
B.2) Browsing and Retrieval of parts of images
The product function of browsing and retrieval of parts of images shall be accomplished by following the steps listed below:
Accepting a small block of query image containing an identifiable object/ region from the user
Preprocessing and computation of low-level features of the query image
Browsing the smaller image over a large image or a collection of images by traversing in a pixel by pixel manner
Highlighting and displaying the most similar objects/ regions found according to the small block of image to the user.
B.3) Validity Checks on Inputs
TABLE II VALIDATIONS
Input Item Validation Required
Input Image
Image file must exist on the hard disk
Image format should be BMP or TIFF
Image height and width must be equal and even
C. Logical Database Requirements
A database of image features computed offline shall be maintained to be used for image search function. Its characteristics are:
TABLE IV CHARACTERISTICS OF DATABASE
Parameters Value
Type of information
stored
Text - The absolute path of images residing on the hard
disk
Numeric - Image features computed offline
Data Entity Digital image‟s Visual Content
Integrity Constraints Duplicate entries for an image shall not be allowed
The paths of an image should be in a consistent format
Frequency of use Each record of the database shall be accessed frequently
C.1) Entity Relationship Diagram
D. Other
D.1) Research
Image Content Descriptors Low level visual Feature 1
Image Path
Low level visual Feature
N
Low level visual Feature
2
Fig.3. ERD

Sahil Narang 2011
20
The exploration and experimentation on a wide range of concepts which fall under the broad spectrum of CBIR shall be undertaken to make this project result-oriented. Some of the areas are:
Development of efficient texture descriptor
Development of efficient color descriptor
Fusion of texture and color descriptors
Determining base of Fuzzy Triangular Function for Similarity Metrics
Basic knowledge of remote sensing through satellites
D.2) Test data
The selection and arrangement of test data must be done keeping the following points in mind.
A database containing images of varying texture and color properties must be taken up for experimentation. For e.g.: Brodatz Texture Album can be a good choice for analyzing texture descriptors. VisTex Album can be used for analyzing texture and color fusion functionality.
For browsing function, images captured by IKONOS and IRS shall be used along with non-satellite images

Sahil Narang 2011
21
Research & Exploration
SERIAL. NOS.
TOPICS PAGE
NOS.
I Introduction 23
A Purpose 23
B Scope 23
C Audience 23
D Definitions, Acronyms & Abbreviations 23
E References & Formulae 23
II Texture 23
A Understanding Texture Analysis 23
B Illustrations 23
C Texture Analysis Methodologies for Color Images 24
C.1 Conversion to Gray Scale 24
C.2 Conversion from spatial to frequency domain using Waveltes & MRA
24
C.3 Formation of Texture Feature Vector 26
III Color 28
A Understanding Color Analysis 28
B Illustrations 28
C Color Analysis Methodologies 28
C.1 Conversion to RGB Space 29
C.2 Formation of Color Feature Vector 29
IV Multi-feature Fusion 30
A Understanding Feature Fusion 30
B Methodology 31
V Similarity Measure 31
A Illustration 31
B Methodologies 31
B.1 Similarity Measurement with Fuzzy Logic 31
B.2 Similarity Measurement with Minkowski-Form distance 33
VI Performance Evaluation 33
A Methodology 33
A.1 Precision & Recall 33
A.2 Interpretation of Precision & Recall 33
VII Satellites & Remote Sensing 33
A Remote Sensing 33
B Satellites 33
B.1 Indian Remote Sensing (IRS) Satellite 34

Sahil Narang 2011
22
SERIAL. NOS.
TOPICS PAGE
NOS.
B.2 IKONOS Satellite 34
C CBIR & Satellite Imagery 35
D Illustrations 35

Sahil Narang 2011
23
I. INTRODUCTION
A. Purpose
The purpose of this document is to summarize the research work done at each phase of the development of the software.
B. Scope
The scope of this SRS document encompasses the following: -
1. It serves as a reference to study, analyse and understand methodologies to be designed, programmed and documented.
2. It acts as a tool for the development of test cases which would exercise small conditions of the program.
C. Audience
Designers, Programmers, Testers, Researchers and any fellow interested in studying image processing especially CBIR.
D. Definitions, Acronyms and Abbreviations
See Appendix
E. References & Formulae
See Appendix
II. TEXTURE
A. Understanding Texture Analysis
In biological vision, texture is an important cue allowing humans to discriminate objects. This is because the brain is able to decipher important variations in data at scales smaller than those of the viewed objects. In order to deal with texture analysis in digital data, many techniques have been developed by image processing researchers.
Texture analysis refers to the characterization of regions in an image by their texture content. Texture analysis attempts to quantify intuitive qualities described by terms such as rough, smooth, silky, or bumpy as a function of the spatial variation in pixel intensities. In this sense, the roughness or bumpiness refers to variations in the intensity values, or gray levels.
Statistical tools, when applied on these gray levels, can characterize the texture of an image because they provide information about the local variability of the intensity values of pixels in an image. For example, in areas with smooth texture, the range of values in the neighborhood around a pixel will be a small value; in areas of rough texture, the range will be larger. Similarly, calculating the standard deviation of pixels in a neighborhood can indicate the degree of variability of pixel values in that region.
Texture analysis is used in a variety of applications, including remote sensing, automated inspection, robotics, defence, the geo-sciences and medical image processing. Texture analysis can be helpful when objects in an image are more characterized by their texture than by intensity, and traditional threshold techniques cannot be used effectively.
B. Illustrations
Some images which can be characterized by their texture are shown in Fig.4:
Fig.4 Sample images taken from Brodatz Album

Sahil Narang 2011
24
C. Texture Analysis Methodologies for Color Images
The procedure followed for texture analysis in this project is outlined below:
C.1) Conversion of Color Image to Gray Scale Equivalent
Since the texture depends on the variations in the intensity values, conversion of a color image into its gray level equivalent is commendable. There are many methods for this purpose which can be used depending on the color space. For RGB color space, two such conversion methods were preferred for good results:
Each pixel is assigned the highest intensity value out of its red, green and blue color values. Mathematically, this can be written as:
Iij = max {Cij (R, G, B)}
Each pixel of image is assigned an intensity value according to the formula given below:
Iij = (11* Cij (R) + 16* Cij (G) + 5* Cij (B)) / 32
Here, Iij is the intensity assigned to pixel (i,j) of Image C, Cij (R, G, B) denotes the red, green and blue color values of (i, j) pixel of image C
An illustration of conversion using both the methods is depicted in the figure above. The first column displays the original color image, and the second, third columns demonstrate the converted images for the first, second methods respectively.
C.2) Conversion of Gray Scale Image from Spatial Domain to Frequency Domain using Wavelets & Multi-resolution processing
In numerical analysis and functional analysis, a discrete wavelet transform(DWT) is
any wavelet transform for which the wavelets are discretely sampled. As with other
wavelet transforms, a key advantage it has over Fourier transforms is temporal
resolution: it captures both frequency and location information (location in time). The
first DWT was invented by the Hungarian mathematician Alfréd Haar. For an input
represented by a list of 2n numbers, the Haar wavelet transform may be considered to
simply pair up input values, storing the difference and passing the sum. This process
is repeated recursively, pairing up the sums to provide the next scale: finally resulting
in 2n − 1 differences and one final sum. A standard decomposition of a two
dimensional signal (image) is easily done by first performing a one dimensional
transformation on each row followed by a one dimensional transformation of each
column. The 2D Haar transform is used extensively in image compression.
The Haar wavelet function
Let RR : be defined by:
Fig.5 Gray scale conversion of color images

Sahil Narang 2011
25
010
12
11
2101
)(
t
t
t
t
Probably the simplest useful energy compression process is the HAAR
TRANSFORM. In one dimension, this transforms a 2-element vector
Txx ))2()1((( is transformed into
Tyy ))2()1((( Using
)2(
)1(
)2(
)1(
x
xT
y
y
Where T=
1
1
1
1
21
Thus y(1) and y(2) are simply the sum and differences of x(1) and x(2), scaled by
21 to preserve energy.
Note that it is an orthonormal matrix because its rows are orthogonal to each
other(their dot products are zero) and they are normalized to unit magnitude
.Therefore
TTT 1
(In this case T is symmetric i.e TT T )
In two dimensions x and y becomes 2*2 matrices. We may transform the first column
of x ,by pre-multiplying by T,and then the rows of the result by post multiplying by TT .
Hence: TTxTy
If
dc
bax
Then
dcbadcba
dcbadcbay
These operations correspond to the following filtering process.:
Top left=a+b+c+d= 4-point average or 2d low pass filter. This is also known
as approximation image.
Top right=a-b+c-d=Average horizontal gradient or horizontal high pass filter
and vertical low pass filter. This is also known as horizontal difference of the
image.
Lower left=a+b-c-d=Average vertical gradient or horizontal low pass filter and
vertical high pass filter. This is image is also known as vertical difference of
the image

Sahil Narang 2011
26
Lower right= a-b-c+d=Diagonal curvature or 2d high pass filter. This image is
also known as diagonal difference image.
C.3) Formation of texture feature vector
Correlation Technique
In statistics, dependence refers to any statistical relationship between two random variables or two sets of data. Correlation refers to any of a broad class of statistical relationships involving dependence.
The most familiar measure of dependence between two quantities is the Pearson product-moment correlation coefficient, or "Pearson's correlation." It is obtained by dividing the covariance of the two variables by the product of their standard deviations
yx
yYxXE
yx
YXYXcorrYX
)])([(),cov(),(,
where E is the expected value operator, cov means covariance, and, corr a widely used alternative notation for Pearson's correlation.
The Pearson correlation is +1 in the case of a perfect positive (increasing) linear relationship (correlation), −1 in the case of a perfect decreasing (negative) linear relationship (anticorrelation), and some value between −1 and 1 in all other cases, indicating the degree of linear dependence between the variables. As it approaches zero there is less of a relationship (closer to uncorrelated). The closer the coefficient is to either −1 or 1, the stronger the correlation between the variables.
Suppose X and Y are NXM matrices containing the pixel intensity values of images A and B respectively. Then the correlation of A and B can be given as
Rxy= ∑ ∑ ( )
( )
√∑ ∑ ( ) ∑ ∑ (
)
Where x and y represent the mean of X and Y respectively,
The decomposed gray level image obtained after applying the Haar transform is subjected to feature extraction procedure by using statistical tools as discussed below. The output of this procedure is a vector containing quantitative values that describe the texture content of the image.
1. An image after L-level DWT contains 3*L+1 sub bands. The standard deviation of 4*L bands (4 of each level) along with the mean of the approximation image obtained at each level are calculated.
Fig.6 1-level and 2-level haar operation on a gray scale image

Sahil Narang 2011
27
2. Since these high frequency sub bands lose information at higher levels of decomposition, the standard deviation (SD) of each high frequency sub band image at i
th level is weighted by the factor ½
(i-1), thus assigning higher weights
to lower level bands.
3. The correlation of the LL band with HL , LH bands and the correlation of LH with HL band was computed for each level. So there were 3*L correlation features.
4. The energy of the approximation image of each level was computed thereby providing L energy features (1 for each level).
5. The 9*L sized feature vector is defined as follows:-
The Texture Feature(TF) for two level haar image is:
TF = { 1LL
,1LH
, 1HL
, 1HH
, µ1LL
,E1LL
,2LL
,½ 2LH
, ½ 2HL
, ½ 2HH
, µ2LL
, E2LL
,corr(LL1-HL1),corr(LL1-LH1),corr(HL1-LH1),corr(LL2-HL2),
corr(LL2-LH2),corr(HL2-LH2) }
corr(LL1-HL1)
corr(LL1-LH1)
corr(HL1-LH1)
Fig.7 Correlation method 2-level haar
.
corr(LL2-HL2)
corr(LL2-HL2)
corr(LH2-HL2)
1LL
µ1LL
E1LL
1LH
1HL
1HH
2LL
µ2LL
E2LL
2LH
2HL
2HH
Fig.8 CORRELATION method on 2-level haar

Sahil Narang 2011
28
where
TF stands for Texture Features
iMM is the SD of the MM ( stands for LL, LH, HL, or HH sub bands ) at decomposition level i
µiLL is the mean of the approximation image ( i=1,2 corresponding to level1 or level2 )
EiLL
is the energy of the approximation image ( i=1,2 corresponding to level1 and level2 respectively )
Corr(mmi-nni) stands for the correlation of subband mmi and nni (mm,nn Ɛ {LL,HL,LH} and i Ɛ {1,2} corresponding to level 1 and level2 respectively)
III. COLOR
A. Understanding Color Analysis
The color analysis of an image starts with determining an appropriate color space. RGB is a widely used color space. It is composed of three color components red, green and blue called additive primaries since a color in RGB space is produced by adding them together. Images represented in RGB color model consist of three component images, one for each primary color. The number of bits used to represent each pixel in RGB space is called pixel depth. In an RB image, in which each of RGB color pixel [ that is, a triplet of values (R, G, B)] is said to have a depth of 24 bits (3 image planes times the number of bits per plane).
B. Illustration
Some color images are shown below:
C. Color Analysis Methodologies for Color Images
The procedure followed for color analysis in this project is outlined below:
Blue
Magenta
Red Yellow
Green
Cyan
White
Black
Gray Scale
Fig.9 RGB Color Space
Fig.10 Sample of color images

Sahil Narang 2011
29
C.1) Conversion to RGB Space
The images are converted to RGB color space.
C.2) Formation of Color Feature Vector
Formation of Feature Vector By F-Norm Theory
A vector norm is defined as a linear function RRf n : that satisfy the following
property.
1. Rxxf ,||||||)(
2. )()()( yfxfyxf
3. 0)( xf
4. 00)( xifonlyandifxf (the zero vector length of n)
We may also consider matrix norm. Here we discuss one type of matrix norm that is
F-norm or Forbenious Norm.
F norm on is a mapping with the properties:
(i)
,
(ii)
,
(iii)
,
(iv)
.
F-NORM [3] theory can be used to decrease the dimension of image feature. The
calculation of feature vector from F-NORM theory is done as follows:-
iii
i
i
NNN
N
aa
aa
A
aa
aa
A
1
111
1
111
Suppose A is a NXN square matrix of any single color
component of an image and Ai is its ith order sub matrix where
Ni 1
The F-norm of Ai is given as:
),min(
1
2
1 1
2 )*(||||||nm
i
i
m
i
n
j
ijF AAtraA

Sahil Narang 2011
30
where A* denotes the conjugate transpose of A, σi are the singular values of A, and the
trace function is used.
An image can be represented as matrices of Red, Green, and Blue(R, G, and B) components. The F-Norm theory can thus be effectively used on these matrices to reduce the dimension of image features.
1. Suppose A is a NXN square matrix of any single color component of an image and Ai is its i
th order sub matrix where 1 ≤ i ≤N, then F-norm of Ai is given as:
2. The values of R, G and B color bands are normalized by dividing them by the highest color intensity value possible. The objective is to bring all the pixel values within the range [0,1] so as to reduce computation efforts for large values.
3. When F-Norm is separately applied on the normalized values of R, G, and B color bands, three N-dimensional feature vectors are obtained.
FNFAX = {║A1║F, ║A2║F ,…......., ║Ai║F, ….......,. ║An║F }
where, X € {R, G, B}, FNFAX stands for F-Norm Features.
4. The feature vector values are then assigned weights.
WFAX = {w1║A1║F, w2║A2║F ,…, wi║Ai║F, …,. wn║An║F }
where, wi are weights, WFAX stands for Weighted Features.
5. The averages of the weighted features of the three bands yield the final three-dimensional color feature vector.
CF = {WAR/N, WAG/N, WAB/N}
where, CF stands for Color Features, WAR, WAG and WAB are the weighted 3-dimensional feature vectors for Red, Blue and Green colors respectively.
IV. MULTI-FEATURE FUSION
A. Understanding feature fusion
Identification of features/objects in an image captured by any device is a specialized task since the captured image properties depend on objects present and its surroundings. Therefore, an object needs to be identified by segregating its low level descriptors from those of its background. While performing such computer assisted task, ambiguities may arise between the descriptive content of the required object/region and its surrounding area. For instance, sky appears blue, which can generate a conflict with water bodies. This ambiguity can be resolved by considering their texture features. Similarly, dry grass shows yellow area which differs from a petal of sun flower in having a relatively lighter tone and coarse texture. In such cases, using color or texture features separately is not good enough rather a fusion of both the features may prove to be beneficial. The same technique is applied in Image Retrieval.
∑∑
k=1 l=1
i i
||Ai||F = |akl|2
½

Sahil Narang 2011
31
B. Methodology
The construction of low-level feature vector can be done by applying F-Norm (or other color feature descriptor) for color feature extraction and efficient Haar Discrete Wavelet Transform (or other texture feature descriptor) for texture feature extraction in sequence.
V. SIMILARITY MEASURE
A. Illustration
Let‟s say a transparent square is placed over four different squares to check the differences between them.
On placing (a) over all the squares, the following conclusions can be drawn:
The difference between (a) and (b) is 7 vertical lines and gray color. (Similarity: very low)
The transparent square can be made similar to (c) by coloring it with gray or removing gray color from the colored square. (Similarity: low)
(d) and (a) are almost similar except border. (Similarity: high)
(e) and (a) are also similar except in their size. (Similarity: high)
Thus, it can be deduced that by comparing the features of the squares and adopting an additive or subtractive matching scheme, the similarity of the given squares with the query transparent square can be ordered as : [(d), (e)]; [(c)]; [(b)]. In the same way, similarity between the images can be found out by adopting a suitable methodology on their feature vectors.
B. Methodologies
B.1) Similarity Measurement with Fuzzy Logic
Introduction
In classical set theory, “crisp sets” whose membership can only be true or false in the traditional sense of bi-valued Boolean logic are dealt with. For e.g. Let Z denote
(a) Transparent square
(b) Textured square (c) Colored square (d) Bordered square (e) Small size square
Sahil Narang 2011
32
the set of all days and A is a subset of Z called set of hot days. To form this subset we need a membership function that assigns a value of 0 or 1 to every element. This function simply defines a threshold at or above which a day is considered hot, and below which it is considered cold. This poses an immediate difficulty since a temperature of 30 degree is considered to be a hot day but a temperature of 29 degree is considered cold. This limits the use of classical set theory in many practical applications where we need to define the degree of membership of a set. In this example we need a gradual transition from hot to warm to cold and thus, an infinite valued function. This makes it possible to define degrees of hotness and we can now make statements like a day being hot, warm, warmer, cold, and very cold and so on. These types of vague (fuzzy) statements are more in line with what humans use when talking imprecisely about the temperature of a day. Thus, infinite valued membership functions can be viewed as the foundation of fuzzy logic and the sets generated using them as fuzzy sets.
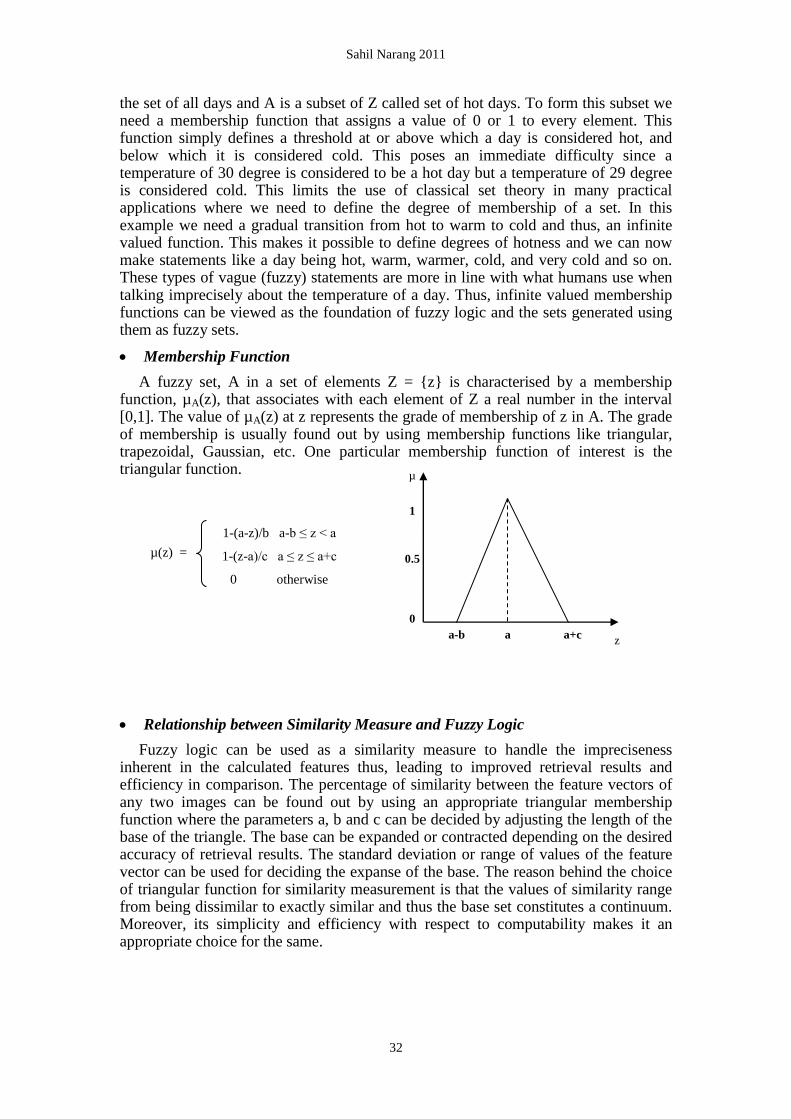
Membership Function
A fuzzy set, A in a set of elements Z = {z} is characterised by a membership function, µA(z), that associates with each element of Z a real number in the interval [0,1]. The value of µA(z) at z represents the grade of membership of z in A. The grade of membership is usually found out by using membership functions like triangular, trapezoidal, Gaussian, etc. One particular membership function of interest is the triangular function.
Relationship between Similarity Measure and Fuzzy Logic
Fuzzy logic can be used as a similarity measure to handle the impreciseness inherent in the calculated features thus, leading to improved retrieval results and efficiency in comparison. The percentage of similarity between the feature vectors of any two images can be found out by using an appropriate triangular membership function where the parameters a, b and c can be decided by adjusting the length of the base of the triangle. The base can be expanded or contracted depending on the desired accuracy of retrieval results. The standard deviation or range of values of the feature vector can be used for deciding the expanse of the base. The reason behind the choice of triangular function for similarity measurement is that the values of similarity range from being dissimilar to exactly similar and thus the base set constitutes a continuum. Moreover, its simplicity and efficiency with respect to computability makes it an appropriate choice for the same.
µ(z) =
1-(a-z)/b a-b ≤ z < a
1-(z-a)/c a ≤ z ≤ a+c
0 otherwise
a-b a a+c
1
0.5
0
µ
z

Sahil Narang 2011
33
B.2) Similarity Measurement with Minkowski-Form Distance
If each dimension of image feature vector is independent of each other and is of equal importance, the Minkowski-Form Distance, Lp is appropriate for calculating the distance between two images. This distance is defined as:
When p=1, 2, and ∞, D(I,J) is the L1, L2 (also called Euclidean Distance), and L∞ distance respectively. Minkowski-form distance is the most widely used metric for image retrieval. For instance, MARS system used Euclidean distance to compute the similarity between texture features.
VI. PERFORMANCE EVALUATION
A. Methodology
To evaluate the performance of a retrieval system, two measurements, namely, recall and precision, are borrowed from traditional information retrieval.
A.1) Precision and Recall
For a query q, the data set of images in the database that are relevant to the query q is denoted as R(q), and the retrieval result of the query q is denoted as Q(q).
The precision of the retrieval is defined as the fraction of the retrieved images that are indeed relevant for the query:
Precision= |Q(q)∩R(q)| † |Q(q)|
The recall is the fraction of the relevant images that are returned by the query:
Recall= |Q(q)∩R(q)| † |R(q)|
A.2) Interpretation of Precision and Recall
Usually a tradeoff must be made between recall and precision since improving one will sacrifice the other. In typical retrieval systems, recall tends to increase as the number of retrieved items increases; while at the same time the precision is likely to decrease. In addition, selecting a relevant dataset R(q) is much less stable due to various interpretations of the images. Further, when the number of relevant images is greater than the number of retrieved images, recall is meaningless. As a result, precision and recall are only rough descriptions of the performance of the retrieval system.
VII. SATELLITE/ REMOTE SENSING
A. Remote Sensing
Remote Sensing is defined as the science and art of acquiring multi date, reliable and timely information about a material object by accessing it remotely (without physical contact). This information can be constructively exploited in the fields covering agriculture, forestry, geo-science and various other disciplines.
B. Satellites
Satellites illuminate us with vital information and visual imagery that cannot be captured in any other manner. One can ponder over the enormous amount of spectral
1/p
∑
i
|fi(I)-fi(J)|p D(I,J) =

Sahil Narang 2011
34
and spatial information provided by a satellite which can be used selectively to identify and characterize the surface features, e.g., hills, rivers, trees, fields, forests, soils and land-use patterns.
A remote sensing satellite is designed according to its application for studying the earth‟s resources or for meteorology. An earth resource satellite carries sensors with a medium to high spatial resolution which look down to the earth and collect information. The multispectral scanner (MSS) is extensively used in such satellites (including IRS, IKONOS) for measuring more than one spectral band or wavelength region. The configuration of two satellites whose images are to be tested is summarized here:
B.1) Indian Remote Sensing Satellites
A linear image self scanning sensor (LISS – III), as used in Indian Remote Sensing(IRS) satellites, IRS-IC and IRS-ID is one such MSS operating in four spectral bands shown in the table below:
TABLE V IRS (LISS – III) SENSOR CONFIGURATION
Band Spectral Bands ( in µm) Resolution (in m)
1 0.52 – 0.59 (Green) 23.5
2 0.62 – 0.68 (Red) 23.5
3 0.77 – 0.86 (Near Infra–red) 23.5
4 1.55 – 1.70 (Mid Infra–red) 70.5
B.2) IKONOS
The IKONOS sensor system acquires data in four multi-spectral bands. The sensor details are tabulated below:
TABLE VI IKONOS SENSOR CONFIGURATION
Sensor Spectral Bands ( in
µm)
Resolution at Nadir
(in m)
Resolution 26º off Nadir
(in m)
PAN 0.45 – 0.90 0.82 1
MSS
0.45 – 0.52 (Blue)
3.2 4
0.52 – 0.60 (Green)
0.63 – 0.69 (Red)
0.76 – 0.90 (Near
Infra–red)
A clear understanding of spectral reflectance or emittance characteristics which define shape, color, and texture is a prerequisite for interpreting distinctive features in an MSS image.

Sahil Narang 2011
35
C. CBIR and Satellite Imagery
The application domain of CBIR generally excludes satellite images, but its usability can be explored on satellite imagery. One can ponder over the contribution of remotely sensed data towards diverse scientific and commercial purposes. Hence, it is reasonable to selectively identify objects such as buildings, aeroplanes, runways etc. and characterize the surface features, e.g., hills, rivers, trees, fields, forests, soils and land-use patterns. The interpretation and analysis of such objects and features is a major step in transforming the remotely sensed data into information that is intelligible and usable.
D. Illustrations
Images taken from IRS and IKONOS satellites are shown below. (a) is a picture of vegetation area whereas (b) depicts a part of an bonny terminal at Nigeria at 0.8m resolution.
Fig.11 (a) IRS image (b) IKONOS image

Sahil Narang 2011
36
Software Design Specification
SERIAL. NOS. TOPICS PAGE NOS.
I Introduction 37
A Purpose 37
B Scope 37
C Audience 37
D Definitions, Acronyms & Abbreviations 37
E Chapters & References 37
F References 37
II System Overview 37
III Design Considerations 37
A Assumptions & Dependencies 37
B General Constraints 38
C Development Models 38
IV System Architecture 38
A Subsystem Architecture 39
V Detailed System and Subsystem Design 41
A Searching Module 41
A.1 GetFile () 41
A.2 ComputeOnlineFeatures() 42
A.3 SimilarityMeasure(), Sorting(), Ranking() 45
A.4 Manage Offline Features Module 46
B Browsing Module 47
B.1 Query Block 47
B.2 Compute Block Features 48
B.3 Compute Window Features 51
B.4 Compute Similar Blocks 51
B.5 Compare Windows 55
VI Logical Database Design 56

Sahil Narang 2011
37
I. INTRODUCTION
A. Purpose
This document specifies the final system design for the system. It also gives some explanations on how the design evolved and why some design decisions were taken. It is a summary of the design decisions taken for each requirement as they came in during the development of the system.
B. Scope
It is the main document which gives the implementation guidelines of the project along with acting as a verification and validation tool for the testing phase.
C. Audience
Analysts, designers, programmers, testers
D. References of other pertinent documents
SRS, Research and Exploration, Research papers, Test& development plan.
E. Definitions, Acronyms and Abbreviations
See Appendix
F. References
See Appendix
II. SYSTEM OVERVIEW
This system is to consist of a graphical interface design to aid the development of efficient image content descriptors. A user interested in research area of CBIR can experiment with various texture and color descriptors for searching and browsing an image. It will also assist user to assess the accuracy of the image retrieval results and thus judge the efficiency of the descriptors used.
The goal of this project is to build a Content Based Image Retrieval system by developing efficient color and texture descriptors.
It follows the QbE approach for image retrieval where inputs and outputs are images and the processing is related to searching or browsing images from a large image database according to the similarity of the contents like color, texture and shape of images with the query image given by the user.
The main modules of the system are specified in the SRS. Rigorous research and exploration was done to devise efficient methodologies for the steps to be followed in the system. These have been compiled in chapter 2 (Research and Exploration).
III. DESIGN CONSIDERATIONS
A. Assumptions & Dependencies
Java Advanced Imaging (JAI) package should be available for working with images in java.
The software is mainly targeted for research purposes.
It is assumed that the Research & Exploration documents have been studied thoroughly.
Image sizes should be small, even (preferably, power of 2), and of equal height and width.

Sahil Narang 2011
38
B. General constraints
Memory requirements should be looked after. Images consume a lot of memory.
Evaluation and changes (if required) of the results of the modules to be designed and implemented should be done on a regular basis.
C. Development Methods
The system is to be designed by using the following well known approaches:
1. Structured Modeling: Flowcharts and DFDs are used to represent the structure of the system. Since our system follows a modular structure, the mentioned methods are apt for the situation.
2. Behavioral Modeling: The behavior of a system (as referenced from the Block Diagram in SRS) can be examined by going through its states. Therefore, such a system can be modeled well with state diagrams.
3. Object Based Modeling: Certain data items share common usages and form a meaningful identity when clubbed together. It is always easy for class diagrams to depict such entities.
IV. SYSTEM ARCHITECTURE
CBIR
(1)
User
Similar Images Query Image/ Part of image
to be searched
Fig.12 Context Diagram of CBIR System
Browsin
g (1.2)
User
Highlighted similar
blocks in an image
Part of image (Block) to be
searched
Fig.13 1-level DFD of CBIR System
Searchin
g (1.1)
Few Similar Images Query Image
Digital
Image
Library Image
Offline feature
database
Features

Sahil Narang 2011
39
As shown in the diagram above the system will provide two main functionalities:
1. Searching of images in a digital image library (Module 1.1)
The input to this function is a query image given by the user. The features of each image in the image library are computed and stored. After computing the feature of the query image, similar images are ranked and displayed according to the similarity of the features.
2. Browsing of parts of images in a digital image library (Module 1.2)
The input to this function is an identifiable object or a region block given by the user. The images in the library are browsed for searching similar object or region present in them. Features obtained by moving windows in a pixel by pixel manner over the large image are computed and compared with the features of the block to get the similar regions.
TABLE V11 MAJOR INPUT, OUTPUT OF THE MODULES
Functionality Input Output
Searching (Module
1.1)
Query Image of size NxN K most similar images of
sizes NxN
Browsing (Module
1.2)
Query Image of size SxS A single of size NxN with
L most similar regions
highlighted.
A. Subsystem Architectures
Both the functionalities are further expanded into modules/functions and described in the 2
nd level DFDs drawn below.

Sahil Narang 2011
40
Get
File
(2.1.1
)
User Block Image Path
Fig.15 2-level DFD of Browsing Function on a single image
Comput
e Block
Features
(2.1.2)
Similarit
y
Measure
(2.1.5)
Sorting
and
Ranking
(2.1.6)
Digital
Image
Library
Image File
Block Image
Query
Block
Features
Window
Positions &
Match Value
K most similar
highlighted
regions in an
image
Window
Browsing
(2.1.3)
Comput
e
Window
Features
(2.1.4)
Image Image Path
Window Window Features

Sahil Narang 2011
41
V. DETAILED SYSTEM & SUBSYSTEM DESIGN
A. Searching Module
A.1) Get File (Function 1.1.1)
Type: Function
Responsibilities: It loads an image stored in hard disk in a particular file format into RAM by converting into an internal representation used in Java.
Parameters:
Data Item Parameter Type Data Type
Image Path Input (as function
argument) String
Internal Representation
of image
Output (as return
data)
RenderedImage or 3D array
representation of image
Constraints:
The image must have equal height and width (NXN).
The image size (NXN) should be an even number, preferably in powers of 2.
Large sized images (greater than 1024X1024 pixels) may not be processed because of shortage of memory.
Processing:
Star
t
Stop
File Exists
Yes
No
File Name
Yes
File format =
“BMP” or “TIFF”
Load Image
No

Sahil Narang 2011
42
Error Handling:
Condition Entry
Invalid query image path Yes No No No
File path variable does not contain extensions
“.bmp” or “.tiff”
X Yes No No
Internal representation of image in JAI does not
have 3 bands
X X Yes X
Large sized image X X No Yes
Action Entry
Image does not exist error
File format error
Number of bands error and hence cannot proceed
System stops due to shortage of memory
A.2) Compute Online Features (Module 1.1.3)
Type: Module
Responsibilities: It finds out the texture or color features of a query image.
Parameters:
Data Item Parameter Type Data Type
Image Input (as function
arguments)
RenderedImage or Image in the
form of 3D array
Feature Extraction
Technique
Input (as function
arguments) String
Feature Vector Output (as return
data) Float array

Sahil Narang 2011
43
Processing:
For Texture, define:
GRAY [][] of size NXN
For Correlation, define:
HAAR [][] of size NXN
CorrelationFeatures [] of size 18
For Color, define:
COLOR [][][] of size 3XNXN
For FNorm, define:
FNORMRED [], FNORMGREEN [], FNORMBLUE [] of
size N
FNORMFeatures [] of size 3 (3 color components)
Compute Gray Scale
GRAY[i][j] = Maximum ( R, G, B) at IMAGE‟s ijth pixel

Sahil Narang 2011
44
A
Perform 2-level HAAR transform and store it in
HAAR CalculateHAAR (2, N, IMAGE)
WSDFeatures[1] = Standard Deviation of HAAR from index positions (N/2, 0) to (N, N/2) i.e. 1-level LH band
WSDFeatures[2] = Standard Deviation of HAAR from index positions (0, N/2) to (N/2, N) i.e. 1-level HL band
WSDFeatures[3] = Standard Deviation of HAAR from index positions (N/2, N/2) to (N, N) i.e. 1-level HH band
WSDFeatures[4] = Standard Deviation of HAAR from index positions (0, 0) to (N/2, N/2) i.e. 1-level LL band
WSDFeatures[5] = Mean of HAAR from index positions (0, 0) to (N/2, N/2) i.e. 1-level LL band
WSDFeatures[6]= Correlation of HAAR from index positions (0,0,N/2,N,2) to (N/2,0,N/2,N) i.e ll1-hl1
WSDFeatures[7] = Correlation of HAAR from index positions (0,0,N/2,N,2) to (0,N/2,N,N/2) i.e ll1-lh1
WSDFeatures[8] = Correlation of HAAR from index positions (N/2,0,N/2,N) to (0,N/2,N,N/2) i.e hl1-lh1
WSDFeatures[9] = Energy of HAAR from index position(0,0) to (N/2,N/2) i.e LEVEL1
WSDFeatures[10] = Standard Deviation of HAAR from index positions (N/4, 0) to (N/2, N/4) i.e. 2-level LH band
WSDFeatures[11] = Standard Deviation of HAAR from index positions (0, N/4) to (N/4, N/2) i.e. 2-level HL band
WSDFeatures[12] = Standard Deviation of HAAR from index positions (N/4, N/4) to (N/2, N/2) i.e. 2-level HH band
WSDFeatures[13] = Standard Deviation of HAAR from index positions (0, 0) to (N/4, N/4) i.e. 2-level LL band
WSDFeatures[14] = Mean of HAAR from index positions (0, 0) to (N/4, N/4) i.e. 2-level LL band
WSDFeatures[15] = Correlation of HAAR from index positions (0,0,N/4,N,4) to (N/4,0,N/4,N/2) i.e ll2-hl2
WSDFeatures[17] = Correlation of HAAR from index positions (0,0,N/4,N/4) to (0,N/4,N/2,N/4) i.e ll2-lh2
WSDFeatures[18] = Correlation of HAAR from index positions (N/4,0,N/4,N/2) to (0,N/4,N/2,N/4) i.e hl1-lh1
WSDFeatures[19] = Energy of HAAR from index position(0,0) to (N/4,N/4) i.e LEVEL1
Correlation
Features

Sahil Narang 2011
45
A.3) Similarity Measure, Sorting & Ranking (Function 1.1.5)
Type: Function
Responsibilities: Similarity between two images is measured by finding the difference between their feature vectors through fuzzy concept. Higher values indicate greater similarity. These similarity values for all test images when compared to the query image and sorted in descending order give the K most similar images. Thus, the role of this function is to arrive at the retrieval results that are to be displayed to the user.
Parameters:
Data Item Parameter Type Data Type
Query image
feature vector
Input (as function
argument) double [] array
Test image feature
vector
Input (as function
argument) double [] array
K most similar
images (including
the query image)
Output (as return
data to GUI)
An object (or an array of objects)
consisting of double [] array (or
Vector) for similarity matches,
string[] array (or Vector) for image
paths (a prototype is class Data)
E
FNORMFeatur
es
Compute weighted average of FNORM values
FNORMFeatures [1] = FNORMFeatures [1] + ( i * FNORMRED [i] ) ÷ N
FNORMFeatures [2] = FNORMFeatures [2] + ( i * FNORMGREEN [i] ) ÷ N
FNORMFeatures [3] = FNORMFeatures [3] + ( i * FNORMBLUE [i] ) ÷ N
For i = 1 to N
Compute FNORM for red, green and blue components
FNORMRED = || AR || i.e. COLOR [1] (Red color array)
FNORMGREEN = || AG || i.e. COLOR [2] (Green color array)
FNORMBLUE = || AB || i.e. COLOR [3] (Blue color array)

Sahil Narang 2011
46
Processing:
Interface:
MySQL ODBC connectivity is required to retrieve the offline computed features (by the caller of the function). The features are to be retrieved from the table of the method specified by the user for feature extraction.
Constraints:
This function is to be called for all test images whose features are computed offline and stored in the database
Query and test features should be compatible i.e. obtained from the same feature extraction technique.
Number of triangular membership functions is equal to the number of features. The expanse of the base of these functions (A []) are found out by certain statistical measure applied on a feature set of a large collection of images.
Optimizing the values of K , checks on array indices and database errors
A.4) Manage Offline Features (Module 1.1.2)
Type: Module
Responsibilities:
Star
t
Q [] ( Query Feature Vector )
T [] ( Test Feature Vector )
Fuzzy Triangular Range Check
Q[i] – A[i] ≤ T[i] ≤ Q[i] +
A[i]?
MATCH = degree of membership (µ(z)) of Q[i], T[i]) using Triangular function
For i = 1 to L
Insert MATCH in SIMIMG by performing Insertion Sort in descending order
SIMIM
G
Define
L = size of feature vector
A [] of size L (parameters of triangular functions)
SIMIMG [] of size K (K most similar images are to be displayed)
Yes
No
Stop

Sahil Narang 2011
47
Its responsibility consists of the following functions:
1. Insertion of features in the database
2. Deletion of features corresponding to an image from the database
3. Viewing the existing database
Parameters:
Data Item Parameter Type Data
Type
Image Path (Image to be inserted or
deleted)
Input (as function
argument) String
Feature Extraction Technique (Indicates
the table to/from which the image
features are to be inserted/deleted)
Input (as function
argument) String
Function to be performed
(Insertion/Deletion/View)
Input -
Database records (View) Output ResultSet
Confirmation whether transaction has
occurred (Insertion/Deletion/View)
Output (as return
parameter) Boolean
Composition:
The insertion function would use the following functions discussed in Module 1.1.3 to compute the features:
1. Get File
2. Compute Online Features to get the feature values to be inserted into the database
Interface:
MySQL ODBC connectivity. SQL queries are the fundamental requirement of this module.
Constraints:
Check on database errors
B. Browsing Module
B.1) Query Block (Module 2)
Type: Module
Responsibilities: It accepts a small block of image containing identifiable object/region from the user . It then receives and displays the image in which similar or exact blocks have been found.
Constraint:
Block image size (SXS) should be even and less than 64.

Sahil Narang 2011
48
Parameters:
Data Item Parameter Type Data Type
Block Image path Input String
Highlighted blocks in a single or
multiple images Output
RenderedImage[]
(in GUI)
B.2) Compute Block Features (Module 2.1.2)
Type: Function
Responsibilities: It finds the color and texture features of a query block image.
Parameters:
Data Item Parameter Type Data Type
Image Input (as function
arguments)
RenderedImage or Image in the
form of 3D array
Color Feature
Vector
Output (as return
data) Float array
Texture Feature
Vector
Output (as return
data) Float array

Sahil Narang 2011
49
Processing:
Star
t
Compute Normalized color values in RGB space
COLOR [1] = red color values of all pixel of IMAGE ÷ 255
COLOR [2] = green color values of all pixel of IMAGE ÷ 255
COLOR [3] = blue color values of all pixel of IMAGE ÷ 255
N = S = Block Image Size
IMAGE [][][] of size 3XSXS
For Texture, define:
GRAY [][] of size SXS
HAAR [][] of size SXS
TEXTUREFeatures [] of size 18 for Correlation
For Color, define:
COLOR [][][] of size 3XSXS
FNORMRED [], FNORMGREEN [], FNORMBLUE [] of size S
FNORMFeatures [] of size 3 (3 color components)
Compute Gray Scale
GRAY[i][j] = (11*R+16*G+5*B) † 32 for R, G, B values at IMAGE‟s ijth pixel
For i = 1 to S
For j= 1 to S
E
H
No
Yes
Stop
Image
Bands = 3?

Sahil Narang 2011
50

Sahil Narang 2011
51
B.3) Compute Window Features (Module 2)
Type: Module
Responsibilities: It searches the query image for regions/objects with features similar to those received from the Compute Block Features module .
Parameters:
Data Item Parameter
Type Data Type
Color & Texture feature
vectors of the query block
Input Serializable Object(of class
QueryBlockSender)
K images with most similar
highlighted regions
Output Serializable Object (of class
Image Sender)
Processing problems (if any
errors occur)
Output String
B.4) Compute Similar Blocks: Module 2.1.3, 2.1.4, 2.1.5 & 2.1.6)
Type: Functions
Responsibilities: It carries out the procedure that actually retrieves the similar blocks from image. Hence, the tasks of feature extraction and similarity matching for small blocks formed by moving in steps of 1 pixel are to be performed.
Parameters:
Data Item Parameter Type Data Type
Image (from library) Input RenderedImage or 3D array
Query Block Features
(Color & Texture
features)
Input Object
L most similar regions
in an image Output
Object containing Image Path
(String), Indices (Integer []) of
the similar regions with their
respective match values
(Double[]) ( a prototype is
class Data)

Sahil Narang 2011
52
Processing:

Sahil Narang 2011
53
Start
E
Similarity Measure
SIMMATCH = Minkowski-Form distance
between CMFeatures of WINDOW & CM
Features of QUERYBLOCK
Insertion Sort
Perform Insertion sort with SIMMATCH on
SIMCOLORBLOCKS in ascending order and
store the corresponding (x, y) coordinate
positions given by (m,n) of the WINDOW along
with similarity match. Use DATA class.
Define,
S = Window Size = Query Block Size
WINDOW [][][], BLOCKWINDOW [][][] of size 3XSXS
Image coordinates in STARTX,STARTY and ENDX,ENDY
COLOR [][][] of size 3XSXS
GRAY [][] of size SXS
NUMCOLORBLOCKS (number of blocks that will be subjected to texture analysis
for fusion)
NUMTEXTUREBLOCKS (number of blocks to be returned as output)
SIMCOLORLOCKS [] of size NUMCOLORBLOCKS
SIMTEXTUREBLOCKS [] of size NUMTEXTUREBLOCKS
1
Window Formation
WINDOW[m][n] = Image[i][j] for all 3 color components
For i = COL to S+COL; m = 0 to S
For j= ROW to S+ROW; n= 0 to S
Compute Normalized color values in RGB space
COLOR [1] = red color values of all pixel of WINDOW ÷ 255
COLOR [2] = green color values of all pixel of WINDOW ÷ 255
COLOR [3] = blue color values of all pixel of WINDOW ÷ 255
For ROW = STARTY to ENDY
For COL = STARTX to ENDX 2

Sahil Narang 2011
54
Constraints:
Optimizing the values of parameters L
Constraints imposed on Compute Online Features function for searching module are also applicable here
For i = 1 to NUMCOLORBLOCKS
Compute Gray Scale
GRAY[i][j] = (11*R+16*G+5*B) † 32 for R, G, B values at BLOCKWINDOW‟s ijth pixel
For i = 1 to S
For j= 1 to S
H
BLOCKWINDOW = Pixel values of Image from (x, y) coordinates of
SIMCOLORBLOCKS [i]
Similarity Measure
SIMMATCH = Minkowski-Form distance
between TEXTUREFeatures of
BLOCKWINDOW & TEXTUREFeatures of
QUERYBLOCK
Insertion Sort
Perform Insertion sort with SIMMATCH on
SIMTEXTUREBLOCKS in ascending order and
arrange the corresponding (x, y) coordinate
positions.
SIMTEXTUREBLOCKS
2
Stop

Sahil Narang 2011
55
B.5) Compare Windows
Type: Function
Responsibilities:
It compares the test block regions obtained for an image with the query block and highlights K most similar regions.
Parameters
:
Data Item Parameter Type Data Type
L most similar regions in
an image
Input (as function
argument)
Object containing Image Path
(String), Indices (Integer []) of the
similar regions with their respective
match values (Double[]) (a
prototype is class Data)
K images Output
Serializable Object[] containing
highlighted image 3D array ( byte
[][][]) ( class ImageSender)
Processing:
Constraints:
Optimizing the values of parameter K i.e. the number of image Blocks to be highlighted.
Star
t
RETRIEVEDBLOCKS
[]
Insertion Sort
Perform Insertion sort on RETRIEVEDBLOCKS
in descending order according to the total count
of lower similarity values in them (lower values
indicate high similarity). Images with exact
blocks will always appear at the first position.
RETAINEDBLOCKS []
Stop

Sahil Narang 2011
56
VI. LOGICAL DATABASE DESIGN
The structures of tables to be made in MySQL have been defined keeping in mind the entity specified in the ERD defined in SRS document. The number of tables is equal to the number of techniques that can be opted for.
TABLE VIII DATABASE TABLES
Entity (Table) Attributes Attribute
Type
Constraints Comments
CORRELATIONTexture
ImagePath varchar
(255)
Primary key Absolute path
of an image
file
Feature1
Double Not null
Weighted SD
of level-1 LH
band
Feature2 Weighted SD
of level-1 HL
band
Feature3 Weighted SD
of level-1 HH
band
Feature4 Weighted SD
of level-2 LH
band
Feature5 Weighted SD
of level-2 HL
band
Feature6 Weighted SD
of level-2 HH
band
Feature7 Correlation of
LL1-HL1 band
Feature8 Correlation of
LL1-LH1 band
Feature9 Correlation of
LH1-HL1
band
Feature10 Energy of LL1
band
Feature11 Weighted SD
of level-1 LL
band
Feature12 Mean of LL1
band
Feature13 Correlation of
LL2-HL2 band
Feature14 Correlation of
LL2-LH2 band
Feature15 Correlation of

Sahil Narang 2011
57
Entity (Table) Attributes Attribute
Type
Constraints Comments
LH2-HL2
band
Feature16 Energy of LL2
band
Feature17 Weighted SD
of level-2 LL
band
Feature18 Mean of LL2
band
FNormColor
ImagePath varchar(255) Primary key Absolute path
of an image
file
Feature1
Double Not null
Weighted
average of the
F-Norm of Red
color
component
Feature2 Weighted
average of the
F-Norm of
Green color
component
Feature3 Weighted
average of the
F-Norm of
Blue color
component

Sahil Narang 2011
58
Software Testing
SERIAL. NOS. TOPICS PAGE NOS.
I Introduction 59
A Purpose 59
B Scope 59
C Audience 59
D Definitions, Acronyms & Abbreviations 59
F Interpretation of tables used 59
II Tests performed and Results obtained 59
A Test cases for Searching (DFD Process 1.1) 59
A.1 Testing for GetFile () 59
A.2 Testing for ComputeOnlineFeatures() 60
A.3 Testing for SimilarityMeasure(), Sorting() 61
A.4 Database Testing 62
III Final Conclusion 63

Sahil Narang 2011
59
I. INTRODUCTION
A. Purpose
This document portrays the unit and system testing undertaken to verify the functionality of the software according to the requirements collected. It gives an insight into the working of the system. It also specifies the rectifications to be made to the system by observing the test results.
B. Scope
The scope of this SRS document encompasses the following: -
1. The testing results are concluded in this document to enable rectification to be done by the programmers and serve as a reference for further testing procedures.
2. It helps in maintaining or extending functionalities of the system.
C. Audience
Testers, Programmers, Researchers
D. Definitions, Acronyms and Abbreviations
See Appendix
E. References of pertinent documents
SRS, Research and Exploration, SDS, Experimental Results
F. Interpretation of the tables
Test cases and the outcome of performing them are appropriately structured in tables. The headings of the table columns clearly describe the contents. However, a color coding scheme is used for the outputs. Red color is a symbol of erroneous result. The output have been colored green, if the desired results match the expected ones.
II. TESTS PERFORMED & RESULTS OBTAINED
A. Test Cases for Searching (DFD Process 1.1)
A.1) Testing for Get File Function (DFD Processes 1.1.1 & 2.1.1)
Purpose:
To check if BMP & TIFF file formats of different sizes are being converted to the Java‟s internal representation as an object of RenderedImage class and image in other file formats are not loaded into memory.
Input Condition tested Function
called Output Image Path Image
Size
Condition T/
F
D:\nnng\texture1\101.
bmp 256X256
Filename contains
“.bmp”
T createBmpIma
ge()
RenderedIma
ge
D:\nnng\satimage\1.ti
f 512X512
Filename contains
“.tif”
T createTifImage
()
RenderedIma
ge
D:\pictures\bird.jpg 8X8 Filename contains
“.bmp” or “.tif”
F - Format JPG
not supported
D:\nnng\texture1\412.
bmp
2048X20
48
Filename contains
“.bmp”
T createBmpIma
ge()
Memory
heap space

Sahil Narang 2011
60
Input Condition tested Function
called
Output
error
D:\nnng\satimage\109
.tif 257X256
Filename contains
“.tif”
T createTifImage
()
RenderedIma
ge
D:\texture1\101.bmp Any File not found
T
-
Appropriate
message
shown
D:\blocks\babyele.bm
p 64x64
For browsing
functionality,
Filename
contains .bmp
T
createBmpIma
ge()
RenderedIma
ge
D:\blocks\chilly.bmp 72x72 For Browsing,
Size ≤64
F
-
Message
“ Size should
be less than
or equal to
64”
D:\blocks\tyre.bmp 11x11
For Browsing,
Height, Width are
even
F
-
Message
“ Size should
be even”
A.2) Testing for Compute Online Features (DFD Processes 1.1.3)
Purpose:
The online features module consisting of various methods for feature extraction gives the desired result.
All constraints mentioned in the SDS have been taken care of.
The requirement of 3 bands is fulfilled.
Input
Function called Output Image Image
Bands
Image
Size
Technique
I=Rendered
Image
(Output of
Get File)
3
256X256
CORRELATION
int
G[][]=convertToGray(I)
int H[][]=applyHaar(G,2)
getCorrelationFeatures(H)
Successful.
Double[8]
with feature
values
returned
120X120
Successful.
Features
returned
but there
was some
loss of
pixel values
at the
second
level of
Haar.
121X150 Array index
out of

Sahil Narang 2011
61
Input Function called Output
bounds
exception
in
applyHaar()
Input
Function called Output Image Image
Bands
Image
Size
Technique
I=Rendered
Image
(Output of
Get File)
3 256X256 Color
F-Norm
Double
C[][][]=findNormalizedRGB(I)
Double
R[]=calcWeightedFnorm(C[0])
Double
G[]=calcWeightedFnorm(C[1])
Double
B[]=calcWeightedFnorm(C[2])
getFnormFeatures(R, G, B)
Successful.
Double[3] ,
Double[9]
with
feature
values
returned
for this
technique
Input Condition Tested
Output Image Image
Bands
Image
Size
Techniqu
e
Condition T/
F
Rendered Image
(Output of Get
File)
1, 4 Any Any ImageBands ==
3 F
No
further
processi
ng.
Conclusion:
Image size should be validated in the Get File function itself as it creates problem in applyHaar().
A.3) Testing for Similarity Measure & Sorting (DFD Process 1.1.4, 1.1.5)
Purpose:
To verify the accuracy of the feature extraction techniques implemented. The test also confirms the accuracy of similarity measurement and insertion sorting.
Input
Condition tested
Output Condition T/
F
QFEAT= double[],
TFEAT= double[],
Double[]
SIMIMAGES
T[i] lies within Q[i] – A[i]
and Q[i] + A[i]
T
MATCH modified and
insertion sort performed by
comparing with previous K
matches of array
SIMIMAGES. Initially,
SIMIMAGES are initialized

Sahil Narang 2011
62
Input Condition tested Output
with maximum value of
double data type.
T[i] lies within Q[i] – A[i]
and Q[i] + A[i] F
Checks for the next element in
TFEAT without doing further
calculations
All elements of TFEAT
checked T
Output double[K]
SIMIMAGES
QFEAT==TFEAT T
SIMIMAGES [0] = MATCH
= 0.0. Successful
A.4) Database Testing
Purpose:
The functions that work with MySQL ODBC interface should be thoroughly tested for their transactions with the database. The following tests were performed for the functions mentioned below:
Manage offline features
Similarity measure, Sorting and Ranking
Tests Error to be handled Output
Connection to database not established (
due to reasons like incorrect password or
database driver)
java.sql.SQLException Searching
functionality
not disabled.
No message
shown.
Error while retrieving, inserting or
deleting records from the database ( like
tables do not exist, invalid attribute
values, parsing error in the query)
Java.sql.SQLException
(like table does not exist
etc.)
Appropriate
message shown.
Exception
handled.
ResultSet obtained is null i.e. no records
exist in the database
ResultSet object is null Condition
handled.
Appropriate
message shown.
Duplicate entry for images
Java.sql.SQLException :
duplicate entry
This insertion
error was
handled
properly.
Select, Delete & Insert Queries Java.sql.SQLException Successful
Conclusion:
Searching functionality should not be allowed when database connection is not established. Appropriate message should be shown for the same. Queries executed properly when the connection was made.

Sahil Narang 2011
63
Final Conclusion
The tests were conducted successfully, the results compiled and rectifications
suggested. As per the requirements, test data set consisted of satellite images, Brodatz
texture images, and a large set of color images.

Sahil Narang 2011
64
Experimental Results
SERIAL. NOS. TOPICS PAGE NOS.
I Introduction & Motivation 65
II Observations & Conclusions for Retrieval 65
A Optimizing parameters 65
B Results of Texture based approaches 65
B.1 Brodatz Database 65
B.1.1 Description of Image Library 65
B.1.2 Experimental setup 66
B.1.3 Correlation Retrieval Results 66
B.1.4 Performance Analysis 67
B.2 Vistex Database 699
B.2.1 Description of Image Library 69
B.2.2 Experimental setup 69
B.2.3 Performance Analysis 70
B.3 Conclusions 72
C Results of Color based F-Norm approach 72
C.1 Description of Image Library 72
C.2 Experimental setup 73
C.3 F-Norm Retrieval Results 73
III Observations & Conclusions for Browsing 74
A Multi-feature Fusion approach 74
B Optimizing parameters 74
C Setup for Satellite Images 75
D Results of Browsing on Satellite Images 75
E Results of Browsing on Non-satellite Images 77
F Conclusions 78

Sahil Narang 2011
65
I. INTRODUCTION & MOTIVATION
Nowadays, and in the days to come, a large number of applications, including military, industrial and civilian generate, and will continue to generate, even more gigabytes of color images per day. As a result, there is a huge amount of information which cannot be accessed or made use of unless it is organized. Organization here means that appropriate indexing is available or in order to allow efficient browsing, searching and retrieving as in keyword searches of text databases. The easiest way to search is with the use of QbE, which means that the user has to present an image to the system and the latter searches for others alike by extracting features from the query image and comparing them to the ones stored in the database. The extraction of meaningful features is critical in CBIR and therefore, an open and active field of research. Of the features usually employed by researchers are color, texture and shape.
The aim of this study is to investigate the applicability of using efficient feature extraction techniques for the improvement of CBIR. Another goal is to explore their utility over satellite images to find out regions by extracting features from images in the archive at query time. For e.g.: areas of vegetation or objects like aero plane can be easily browsed in a satellite image archive by giving a region/object containing similar features as an example.
Our original motivation is development of efficient color and texture feature descriptors for CBIR.
II. OBSERVATIONS & CONCLUSIONS FOR SEARCHING
We have conducted an experimental analysis on the feature descriptors for CBIR by following the research done in this field. The experiments were performed with Java as front end and MySQL as back end.
A. Optimizing Parameters
A.1) Variable K: Number of similar images to be retrieved for a query image
The similar images retrieved for a query image depends on the diversity of the database. The user may be misleaded by the results if K is not chosen aptly, since the results may present a narrow and restrictive view of similar images. After experimenting, variable K for searching function was set to 10.
B. Results of Texture based approaches
B.1) Brodatz Database
B.1.1) Image library
18 different textures were taken from the Brodatz Texture Album. The image of each texture type was divided into 16 non-overlapping images of size 256x256, resulting in a database of 288 images. Therefore, there are 16 relevant images belonging to each texture type. Sample database for a texture type is shown below.

Sahil Narang 2011
66
B.1.2) Setup
For the texture based method to be studied (Correlation), the respective features of each database image were computed offline and stored. The feature computation for the query image was done online. Fuzzy Logic was used as the similarity measure. One image of each texture type was selected as query and K most similar images were considered for comparative study of retrieval performance of mentioned techniques.
B.1.3) Correlation Retrieval Results
The similarity match (percentage) for Correlation was obtained by comparing the online computed feature vector with each stored feature vector and applying the 8 triangular fuzzy functions. The results are shown in descending order of similarity match.
The similarity match (percentage) for Correlation was obtained by comparing the online computed feature vector with each stored feature vector and applying the 18 triangular fuzzy functions. The results are shown in descending order of similarity match.
Query Image
100.00 73.96 69.78 65.84 61.34
Fig. 16 A sample of 16 images of a texture type

Sahil Narang 2011
67
57.28 56.26 51.55 50.70 43.20
B.1.4) Performance Analysis
The retrieval performance for 18 texture types is measured by precision and recall formulae (Research and Exploration VI.A.1) and the results have been summarized in the table shown below.
TABLE IX RETRIEVAL ACCURACIES OF 18 TEXTURE TYPES
Texture
Type
CORRELATION
Gradient
GLCM
WSD
Recall Precisio
n
Recall Precision Recall Precision Recall Precision
56.25
90.00
43.75
70.00
37.50
60.00
62.50
99.99
62.50
99.99
31.25
50.00
62.50
99.99
62.50
99.99
62.50
99.99
31.25
50.00
62.50
99.99
62.50
99.99
62.50
99.99
62.50
99.99
62.50
99.99
62.50
99.99
62.50
99.99
62.50
99.99
62.50
99.99
62.50
99.99
56.25
90.00
56.25
90.00
50.00
80.00
62.50
99.99
62.50
99.99
18.75
30.00
56.25
90.00
62.50
99.99
62.50
99.99
18.75
30.00
50.00
80.00
62.50
99.99
62.50
99.99
43.75
70.00
56.25
90.00
62.50
99.99
62.50
99.99
62.50
99.99
62.50
99.99
62.50
99.99
Fig.17 Query image and retrieved images along with the similarity percentage
written

Sahil Narang 2011
68
62.50
99.99
62.50
99.99
62.50
99.99
62.50
99.99
62.50
99.99
50.00
80.00
18.75
30.00
50.00
80.00
62.50
99.99
18.75
30.00
62.50
99.99
62.50
99.99
62.50
99.99
43.75
70.00
25.00
40.00
56.25
90.00
62.50
99.99
56.25
90.00
43.75
70.00
62.50
99.99
62.50
99.99
62.50
99.99
62.50
99.99
62.50
99.99
62.50
99.99
50.00
80.00
50.00
80.00
62.50
99.99
62.50
99.99
62.50
99.99
62.50
99.99
62.50
99.99
Finally, overall average precision and recall was computed as the average of precision and recall values obtained for each of the 18 texture types. Table XI presents the corresponding results along with the maximum and minimum values of the two measures.
TABLE X MAXIMUM, MINIMUM & OVERALL AVERAGE RETRIEVAL ACCURACY
Retrieval Accuracy ( in percentage)
CORRELATION
Gradient
GLCM
WSD
Recall Precision Recall Precision Recall Precision Recall Precision
Average
61.800
0
98.888
46.52
7
74.444
52.777
84.444
61.458
98.333
Minimum
56.25
90.00
18.75
30.00
18.75
30.00
50.00
80.00
Maximum
62.50
99.99
62.50
99.99
62.50
99.99
62.50
99.99

Sahil Narang 2011
69
B.2) VisTex Database
B.2.1) Image library
The database was created with the intention of providing a large set of high quality
textures for computer vision applications. Unlike other texture collections, the images
in VisTex do not conform to rigid frontal plane perspectives and studio lighting
conditions. The goal of VisTex is to provide texture images that are representative of
real world conditions. A database of 681 Images from the VisTex Album was used with each image having size 256 x 256.
B.2.2) Setup
For the texture based method to be studied (Correlation), the respective features of each database image were computed offline and stored. The feature computation for the query image was done online. Fuzzy Logic was used as the similarity measure. One image of each texture type was selected as query and K most similar images were considered for comparative study of retrieval performance of mentioned techniques.
Fig. 18 A sample of 12 images from VisTex Album

Sahil Narang 2011
70
B.2.3) Performance Analysis
TABLE XI RETRIEVAL ACCURACIES OF 16 IMAGES
Texture
Type
CORRELATION
Gradient
GLCM
WSD
Recall Precision Recall Precision Recall Precision Recall Precision
75.00
90.00
66.66
80.00
66.66
80.00
75.00
90.00
31.25
99.99
18.75
60.00
18.75
60.00
31.25
99.99
60.00
90.00
20.00
30.00
53.33
80.00
53.33
80.00
58.33
70.00
16.66
20.00
58.33
70.00
50.00
60.00
66.66
80.00
83.33
99.99
75.00
90.00
83.33
99.99
83.33
99.99
75.00
90.00
25.00
30.00
75.00
90.00
75.00
90.00
25.00
30.00
25.00
30.00
50.00
60.00
100.00
60.00
100.0
0
60.00
83.33
50.00
50.00
30.00
44.44
40.00
66.66
60.00
77.77
70.00
33.33
30.00
60.00
60.00
10.00
10.00
70.00
70.00
50.00
50.00

Sahil Narang 2011
71
Finally, overall average precision and recall was computed as the average of precision and recall values obtained for 16 Sample Images. Table XII presents the corresponding results along with the maximum and minimum values of the two measures.
TABLE XII MAXIMUM, MINIMUM & OVERALL AVERAGE RETRIEVAL ACCURACY
Retrieval Accuracy ( in percentage)
CORRELATION
Gradient
GLCM
WSD
Recall Precisio
n
Recall Precision Recall Precision Recall Precision
Average
67.547
69.375
44.260
42.500
50.613
52.50
58.305
61.875
Minimum
31.25
30.00
8.33
10.00
16.66
10.00
31.25
20.00
Maximum
100.00
99.99
100.00
99.99
83.33
90.00
83.33
99.99
Texture
Type
CORRELATION Gradient GLCM WSD
Recall Precisio
n
Recall Precision Recall Precision Recall Precision
83.33
99.99
8.33
10.00
66.66
80.00
83.33
99.99
66.66
60.00
11.11
10.00
33.33
30.00
66.66
60.00
100.00
40.00
100.0
0
40.00
50.00
20.00
75.00
30.00
50.00
30.00
50.00
30.00
16.66
10.00
33.33
20.00
60.00
60.00
40.00
40.00
40.00
40.00
40.00
40.00
66.66
40.00
16.66
10.00
50.00
30.00
83.33
50.00

Sahil Narang 2011
72
B.3) Conclusions
The table clearly shows the improved precision of the Correlation approach over the other three methods. A significant increase in retrieval accuracy (recall and precision) is observed particularly for the cases where the performance of the other three methods was found to be degraded. This can be attributed to the fact that Correlation based method uses the detailed information of all the sub bands, obtained after applying Haar DWT. The decomposition of an image using Haar DWT is advantageous over gradient operation and the Correlation technique further enhances the performance of image retrieval system. A noticeable improvement in performance of Correlation is also observed when comparing with the results of GLCM approaches where relationship between neighbouring pixels is directly used to calculate the features.
C. Results of Color based F-Norm approach
C.1) Image library
For the testing of this approach, database of 837 colored images each of size 256X256 was taken. Sample database for two colored images is shown below.
(a)
(b)
Fig.19 (a) Sample of yellow flowers (b) Sample of horses

Sahil Narang 2011
73
C.2) Setup
The 3 F-norm features were computed offline for database images and online for query image. Then, the similarity match percent was calculated using 3 triangular fuzzy functions and the results shown in descending order.
C.3) F-Norm Retrieval Results
Query Image
100.00 85.93 81.30 68.11 65.82
65.42 64.85 64.77 64.49 64.48
(a)
Query Image
100.00 93.76 91.70 88.72 88.11
86.55 85.90 84.04 81.86 81.50
(b
Fig.20 Retrieval based on color with similarity matches

Sahil Narang 2011
74
III. OBSERVATIONS & CONCLUSIONS FOR BROWSING
A. Fusion approach
Multi-feature fusion is used by adopting the following techniques to combine the features.
Color Descriptor: Color F-Norm
Texture Descriptor: Correlation
It is a common observation that processing images takes a considerable amount of time, especially, when computation has to be done with every pixel of the image. This approach searches the larger image for a smaller queried portion by traversing from left to right and top to bottom in steps of one pixel.
The steps followed in the main task (as shown in Fig.13 of Research & Exploration document) are listed below:
A small block of size SXS, say BLOCK, is input.
Three color features of BLOCK, say TCOLORFEATURES, are calculated.
Eighteen texture features of BLOCK, say TTEXTUREFEATURES, are calculated.
A larger image of size NXN, say IMG, is input.
The steps for each are as follows:
1. Repeat steps 2 to 4 moving BLOCK one pixel at a time over IMG from left to right and top to bottom, starting from the first pixel positions to the ending positions of the corresponding IMG.
2. Color features for SXS block of IMG partition overlapped by BLOCK (as mentioned in step 1), say QCOLORFEATURES, is calculated.
3. The similarity match between QCOLORFEATURES and TCOLORFEATURES is computed.
4. Insertion sort is used to keep track of the NUMCOLORBLOCKS lowest matches (most similar areas) for the partition.
5. After the blocks of the entire image have been analysed on the basis of color property, the blocks corresponding to the NUMCOLORBLOCKS lowest matches are subjected to texture analysis by computing similarity match between the NUMCOLORBLOCKS blocks‟ eighteen texture features, say QTEXTUREFEATURES and TTEXTUREFEATURES. The NUMCOLORBLOCKS values are rearranged in ascending order according to texture feature similarity.
B. Optimizing Parameters for browsing
B.1) Variable NUMCOLORBLOCKS: Number of similar regions whose color properties qualify them for further refinement through texture introspection.
The parameter‟s value was chosen to be 100 after carefully examining the relevance of the results obtained. A lower value biased the results towards color, thus ignoring significant areas; while a higher value; either took the results in the wrong direction or did not show major improvement in capturing the texture property.
B.2) Variable K: Number of large images containing similar regions/objects to be retrieved for a block image

Sahil Narang 2011
75
Depending on the number of images in the image library, this parameter ranges its value from 1 to 25. Experimentation yielded that a maximum of 20 images were sufficient to capture relevant information.
B.3) Variable L: Number of similar regions/objects images in a large image to be highlighted for a block image
For IRS LISS III
This parameter was set to 20. Twenty regions would give a proper idea of the portions in an image that are nearest to the query.
For IKONOS
This parameter was set to 5. Five regions would give a proper idea of the portions in an image that are nearest to the query.
B.4) Block Size SxS: Size of the query block
1. Satellite Images: In an image taken from IRS (LISS – III) satellite, a pixel covers an area of approx. 23.5x23.5 sq.m. A block size of 16x16 pixels would thus contain a significant amount of territorial information covering 141376 sq.m. and hence, the value S was chosen to be 16. For IKONOS images, even block sizes are taken.
2. Non satellite images: Different values were selected for SxS in such a manner that it covered a significant amount of color and texture information from the given area in color image.
C. Setup for satellite images
Few MSS satellite images of different sizes, NxN, were collected from the web for the experimental purpose. Blocks of size 16x16 for IRS images and SxS for IKONOS images, containing certain identifiable objects/regions like marshy land, buildings, water bodies, cultivated land, forests, aeroplanes, ships, oil tanks etc. were queried. These blocks were searched on the same NxN image to which they belonged and also on any other image.
D. Results of Browsing satellite images
D.1) IRS LISS III Images
The following figures illustrates the exact match found in an IRS image when blocks of IRS images were cut and queried on other IRS images.
1. Desert
Query Block Query Image

Sahil Narang 2011
76
2. Vegetation
3. Salt Deposit
4. Water
D.2) IKONOS Images Some 256x256 sized images were cut from IKONOS pictures of different airports
present in the satellite imagery collection. The following figures illustrate the nearest matches found when an aeroplane block sliced out from one of the images comprising the same collection was browsed over the cut images.
Query Image
Query Image
Query Image Query Block
Query Block
Query Block

Sahil Narang 2011
77
E. Results of Browsing non-satellite images
In the following figures images largely containing sky and water were taken. Blocks
of sky and water were cut from images and browsing was done on images other than
the ones from which they were cut. The objective was to determine whether the
program could correctly differentiate between sky and water.
Query Image Query Block
Query Image Query Block
Query Block
Query Block
Query Image
Query Image

Sahil Narang 2011
78
F. Conclusions
Fusion approach
Experiments on the basis of collaborated similarity of color and texture features have proved to be accurate and impressive on all kinds of images. A remarkable improvement in the search results was seen when a fusion of both color and texture features was done. It was also observed that a single search criterion may be equally preferable for satellite images.
Query Block Query Image

Sahil Narang 2011
79
Software Planning & Execution IV. INTRODUCTION
The development of the task was carried out in spiral fashion. Each iteration of the spiral laid out a new cycle of requirement, design, development, testing and evaluation. Since research and introduction of novelty were the major fields to be worked upon, inherent risks accompanied them. These risks included:
Unrealistic schedule
Developing the wrong software functions
Uncertainty of success of an experiment
Many unresolved requirement issues
Requirements in the SRS that are not testable
Overestimation of tasks
V. PLANNING & EXECUTION MODEL
1.1.1 1.2
1.3 1.4
2.1 2.2
2.3 2.4
3.1 3.2
3.3 3.4
4.4.1 4.3.1
4.2.1 4.1.1
5.4 5.3
5.2 5.1
6.4
6.3
6.2 6.1
7
1.1.2
4.1.2
4.2.2
4.3.2
4.4.2
Determine requirements Design and Development
Unit & System Testing Evaluation of results

Sahil Narang 2011
80
Item Description Work Done Work Product
1.1.1 Exploring CBIR
1.1.2 Analysis of implemented texture
based techniques Research paper studied
1.2 Implementing the already done work
for self understanding
Concept of research paper
implemented Code
1.3 Tested the tasks in 1.2 Experimental results accumulated Observations
1.4 Evaluation of the tasks to improve
the techniques
Evaluation and discussion of the test
results Conclusions
2.1 Requirement of developing an
efficient texture descriptor for CBIR.
Alternative methods for texture
descriptors explored, discussed and
finalised.
Research & Exploration
document
2.2 Development of the finalised method SDS prepared and method coded Design document & code
2.3 Testing the developed method Test cases prepared Test results accumulated
2.4 Evaluation of the developed method Test results observed and concluded
Experimental results
finalised for Correlation
technique
3.1 Requirement of developing an
efficient color descriptor for CBIR.
Alternative methods for color
descriptors explored, discussed and
finalised.
Research & Exploration
document
3.2 Development of the finalised method SDS prepared and method coded Design document & code
3.3 Testing the developed method Test cases prepared Test results accumulated
3.4 Evaluation of the developed method Test results observed and concluded
Experimental results
finalised for Color F-Norm
technique
4.1
1) Re-evaluating the Correlation
results
2) Enhancing the results of F-Norm
1) Other texture descriptors studied
2) Other color descriptors studied and
alternative approaches discussed
1, 2) Research and
Exploration document
4.2 Development of finalised method SDS for 3 texture descriptors
prepared and coded the same. Design document and code
4.3 Testing the developed methods Test cases prepared Test results accumulated
4.4 Evaluation of the developed methods
1) Methods compared with
Correlation Technique
2
Research Paper submitted
5.1
Requirement for Defence purposes to
search out parts of an image in large
satellite images
1) Discuss the alternatives,
constraints, limitations of processing
large images
2) Studied the fundamental of
Satellite Imagery
Research & Exploration
document
5.2 Development of the discussed
strategy SDS prepared and strategy coded Design document and code
5.3 Testing the strategy Test cases prepared and rigorous
testing done Test results accumulated
5.4 Evaluation of the test results Test results observed and
summarized Results recorded
6.1
Requirement to further refine the
browsing results and minimize the
processing time for large sized
databases
Alternatives discussed Research & Exploration
document
6.2 Development of the finalised strategy SDS prepared and strategy coded Design document and code
6.3 Testing the strategy Test cases prepared and rigorous
testing done Test results accumulated
6.4 Evaluation of the test results Test results observed and
summarized Results recorded

Sahil Narang 2011
81
Item Description Work Done Work Product
7 All the units were incorporated as a
system, GUI developed System tested Software system with GUI
VI. AGGREGATED WORK PRODUCT
This report is an aggregation of all the work products obtained during the life cycle of the project.
1. All the requirements have been gathered together in the SRS document.
2. Research and Exploration document puts forward a comprehensive idea of the topics explored for the various phases of the spiral corresponding to the requirements.
3. SDS is a union of the common and distinct functionalities designed and programmed as the development proceeded in a constructive manner.
4. Unit and regression testing performed for all the requirements have been cumulated in the document titled “Software Testing”.
5. Experimental results are the proof of the work actually done.
6. Finally, GUI presents the complete project.

Sahil Narang 2011
82
User Interface Design & Testing
SERIAL. NOS. TOPICS PAGE NOS.
I GUI for Database Management 83
A Manage Offline Features 83
A.1 View Database Function 84
A.2 Insert Function 86
A.3 Delete Function 89
II GUI Searching Module 91
III GUI for Browsing Process 92
IV GUI for Get File Function 94

Sahil Narang 2011
83
I. GUI FOR DATABASE MANAGEMENT
A. Manage Offline Features
Fig. 32 Database connectivity problems result in disabling of the interfaces of “Manage offline features” and
“Searching” functionalities ( emphasized by dotted lines)

Sahil Narang 2011
84
A.1) View Database Function
Fig. 33 View Database Function of Manage Offline Features Module which shows the images whose
offline features are stored in tables of Color based descriptors. The highlighted oval indicates the
memory constraint

Sahil Narang 2011
85
Fig. 34 View Database Function of Manage Offline Features Module which shows the images whose offline
features are stored in tables of all Texture based descriptors
Fig. 35 View Database Function of Manage Offline Features Module which shows the images whose offline
features are stored in tables of both Color and Texture based descriptors
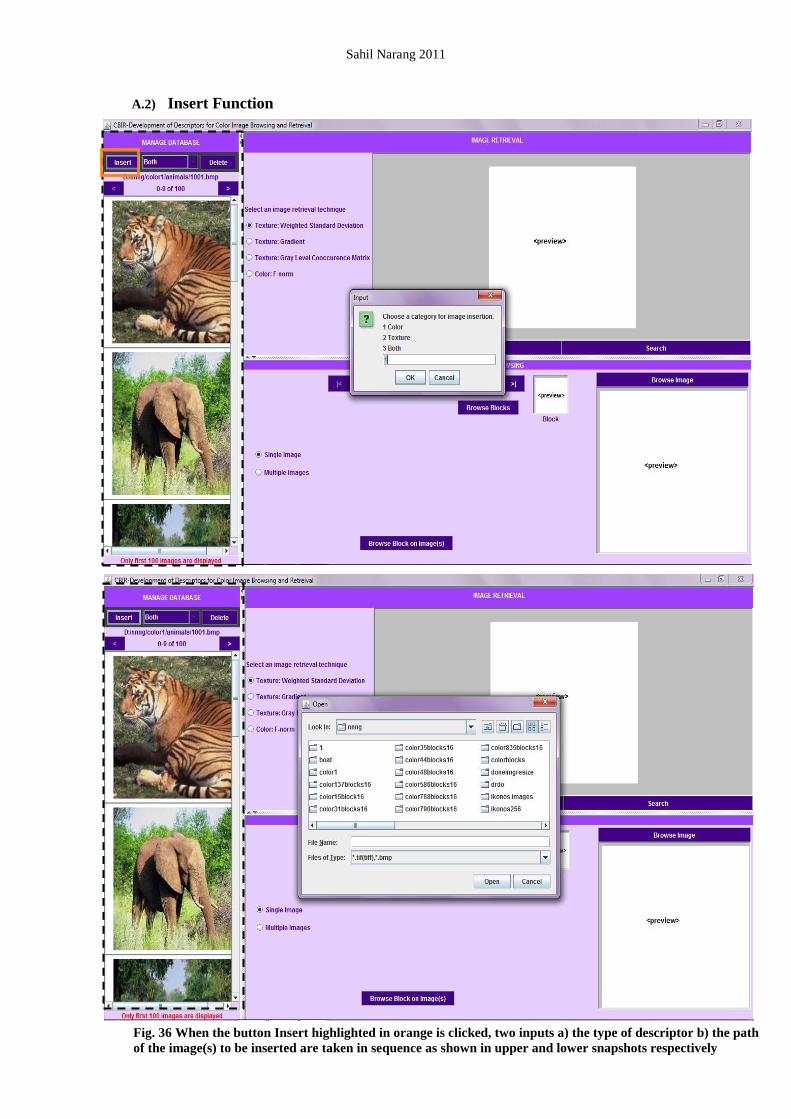
Sahil Narang 2011
86
A.2) Insert Function
Fig. 36 When the button Insert highlighted in orange is clicked, two inputs a) the type of descriptor b) the path
of the image(s) to be inserted are taken in sequence as shown in upper and lower snapshots respectively

Sahil Narang 2011
87
Fig. 37 The output of successful insertion of the image(s) in the database is shown here. The upper snapshot
shows the message box and the next is obtained when the displayed images are refreshed after insertion

Sahil Narang 2011
88
Fig. 38 Illustration of erroneous output of insert operation on databases is presented here. The upper error occurs
when general problem in insertion occurs whereas the specific primary key problem is shown in the lower snapshot

Sahil Narang 2011
89
A.3) Delete Function
Fig. 39 To delete an image from the database, an image from the list is selected and Delete button clicked. On
clicking the button without selection, a validity check is performed failing which an error message is displayed.

Sahil Narang 2011
90
Fig. 40 The image is removed after successful deletion from the database on user’s confirmation.

Sahil Narang 2011
91
II. SEARCHING MODULE
III. GUI FOR BROWSING PROCESS
A. Browsing on a Single Image
Fig. 41 The input to the search function is the type of technique specified by choosing a radio button encircled in
green and a query image given by clicking on the left button. When the search button is directly clicked without
the query image input, a validation is performed.

Sahil Narang 2011
92
III. BROWSING MODULE
Fig. 44 Two inputs for the block and the image to be browsed are taken

Sahil Narang 2011
93
IV.
Fig. 45After supplying the inputs, the button outlined with orange color is clicked to trigger the processing and
receive the output as portrayed in the upper snapshot. If the user directly clicks on the button without giving all
the required inputs, an error message appears.

Sahil Narang 2011
94
IV. GUI FOR GET FILE FUNCTION
Fig. 53 Image paths for query image, block image and image to be browsed are entered by the user through the
“Open” window provided to him. If an invalid path is entered an error message is displayed

Sahil Narang 2011
95
RESEARCH PAPER SUBMITTED
S. NO. PAPER TITLE CONFERENCE STATUS
1 Texture based Image Retrieval using Correlation on Haar Wavelet Transform
CNC 2012, Chennai
Accepted. To be
Published by
Springer.
The papers were submitted under the guidance of D. N. Verma, Scientist „E‟, DTRL, DRDO, Ministry of Defence.

Sahil Narang 2011
96
Appendix
SERIAL. NOS. TOPICS PAGE NOS.
1 Chapter I 97
1.1 Representation of Images 97
1.2 Image Formats 97
2 Chapter II 101
2.1 Structural Model 101
2.2 Behavioral Model 102
2.3 Object Oriented Model 102
3 Chapter III 103
3.1 Insertion Sort 103
3.2 Merge Sort 104
4 Chapter IV 106
4.1 WSD Technique 106
4.2 Gradient Operation on Haar DWT 106
4.3 Gradient Operation using Sobel 107
4.4 WSD with Gradient Operation 107
4.5 GLCM Technique 108
4 Definitions, Acronyms & Abbreviations 109
5 Formulae 113

Sahil Narang 2011
97
Chapter I I. REPRESENTATION OF IMAGES
A. Respresenting Digital Images
Let f(s, t) represent a continuous image function of two continuous variables. This function is converted into a digital image by sampling and quantization. The continuous image is sampled into a 2D array, f(x, y) containing M rows and N columns, where (x,y) are discrete coordinates. For notational clarity and convenience, integer values are used for these discrete coordinates:
x = 0, 1, 2 … M-1 and y = 0, 1, 2 … N-1
The section of the real plane spanned by the coordinates of an image is called the spatial domain. An image can be represented as an array of numerical values of f(x, y). For example, f of size 256X256 would represent an image containing 65536 elements. In equation form, representation of an MXN numerical array can be written as:
Each element of this matrix is called an image element, picture element, pixel, or pel.
B. Respresenting Color Images
A color image stores set of component values such as a triplet of (R, G, B) or that of hue, saturation, intensity (H, S, I) representing the quantized values of the color spectrum. The matrix representation shown above is capable of storing only the achromatic attribute or gray levels of an image expanding from black to white. Several such matrices are required to store the values of each component comprising the color at a pixel, together giving a representation of color image.
II. IMAGE FORMATS
Image file formats are standardized means of organizing and storing images. This description is about digital image formats used to store photographic and other images.
f(x,y) =
f(0,0) f(0,1) … f(0,N-1)
f(1,0) f(1,1) … f(1,N-1)
. . .
. . .
. . .
f(M-1,0) f(M-1,1) … f(M-1,N-1)
(x,
Gray Scale Image
(x,
RGB Color Image
Fig. showing representation of color and gray scale images

Sahil Narang 2011
98
Image files are composed of either pixel or vector (geometric) data that are rasterized to pixels when displayed in a vector graphic display.
A. Bitmap Images (BMP)
A.1) Introduction
The BMP file format (Windows bitmap) handles graphics files within the Microsoft Windows OS. Typically, BMP files are uncompressed, hence they are large; the advantage is their simplicity, wide acceptance, and use in Windows programs. BMP format can accommodate images that are black and white (1 bit per pixel) up to true color (24 bits per pixel). A BMP file consists of either 3 or 4 parts. The first part is the header, followed by an information section, and then the palette follows for indexed color images, and last of all is the pixel data. The header contains position of the image data with respect to the start of the file, image width and height, the type of compression and other useful information.
A typical BMP file usually consists the following blocks of data:
TABLE I BLOCKS OF DATA FOR BMP FILE
Block Description
BMP Header Stores general information about the BMP file
Bitmap
Information Stores detailed information about the bitmap image
Color Palette Stores the definition of the color being used for indexed color
bitmaps
Bitmap Data Stores the actual image, pixel by pixel
A.2) Bitmap File Header
TABLE II BMP FILE HEADER
Start Size Name Standard
Value Purpose
1 2 bfType 19778 Must always be set to „BM‟ to declare
that it is a BMP file
3 4 bfSize ?? Specifies the size of file in bytes
7 2 bfReserved1 0 Must always be set to 0
9 2 bfReserved2 0 Must always be set to 0
11
4 bfOffBits 1078 Specifies the offset from the
beginning of the file to the bitmap
data
15 4 biSize 40 Specifies the size of the Bitmap Info
Header structure in bytes
19 4 biWidth 100 Specifies width of image in pixels
23 4 biHeight 100 Specifies height of image in pixels
27 2 Biplanes 1 Specifies the number of planes of the
target device, must be set to 0
29 2 biBitCount 8 Specifies the number of bits per pixel
31 4 biCompression 0 Specifies the type of compression,

Sahil Narang 2011
99
Start Size Name Standard
Value Purpose
usually set to 0 ( no compression)
35
4 biSizeImage 0 Specifies size of image data in bytes.
If there is no compression, it is valid
to set this member as 0
39
4 biXPelsPerMeter 0 Specifies horizontal pixels per meter
on the designated target device,
usually set to 0
43
4 biYPelsPerMeter 0 Specifies vertical pixels per meter on
the designated target device, usually
set to 0
47
4 biClrUsed 0 Specifies number of colors used in the
bitmap, if set to 0, the number of
colors is calculated using biBitCount
member
51
4 biClrImportant 0 Specifies number of colors that are
„important‟ for bitmap, if set to 0, all
colors are important
A.3) RGB Quad Array
The following table shows a single RGBQUAD structure, which helps in retrieving red, green and blue color value of a pixel:
TABLE III BMP RGB QUAD ARRAY INFORMATION
Start Size Name Standard Value Purpose
1 1 rgbBlue - Specifies the blue part of color
2 1 rgbGreen - Specifies the green part of color
3 1 rgbRed - Specifies the red part of color
4 1 rgbReserved - Must always be set to 0
B. Tagged Image File Format (TIFF or TIF)
B.1) Introduction
TIFF (Tagged Image File Format) is a flexible image file format. A file is defined to be a sequence of 8-bit bytes, where the bytes are numbered from 0 to N. the largest possible TIFF file is 2
32 bytes in length. The TIFF file format‟s flexibility is both
blessing and curse, because no single reader reads every type of TIFF file. The TIFF image format is not widely supported by web browsers.
A TIFF file begins with an 8-byte image file header that points to an image file directory (IFD). An image file directory contains information about the image, as well as pointers to the actual image data.
B.2) Image File Header
A TIFF file begins with an 8-byte image file header, containing the following information:

Sahil Narang 2011
100
TABLE IV TIFF FILE HEADER INFORMATION
Bytes Values Purpose
0 – 1
II
(4949.H)
Specifies that the byte order used in the file is from the least
significant to the most significant byte, for both 16-bit and 32-bit
integers. This is called Little Endian byte order.
MM
(4D4D.H)
Specifies that the byte order used in the file is from the most
significant to the least significant byte, for both 16-bit and 32-bit
integers. This is called Big Endian byte order.
2 – 3 42 An arbitrary but carefully chosen number (42) that identifies the
file as a TIFF file. The byte order depends on the bytes 0 – 1
4 – 7 - The offset (in bytes) of the first IFD. The directory may be at
any location in the file after the header but must begin on a word
boundary. In particular, an Image File Directory may follow the
image data it describes. Readers must follow the pointers
wherever they may lead. The term byte offset is always used in
this document to refer to a location with respect to the beginning
of the TIFF file. The first byte of the file has an offset of 0.

Sahil Narang 2011
101
Chapter II I.STRUCTURAL MODEL
A. Flowchart
Symbols Symbol Name Description
Process Show a Process or action step.
Data
Indicates inputs to and outputs from a process. As
such, the shape is more often referred to as an I/O
shape than a Data shape
Predefined Process
(Subroutine)
Marker for another process step or series of
process flow steps that are formally defined
elsewhere. This shape commonly depicts sub-
processes.
Flow Line (Connectors) Show the direction that the process flows.
Terminator
Show the start and stop points in a process. When
used as a Start symbol, terminators depict a
trigger action that sets the process flow into
motion.
Condition
Indicates a question or branch in the process
flow. Typically, a Decision flowchart shape is
used when there are 2 options (Yes/No, No/No-
Go, etc.)
Connector
Show a jump from one point in the process flow
to another. Connectors are usually labeled with
capital letters (A, B, AA) to show matching jump
points. They are handy for avoiding flow lines
that cross other shapes and flow lines. They are
also handy for jumping to and from a sub-
processes defined in a separate area than the main
flowchart.
Off- Page Connector
Shows continuation of a process flowchart onto
another page. When using them in conjunction
with Connectors, it's best to differentiate the
labels, e.g. use numbers for Off-Page Connectors
and capital letters for Connectors.
Merge Shows the merging of multiple processes or
information into one.
Extract Shows when a process splits into parallel path.
Or
Shows when a process diverges - usually for
more than 2 branches. When using this symbol, it
is important to label the out-going flow lines to
indicate the criteria to follow each branch.
Summing Junction
Shows when multiple branches converge into a
single process.
Loop
Shows the steps of the process that are performed
iteraticely

Sahil Narang 2011
102
B. Data Flow Diagram
Symbols Symbol Name Description
Data Process Show a Process or action step.
Source/ Destination
Indicates the external users/ entities of the
system.
Data Flow Show the direction that the data flows.
File Store Show the data stored in files.
External Data Storage Show the data stored in the database
II.BEHAVIORAL MODEL
A. State Diagram
Symbols Symbol Name Description
Filled Circle Show initial state
Filled circle in
hollow circle Show final state
Rounded Rectangle
known as State
Top of the rectangle contains a name of the state. Can contain
a horizontal line in the middle, below which the activities that
are done in that state are indicated
Arrow denoting
transition
The name of the event causing this transition labels the arrow
body. A guard expression may be added before a "/" and
enclosed in square-brackets ([event Name [guard
Expression]), denoting that this expression must be true for
the transition to take place. If an action is performed during
this transition, it is added to the label following a "/" (event
Name [guard Expression]/action).
III. OBJECT ORIENTED MODEL
A. Class Diagram
Symbols Symbol Name Description
Class Indicates the name of the class in the first partition, attributes
in the second partition and operations in the third partition.
Active class
Initiate and control the flow of activity, while Passive class
store data and serve other class.
+, −, # Visibility (Public,
Private, Protected) These are markers to signify who can access information
within a class.
Link It is used when a class inherits the Serializable class

Sahil Narang 2011
103
Chapter III I. INSERTION SORT
Insertion sort is a simple sorting algorithm, a comparison sort in which the sorted array (or list) is built one entry at a time. It is much less efficient on large lists than more advanced algorithms such as quick sort, or heap sort.
A. Algorithm
Every iteration of insertion sort removes an element from the input data, inserting it into the correct position in the already-sorted list, until no input elements remain.
InsertionSort( Array A)
Begin
For I = 2 to length[A] – 1 step 1
Begin
Value = A[i]
J = I – 1
Done = false
Repeat
If A[J] > value then
Begin
A[J+1] = A[J]
J = J – 1
If J < 0 then
Done = true
Else
Done = false
Until done
A[J+1] = Value
End For
End
B. Analysis
The best case input is an array that is already sorted. In this case insertion sort has
a linear running time (i.e., Θ (n)). During each iteration, the first remaining element of
the input is only compared with the right-most element of the sorted subsection of the
array.
The worst case input is an array sorted in reverse order. In this case every iteration of
the inner loop will scan and shift the entire sorted subsection of the array before
inserting the next element. For this case insertion sort has a quadratic running time
(i.e., O (n2)).

Sahil Narang 2011
104
The average case is also quadratic, which makes insertion sort impractical for sorting
large arrays.
However, insertion sort is one of the fastest algorithms for sorting arrays containing fewer than sixteen elements.
II. MERGE SORT
Merge sort is an O (n log n) comparison-based sorting algorithm. In most implementations it is stable, meaning that it preserves the input order of equal elements in the sorted output. It is an example of the Divide and Conquer algorithmic paradigm.
A. Algorithm
MergeSort (Array M)
Begin
If (Length (M) ≤ 1)
Return M
Middle = Length (M) ÷ 2
For each X in M up to Middle
Add X to left
For each X in M up to Middle
Add X to right
Left = MergeSort(Left)
Right = MergeSort(Right)
Result = MergeSort(Left, Right)
Return Result
End
After writing MergeSort, it is required to merge both the left and right lists created above.
Merge (Left, Right)
While Length (Left) > 0 and Length (Right) > 0
If first (Left) ≤ first (Right)
Append first (Left) to Result
Left = rest (Left)
Else
Append first (Right) to Result
Right = rest (Right)
End While
If Length (Left) > 0
Append Left to Result
Else

Sahil Narang 2011
105
Append Right to Result
Return Result
End
B. Analysis
In sorting N objects, merge sort has an average and worst case performance of O (N log N).

Sahil Narang 2011
106
Chapter IV 4.1 WSD TECHNIQUE
The decomposed gray level image obtained after applying the Haar transform is subjected to feature extraction procedure by using statistical tools as discussed below. The output of this procedure is a vector containing quantitative values that describe the texture content of the image.
1. An image after L-level DWT contains 3*L+1 sub bands. The standard deviation of 3*L bands (3 of each level) along with the mean and standard deviation of the approximation image obtained at the L
th level are calculated.
2. Since these high frequency sub bands lose information at higher levels of decomposition, the standard deviation (SD) of each high frequency sub band image at i
th level is weighted by the factor ½
(i-1), thus assigning higher weights
to lower level bands.
3. The 3*L+2 sized feature vector is defined as follows:-
TF = {1LH
, 1HL
, 1HH
, ½ 2LH
, ½ 2HL
, ½ 2HH
… ½(L-1)
2LH
, ½(L-1)
2HL
, ½(L-1)
2HH
µLLL
, LLL
}
where, TF stands for Texture Features, iMM is the SD of the MM ( stands for LL, LH, HL, or HH sub bands ) at decomposition level i and µ is the mean of the approximation image ( LL sub band at level 2 ).
This texture feature extraction technique is called Weighted Standard Deviation (WSD).
4.2 Gradient Operation on Haar Discrete Wavelet Transform (DWT)
This approach calculates texture features by following steps given below:
1. 1-Level Haar discrete wavelet transform is applied on gray scale images
2. The HL and LH sub bands are used to obtain gradient direction using the formula
1HL
1
HH
1LH
2LL
µ2LL
2LH
2HL
2
HH
Fig.7 WSD method on 2-level haar

Sahil Narang 2011
107
where, gx, gy are horizontal (HL) and vertical (LH) gradient magnitudes, respectively.
3. After calculating gradient theta, 9 bins, each of 40 degree are calculated.
4. For each calculated bin, one or a combination of mean, standard deviation and entropy are computed resulting in the texture feature content descriptor.
4.3 Gradient Operation
The Sobel gradient mask is applied directly on gray scale image to obtain the gradient direction, theta of each pixel. Then, steps 3, 4 mentioned above are followed.
4.4 WSD WITH GRADIENT OPERATION
This approach calculates texture features by following steps given below:
1. 1-Level Haar discrete wavelet transform is applied on gray scale images.
2. 5 WSD features are computed.
3. Gradient theta is calculated and divided into 9 bins.
4. For each bin, a pair of statistical methods is computed resulting in a total of (9*2 + 5 =23) features.
1 0 -1
2 0 -2
1 0 -1
1 2 1
0 0 0
-
1
-
2
-
1
Fig.8 Vertical & Horizontal Sobel masks
Fig.9 A brief illustration of masking
Fig.7 Division of θ values in 9 bins of 40º each.
Statistics is applied on the values of each bin

Sahil Narang 2011
108
4.5 IMPLEMENTATION OF CO-OCCURRENCE MATRIX ON IMAGE
GLCM is a spatial domain technique. It is a tabulation of how often different combinations of pixel brightness values (Gray Levels) occur in an image. The texture features are calculated by following the underlined steps in order:
1. Four co occurrence matrices are computed from the gray scale image by considering distance between pixels to be 1 and the four directions as 0
0, 45
0,
900 and 135
0.
2. For each co occurrence matrix so obtained, four features namely; contrast, correlation, energy and homogeneity are calculated, thus resulting in a feature vector of size 16.
1 2 3 4
1 2 0 0 1
2 0 0 1 0
3 1 0 1 0
4 0 0 0 0
1 2 3
1 3 1
4 3 1
Fig.10 Formation of co-occurrence matrix for 90º direction and a single gap between the pixels

Sahil Narang 2011
109
Definitions, Acronyms & Abbreviations I. DEFINITIONS
Bands
In Java AWT API, a sample is the most basic unit of image data. Each pixel is composed of a set of samples. For an RGB pixel, there are 3 samples; one for Red, Green, Blue. All samples of the same kind across all pixels in an image constitute a band. For e.g.: in an RGB image, all red samples together make up a band. Therefore, an RGB image has three bands. A three-color subtractive image contains three bands; one each for cyan, magenta, and yellow (CMY). A four-color subtractive image contains four bands; one each for cyan, magenta, yellow, and black (CMYK).
Color Band
The set of all samples of one type in an image, such as all red samples or all green samples
Color Space
A color model is a specification of a coordinate system and a subspace within that system where each color is represented by a single point. The purpose is to facilitate the specification of colors in some standard way.
Discrete Wavelet Transform
See Multiresolution Theory
Frequency Domain
In general, this domain causes changes in image position correspond to changes in the spatial frequency. This is the rate at which image intensity values are changing in the spatial domain image.
In context with Image Processing, it transforms the image to its frequency representation, perform image processing and compute inverse transform back to the spatial domain.
Example of Frequency Domain is Fourier Transform.
Gradient
The gradient or slope of a line describes its steepness, incline, or grade. A higher value indicates a steeper incline. The slope is defined as the ratio of the “rise” divided by the “run” between two points on a line. In other words, it is the ratio of the altitude change to the horizontal distance between two points. Given two points (x1, y1) and (x2, y2) on a line, the slope m of a line is:

Sahil Narang 2011
110
m = (y2 - y1) ÷ (x2 - x1)
A horizontal line has slope 0º, a 45º rising line has a slope of +1, a 45º falling line has a slope of -1. a vertical line‟s slope is undefined. The angle θ a line makes with the positive X-axis is closely related to the slope m via the tangent function:
m = tan θ
θ = tan-1
(m)
Two lines are parallel if and only if their slopes are equal and they are not coincident or if they both are vertical and therefore have undefined slopes. Two lines are perpendicular if the product of their slopes is -1or one has a slope of 0 (a horizontal line) and the other has an undefined slope (a vertical line).
Gray Level
It refers to a scalar measure of intensity that ranges from black, to grays, and finally to white.
Multi-resolution Theory
Multi-resolution analysis incorporates and unifies techniques from a variety of disciplines including subband coding and pyramidal image processing. It is concerned with the representation and analysis of signals at more than one resolution. Features that might go undetected at one resolution may be easy to detect at another. The three image-related operations which are tied to MRA are briefed here:
1. Image Pyramid: An image pyramid is a collection of decreasing resolution images arranged in the shape of a pyramid. The base of the pyramid contains a high resolution representation and the apex contains a low resolution approximation as shown in the figure. Prediction residual pyramid is obtained by finding prediction residual, which is defined as the difference between the approximations of two subsequent levels.
dy
dx
Fig. showing image pyramid

Sahil Narang 2011
111
2. Subband Coding: In subband coding an image is decomposed into a set of band limited components called sub bands. The decomposition is done by using digital filters. The output of a low pass filter is called an approximation (LL), while those of high pass filter are called high frequency or detailed part (HH, LH, HL).
3. Haar Transform: This is the third and final imaging-related operation which ties to MRA.
The combination of pyramid coding, subband coding and Haar transform is called the Discrete Wavelet Transform.
Pixel
It is the smallest unit of information in an image. See chapters.
Raster
It is a Java 2-D image Data class. It represents a rectangular array of pixels and provides methods of representing data. A Raster has methods that directly return pixel data for the image data it contains.
RenderedImage
Java 2-D API introduces a notion of resolution independent image rendering by introduction of Renderable and Rendered Interfaces, allowing images to be pulled through a chain of filter operations, with image resolution selected through a rendering context.
Satellite
A satellite is an object that moves in a definite path around a planet. Satellites have enabled man to gather and study information of the earth‟s surface through the sensors mounted on them.
Sensor
A remote sensing sensor system records the electromagnetic radiation from the earth‟s surface through a specified window. This window allows only a particular wavelength of energy to pass through it. For example, radar is a sensing system from which the waves, propagating near the sensor, bounced on the earth‟s surface are recorded by it on their return.
Sets
A set is a collection of distinct objects. It can be defined as any collection M of definite, distinct objects m (which are called the “elements” of M). The elements or members of a set can be anything: numbers, people, letters of alphabet etc.
Set Theory is the branch of mathematics that studies sets. It begins with a binary relation between an object O and a set A. If O is a member of A, it is denoted as O € A. Since sets are objects, the membership relation can relate sets as well.

Sahil Narang 2011
112
Spatial Domain
Spatial Domain is known as the “Normal” image space. In this domain, changes in pixel positions correspond to changes in the scene and distances correspond to real distances.
In context with Image Processing, it directly process the input image pixel array.
II. ACRONYMS & ABBREVIATIONS
Full Form
BMP Bitmap
CBIR Content Based Image Retrieval
DWT Discrete Wavelet Transform
GLCM Gray Level Co-occurrence Matrix
GUI Graphical User Interface
IRS Indian Remote Sensing
JAI Java Advanced Imaging
JRE Java Runtime Environment
LISS Linear Image Self Scanning
MRA Multi-resolution Analysis
MSS Multi –spectral Scanner
ODBC Open Database Connectivity
Opt. Operation
QbE Query by Example
QbT Query by Text
RAM Random Access Memory
RDBMS Relational Database Management System
SD Standard Deviation
SDS Software Design Specification
SRS Software Requirement Specification
SQL Structured Query Language
TIFF Tagged Image File Format
WSD Weighted Standard Deviation

Sahil Narang 2011
113
Formulae Feature
Extraction
Technique
Descriptor Explanation Formula
Correlation Correlation It gives a
measure of
the
correlation
between two
images. This
measure is
not defined
if either SD
is 0.
∑ ∑ ( )
( )
√∑ ∑ ( ) ∑ ∑ (
)
Standard
Deviation
It gives the
variation of
the pixel
values from
the mean of
all pixel
values.
√( ( ))∑∑( )
Energy It gives a
measure of
the
information
content of a
image.
∑∑( )
Mean It is the
average of
all pixel
values in the
image.
( )∑∑
Here NxN is the size of image, N2 is the no. of pixels.
Pij, P1ij, P2ij represents the value of the pixel at position (i,j) of the corresponding images.
P1 and P2 represent the mean of pixel values of the corresponding images.
Gradient Mean It is the
average of
direction of
pixels taken
over the
number of
pixels in a
region
( )∑
Standard
Deviation
It gives the
variation of
the direction
of pixels in a
region.
√( ( ))∑( )

Sahil Narang 2011
114
Entropy It is the
measure of
the amount
of gradient
information
present
∑ ( ⁄ )
Here, N is the number of pixels in a region, θi is the direction of pixel, Pi is the probability of
occurrence of each direction angle of a bin
GLCM Contrast A measure
of intensity
contrast
between a
pixel and its
neighbor
over the
entire image
∑∑( )
Correlation A measure
of how
correlated a
pixel is to its
neighbor
over the
entire image.
This
measure is
not defined
if either SD
is 0.
∑∑( )( )
Energy A measure
of
uniformity
in the range
[0, 1].
∑∑( )
Homogeneity Measures
the spatial
closeness of
the
distribution
of elements
in co-
occurrence
matrix to the
diagonal
∑∑
Here, K is the number of rows/columns of image matrix Q, Pij is the probability that a pair of
points in Q will have values (zi, zj), mr and mc are the mean of rows and columns respectively,
σr and σc are the standard deviation of rows and columns respectively

Sahil Narang 2011
115
References I. BOOKS
[1] Rafael C. Gonzalez, Richard E. Woods, Digital Image Processing, 3rd ed.,
Pearson Education, 2008. [2] Walter G. Kropatsch, Horst Bischof, Digital Image Analysis, Springer, 2001. [3] Herbert Schildt, Java: The Complete Reference, 5th ed., Tata McGraw Hill, 2005. [4] Kogent Solutions Inc., Java 6 Programming Black Book, Dreamtech Press, 2008. [5] Roger S. Pressman,Software Engineering – A Practitioner’s Approach,5th ed,
Tata Mc-Graw Hill, 2001.
II. RESEARCH PAPERS
[1] Dr. Fuhui Long, Dr. Hongjiang Zhang and Prof. David Dagan Feng,
“Fundamentals of Content Based Image Retrieval”. [2] D.N. Verma, Vrinda Maru, Bharti, “An Efficient Approach for Color Image
Retrieval Using Haar Wavelet ,” International Conference on Methods and Models in Computer Science,2009
[3] Y.M. Latha, B.C. Jinaga and V.S.K. Reddy, “A Precise Content-based Color Image Retrieval: Lifting Scheme,”!CGST-GVIP Journal, ISSN:1687-398X, Volume 8, Issue 1, June2008.
[4] Giorgio Giacinto and Fabio Roli, Instance-Based Relevance Feedback for Image Retrieval, Department of Electrical and Electronic Engineering, University of Cagliari, Piazza D‟Armi, Cagliari-Italy, 09121.
[5] D N Verma, Bharti, Vrinda Maru: Comparison of Texture Based Image Retrieval Schemes, 2
nd National Conference on Recent Trends in Computer Engineering,
2009. [6] Kuo-an Wang, Hsuan-hung Lin, Po-chou Chan, Chuen-horng Lin, Shih-hsu
Chang, Yung-fu Chen : Implementation of an Image Retrieval System Using Wavelet Decomposition and Gradient Variation, WSEAS Transactions On Computers, Issue 6, Volume 7, 2008.
[7] Mehran Yazdi, Kazem Gheysari: A New Approach for Fingerprint Classification based on Gray-Level Co-occurrence Matrix, World Academy of Science, Engineering and Technology 47, 2008
[8] Priti Maheshwary, Namita Sricastava : Prototype System for Retrieval of Remote Sensing Images on Color Moment and Gray Level Co-occurrence Matrix, IJCSI International Journal of Computer Science Issues, Vol 3, 2009
[9] Lawrence D. Bergman, Vittorio Castelli, and Chung-Sheng Li, “Progressive Content-Based Retrieval from Satellite Image Archives”, D-Lib Magazine, ISSN 1082-9873, Oct. 1997.
[10] G. Dong, K. H. Boey, C. H. Yan, “Feature Discrimination in Large Scale Satellite Image Browsing and Retrieval”, 22
nd Asian Conference on Remote Sensing, 2001
[11] D.N.Verma, Neha Garg, Neha Mishra, Garima Dosi, Nimisha Garg, “Improved Texture Based Image Retrieval using Haar Wavelet Transform”
[12] P.S.Hiremath, S. Shivashankar, and Jagadeesh Pujari,”Wavelet Based Features for Color Texture Classification with Applicaion to CBIR”, IJCSNS, VOL.6 No.9A, September 2006
III. WEB LINKS
[1] (2002) The IEEE website. [Online]. Available: http://www.ieee.org/ [2] [Online]. Available: http://www.wikipedia.org [3] [Online]. Available: http://java.sun.com [4] [Online]. Available: http:// twiki .dsi. uniromal. it/ pub / Estrinfo / Materiile/. [5] [Online]. Available: http// www. ucgis. org/ oregon/ papers/ myint.htm. [6] [Online]. Available: http://citeseerx.ist.psu.edu/ [7] [Online]. Available: http://springeronline.com/

Sahil Narang 2011
116
IV. IMAGE DATABASE LINKS
[1] P. Brodatz, Textures: A photographic album for artists and designers. NewYork :
Dover, NY, 1996. [2] Color Image [Online]. Available: http://sipi.usc.edu/database/ [3] Color Image [Online]. Available: http://www.cs.cmu.edu/~cil/v-images.html [4] Satellite Image [Online]. Available: http://www.sovzond.net/image/. [5] Satellite Image [Online]. Available: http://www.infoterra.co.uk/data_media/. [6] Satellite Image [Online]. Available:
http://www.geoville.com/geodata/imagery/images. [7] Satellite Image [Online]. Available: http://www.fas.org/irp/imint/docs/rst/Sect6/. [8] Satellite Image [Online]. Available: http://www.satimagingcorp.com/gallery-
ikonos.html [9] VisTex Image Database: http://vismod.media.mit.edu/pub/VisTex/