development of cytoplasmic cd3+/t cell receptor-negative cells in the peripheral lymphoid tissues of...
TRANSCRIPT

Eur. J. Immunol. 1990. 20: 1345-1350 TcR 0 cells 1345
R. Pat Bucy., Chen-lo H. Chenm and Max D. Cooperomovn
Departments of Pathology., Microbiologym, Pediatricso and Medicine", University of Alabama at Birmingham and Howard Hughes Medical Instituten, Birmingham
Development of cytoplasmic CD3+/T cell receptor-negative cells in the peripheral lymphoid tissues of chickens*
In a study of Tcell ontogeny using monoclonal antibodies specific for chicken T cell receptors (TcR) and associated cell surface molecules, we found a subset of lymphocytes that express cytoplasmic CD3 epitopes in the absence of cell surface CD3KcR complexes. Approximately half of these cells,which were present in the spleen, bursa and intestine of young chick embryos, expressed surface CD8. None expressed CD4, TcRl (y/6), TcR2 (a@) or TcR3 (a third CD3-associated heterodimer in the chicken). These cytoplasmic CD3+CD8' cells, tentatively named TcRO cells to denote their lack of surfaceTcR, appeared first in the spleen of 8-day embryos, 4 days beforeTcRexpression begins in the thymus, and reached a peak frequency of = 10% of the splenic cell in 14-day embryos. The TcR 0 cells were also present in adult birds, where they comprised only about 1% of the CD3+ spleen cells and approximately 40% of the lymphocytes in the intestinal epithelium. We conclude that the avian TcRO cells represent a thymus- independent lineage of lymphocytes which, like natural killer cells in mammals, may play an important role in body defense.
1 Introduction
The hallmark of theTcell lineage is the CD3 complex [l-41. This set of polypeptides forms a tight, non-covalent complex with theTcR.The CD3 proteins themselves do not have sequence variability, while theTcR is a disulfide-linked heterodimer whose sequence variability determines the antigen specificity of the cell [5, 61. The CD3/TcR complex behaves as a functional unit with an apparent absolute requirement for each component for cell surface expression to occur [7].The CD3 proteins are thought to be involved in the transduction of activation signals initiated by anti- gen/MHC binding to theTcR [3,5,8]. Both the a@ (TcR2) and y/6 (TcR 1) isotypes are associated with surface CD3 [9-131. In addition, a third CD3-associated heterodimer termed TcR 3 has recently been identified in the chicken [14]. Each of the three avian TcR can be separately identified by isotype-specific mAb [15, 161. The TcR3 cells are related to TcR2 cells in pattern of thymic ontogeny, accessory molecule expression and tissue localization, although the distinctive TcR 2 and TcR 3 heterodimers are expressed by separate sublineages of Tcells [14]. All of the surface CD3+ cells in chickens are accounted for by cells expressing one of these three TcR molecules. Whether a mammalian homologue of TcR 3 exists is still specula- tive.
In a study of Tcell ontogeny in chickens using a series of murine mAb specific for the chicken TcR and associated molecules, we have identified a sizeable subset of lymphoid cells that contain cytoplasmic CD3 epitopes, but no surface
[I 81601
CD3/TcR complexes. A variable percentage of these cyto- plasmic CD3+ cells express cell surface CD8, but none express CD4. These cells appear first in the embryonic spleen on the 8th day of development, and then in the developing bursa and intestine well before the first surface CD3/TcR+ cells migrate to these tissues from the thy- mus.
2 Materials and methods
2.1 Animals
Fertile eggs of FP White Leghorn chickens were obtained from Hy-Line International (Dallas Center, 10 ) , and were hatched and raised in our facility. Development was initiated by incubating the eggs at 38 "C. The embryos were staged according to the number of incubation days.
2.2 mAb
mAb CT3, CT4, CT8 recognize the avian homologues of the mammalian CD3, CD4 and CD8 antigens, respectively [17, 181. TcR 1 recognizes a monomorphic determinant on the TcRy/6 as shown by its time of appearance during ontogeny, immunoprecipitation analysis, presence on CT3TT4-CT8- lymphocytes in the thymus and blood, and mutually exclusive expression with TcR 2 by two-color immunofluorescence analysis [ 151. TcR 2 recognizes the a@ heterodimer as shown by similar criteria [16], and was the kind gift of Drs. J Cihak and U. Losch. The TcR3 mAb recognizes a distinct CD3-associated heterodimer that appears after TcR 1 and TcR2 during ontogeny [14].
* Partially supported by grants CA 16673, CA 13148 and GM 42571.
Correspondence: R. Pat Bucy, Department of Pathology, Rm. 518 LHR, UAB Station, Birmingham, AL 35294, USA
Abbreviations: E8 Embryonic day 8 E l 2 Embryonic day 12 IEL: Intraepithelial lymphocytes
2.3 Immunoperoxidase tissue analysis
Freshly stained chicken tissues were snap frozen in liquid nitrogen and stored at -80°C until use. Sections (4 pm) were cut and immediately fixed on glass slides in 100% acetone for 5 min, followed by drying at -30 "C. Slides were
0 VCH Verlagsgesellschaft mbH, D-6940 Weinheim, 1990 001 4-2980/90/0606- 1345$02.50/0
1346 R. I? Bucy, C. H. Chen and M. D. Cooper Eur. J. Immunol. 1990. 20: 1345-1350
stained via the avidin-biotin peroxidase complex (ABC) immunoperoxidase procedure with diaminobenzidine as the chromogen, and counterstained with methyl green, as previously described [ 191. In some experiments, endo- genous peroxidase was partially inhibited by incubation of the section with 0.3% H202 in methanol for 30 min after the secondary antibody but before the ABC incubation.
2.4 Data analysis
Cell frequencies were determined in immunostained tissue sections by using a calibrated ocular grid. Briefly, the numbers of cells stained with peroxidase reaction product were counted in a standardized area for each histologic microenvironment in a series of adjacent sections stained with the different mAb. The numbers of nuclei counter- stained with methyl green were also enumerated in these same areas. Data for each embryonic age was obtained by counting stained sections from three or more individual chicken embryos. The numbers of positive cells in each organ for each mAb were calculated per mm2 of tissue and as a percentage of the total nucleated cells present. The numbers of TcRO cells were estimated by subtracting the percentage of cells which were TcR I+ , TcR2+ or TcR 3+ from those that were CT3+.
2.5 Immunofluorescence analysis
Viable cells were obtained from various tissues and stained with a combination of PE-conjugated CT3 mAb and biotin-conjugated CT4 and CT8, followed b y FITC-conju- gated streptavidin (Southern Biotechnology Associates, Birmingham, AL). The viable lymphocytes were then selectively analyzed on a FACScan (Becton Dickinson, Mountain View, CA) flow cytometer by establishing for- ward- and side-light scatter gates as previously described ~151.
2.6 Simultaneous staining of surface (s) and cytoplasmic (c) antigen
I n order to detect cells which express antigens only in the cytoplasm, suspensions of cells were stained as viable cells using unlabeled primary mAb followed by FITC-conju- gated anti-mouse IgG (Southern Biotechnology Asso- ciates). The cells were then centrifuged onto a glass slide, air-dried and fixed for 5 min in 100% acetone. These preparations were stained with a second unlabeled mAb and, after washing, TRITC-conjugated goat anti-mouse IgG (Southern Biotechnology Associates) was applied. Numbers of cells positive on the surface and in the cytoplasm were counted using a Leitz microscope (Wetzlar, FRG) equipped with epifluorescence optics.
2.7 Isolation of intraepithelial lymphocytes
To isolate the IEL, the distal small intestine of adult chickens was opened longitudinally, cleaned of the fetal contents and cut into 1-cm2 pieces. This tissue was incu- bated in calcium-free HBSS supplemented with 10 mM EDTA and 25 m M dithiothreitol with gentle agitation as
described [20]. The dislodged lymphocytes were isolated on a discontinuous Ficoll density gradient (Pharmacia, Uppsala, Sweden) and stained for immunofluorescence analysis as described above.
3 Results
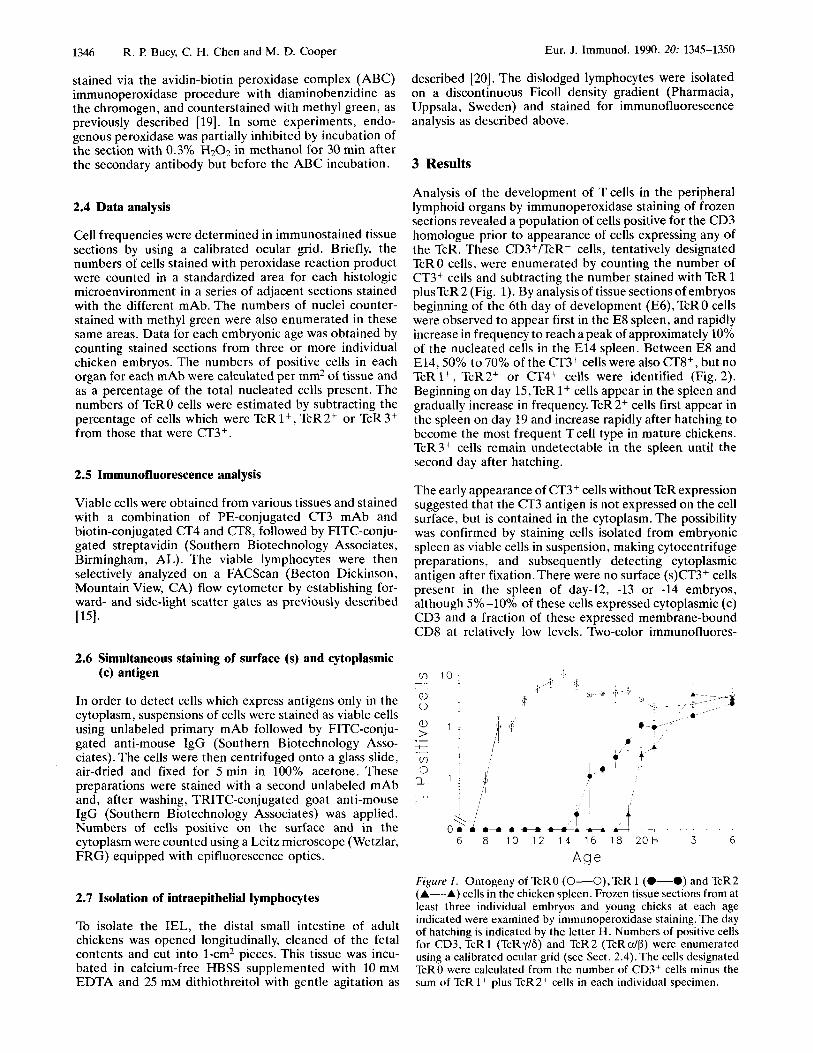
Analysis of the development of Tcells in the peripheral lymphoid organs by immunoperoxidase staining of frozen sections revealed a population of cells positive for the CD3 homologue prior to appearance of cells expressing any of the TcR. These CD3+/TcR- cells, tentatively designated TcR 0 cells, were enumerated by counting the number of CT3+ cells and subtracting the number stained with TcR 1 plusTcR 2 (Fig. 1). By analysis of tissue sections of embryos beginning of the 6th day of development (E6), TcRO cells were observed to appear first in the E8 spleen, and rapidly increase in frequency to reach a peak of approximately 10% of the nucleated cells in the E l4 spleen. Between E8 and E14,50% to 70% of the CT3+ cells were also CT8+, but no TcR I+, T C R ~ ~ or CT4+ cells were identified (Fig. 2). Beginning on day 15,TcR 1+ cells appear in the spleen and gradually increase in frequency. TcR 2+ cells first appear in the spleen on day 19 and increase rapidly after hatching to become the most frequent Tcell type in mature chickens. TcR3+ cells remain undetectable in the spleen until the second day after hatching.
The early appearance of CT3+ cells without TcR expression suggested that the CT3 antigen is not expressed on the cell surface, but is contained in the cytoplasm. The possibility was confirmed by staining cells isolated from embryonic spleen as viable cells in suspension, making cytocentrifuge preparations, and subsequently detecting cytoplasmic antigen after fixation. There were no surface (s)CT3+ cells present in the spleen of day-12, -13 or -14 embryos, although 5%-10% of these cells expressed cytoplasmic (c) CD3 and a fraction of these expressed membrane-bound CD8 at relatively low levels. Two-color immunofluores-
i. P ' , " i ( 1
- - , ' ' o t d a t t t- -- . 6 8 10 12 14 1 6 18 20H 3 6
A g e Figure 1. Ontogeny of TcRO (0-O),TcR 1 (0-0) and TcR2 (A-A) cells in the chicken spleen. Frozen tissue sections from at least three individual embryos and young chicks at each age indicated were examined by immunoperoxidase staining. The day of hatching is indicated by the letter H. Numbers of positive cells for CD3, TcR 1 (TcRy/6) and TcR2 (TcRdP) were enumerated using a calibrated ocular grid (see Sect. 2.4).The cells designated TcRO were calculated from the number of CD3+ cells minus the sum of TcR 1 + plus TcR 2+ cells in each individual specimen.
Eur. J. Immunol. 1990. 20: 1345-1350 TcR 0 cells 1347
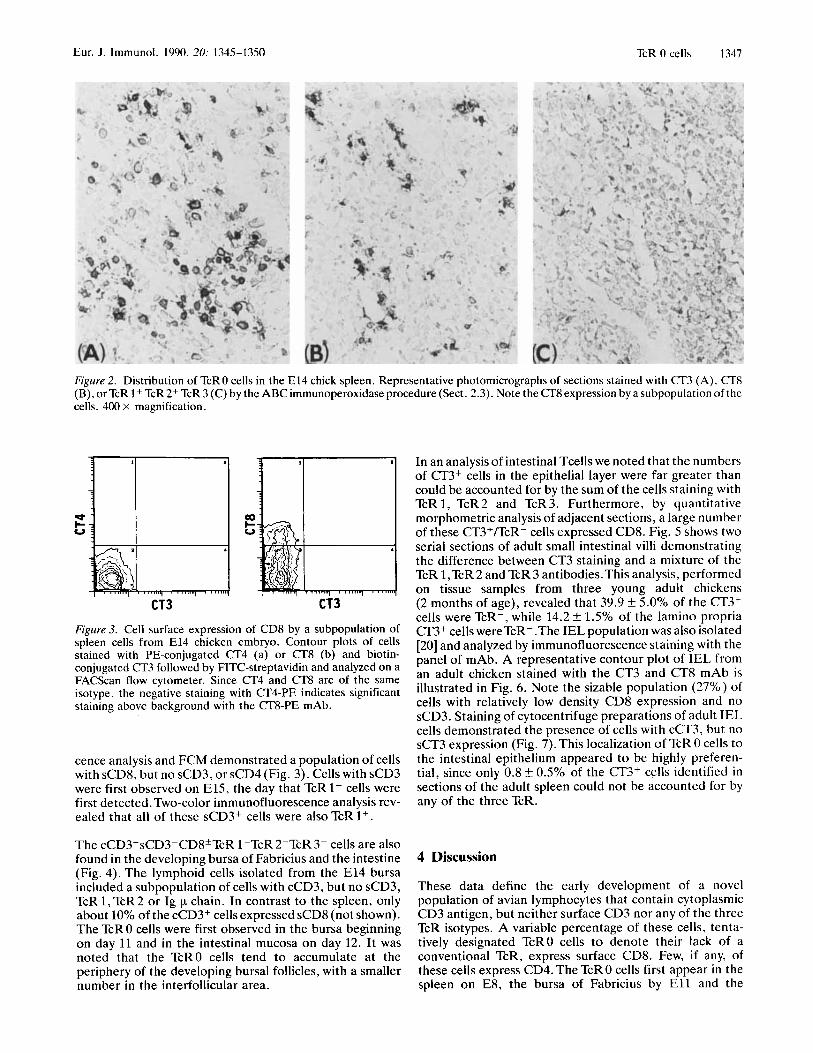
Figure 2 . Distribution of TcRO cells in the E l 4 chick spleen. Representative photomicrographs of sections stained with CT3 (A), CT8 (B), orTcR 1+ TcR2+ TcR 3 ( C ) by the ABC immunoperoxidase procedure (Sect. 2.3). Note the CT8 expression by a subpopulation of the cells. 400 x magnification.
e c V
CT3 ' cT3
Figure 3. Cell surface expression of CD8 by a subpopulation of spleen cells from E l 4 chicken embryo. Contour plots of cells stained with PE-conjugated CT4 (a) or CT8 (b) and biotin- conjugated CT3 followed by FITC-streptavidin and analyzed on a FACScan flow cytometer. Since CT4 and CT8 are of the same isotype, the negative staining with CT4-PE indicates significant staining above background with the CT8-PE mAb.
cence analysis and FCM demonstrated a population of cells with sCD8, but no sCD3, or sCD4 (Fig. 3). Cells with sCD3 were first observed on E15, the day that TcR1+ cells were first detected. Two-color immunofluorescence analysis rev- ealed that all of these sCD3+ cells were also TcR 1+.
The CCD~+SCD~-CD~*TCR 1-TcR 2-TcR3- cells are also found in the developing bursa of Fabricius and the intestine (Fig. 4). The lymphoid cells isolated from the El4 bursa included a subpopulation of cells with cCD3, but no sCD3, TcRl,TcR2 or Ig p chain. In contrast to the spleen, only about 10% of the cCD3+ cells expressed sCD8 (not shown). The TcR 0 cells were first observed in the bursa beginning on day 11 and in the intestinal mucosa on day 12. It was noted that the TcRO cells tend to accumulate at the periphery of the developing bursa1 follicles, with a smaller number in the interfollicular area.
In an analysis of intestinal Tcells we noted that the numbers of CT3+ cells in the epithelial layer were far greater than could be accounted for by the sum of the cells staining with TcR 1, TcR2 and TcR3. Furthermore, by quantitative morphometric analysis of adjacent sections, a large number of these CT3+/TcR- cells expressed CD8. Fig. 5 shows two serial sections of adult small intestinal villi demonstrating the difference between CT3 staining and a mixture of the TcR 1,TcR2 and TcR 3 antibodies.This analysis, performed on tissue samples from three young adult chickens (2 months of age), revealed that 39.9 f 5.0% of the CT3+ cells were TcR-, while 14.2 f 1.5% of the lamino propria CT3+ cells wereTcR-.The IEL population was also isolated [20] and analyzed by immunofluorescence staining with the panel of mAb. A representative contour plot of IEL from an adult chicken stained with the CT3 and CT8 mAb is illustrated in Fig. 6. Note the sizable population (27%) of cells with relatively low density CD8 expression and no sCD3. Staining of cytocentrifuge preparations of adult IEL cells demonstrated the presence of cells with cCT3, but no sCT3 expression (Fig. 7). This localization of TcR 0 cells to the intestinal epithelium appeared to be highly preferen- tial, since only 0.8 -t 0.5% of the CT3+ cells identified in sections of the adult spleen could not be accounted for by any of the three TcR.
4 Discussion
These data define the early development of a novel population of avian lymphocytes that contain cytoplasmic CD3 antigen, but neither surface CD3 nor any of the three TcR isotypes. A variable percentage of these cells, tenta- tively designated TcRO cells to denote their lack of a conventional TcR, express surface CD8. Few, if any, of these cells express CD4. The TcRO cells first appear in the spleen on E8, the bursa of Fabricius by El l and the

1348 R. F! Bucy, C. H. Chen and M. D. Cooper Eur. J. Immunol. 1990. 20: 1345-1350
Figure 4 . Distribution of TcRO cells in the El4 bursa (A, B, C) and intestine (D, E, F). Representative photomicrographs of frozen tissue sections stained with CT3 (A, D), CT8 (B, E). or TcR 1 + TcR 2+ TcR3 (C. F) by the ABC immunoperoxidase procedure (Sect. 2.3) on frozen sections. 400 x magnification.
intestinal mucosa on E12. This subpopulation of lymphoid cells thus begins its development in peripheral lymphoid tissues prior to the time at which the thymus begins to develop cells which express identifiable CD3 or TcR components.
One possible physiological role of theTcRO cells is that they represent thymocyte precursors or “prothymocytes”. The concept of a cytoplasmic CD3 + prothymocyte is suggested by data obtained in mammalian systems. In surveys of patients with Tcell acute lymphoblastic leukemia (T-ALL) the most immature phenotype is a cytoplasmic CD3+ cell which is also CD2+CD7+HLA-DRfTdT+ [21-241. Cells of this phenotype have also been observed in 8-10-week human embryos [25]. Although no direct data is available
from transfer studies in humans, it has been reasonably assumed that this is the phenotype of the prothymocyte, since cCD3+ cells are abundant early in thymic develop- ment and the other phenotypic categories of T-ALL cases nicely match the stages of thymic development [21-231. Prothymocytes have been identified by direct transfer assays in rodents [26, 271. The murine BM contains more prothymocytes than other organs, which an estimated frequency of between 0.01% to 0.08% [28-311. In these transfer assays, prothymocytes did not show surface expres- sion of CD4 or CD8 [31], but analysis of the expression of cytoplasmic antigens was not possible.
Although the early appearance of TcRO cells and their cytoplasmic expression of CD3 suggest that they could be
Eur. J. Immunol. 1990. 20: 1345-1350 TcR 0 cells 1349
prothymocytes, there are substantial arguments against this view. First, there is no evidence that prothymocytes can express the CD8 surface molecule, while 50% of TcR 0 cells may have this phenotype. Second, TcRO cells constitute approximately 10% of the E l4 splenocytes, while thymo- cyte precursors comprise < 0.1% of BM cells and are even more infrequent in the spleen [28-311. Third, TcRO cells comprise a substantial population of lymphocytes in adult birds, albeit with a highly restricted anatomical distribu- tion. Localization of TcRO cells in the intestinal epithelium is more suggestive of a role in local effector immune responses than as a repository of prothymocytes. Finally, studies of chicWquai1 chimeras, constructed by transplan- tation of embryonic chick spleen or bursa into embryonic quails, demonstrate that the TcRO cells are generated in these chick peripheral lymphoid tissues and migrate throughout the lymphoid tissues of the quail host [32]. In these chimeric animals, when the TcR 0 cells migrated from the spleen to the quail thymus, they settled in the thymic medulla and failed to express any of the TcR, CD4 or the thymocyte-specific antigen CT1. The development of the TcRO cells in the periphery coupled with the fact that these cells can recirculate to a receptive thymus and yet fail to undergo maturation along T cell lines indicates that they represent an independent lineage of lymphoid cells.
Although the TcRO lymphocytes fail to express any of the conventional TcR heterodimers, this lymphocyte subpopu- lation may represent a primitive effector system of cells with a distinct form of specific recognition capability, which may be conserved in mammals. Ciccone et al. [33] have identified a population of sCD3- cells in human blood that can proliferate in response to allogeneic lymphocytes and rIL2. Some isolates of these cells could specifically lyse the allogeneic target cells with which they were originally cultured, although they remained CD3- and had noTcR a , fi or 6 mRNA. Notably, these cell lines contained C D ~ E mRNA,which is the CD3 chain most frequently recognized by anti-CD3 mAb [34]. CD3 E mRNA, but not the protein product, has also been detected in isolated human NK cells stimulated with IL 2 [35]. More recently, both mRNA and significant amounts of CD3s protein [36] have been demonstrated in a panel of human NK clones maintained by IL 2 stimulation. These observations suggest that some of the CD3 signal transduction components may evolutionari- ly predate the CD3/TcR complex, and play a role in the lytic activity of these NK cells. Our data show that the TcRO cells, like mammalian NK cells, express components of the CD3 complex in the cytoplasm and often express surface CD8 activity in relatively low density.The NK lytic activity demonstated for chicken IEL [20] may be due to theTcRO cell, a possibility that is presently being examined. Prelim- inary success in culturing the TcRO cells promises to yield cells that can be used to determine the component(s) of the CD3 complex expressed and to assess their functional capabilities.
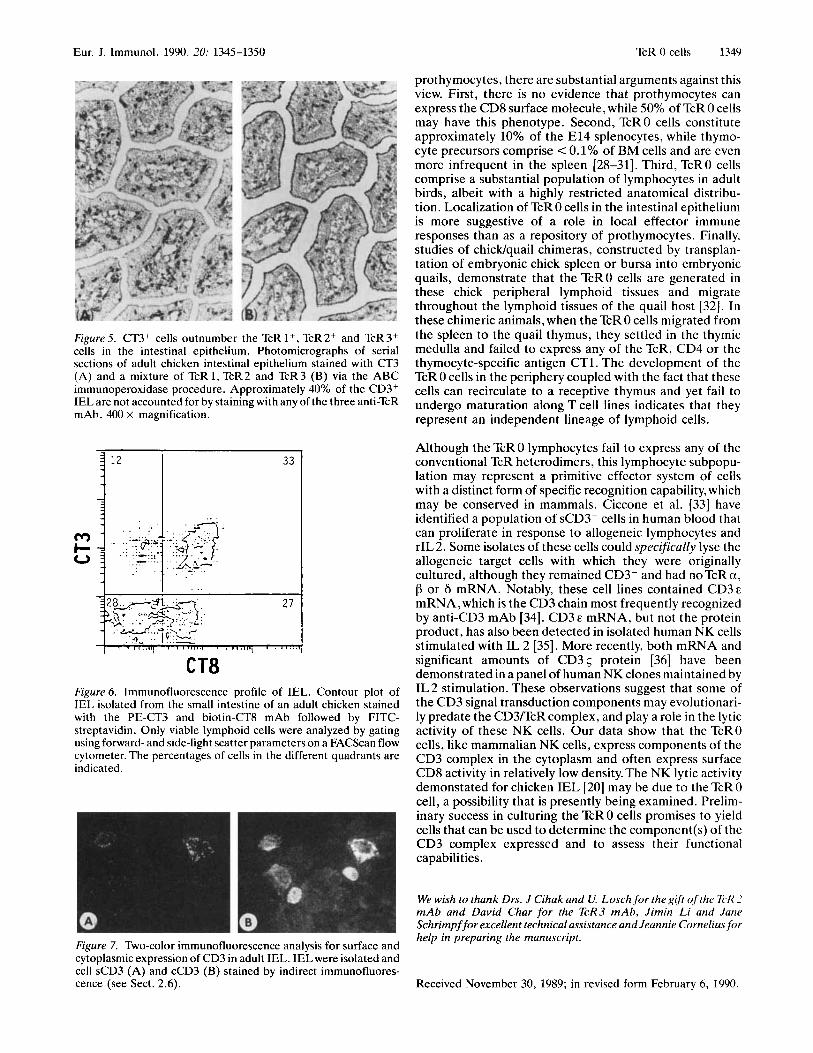
Figure 5. CT3+ cells outnumber the TcR 1+, TcR2+ and TcR3+ cells in the intestinal epithelium. Photomicrographs of serial sections of adult chicken intestinal epithelium stained with ( 3 ' 3 (A) and a mixture of TcR1, TcR2 and TcR3 (B) via the ABC immunoperoxidase procedure. Approximately 40% of the CD3+ IEL are not accounted for by staining with any of the three anti-TcR mAb. 400 X magnification.
33
CT8 Figure 6. Immunofluorescence profile of IEL. Contour plot of IEL isolated from the small intestine of an adult chicken stained with the PE-CT3 and biotin-CTS mAb followed by FITC- streptavidin. Only viable lymphoid cells were analyzed by gating using forward- and side-light scatter parameters on a FACScan flow cytometer. The percentages of cells in the different quadrants are indicated.
Figure 7. Two-color immunofluorescence analysis for surface and cytoplasmic expression of CD3 in adult IEL. IEL were isolated and cell sCD3 (A) and cCD3 (B) stained by indirect immunofluores- cence (see Sect. 2.6).
We wish to thank Drs. J Cihak and U. Losch for the gift of the 1i.K 2 mAb and David Char for the TcR3 mAh, Jimin Li and Jane Schrimpf for excellent technical assistance and Jeannie Cornelius for help in preparing the manuscript.
Received November 30, 1989; in revised form February 6, 1990.
1350
5 References
R. P Bucy, C. H. Chen and M. D. Cooper
1 Reinherz, E. L., Meuer, B. C., Fitzgerald, K. A., Hussey, R. E., Hodgdon, J. C., Acuto, 0. and Schlossman, S. F., Proc. Natl. Acad. Sci. USA 1983. 80: 4104.
2 Borst, J., Alexander, S., Elder, J. and Terhorst, C., J. Biol. Chem. 1983. 258: 5135.
3 Weiss, A., Imboden, J., Hardy, K., Manger, B.,Terhorst, C. and Stobo, J., Annu. Rev. Immunol. 1986. 4: 593.
4 Allison, J. P and Lanier, L. L., Annu. Rev. Immunol. 1987. 5: 503.
5 DembiC, Z., Haas, W. ,Weiss, S., McCubrey, J., Kiefer, H. ,Von Boehmer, H. and Steinmetz, M., Nature 1986. 320: 232.
6 Davis, M. M. and Bjorkman, P J., Nature 1988. 334: 395. 7 Weiss, A. and Stobo, J. D., J. Exp. Med. 1984. 160: 1284. 8 Weissman, A. M., Bonifacino, J. S., Klausner, R. D., Samel-
son, L. E. and OShea, J. J., Year Immunol. 1989. 4: 74. 9 Bank, I., DePinho, R. A., Brenner, M. B., Cassimeris, J., Alt,
F. W. and Chess, L.. Nature 1986. 322: 179. 10 Strominger, J. L., Science 1989. 244: 943. 11 Raulet, D. H., Annu. Rev. Immunol. 1989. 7: 175. 12 Moingeon, I?, Jitsukawa, S., Faure, F.,Troalen, F.,Triebel, F.,
Graziani, M., Forestier, F., Bellet, D.. Bohuon, C. and Hercend, T., Nature 1987. 325: 723.
13 Itohara, S., Nakanishi, N., Kanagawa, O., Kubo, R. and Tonegawa, S., Proc. Natl. Acad. Sci. USA 1989. 86: 5094.
14 Chen, C. H., Sowder, J.T., Lahti, J. M., Cihak, J., Losch, U. and Cooper, M. D., Proc. Natl. Acad. Sci. USA 1989. 86: 2352.
15 Sowder, J. T., Chen, C. H., Ager, L. L., Chan, M. M. and Cooper, M. D., J. Exp. Med. 1988. 167: 315.
16 Chen, C. H., Cihak, J., Losch, U. and Cooper, M. D., Eur. J. Immunol. 1988. 18: 539.
17 Chen, C. H., Ager, L. L., Gartland, G . L. and Cooper, M. D., J. Exp. Med. 1986. 164: 375.
18 Chan, M. M., Chen, C. H., Ager, L. L. and Cooper, M. D., J. Immunol. 1988. 140: 2133.
19 Bucy, R. P., Chen, C.H.. Cihak, J.. Losch, U. and Cooper, M. D., J. Immunol. 1988. 141: 2200.
Eur. J. Imrnunol. 1990. 20: 1345-1350
20 Chai, J.Y. and Lillehoj, H. S., Immunology 1988. 63: 111. 21 Reinherz, E. L., Kung, P. C., Goldstein, G., Levey, K. H. and
Schlossman, S. F., Proc. Natl. Acad. Sci. USA 1980. 77: 1588.
22 Campana, D., Thompson. J. S., Amlot, P., Brown, S. and Janossy, G., J. Immunol. 1987. 138: 648.
23 Von Dongen, J. J. M., Querterrnous,T., Bartam, C. R., Gold. D. P., Wolvers-Tettero, I. L. M., Comans-Bitter, W. M.. Hooijkaas, H., Adriaansen, J. H., De Klein, A., Raghavachar, A., Ganser, A., Duby, A. D., Seidman, J. G.,Van de Elsen, P and Terhorst, C., J. Immunol. 1987. 138: 1260.
24 Van Dongen, J. J. M., Krissansen, G. W.,Wolvers-Tettero, I. L. M., Comans-Bitter, W. M., Adriaansen, H. J., Hooijkaas, H., Van Wering, E . R. and Terhorst, C., Blood 1988. 71: 603.
25 Campana, D., Janossy, G., Couston-Smith, E., Amlot, P. L., Tian. W.-T., Ip, S. and Wong,L., J. Immunol. 1989. 142: 57.
26 Fowlkes. B. J., Edison, L., Mathieson, B. J. and Chused,T. M., J. Exp. Med. 1985. 162: 802.
27 Goldschneider, L., Komschlies, K. L. and Greiner. C. L., J. Exp. Med. 1986. 163: 1.
28 Katsura, Y., Kina, T., Amagai, T., Tsubata, T., Hirayoshi, K., Takaoki,Y., Sado, T. and Nishikawa, S. I., J. Immunol. 1986. 137: 2434.
29 Kadish, J. L. and Basch, R. S., J. Exp. Med. 1976. 143: 1082.
30 Boersma,W., Betel, I., Daculsi, R. and Van der Westen, G., Cell Tissue Kinet. 1981. 14: 179.
31 Lepault, F. and Weissman, I. L., Nature 1981. 293: 151. 32 Bucy, R. P., Coltey, M., Chen, C. H. , Char, D., Le Douarin, N.
M. and Cooper, M. D., Eur. J. Imrnunol. 1989. 19: 1449. 33 Ciccone, E.,Viale, O., Pende, D., Malnati, M., Biassoni, R.,
Melioli, G., Moretta, A., Long, E. 0. and Moretta, L., J. Exp. Med. 1988. 168: 2403.
34 Transy, C., Moingeon, P. E., Marshall, B., Stebbins, C. and Reinherz, E. L., Eur. J. Immunol. 1989. 19: 947.
35 Biassoni, R., Ferrini, S., Prigione, I., Moretta, A. and Long, E. O., J. Immunol. 1988. 140: 1685.
36 Anderson, P., Caligiuri, M., Ritz, J. and Schlossman, S. F., Nature 1989. 341: 159.