development of cubesat vibration testing capabilities for...
TRANSCRIPT
DEVELOPMENT OF CUBESAT VIBRATION
TESTING CAPABILITIES FOR THE
NAVAL POSTGRADUATE SCHOOL
& CAL POLY SAN LUIS OBISPO
A Thesis presented to
the Faculty of the College of Engineering
California Polytechnic State University, San Luis Obispo
In Partial Fulfillment of the Requirements for the Degree
Master of Science in Aerospace Engineering
by
Marissa Louise Brummitt
December 9, 2010

ii
© 2010
Marissa L Brummitt
ALL RIGHTS RESERVED
iii
APPROVAL AND COMMITTEE MEMBERSHIP
TITLE: DEVELOPMENT OF CUBESAT VIBRATION TESTING
CAPABILITIES AT THE NAVAL POSTGRADUATE
SCHOOL AND CAL POLY SAN LUIS OBISPO
AUTHOR: MARISSA L. BRUMMITT
DATE SUBMITTED: DECEMBER 9, 2010
COMMITTEE CHAIR: Dr. Jordi Puig-Suari, Professor
COMMITTEE MEMBER: Dr. James Newman, Professor
COMMITTEE MEMBER: Dr. Kira Abercromby, Professor
COMMITTEE MEMBER: Mr. Dave Esposto, Lecturer

iv
ABSTRACT
DEVELOPMENT OF CUBESAT VIBRATION TESTING CAPABILITIES
AT THE NAVAL POSTGRADUATE SCHOOL
AND CAL POLY SAN LUIS OBISPO
MARISSA LOUISE BRUMMITT
The Naval Postgraduate School is currently developing their first CubeSat, the Solar Cell
Array Tester CubeSat, or NPS-SCAT. Launching a CubeSat, such as NPS-SCAT,
requires environmental testing to ensure not only the success of the mission, but also the
safety of other CubeSats housed in the same deployer. This thesis will address the
development of CubeSat vibration testing methodology at NPS, including subsystem
testing, engineering unit qualification, and flight unit testing. In addition, the new Cal
Poly CubeSat Test POD Mk III will be introduced and evaluated based upon comparison
with the Poly Picosatellite Orbital Deployer (P-POD). Using examples from the
development of NPS-SCAT and test data from Cal Poly‟s Test POD Mk III and P-POD,
the current CubeSat testing methodology will be verified and an improved method for
NPS CubeSat subsystem testing will be presented.
Keywords: CubeSat, Vibration Testing, NPS-SCAT, P-POD, Test POD Mk III.

v
ACKNOWLEDGMENTS
First and foremost, thank you Mom and Dad; you have always been unfailing in your
support of my education and growth. I try to say thank you as often as possible, but it
never seems like enough.
Sam, Mary Grace, and Mike, you always put a smile on my face and remind me to keep a
balance of work and fun - keep it up!
The statement “it takes a village” is so true in regards to this thesis. Without the support
of the Cal Poly CubeSat project and the NPS-SCAT team this would not have been
possible.
Dr. P and the CubeSat Program – In spring of 2005, I met Dr. P at the Cal Poly Open
House. He convinced me Cal Poly was the place to be for aerospace engineering and I‟ve
never looked back. As part of the CubeSat team, from freshman year to finishing my
master‟s thesis, there has always been something new and exciting on the horizon.
CubeSat continually reminded me why I wanted to join the aerospace industry. Thank
you Ryan, Justin, Riki, Roland, Alicia, Mike Barnes, and Mike Bryant for the continued
support not only on this thesis, but in many other CubeSat and Cal Poly endeavors as
well.
Dr. Newman and NPS-SCAT Team – Thank you for making NPS feel like a second
home, I will always appreciate the “risk tolerant” environment that was fostered in the
SSAG SSL and the numerous friends and mentors I was lucky enough to work with for
two summers. Rod, Kerry, Kevin, Justin, Shane, Vidur and Maddie, each one of you was
important to this project and to me. Thank you also to David Rigmaiden and Dan Sakoda
for helping make all my crazy testing ideas a reality.
Dave Esposto and Dr. Abercromby – Thanks for signing on to this committee, I‟m not
sure you knew what you were getting in to! Your time, knowledge and patience are very
much appreciated.
Dr. Jameson – I learned a lot developing the vibration lab for your class and I can‟t say
thank you enough for letting me borrow your husky pups, there really isn‟t any better
stress relief!
Last, but not least, the friends who are always there for me. Nikki, Mike, Marisa, Allen,
Dan and Kent, you guys mean the world to me!

vi
TABLE OF CONTENTS
LIST OF TABLES ................................................................................................... VIII
LIST OF FIGURES ...................................................................................................... X
ABBREVIATIONS AND ACRONYMS ................................................................. XIII
INTRODUCTION .........................................................................................................1
1.1 CUBESAT BASICS ................................................................................................1
1.2 EXPANDING CUBESAT CAPABILITIES ...................................................................3
1.3 CUBESAT TESTING CHALLENGES .........................................................................4
2 BACKGROUND .....................................................................................................6
2.1 NAVAL POSTGRADUATE SCHOOL SOLAR CELL ARRAY TESTER CUBESAT .............6
2.1.1 Mission and Subsystems ...............................................................................7
2.1.2 CONOPS .................................................................................................... 10
2.1.3.1 Launch Vehicle ....................................................................................... 11
2.1.4 Engineering Development Unit ................................................................... 12
2.1.4 Environmental Testing................................................................................ 13
2.1.4.1 Derived Test Requirements ...................................................................... 13
2.1.3.3 NPS Vibration Testing Facility ................................................................ 17
2.1.5 Flight Unit ................................................................................................. 18
2.1.5 Future NPS Satellite Development .............................................................. 19
2.2 CAL POLY TEST POD MK III AND P-POD MK III ............................................... 20
2.2.1 Cal Poly Test POD Mk III .......................................................................... 20
2.2.2 Cal Poly P-POD Mk III .............................................................................. 23
3 NPS-SCAT SUBSYSTEM VIBRATION TESTING ........................................... 24
3.1 TEST DEVELOPMENT ......................................................................................... 24
3.1.1 Subsystem Testing Interface Plate .............................................................. 24
3.1.2 Test Configuration and Levels .................................................................... 26
3.2 SUBSYSTEM TEST RESULTS ................................................................................ 30
3.2.1 Blank PCB Response .................................................................................. 30
3.2.2 SMS Board Response .................................................................................. 31
3.2.3 Subsystem Testing Evaluation..................................................................... 34
3.3 IMPROVED SUBSYSTEM TESTING ........................................................................ 35
3.3.1 Mock Satellite Configuration and Test Level ................................................... 36
3.3.2 Mock Sat Results ....................................................................................... 38
3.3.2 Evaluation of Subsystem Testing ................................................................. 43
3.3.3 Modified Subsystem Testing........................................................................ 44
3.3.4 Subsystem Testing Recommendations ......................................................... 50

vii
4 NPS-SCAT QUALIFICATION AND FLIGHT TESTING ................................. 53
4.1 NPS-SCAT ENGINEERING DEVELOPMENT UNIT (EDU) ..................................... 53
4.1.1 Qualification Testing .................................................................................. 53
4.2 FLIGHT UNIT TESTING ....................................................................................... 58
4.3.1 Recommended Satellite Configuration and Test Levels ............................... 59
5 CUBESAT VIBRATION RESPONSE TESTING ............................................... 60
5.1 TEST POD MK. III CUBESAT RESPONSE TESTING ............................................... 60
5.1.1 Test Configuration and Levels ........................................................................ 60
5.1.2 Results ........................................................................................................ 64
5.2 P-POD MK III CUBESAT RESPONSE TESTING ..................................................... 71
5.2.1 Test Configuration and Levels ........................................................................ 71
5.2.2 Results ............................................................................................................ 73
4.2.4 Comparison with Previous P-POD Testing ..................................................... 79
5.3 CUBESAT RESPONSE COMPARISON .................................................................... 80
6 CONCLUSIONS AND FUTURE WORK ............................................................ 88
6.1 CONCLUSIONS ................................................................................................... 88
6.1.1 Subsystem Testing & Satellite Qualification ............................................... 88
6.1.3 CubeSat Response Testing in the Test POD Mk III and P-POD Mk III ....... 88
6.2 FUTURE WORK .................................................................................................. 89
6.2.1 NPS-SCAT Beacon Board and Flight Unit Testing ..................................... 89
6.2.2 Accelerometer Board Development ............................................................ 90
6.2.3 Test POD .................................................................................................... 90
LIST OF REFERENCES ............................................................................................ 91
APPENDIX A: CUBESAT STANDARD .................................................................... 93
APPENDIX B: AMPLIFICATION FACTOR CALCULATION ............................. 94
APPENDIX C: SUBSYSTEM TEST RESULTS ....................................................... 95
viii
LIST OF TABLES
Table 1 NPS-SCAT Key Performance Parameters ...........................................................8
Table 2: Falcon 1 Random Vibration Environment ........................................................ 12
Table 3: NASA GEVS Qualification and Acceptance .................................................... 15
Table 4: NASA GEVS Component Workmanship ......................................................... 16
Table 5: NASA GEVS Component Minimum Workmanship Random ........................... 29
Table 6: Blank Board Z-Axis Response for Each Shake Axis ........................................ 31
Table 7: SMS Z-Axis Response for each Shake Axis ..................................................... 33
Table 8: Subsystem Amplification Factors ..................................................................... 35
Table 9: Summary of Z-Axis Sun Sensor Responses ...................................................... 39
Table 10: Summary of Y-Axis Vibration Test Sun Sensor responses ............................. 40
Table 11: Summary of X-Axis Vibration Test Sun Sensor Responses ............................ 41
Table 12: Z-Axis Amplification Factor Summary .......................................................... 42
Table 13: 12 DB Below GEVS Qualification ................................................................. 44
Table 14: 6 dB below GEVS Workmanship ................................................................... 45
Table 15: Original Configuration; Amplification Factors, Frequencies and Responses ... 48
Table 16: Single board with Standoffs; Amplification Factors, Frequencies and
Responses ...................................................................................................................... 49
Table 17: Two Board Stack on Standoffs, Amplification Factors, Frequencies and
Responses ...................................................................................................................... 50
Table 18: 9 dB Below NASA GEVS Qualification ........................................................ 51
Table 19: Z-Axis Test POD Mk III Results .................................................................... 66

ix
Table 20: Y-Axis Test POD MK III Results................................................................... 68
Table 21: X-Axis Test POD Mk III Results ................................................................... 70
Table 22: CubeSat Response Comparison, Mass Model #001 ........................................ 80

x
LIST OF FIGURES
Figure 1: Cal Poly‟s CP6 CubeSat ...................................................................................1
Figure 2: Cal Poly P-POD Mk III ....................................................................................2
Figure 3: Naval Postgraduate School Solar Cell Array Tester ..........................................7
Figure 4: NPS-SCAT Team, Summer 2010 .....................................................................7
Figure 5: NPS-SCAT Coordinate System ........................................................................9
Figure 6: NPS-SCAT Solar Measurement System............................................................9
Figure 7: Liftoff of Falcon 1, Razaksat Mission ............................................................. 11
Figure 8: Falcon 1 Fairing.............................................................................................. 11
Figure 9: NASA GEVS and Falcon 1e Random Vibration Profile .................................. 15
Figure 10: NPS Vibration Test facilities, LING Shaker .................................................. 18
Figure 11: Original Cal Poly Test POD .......................................................................... 21
Figure 12: Test POD Mk III Pre and Post Integration ..................................................... 22
Figure 13: NPS-SCAT Vibration Interface Plate ............................................................ 26
Figure 14: Blank Board Vibration Configuration ........................................................... 27
Figure 15: SMS Configuration, X and Y Axes ............................................................... 28
Figure 16: SMS Configuration, X and Y Axes ............................................................... 28
Figure 17: NASA GEVS Random Vibration Levels and Falcon 1 Vibration
Environement ................................................................................................................ 29
Figure 18: Blank Board Z-Axis Response Plot, NASA GEVS Workmanship ................. 30
Figure 19: SMS Z-Axis Pre-Test Sine Sweep Response ................................................. 32
Figure 20: SMS Z-Axis Post-SINE Sweep Response ..................................................... 33
xi
Figure 21: SMS Board, NPS-SCAT Bus, and Test Harness............................................ 34
Figure 22: Side View, NPS-SCAT SMS Version 1, Mock Sat Accelerometer
Placement ...................................................................................................................... 36
Figure 23: Mock Sat Internal Accelerometer Placement ................................................. 37
Figure 24: Cal Poly Test Pod attached to NPS vibration Table ....................................... 37
Figure 25: Mock Sat Z-Axis Sun Sensor Response ........................................................ 39
Figure 26: Y-Axis Vibration Test Sun Sensor Response ................................................ 40
Figure 27: X-Axis Vibration Test Sun Sensor Response ................................................ 41
Figure 28: Post Testing Broken Capacitor ...................................................................... 43
Figure 29: Loose Nut and Staking Compound ................................................................ 43
Figure 30: Re-Test of Original Subsystem Configuration ............................................... 46
Figure 31: Subsystem Board on Standoffs...................................................................... 46
Figure 32: Subsystem Configuration, Two Board Stack on Standoffs ............................ 47
Figure 33: Original subsystem Configuration, Z-Axis responses .................................... 48
Figure 34: Single Board with Standoffs, Z-Axis Responses ........................................... 49
Figure 35: Two Board Stack on Standoffs Configuration, Z-Axis Responses ................. 50
Figure 36: NPS-SCAT EDU in Test POD ...................................................................... 54
Figure 37: NPS-SCAT EDU on Shake Table ................................................................. 55
Figure 38: Z-Axis Test POD Response During EDU Testing ......................................... 56
Figure 39: Y-Axis Test POD Response During EDU Testing......................................... 56
Figure 40: X-Axis Test POD Response During EDU Testing......................................... 57
Figure 41: Cal Poly Test POD Mk III ............................................................................ 61
Figure 42: CubeSat Mass Model and Example Accelerometer Placement ...................... 62

xii
Figure 43: Test POD Mk III on Vibration Interface Plate ............................................... 63
Figure 44: Z-Axis TEst Pod Mk III GEVS Qualification Mass Model Response ............ 65
Figure 45: Z-Axis Test POD Mk III Sine Sweep Mass Model Response ........................ 66
Figure 46: Y-Axis Test POD Mk III GEVS Qualification Mass Model Response .......... 67
Figure 47: Y-Axis Test POD MK III Sine Sweep Mass Model Response ....................... 68
Figure 48: X-Axis Test POD Mk III GEVS Qualification Mass Model Response .......... 69
Figure 49: X-Axis Test POD MK III Sine Sweep Mass Model Response ....................... 70
Figure 50: Cal Poly P-POD and Mass Models During Integration .................................. 72
Figure 51: P-POD Testing Configuration ....................................................................... 73
Figure 52: Z-Axis P-POD Mass Model Response .......................................................... 74
Figure 53: Z-Axis Post-Test Sine Sweep ........................................................................ 75
Figure 54: Y-Axis P-POD Mass Model Responses ........................................................ 76
Figure 55: Y-Axis Post-Test Sine Sweep ....................................................................... 77
Figure 56: X-Axis P-POD Mass Model Responses ........................................................ 78
Figure 57: X-Axis Post Test Sine Sweep........................................................................ 79
Figure 58: X-Axis Mass Model Response Comparison .................................................. 81
Figure 59: X-Axis P-POD and Test POD Transfer Function .......................................... 82
Figure 60: Y-AXIS Mass Model Response Comparison ................................................ 83
Figure 61: Y-AXIS P-POD And Test POD Transfer Function ....................................... 84
Figure 62: Z-AXIS Mass Model Response Comparison ................................................. 85
Figure 63: Z-AXIS P-POD And Test POD Transfer Function ........................................ 86
xiii
ABBREVIATIONS AND ACRONYMS
C&DH Command and Data Handling
CFT Comprehensive Functional Test
CONOPS Concept of Operations
COTS Commercial-Off-the-Shelf
CP Cal Poly
CPT Comprehensive Performance Test
EDU Engineering Development Unit
EPS Electrical Power Subsystem
ESP Experimental Solar Panel
GEVS General Environmental Verification Specification
IC Integrating Contractor
LEO Low Earth Orbit
NASA National Aeronautics and Space Administration
NET No earlier than
NLAS NanoSat Launch Adapter System
NPS Naval Postgraduate School
NPS-SCAT Naval Postgraduate School Solar Cell Array Tester
NRO National Reconnaissance Office
ORS Operationally Responsive Space
PCB Printed Circuit Board
P-POD Poly-Picosatellite Orbital Deployer

xiv
SCAT Solar Cell Array Tester
SMS Solar Measurement System
SpaceX Space Exploration Technologies Corporation
SSAG Space Systems Academic Group
STP Space Test Program
TT&C Telemetry, Tracking & Command
TVAC Thermal Vacuum
USN United States Navy

1
INTRODUCTION
1.1 CUBESAT BASICS
The CubeSat standard has now exceeded ten years of use in the small satellite and
university communities. What started as a university-focused satellite development
program has grown into an industry-wide phenomenon and global standard. At this point,
CubeSats have been launched from all around the world, not only by universities, but also
by high school students, government projects, and commercial aerospace companies.
The current CubeSat standard stipulates a single unit (1U) CubeSat is 10 cm in
length, width and height and has mass no greater than 1.33 kg1. Two Unit (2U) and three
unit (3U) spacecraft are also compatible with the standard. An example 1U spacecraft is
Cal Poly‟s CP6 CubeSat, shown in Figure 1. The CubeSat standard is controlled by the
CubeSat team at California Polytechnic State University (hereafter referred to as Cal
Poly) where the co-creator of the standard, Dr. Jordi Puig-Suari oversees the CubeSat
program. A drawing of the CubeSat standard is available in Appendix A.
FIGURE 1: CAL POLY’S CP6 CUBESAT2

2
Multiple CubeSat deployers are available. The original is the Poly Picosatellite
Orbital Deployer (P-POD) designed by Cal Poly. The P-POD is capable of holding three
1U satellites, a 1U and 2U, or a 3U. The third version of the P-POD, designated the Mk
III, can be seen in Figure 2.
FIGURE 2: CAL POLY P-POD MK III3
With the growth in the standard, from 1 kg to 1.3 kg, the question has changed
from “what even fits in a CubeSat?” to “what can’t you fit in a CubeSat?” Companies see
the opportunity to qualify space hardware, test risky architecture options, and fly single
sensors without the need for a larger mission to purchase a launch. Professors,
meanwhile, envision more capable payloads for students to operate after participating in
the design, test, and launch of that same satellite – all before graduating from college. As
more launch opportunities become available, greater possibilities will be demonstrated
and higher levels of technology will find their way into space long before larger satellite
programs will risk flying them.

3
1.2 EXPANDING CUBESAT CAPABILITIES
The maturity of the CubeSat standard is now reflected in the long list of satellites
launched and the contributions those satellites have made to the aerospace and scientific
communities. In their paper, “An Overview of Small Satellites in Remote Sensing,”
authors Kramer and Cracknell recognize that despite the limited objectives each CubeSat
may have, the advantage of a picosatellite platform is the “very low cost and the speed of
designing/building a satellite practically from off-the-shelf components.”4 A CubeSat that
is launched with a limited objective still completes more valuable research than a larger
satellite that never reaches orbit due to cost and schedule overruns.
Experiments that were formerly only possible in large spacecraft are now being
accomplished by CubeSats. At NASA Ames Research Center, a fully capable biological
research experiment took the form of a 3U CubeSat called GeneSat-1. One of the
satellite‟s objectives and a main function of the payload was to “quantitatively detect
levels of GFP expressed in living cultures (E. coli) as a means of evaluating technologies
targeted at assessing human exploration risks.”5 The operation of GeneSat, after
launching on December 16th
, 2006, demonstrated that valuable science could be
accomplished with a 3.5 kg satellite. As the CubeSat standard became more widely
known, the National Science Foundation (NSF) recognized the future role of
picosatellites in the study of space weather. In a recent launch on November 19th, 2010,
the first NSF-sponsored CubeSat, the Radio Aurora Explorer (RAX), was launched from
Kodiak, Alaska. The CubeSat will study large plasma formations in the ionosphere that
can cause communication interruptions between orbiting spacecraft and earth.6

4
One further example of the vast capabilities of the tiny CubeSat form factor, is the
NASA Nanosail-D 3U CubeSat managed by Marshal Space Flight Center. The satellite‟s
mission is to demonstrate the use of a solar sail, as well as the ability to safely store and
deploy the 100 ft2 sail. As of December 6
th, 2010, the satellite has been successfully
launched, but has not yet deployed the solar sail.7
With advancing capabilities in such a small form factor comes new challenges,
not only for the engineers involved in the design and development of the satellite, but for
the testing teams as well.
1.3 CUBESAT TESTING CHALLENGES
The growth and evolution of small satellite design has instigated an evolution in testing
as well. To fly in the P-POD, CubeSat developers are required to meet specific vibration
and thermal testing requirements for their integrated satellite, however, there are no pre-
requisites for subsystem or unit testing1. These environmental testing requirements are
designed to ensure the safety of the launch vehicle and the safety of the other satellites
within the deployer without placing unnecessary constraints on the developer. With more
advanced payloads however, CubeSats have now stepped into an arena where subsystem
testing is often a necessity prior to integrated testing.
Even without the complications of subsystem testing, CubeSats face a number of
testing challenges that are unique to picosatellites. Aerospace testing is not only time
consuming, but also expensive, and the balance of these two factors is at the root of most
CubeSat testing considerations.
First, the various standards and test plans that are followed by NASA and other
large aerospace companies are tailored for large satellite programs with an emphasis on

5
mitigating risk, while often times sacrificing cost and schedule. Blindly following testing
standards meant for much larger spacecraft can severely hinder a CubeSat program by
requiring extra tests or reviews that do not allow systems to progress in parallel. This
applies to university and industry programs alike because it is often easier to follow
protocols that are already set forth by previous projects, or refer to standard documents
that are based upon testing space hardware rather than commercial off-the-shelf (COTS)
products which can be replaced quickly and cheaply.
Another consideration for developers, is that the P-POD does not always have a
desirable mounting placement on a rocket. This can impact both the shock and vibration
environment as well as the thermal profile the satellite will experience on launch.
Additionally, CubeSat development schedules are compressed and budgets are
limited, therefore testing is subjected to these same unique constraints. The MAST
CubeSat, designed by Tethers Unlimited, is one example of this challenge. After the
tether did not fully deploy on-orbit, the team outlined the earlier tradeoff they faced when
they “had to choose between the options of redesigning and rebuilding the experiment
hardware, and then not having sufficient funds to launch the experiement, or flying what
we had and seeing if it would work.”8 Such a decision highlights the obstacles often faced
by small satellite teams.
A launch will never wait for a CubeSat, so it is up to each team to determine the
amount of testing involved in the development and qualification of the satellite to ensure
delivery at the correct time. Depending on the testing facilities available, another
consideration is the cost of outsourcing the testing or travelling to Cal Poly for
qualification.
6
University CubeSat programs have the additional challenge of high personnel
turnover due to student graduations. Evaluating the trade-offs between time-consuming
documentation and teaching new students through experience is a unique choice for every
cube sat program. Based on these principles. a university will manage their student team
in a way that optimizes the learning experience and satellite development process.
In contrast, the benefit of working on a CubeSat project is a higher tolerance for
risk. Even prior to the CubeSat standard and the influx of university satellite programs,
Michael Swartwout, of Standford University, pointed out that “Students have the „luxury‟
to fail, something that most in professional space industry must avoid.”9 Most universities
accept risk as part of the learning process, while companies are able to justify it solely on
the basis of cost. For either part of the community, COTS components are a fraction of
the cost of space-rated components, which also decreases cost and risk during
development phases.
2 BACKGROUND
2.1 NAVAL POSTGRADUATE SCHOOL SOLAR CELL ARRAY TESTER
CUBESAT
The Naval Postgraduate School (NPS) Space Systems Academic Group (SSAG) is
currently building and testing the school‟s first CubeSat. The Solar Cell Array Tester
CubeSat, or NPS-SCAT, will test solar cells on-orbit to record their degradation. The
figure below shows the integrated satellite and the experimental solar cells that surround
the payload sun sensor.

7
FIGURE 3: NAVAL POSTGRADUATE SCHOOL SOLAR CELL ARRAY TESTER
In addition to the design, build and test of NPS-SCAT, the CubeSat program also
places a high level of emphasis on another goal – the education of Naval Officers and
other students at NPS. The summer 2010 NPS-SCAT team is shown below.
FIGURE 4: NPS-SCAT TEAM, SUMMER 2010
2.1.1 MISSION AND SUBSYSTEMS
The requirements for NPS-SCAT CubeSat are written as a set of Key Performance
Parameters (KPPs)10
. The KPPs are presented in Table 1.

8
TABLE 1 NPS-SCAT KEY PERFORMANCE PARAMETERS
# NPS-SCAT Key Performance Parameter
1
The satellite development program shall provide NPS students with an education
in the satellite design process, integration, testing, and full life cycle of a space
flight system.
2 The satellite shall utilize a 1U Pumpkin© CubeSat architecture.
3
The solar measurement system shall be capable of obtaining solar cell I-V data
curve to include solar cell current, voltage, temperature and sun angle no less
than once per orbit.
4
The satellite shall be able to communicate TT&C and Payload data to the NPS
ground station using an S-band radio (primary transmitter) and/or UHF beacon
(secondary transmitter).
5 The satellite shall transmit TT&C and Payload data continuously via the UHF
beacon and transmit when commanded via the S-band radio.
6 The satellite shall be capable of being launched via a CubeSat deployer on a
Falcon 1e launch vehicle.
7 The satellite shall operate continuously in orbit upon launch and have a mission
duration of approximately 100 days to 1 year
8 The system shall utilize Commercial Off the Shelf (COTS) hardware whenever
possible
9
The satellite development program shall establish the CubeSat program at NPS by
creating a CubeSat working group, small satellite process and procedure
development, and establishing an engineering support structure.
To meet these requirements NPS-SCAT utilizes a combination of subsystems
both designed in-house and purchased CubeSat subsystems that are compatible with the
Pumpkin CubeSat structure.
The satellite bus consists of the Pumpkin FM430 Flight Computer, the MHX
2400 Radio, the ClydeSpace Electrical Power System (EPS), and the Cal Poly Beacon
Board. A model of NPS-SCAT is shown for reference in Figure 5.

9
FIGURE 5: NPS-SCAT COORDINATE SYSTEM
The payload for NPS-SCAT is the Solar Measurement System (SMS) and the
Experimental Solar Panel (ESP). The SMS printed circuit board is the structural
component for mounting the Sinclair Sun Sensor and controls all payload measurements.
These includes measurements taken from the four different experimental solar cells
mounted on the ESP, which is on the +Z axis of the CubeSat and has a hole to
accommodate the Sinclair Sun Sensor. Figure 6 shows the SMS and coordinate system
for the payload board.
FIGURE 6: NPS-SCAT SOLAR MEASUREMENT SYSTEM (SMS)
10
2.1.2 CONOPS
Only a brief summary of the NPS-SCAT concept of operations (CONOPS) is described
here. For a more detailed version please refer to Cody Mortensen‟s NPS Thesis titled
“NPS-SCAT; Communications System Design, Test, and Integration of NPS‟s First
CubeSat.”11
The CONOPS for NPS-SCAT was primarily driven by the CubeSat
deployment requirements and the payload requirements.
Launch operations start with the CubeSat stowed in the deployer with batteries at
the optimal storage level. At the point when NPS-SCAT is deployed, the switch on the
foot of the CubeSat will no longer be depressed, turning on the FM430 and initiating a
minimum 30 minute countdown. At the end of the countdown, the satellite will check the
battery charge level. With adequate charge of 8.5 volts, the satellite will deploy the
beacon antenna. On-orbit the satellite will execute a limited number of tasks to fulfill the
mission of collecting solar cell data. These include the:
MHX wakeup task
Transmit MHX task
Receive MHX task
Collect data task
Beacon transmit task
Receive beacon task
Ideally, the collect data task is completed 3 times per orbit, while the spacecraft is
in the sun. The measurements during the “Collect data” task include the sun angle and an
IV curve for each solar cell.

11
2.1.3.1 LAUNCH VEHICLE
At the time of testing, NPS-SCAT was scheduled for a launch on the SpaceX Falcon 1e
in fall of 2011. Previous SpaceX launches have had CubeSat payloads, including the
RazakSat mission pictured below12
. The Falcon 1e, shown in Figure 8 below, is capable
of launching a 1010-kilogram payload into a 185 km circular orbit.13
FIGURE 7: LIFTOFF OF FALCON 1, RAZAKSAT MISSION
FIGURE 8: FALCON 1 FAIRING
The relevant information for CubeSat vibration testing was the Falcon 1 Random
Vibration Maximum Predicted Environment PSD Values, listed in Table 413
.
Unfortunately these values are from the Falcon 1, not the Falcon 1e, therefore they are
still only an estimate and likely represent a minimum because of the enhanced
performance of the Falcon 1e over the Falcon 1.

12
TABLE 2: FALCON 1 RANDOM VIBRATION ENVIRONMENT
Frequency (Hz) ASD (g2/Hz)
20 .003
100 .02
700 .02
2000 .0025
Overall 4.7 Grms
2.1.4 ENGINEERING DEVELOPMENT UNIT
The NPS-SCAT engineering development unit (EDU) was developed as an initial proof-
of-concept and for qualification testing. It includes all of the subsystems identified in the
description of NPS-SCAT except for the final version of the Cal Poly Beacon Board,
which was not available for qualification tests. Instead, a prototype beacon board with
similar characteristics was substituted for qualification testing. In the overall
development plan, a second satellite will be built, which will be the Flight Unit. The
second satellite will be tested at either proto-flight or acceptance levels, depending on any
modifications that were made to the EDU after qualification.
There were multiple advantages to building both an EDU and a Flight Unit.
Moving from the breadboard to an EDU provided an initial fit-check for the subsystems,
identified interface issues before the flight unit integration, and allowed the payload SMS
board and ESP board to be tested in a flight configuration. This follows the “test like you
fly, fly like you test” philosophy, which results in risk mitigation through flight-like
testing scenarios.14
Building an EDU also allows the team to test the satellite at the higher
qualification level because it is not intended for launch.
13
The integration and functional testing of the EDU was an iterative process with
these tasks often taking place in parallel. The original integration procedures for the EDU
were written in 2009 and further refined as the final boards were manufactured. Between
the fall of 2009 and summer 2010, the NPS-SCAT subsystem configurations were
finalized, which allowed the test engineers and systems engineer to work collaboratively
to find an optimized integration sequence. Consequently, integration of the NPS-SCAT
EDU takes approximately three days and includes all necessary torque values and staking
compound placement.
2.1.4 ENVIRONMENTAL TESTING
The development of environmental test plans and levels for NPS-SCAT was based upon
the expected launch environment and the CubeSat Design Standard (CDS) because the
satellite was not officially manifested at the time environmental testing took place.
Although the CubeSat had an assigned Falcon 1e launch, it was in the best interest of the
program to test at higher levels to allow launch flexibility in the future.
Thermal vacuum testing will be discussed in Commander Kerry Smith‟s thesis
completed for the Naval Postgraduate School.
2.1.4.1 DERIVED TEST REQUIREMENTS
Defining testing levels for NPS-SCAT involved two challenges that are typical of
CubeSat programs. First, NPS-SCAT was not officially manifested on the Falcon 1e at
the time it was necessary to complete qualification testing. Second, the Falcon 1e has not
flown before, so the vibration levels are based upon the previous Falcon 1 flights. In
addition, due to contract delays, NPS-SCAT was not given any information regarding the
deployment device that would be used for launch.

14
Due to these uncertainties, NPS-SCAT was essentially tested independently of the
launch vehicle and deployer. The disadvantage to this testing methodology was the
necessity to always choose the worst-case environment despite a high probability the
satellite would not be exposed to the extremes it was tested to.
It was known that an Integrating Contractor (IC) would be chosen eventually, and
that organization would be responsible for setting forth the requirements for CubeSats
participating in the launch. In discussions with a NASA facility, it was suggested the
NPS-SCAT team test based upon the NASA GEVS testing standard (which is utilized in
the CubeSat Design Standard) or the Falcon 1e levels.
The NASA GEVS random vibration levels, including the lowest level of
component workmanship, all encompass the Falcon 1e profile.15
Conveniently, the
NASA GEVS levels are designed to encompass most of the common launch vehicles
used.3 For this reason, the CubeSat Design Specification (CDS) uses NASA GEVS when
the launch vehicle environment is unknown. In order to ensure the satellite would not
require further testing if a different launch vehicle was available, the GEVS vibration
testing levels were adopted for NPS-SCAT environmental testing. The NASA GEVS
levels are shown with the Falcon 1 levels for comparison in Figure 9.

15
FIGURE 9: NASA GEVS AND FALCON 1E RANDOM VIBRATION PROFILE
The following tables call out the values for the NASA GEVS Qualification,
Acceptance and Component Workmanship profiles that are shown above.
TABLE 3: NASA GEVS QUALIFICATION AND ACCEPTANCE
Qualification Acceptance
Frequency (Hz) ASD (g2/Hz) ASD (g
2/Hz)
20 .026 .013
20-80 +6 dB/oct +6 dB/oct
80-500 .16 .08
500-2000 -6 dB/oct -6 dB/oct
2000 .026 .013
Overall 14.1 Grms 10.0 Grms
16
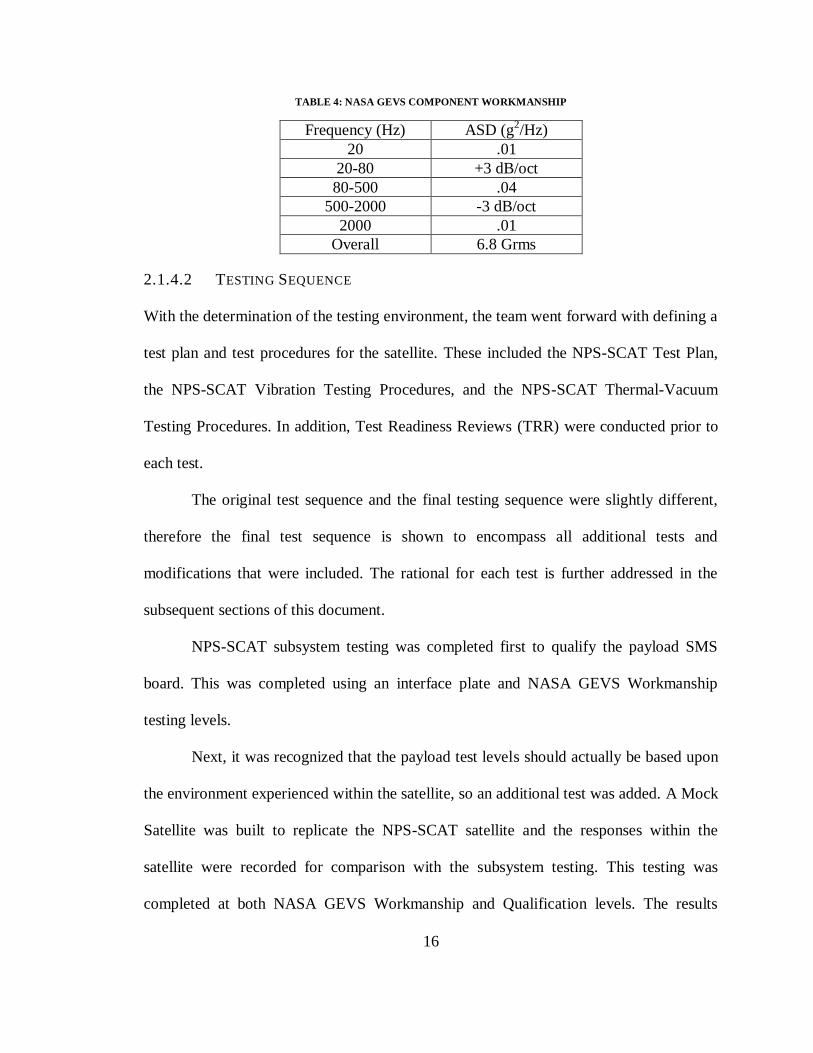
TABLE 4: NASA GEVS COMPONENT WORKMANSHIP
Frequency (Hz) ASD (g2/Hz)
20 .01
20-80 +3 dB/oct
80-500 .04
500-2000 -3 dB/oct
2000 .01
Overall 6.8 Grms
2.1.4.2 TESTING SEQUENCE
With the determination of the testing environment, the team went forward with defining a
test plan and test procedures for the satellite. These included the NPS-SCAT Test Plan,
the NPS-SCAT Vibration Testing Procedures, and the NPS-SCAT Thermal-Vacuum
Testing Procedures. In addition, Test Readiness Reviews (TRR) were conducted prior to
each test.
The original test sequence and the final testing sequence were slightly different,
therefore the final test sequence is shown to encompass all additional tests and
modifications that were included. The rational for each test is further addressed in the
subsequent sections of this document.
NPS-SCAT subsystem testing was completed first to qualify the payload SMS
board. This was completed using an interface plate and NASA GEVS Workmanship
testing levels.
Next, it was recognized that the payload test levels should actually be based upon
the environment experienced within the satellite, so an additional test was added. A Mock
Satellite was built to replicate the NPS-SCAT satellite and the responses within the
satellite were recorded for comparison with the subsystem testing. This testing was
completed at both NASA GEVS Workmanship and Qualification levels. The results

17
verified the NPS-SCAT SMS board had survived qualification levels based upon the
response within the satellite, and therefore was ready for integrated testing.
At this point the EDU was integrated and the qualification test at NASA GEVS
Qualification levels was completed. The only modification was the substitution of a
board similar to the Cal Poly Beacon Board.
Flight Unit testing is the last portion of the test plan which has not been
completed. This is dependent on flight unit subsystem testing and the arrival of the Cal
Poly Beacon Board. Test levels for the Flight Unit will be determined at the time of
testing depending on any modifications made after EDU qualification. Further details are
presented in section 4.3.
2.1.3.3 NPS VIBRATION TESTING FACILITY
The Space Systems Academic Group at the Naval Postgraduate School has an impressive
array of spacecraft testing capabilities that are available for use by the NPS-SCAT team.
For NPS-SCAT vibration testing, a Ling Electronics electrodynamic shaker was
used. The shaker can be oriented vertically or horizontally for use with a slip table,
allowing 3-axis testing without an additional test adaptor or bracket. The system is rated
for a maximum of 6,000 pounds force (26.7 kN). Both the vertical and horizontal
configurations are shown in Figure 10.

18
FIGURE 10: NPS VIBRATION TEST FACILITIES, LING SHAKER
The full configuration for vibration testing includes16
:
Ling 612VH Electrodynamic Shaker
Dynamics Solutions GT600M Stand-alone Slip Table
DMA-6XE Solid State Amplifier
Agilent VXI Data Acquisition Unit and Function Generator
Vibration Controller PC with m+p brand software
This set-up allows up to 16 measurement channels to be recorded during a test. In
addition, the vibration test facility is also equipped with a digital video monitoring
system. The four cameras are positioned in the test area to record the test item from all
angles.
2.1.5 FLIGHT UNIT
The NPS-SCAT Flight Unit subsystems are currently in the manufacture and testing
phases. Subsystems purchased from other vendors require acceptance testing prior to

19
integration with the rest of the satellite. Subsystems manufactured in-house require parts
bake-out and clean room population before individual acceptance testing.
Integrated testing of the satellite will take place prior to conformal coating and
environmental testing. This decreases the risk of finding physical incompatibilities and/or
operational anomalies after the conformal coating has been applied. Further testing at the
subsystem level and satellite level after conformal coating is applied and cured.
Upon passing the initial functional tests, the satellite will be fully integrated in
preparation for vibration and thermal-vacuum testing at acceptance or proto-flight levels.
2.1.5 FUTURE NPS SATELLITE DEVELOPMENT
One of the goals of the NPS CubeSat program is to develop a satellite bus that can
be used with any given payload. Future use of NPS bus will build heritage and allow the
team to focus on payload development. In the case of NPS-SCAT, the satellite bus
consists of the Pumpkin FM 430, the ClydeSpace EPS and battery board, the MHX 2400
radio, and the Pumpkin CubeSat structure. As will be shown subsequently, the current
bus was successfully qualified when the NPS-SCAT EDU was tested at NASA GEVS
qualification levels. The integrated payload, which is the Solar Measurement System
(SMS), was also qualified at that time.
Although system integration and testing will be required for each new satellite,
the process can be dramatically simplified if the payload is qualified separately from the
bus. With a standard bus and a qualified payload, the satellite could be integrated and
tested at proto-flight levels. This does however require a specially designed payload
testing configuration and payload test levels, which will be addressed within this thesis.

20
2.2 CAL POLY TEST POD MK III AND P-POD MK III
During the same time frame that NPS-SCAT was approaching satellite qualification,
testing, Cal Poly San Luis Obispo completed the manufacture of a new CubeSat Test
POD, the Test POD Mk III. The combination of advanced testing facilities at NPS and
further interest in evaluating the standard CubeSat testing process allowed the Test POD
Mk III to undergo qualification level testing at NPS. With a greater number of
measurement channels and new 1U mass models made by Cal Poly, the Test POD Mk III
was instrumented to record the actual CubeSat response in addition to the response of the
outer structure. With additional support from Cal Poly, a P-POD with three 1U mass
model was instrumented in a similar fashion; each 1U mass model had an inner
accelerometer to record the CubeSats‟ responses.
Three main goals were accomplished with these tests. First, the Cal Poly Test
POD Mk III was tested at qualification levels and the response of the mass model was
recorded. Second, the CubeSat response measurements from the Test POD Mk III were
compared to the response measurements of the Cal Poly P-POD to understand how the
testing method and deployer environments compare. And lastly, the CubeSat responses
from the P-POD were examined to understand the dynamics of the individual satellites
when exposed to environmental testing and ultimately, launch conditions.
2.2.1 CAL POLY TEST POD MK III
Cal Poly originally designed the CubeSat Test POD as a stand-alone testing apparatus for
1U CubeSats. Multiple Test PODs were manufactured to lend to other CubeSat teams and
facilitate satellite qualification at other universities with vibration testing capabilities. A
picture of the Test POD is shown in Figure 11.
21
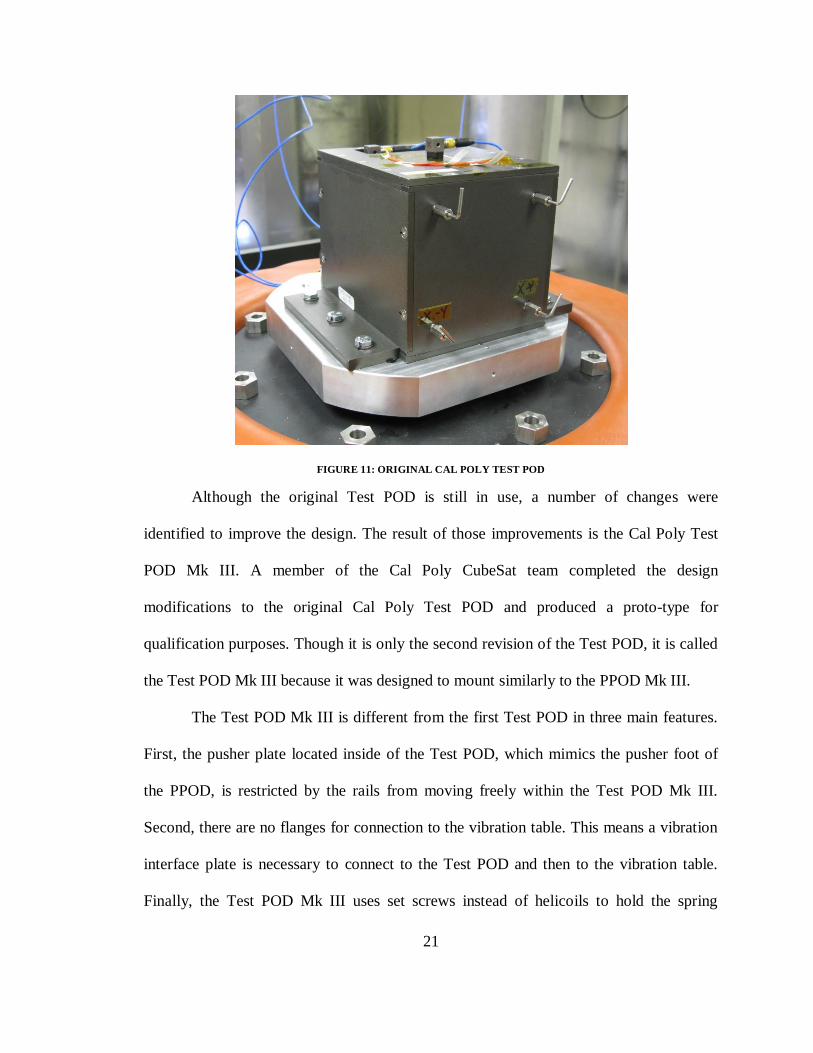
FIGURE 11: ORIGINAL CAL POLY TEST POD
Although the original Test POD is still in use, a number of changes were
identified to improve the design. The result of those improvements is the Cal Poly Test
POD Mk III. A member of the Cal Poly CubeSat team completed the design
modifications to the original Cal Poly Test POD and produced a proto-type for
qualification purposes. Though it is only the second revision of the Test POD, it is called
the Test POD Mk III because it was designed to mount similarly to the PPOD Mk III.
The Test POD Mk III is different from the first Test POD in three main features.
First, the pusher plate located inside of the Test POD, which mimics the pusher foot of
the PPOD, is restricted by the rails from moving freely within the Test POD Mk III.
Second, there are no flanges for connection to the vibration table. This means a vibration
interface plate is necessary to connect to the Test POD and then to the vibration table.
Finally, the Test POD Mk III uses set screws instead of helicoils to hold the spring

22
plungers in place. This specific change was made because the helicoils are difficult to
replace when a Test POD returns from a CubeSat program and is refurbished before
being sent to another location.
The empty Test POD Mk III and the integrated configuration are shown in Figure
12 to illustrate the testing configuration.
FIGURE 12: TEST POD MK III PRE AND POST INTEGRATION
As mentioned, the Test POD Mk III must be qualified before it is manufactured
and sent out to developers. For this portion of the testing it has been agreed with Cal
Poly the Test POD will be tested at NASA GEVS Random Vibration Qualification levels
with a pre and post-sine sweep. There was also interest in seeing if the response of the
CubeSat would change after the first random vibration test, therefore a second GEVS
Random Vibration was completed, followed by a final sine sweep.
The instrumentation for this testing will include an accelerometer inside of the
CubeSat mass model for measurement of the CubeSat response and comparison with the
P-POD response levels.

23
2.2.2 CAL POLY P-POD MK III
As previously described, the Cal Poly P-POD Mk III is the third generation design of the
Poly Picosatellite Orbital Deployer produced by Cal Poly. The deployer acts as a
secondary payload adapter to hold three CubeSats during a launch. There is a standard
hole pattern for interfacing with launch vehicles, however some modifications are
possible based upon the specific launch vehicle and position of the P-POD.
The P-POD is essentially an aluminum box with a large spring to eject the three
CubeSats simultaneously. The deployer uses an NEA to release the door and separation
between the CubeSats is accomplished with two small springs in the feet of each satellite
(refer to the CubeSat specification in Appendix A for further details).
The P-POD Mk III has completed extensive qualification testing and
characterization, as documented in Wenschel Lan‟s thesis17
. However, the previous
testing did not document the CubeSat response within the P-POD, so it was necessary to
take those measurements using standard CubeSat mass models and controlled
accelerometer placement. Cal Poly‟s vibration testing facilities only support the recording
of four response channels, one of which is necessary for the control accelerometer
attached to the shake table. Therefore, the advantage of testing at NPS was the ability to
place a tri-axial accelerometer inside each CubeSat mass model and then compare this
data to the re-designed Test POD.
Evaluation of the current testing methodology will be based upon comparison of
the Test POD and P-POD inner CubeSat responses. The Test POD is expected to be the
worst-case vibration environment.

24
3 NPS-SCAT SUBSYSTEM VIBRATION TESTING
Similarly to much larger spacecraft, payload development for NPS-SCAT required an
extensive amount of time and resources. In a typical spacecraft development cycle,
subsystems are often tested separately, but for picosatellite testing it is not uncommon to
qualify the entire satellite (structure, subsystems and payload) at one time. Not only does
this reduce the time and cost involved, it is also a logical step because CubeSats are
actually the same size, or smaller, than the modules on a larger spacecraft that would be
qualified individually.
In the case of NPS-SCAT however, the high cost and unconventional mounting of
the Sinclair Sun Sensor on the SMS PCB caused the team to reevaluate the typical testing
timeline. It was determined that the SMS board would undergo separate workmanship
testing prior to satellite qualification. Therefore, a subsystem vibration testing method
was developed.
3.1 TEST DEVELOPMENT
The goal of NPS-SCAT subsystem testing was to replicate the environment experienced
by a PCB mounted inside of the NPS-SCAT CubeSat during qualification testing.
Therefore, two considerations had to be addressed. First, a testing apparatus to hold an
individual PCB was necessary. Second, test levels appropriate for workmanship testing
were determined.
3.1.1 SUBSYSTEM TESTING INTERFACE PLATE
An interface plate is necessary to attach a test item to the vibration table. The first
interface plate made for NPS-SCAT testing was designed for two purposes. One purpose
25
was subsystem testing of individual PCBs and the other purpose was to attach the Cal
Poly Test POD for integrated satellite testing. The Test POD only requires 6 holes and
assumes the interface plate will transfer the input from the shake table to the Test POD.
This was accomplished with a sufficiently thick, aluminum interface plate. For
compatibility with the subsystem testing goals, further modifications to the plate were
necessary.
Two subsystem configurations were considered based on the following factors:
1) Mimic the satellite configuration as close as possible. This option would
include use of stand-offs to elevate the board above the plate as well as the
attachment of two 52-pin headers to imitate the satellite bus connection to the
PCB.
2) Minimize the interface connections to transfer the shaker input directly to the
PCB. This option only included four connections to the board, using the
corner holes on the PC-104 standard board.
Because option one did not guarantee the board would respond the same as in the
satellite, the second option was chosen. Option two minimized the variables within the
set-up. The resulting interface plate is shown in the vertical shake position in Figure
1313.

26
FIGURE 13: NPS-SCAT VIBRATION INTERFACE PLATE
The plate accommodates a PC-104 standard board as well as the Test POD in two
separate axes. For subsystem testing, the interface plate must be removed to change axes,
but the extra six holes that are compatible with the Test Pod allow it to be removed rather
than the entire interface plate. For either test item, the interface plate must be removed
and reattached for use in the vertical shake direction.
3.1.2 TEST CONFIGURATION AND LEVELS
Initial evaluation of the subsystem test set-up was completed with a blank PCB. The PCB
was designed for use in NPS-SCAT and did have two 52-pin headers attached, however
no other components were populated. The drawback to this configuration was the lack of
an electrical functional test to confirm the PCB worked prior to and after vibration
testing. Visual inspections were completed after each shake. The test configuration is
shown in Figure 14.
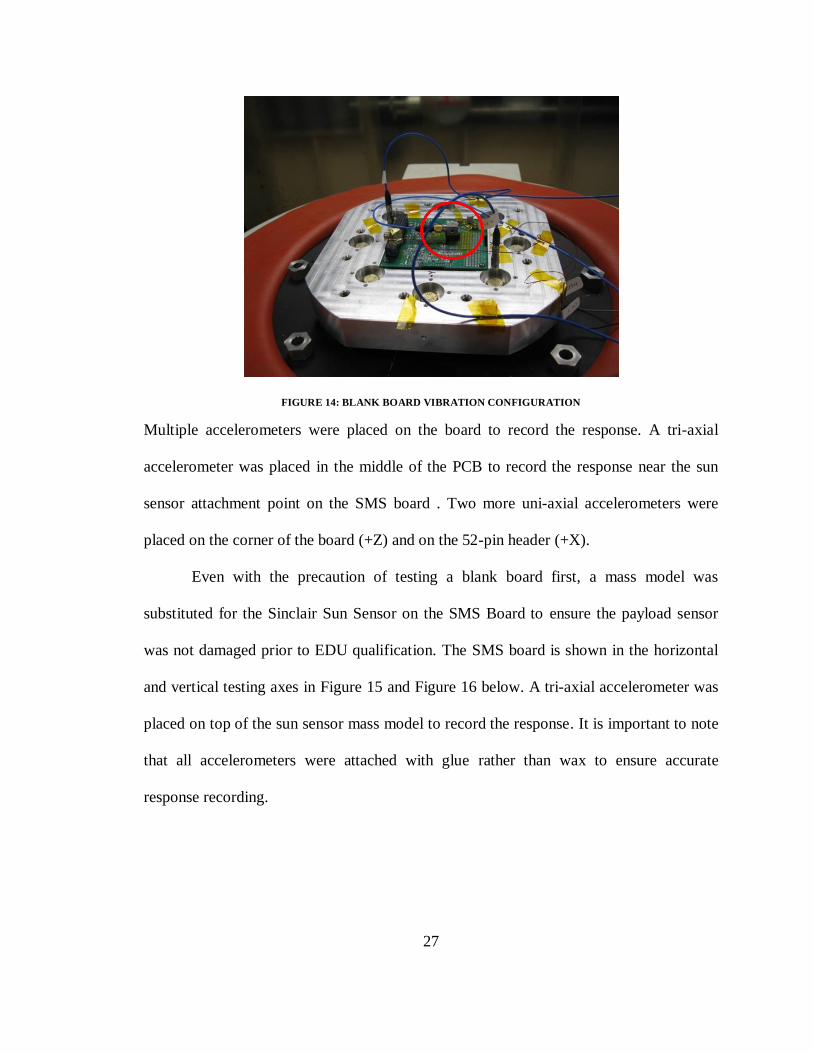
27
FIGURE 14: BLANK BOARD VIBRATION CONFIGURATION
Multiple accelerometers were placed on the board to record the response. A tri-axial
accelerometer was placed in the middle of the PCB to record the response near the sun
sensor attachment point on the SMS board . Two more uni-axial accelerometers were
placed on the corner of the board (+Z) and on the 52-pin header (+X).
Even with the precaution of testing a blank board first, a mass model was
substituted for the Sinclair Sun Sensor on the SMS Board to ensure the payload sensor
was not damaged prior to EDU qualification. The SMS board is shown in the horizontal
and vertical testing axes in Figure 15 and Figure 16 below. A tri-axial accelerometer was
placed on top of the sun sensor mass model to record the response. It is important to note
that all accelerometers were attached with glue rather than wax to ensure accurate
response recording.

28
FIGURE 15: SMS CONFIGURATION, X AND Y AXES
FIGURE 16: SMS CONFIGURATION, X AND Y AXES
Testing levels were determined based on NASA testing standards and
considerations specific to NPS-SCAT. First, it was assumed that the damping present
within the integrated satellite would cause the subsystem boards to experience a lower
vibration level than the NASA GEVS Qualification levels the EDU would be tested at.
Therefore, the options were to tailor a vibration test profile based upon an assumed level
inside the Test POD, or utilize a test profile set forth by NASA. Without prior knowledge
of the vibration environment within the Test POD, it was not possible to predict the levels
and tailor a test. Therefore, NASA GEVS Component Workmanship levels were chosen.
The NASA Technical Standard 7001, Payload Vibroacoustic Test Criteria
(NASA-STD-7001), was also utilized. The workmanship test levels in NASA-STD-7001
are the same as the component workmanship test levels in NASA-GEVS. This standard
outlines component minimum workmanship random vibration test levels for an item that
is less than 23kg (50 lb) and stipulates that test levels for larger items must encompass the
minimum workmanship levels regardless of the maximum expected environment
(MEE).18
Therefore, the subsystem testing criteria met NASA standards because the

29
component workmanship profile encompasses the published Falcon 1 levels. The
workmanship levels and the relevant profiles are shown in Table 5 and Figure 7.
TABLE 5: NASA GEVS COMPONENT MINIMUM WORKMANSHIP RANDOM
VIBRATION TEST LEVELS (UNITS WITH MASS LESS THAN 50KG)
Frequency (Hz) ASD (g2/Hz)
20 .01
20-80 +3dB/oct
80-500 .04
500-2000 -3dB/oct
2000 .01
Overall 6.8 grms
FIGURE 17: NASA GEVS RANDOM VIBRATION LEVELS AND FALCON 1 VIBRATION ENVIRONEMENT
The testing sequence for the subsystem testing consisted of a pre-testing .25g sine
sweep, the random vibration testing at NASA GEVS Component Workmanship Level,

30
and a post-testing .25g sine sweep. The testing started with the axes that were expected to
show a lower response and finished with the Z-Axis.
3.2 SUBSYSTEM TEST RESULTS
The test data for the blank PCB and the NPS-SCAT Solar Measurement System board are
presented below followed by an evaluation of the results.
3.2.1 BLANK PCB RESPONSE
Only a short summary of the blank board data is presented because the purpose of testing
the board was simply to evaluate the interface plate. An example plot of the raw data is
shown below, in Figure 18, of the Z-axis. The response is from the tri-axial accelerometer
located on the top, middle of the PCB.
FIGURE 18: BLANK BOARD Z-AXIS RESPONSE PLOT, NASA GEVS WORKMANSHIP

31
The modes for each axis are identified in 6 as determined from the z-axis response in
each shake axis.
TABLE 6: BLANK BOARD Z-AXIS RESPONSE FOR EACH SHAKE AXIS
X-Axis Y-Axis Z-Axis
Frequency (Hz) 657.5 777.5 397.5
Response (g2/Hz) .039 .034 116.043
3.2.2 SMS BOARD RESPONSE
The SMS board testing required a more rigorous procedure and evaluation than the blank
board testing. Functional testing was necessary in addition to the sine sweep
comparisons.
As expected based upon the blank board results, the SMS z-axis again showed the
largest response in each shake axis. An example of the sine sweep comparison is shown
for the z-axis. Figure 19 is the pre-test sine sweep and figure 20 is the post-test sine
sweep. The similarity confirms there were no significant structural changes in the board.

32
FIGURE 19: SMS Z-AXIS PRE-TEST SINE SWEEP RESPONSE
For the pre-test .25g sine sweep the board mode was at 272 Hz and a 16.1 g response.
The post-test .25g sine sweep showed the mode did not move significantly, with a
resonance at 270 Hz and a response of 11.9g.
15 100 800
[Hz]
0.1
1
10
[g]
X: 272[Hz]
Y: 16.1[g]
Q: 0.484
Chan.no: 7
Chan.type: M Filtered
Sweep type: logarithmic
Sweeps done: 1
Sweeps req.: 1
Sweep direct.:up
Sweep rate: 2.00 Oct/min
Contr.strat.: Average
Unit: g
Contr.strat.: Closed loop
-- Testing time --
elapsed: 000:02:51
remaining: 000:00:00
Date: 07-28-10
Time: 11:31:09
Triax Z (up)Sine
C:\Documents and Settings\student\My Documents\NPS_SCAT\100723_SMS_Board\1 - Profiles\Z_Pre_Sine_Sweep_SMS_Board_with_Chan_8_Workmanship.rsn
33
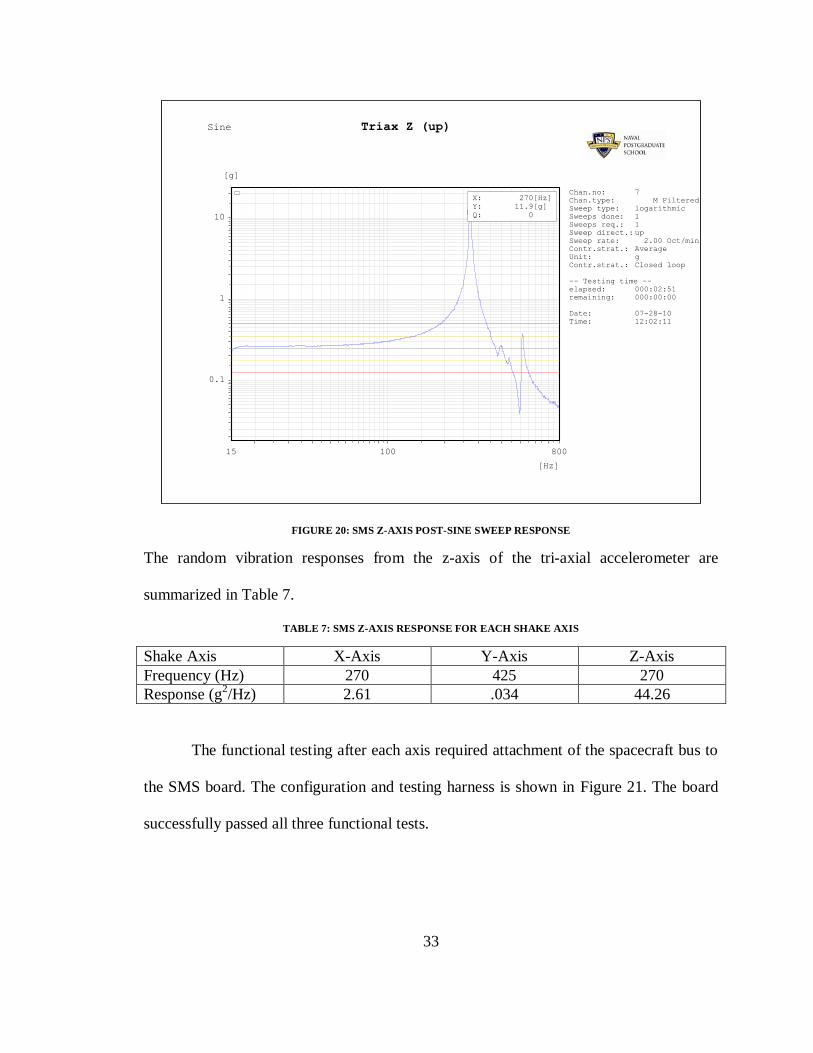
FIGURE 20: SMS Z-AXIS POST-SINE SWEEP RESPONSE
The random vibration responses from the z-axis of the tri-axial accelerometer are
summarized in Table 7.
TABLE 7: SMS Z-AXIS RESPONSE FOR EACH SHAKE AXIS
Shake Axis X-Axis Y-Axis Z-Axis
Frequency (Hz) 270 425 270
Response (g2/Hz) 2.61 .034 44.26
The functional testing after each axis required attachment of the spacecraft bus to
the SMS board. The configuration and testing harness is shown in Figure 21. The board
successfully passed all three functional tests.
15 100 800
[Hz]
0.1
1
10
[g]
X: 270[Hz]
Y: 11.9[g]
Q: 0
Chan.no: 7
Chan.type: M Filtered
Sweep type: logarithmic
Sweeps done: 1
Sweeps req.: 1
Sweep direct.:up
Sweep rate: 2.00 Oct/min
Contr.strat.: Average
Unit: g
Contr.strat.: Closed loop
-- Testing time --
elapsed: 000:02:51
remaining: 000:00:00
Date: 07-28-10
Time: 12:02:11
Triax Z (up)Sine
C:\Documents and Settings\student\My Documents\NPS_SCAT\100723_SMS_Board\1 - Profiles\Z_Post_Sine_Sweep_SMS_Board_with_Chan_8_Workmanship.rsn

34
FIGURE 21: SMS BOARD, NPS-SCAT BUS, AND TEST HARNESS
One specific “lesson learned” to note is that the testing harness was checked prior
to the SMS attachment to the interface plate, but not after the board was attached.
Therefore, after the first shake axis the board appeared to fail the functional test and was
removed from the interface plate. The board was fully functional after removal from the
plate and further examination determined a pin was grounded. Application of Kapton
tape solved the problem for the two remaining functional tests. Full review of the
functional tests as well as the environmental tests in the actual configuration is necessary
to ensure accurate results.
3.2.3 SUBSYSTEM TESTING EVALUATION
To compare the SMS board and blank board results, the amplification factor, Q, was
calculated for each test item. The amplification factor “represents the system mechanical
gain during forced vibration at the system natural frequency,” as stated in the paper

35
“Acoustic and Random Vibration Test Tailoring for Low-Cost Missions.”19
To calculate
Q using the half power method, see Appendix B.20
The amplification factors shown in Table 8 are calculated from the Z-axis
response during the Z-axis vibration test.
TABLE 8: SUBSYSTEM AMPLIFICATION FACTORS
SMS Board
Workmanship
Blank PCB
Workmanship
Q Factor 29.3 45.4
The magnitude and amplification factors for both the blank PCB and the SMS
PCB vibration tests were unexpectedly high. To verify that these results were actually
higher than the environment a PCB would experience within the CubeSat, it was
necessary to record the response of a subsystem board within NPS-SCAT.
3.3 IMPROVED SUBSYSTEM TESTING
The goal of developing an independent subsystem testing configuration was to ensure the
subsystem could withstand vibration testing before integration into the CubeSat, to avoid
the time-consuming task of CubeSat integration, and to minimize the exposure of other
subsystems to the vibration environment and possible over-testing. With these goals in
mind, a Mock Satellite (Mock Sat) testing configuration was developed. The Mock Sat
consisted of older NPS-SCAT subsystems and boards which would not be part of the
NPS-SCAT EDU, including a completely different structure and solar panels. With this
slightly modified satellite, an older SMS board could be instrumented and tested with no
risk to the actual spacecraft or board. Though integration could not be avoided, the Mock
36
Sat does avoid stressing any other subsystems and will accurately represent the
environment within the EDU.
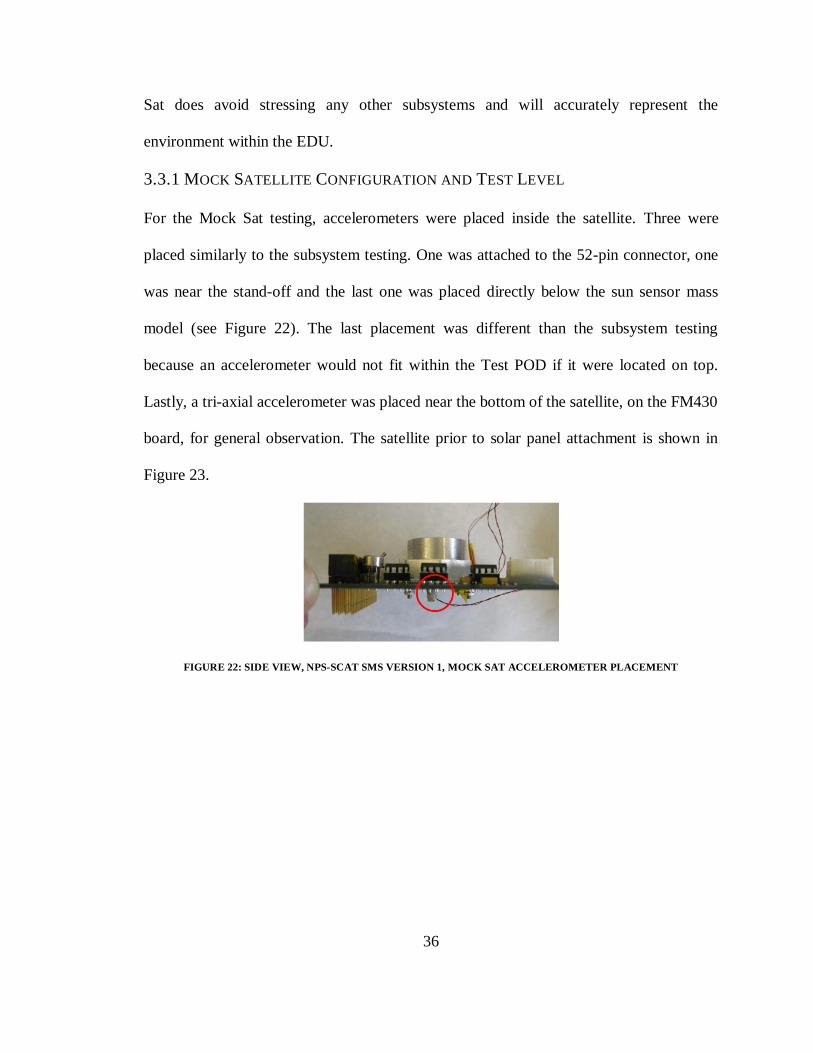
3.3.1 MOCK SATELLITE CONFIGURATION AND TEST LEVEL
For the Mock Sat testing, accelerometers were placed inside the satellite. Three were
placed similarly to the subsystem testing. One was attached to the 52-pin connector, one
was near the stand-off and the last one was placed directly below the sun sensor mass
model (see Figure 22). The last placement was different than the subsystem testing
because an accelerometer would not fit within the Test POD if it were located on top.
Lastly, a tri-axial accelerometer was placed near the bottom of the satellite, on the FM430
board, for general observation. The satellite prior to solar panel attachment is shown in
Figure 23.
FIGURE 22: SIDE VIEW, NPS-SCAT SMS VERSION 1, MOCK SAT ACCELEROMETER PLACEMENT
37
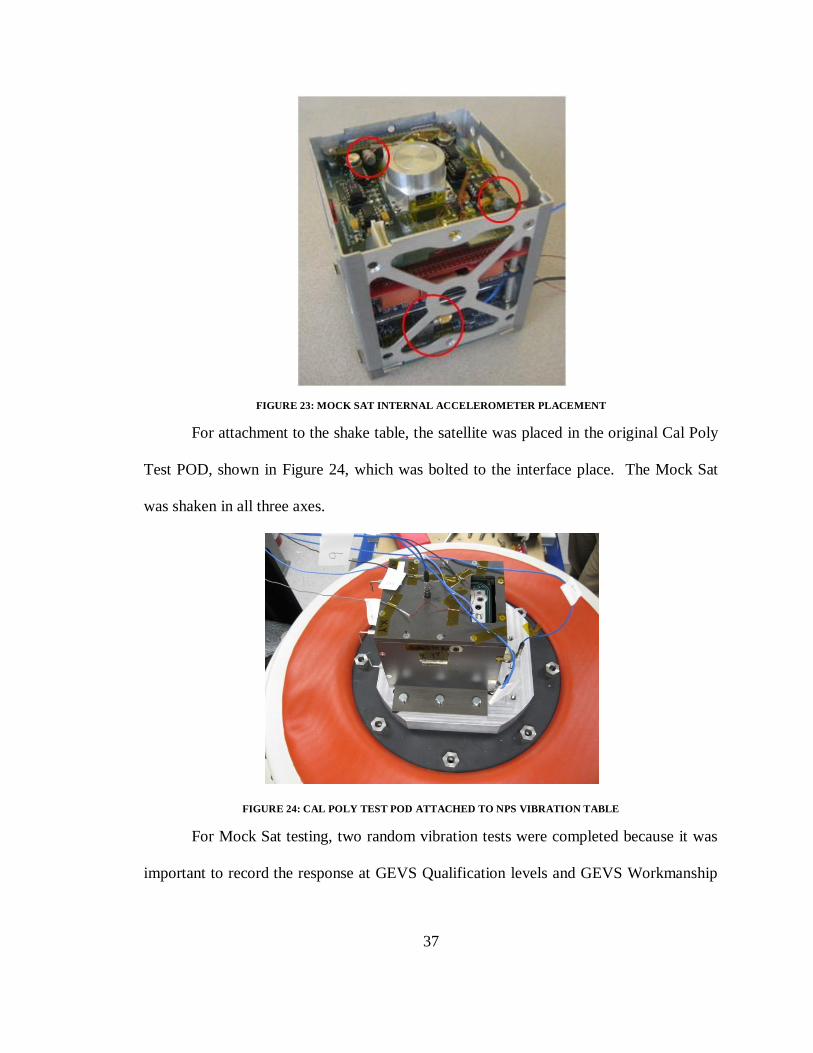
FIGURE 23: MOCK SAT INTERNAL ACCELEROMETER PLACEMENT
For attachment to the shake table, the satellite was placed in the original Cal Poly
Test POD, shown in Figure 24, which was bolted to the interface place. The Mock Sat
was shaken in all three axes.
FIGURE 24: CAL POLY TEST POD ATTACHED TO NPS VIBRATION TABLE
For Mock Sat testing, two random vibration tests were completed because it was
important to record the response at GEVS Qualification levels and GEVS Workmanship

38
levels. With both levels known, it was possible to compare to the previous subsystem
testing and then use the qualification levels to identify the ideal subsystem testing level.
3.3.2 MOCK SAT RESULTS
The Mock Sat results (NASA GEVS Workmanship and Qualification) are presented with
the SMS subsystem results for direct comparison. Results shown for the Mock Satellite
represent the output from the z-axis accelerometer placed beneath the sun sensor, on the
bottom of the SMS board. Results shown for the SMS board represent the output from the
z-axis accelerometer placed on top of the sun sensor when the board was attached
individually to the interface plate. It is recognized that the difference in accelerometer
placement will not produce a definitive comparison between these two configurations;
however for this purpose the results are adequate to facilitate the evaluation of the
original testing configuration.
The Z-Axis, or worst-case results, are shown first in Figure 9 and the peaks are
identified in Table 25.

39
FIGURE 25: MOCK SAT Z-AXIS SUN SENSOR RESPONSE
TABLE 9: SUMMARY OF Z-AXIS SUN SENSOR RESPONSES
Z-Axis Vibration Test Sun Sensor Response
Test Item SMS Board (Red) Mock Sat (Green) Mock Sat (Blue)
Test Level GEVS
Workmanship
GEVS Qualification GEVS
Workmanship
Frequency (Hz) 270 295 312.5
Response (g2/Hz) 44.27 18.9 12.43
These results show that over-testing occurs in the Z-axis when the board is
directly attached to the interface plate.
The z-axis responses during Y-axis random vibration testing are shown in Figure
26, with the peaks identified in Table 10.

40
FIGURE 26: Y-AXIS VIBRATION TEST SUN SENSOR RESPONSE
TABLE 10: SUMMARY OF Y-AXIS VIBRATION TEST SUN SENSOR RESPONSES
Y-Axis Vibration Test Sun Sensor Response – 1st Peak
Test Item SMS Board (Red) Mock Sat (Green) Mock Sat (Blue)
Test Level GEVS
Workmanship
GEVS Qualification GEVS
Workmanship
Frequency (Hz) 425 340 335
Response (g2/Hz) .034 2.346 1.897
2nd
Peak
Test Item SMS Board (Red) Mock Sat (Green) Mock Sat (Blue)
Test Level GEVS
Workmanship
GEVS Qualification GEVS
Workmanship
Frequency (Hz) 1080 1155 1168
Response (g2/Hz) .01242 .6585 .4514
The X-Axis vibration testing responses are shown below in Figure 27 and Table
11.

41
FIGURE 27: X-AXIS VIBRATION TEST SUN SENSOR RESPONSE
TABLE 11: SUMMARY OF X-AXIS VIBRATION TEST SUN SENSOR RESPONSES
X-Axis Sun Sensor Response
Test Item SMS Board (Red) Mock Sat (Green) Mock Sat (Blue)
Test Level GEVS
Workmanship
GEVS Qualification GEVS
Workmanship
Frequency (Hz) 270 332.5 340
Response (g2/Hz) 2.615 2.022 1.432
The X and Y-axis plots show the worst-case vibration levels occur when the
board is in the satellite. Based upon these results, it is assumed the interface plate over
constrained the motion of the board in these axes.
The amplification factors calculated for the Z-Axis shake test are shown below.
The SMS Board and Blank PCB are shown for comparison.
42
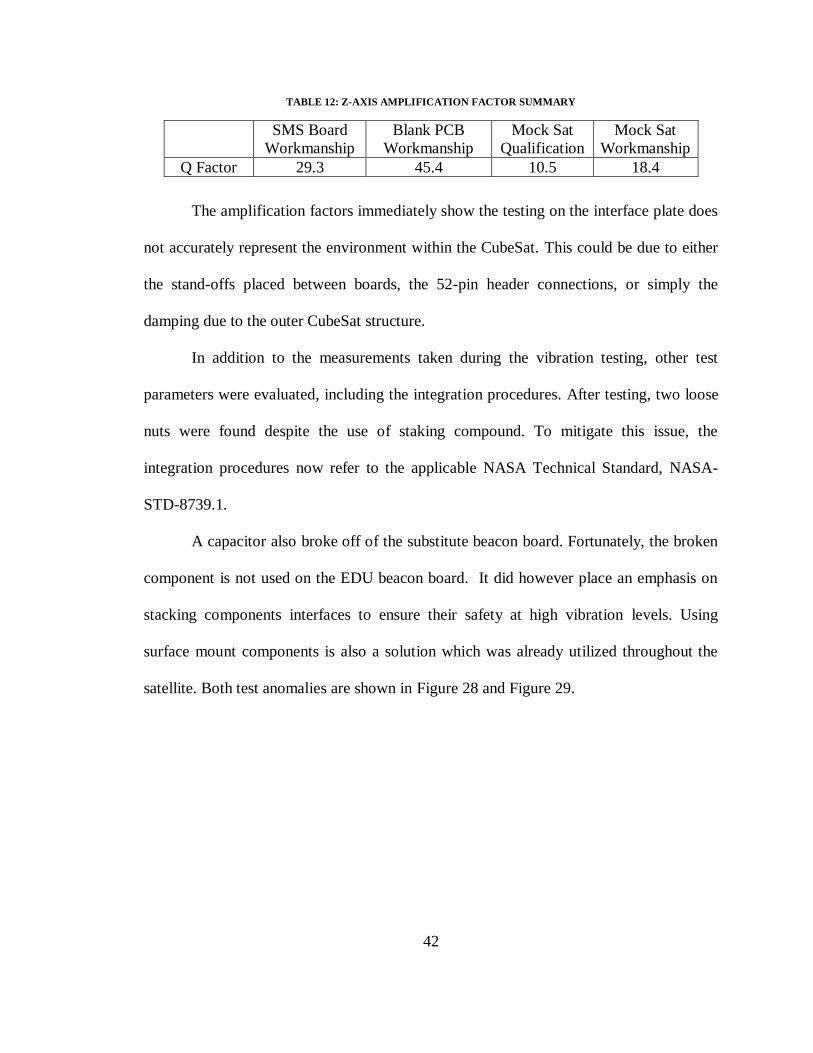
TABLE 12: Z-AXIS AMPLIFICATION FACTOR SUMMARY
SMS Board
Workmanship
Blank PCB
Workmanship
Mock Sat
Qualification
Mock Sat
Workmanship
Q Factor 29.3 45.4 10.5 18.4
The amplification factors immediately show the testing on the interface plate does
not accurately represent the environment within the CubeSat. This could be due to either
the stand-offs placed between boards, the 52-pin header connections, or simply the
damping due to the outer CubeSat structure.
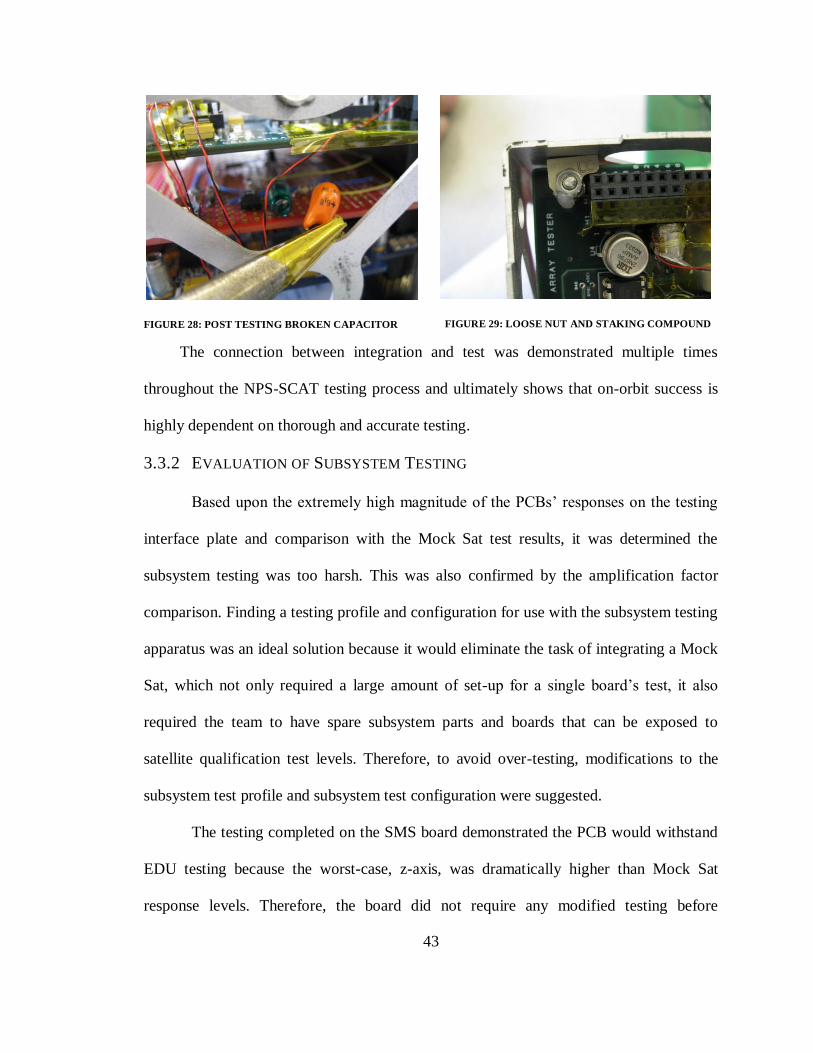
In addition to the measurements taken during the vibration testing, other test
parameters were evaluated, including the integration procedures. After testing, two loose
nuts were found despite the use of staking compound. To mitigate this issue, the
integration procedures now refer to the applicable NASA Technical Standard, NASA-
STD-8739.1.
A capacitor also broke off of the substitute beacon board. Fortunately, the broken
component is not used on the EDU beacon board. It did however place an emphasis on
stacking components interfaces to ensure their safety at high vibration levels. Using
surface mount components is also a solution which was already utilized throughout the
satellite. Both test anomalies are shown in Figure 28 and Figure 29.
43
FIGURE 28: POST TESTING BROKEN CAPACITOR
FIGURE 29: LOOSE NUT AND STAKING COMPOUND
The connection between integration and test was demonstrated multiple times
throughout the NPS-SCAT testing process and ultimately shows that on-orbit success is
highly dependent on thorough and accurate testing.
3.3.2 EVALUATION OF SUBSYSTEM TESTING
Based upon the extremely high magnitude of the PCBs‟ responses on the testing
interface plate and comparison with the Mock Sat test results, it was determined the
subsystem testing was too harsh. This was also confirmed by the amplification factor
comparison. Finding a testing profile and configuration for use with the subsystem testing
apparatus was an ideal solution because it would eliminate the task of integrating a Mock
Sat, which not only required a large amount of set-up for a single board‟s test, it also
required the team to have spare subsystem parts and boards that can be exposed to
satellite qualification test levels. Therefore, to avoid over-testing, modifications to the
subsystem test profile and subsystem test configuration were suggested.
The testing completed on the SMS board demonstrated the PCB would withstand
EDU testing because the worst-case, z-axis, was dramatically higher than Mock Sat
response levels. Therefore, the board did not require any modified testing before

44
integration into the EDU. To meet the testing timeline of NPS-SCAT, and because no
other subsystems required individual qualification, integration of the satellite was started
to prepare for EDU Qualification.
3.3.3 MODIFIED SUBSYSTEM TESTING
The goal of the modified vibration profile and configuration was to produce a response
similar to the Mock Sat GEVS Random Vibration Qualification testing. For NPS-SCAT
that input represents a worst-case environment for a subsystem PCB.
3.3.3.1 TEST PROFILES
Two modified profiles were chosen to facilitate comparison of data from both the initial
subsystem testing, which used the GEVS Workmanship levels, and the MockSat testing,
which used both the GEVS Workmanship and GEVS Qualification levels. For simplicity,
a linear scale was first used to compare the responses, then the input profiles were
lowered by 3 decibels (dB) for every factor of two above the optimal response (seen in
the satellite configuration).
The first profile is based upon the satellite response to GEVS Random Vibration
Qualification testing. The profile is 12 dB below GEVS Qualification. See Table 13 for
testing inputs.
TABLE 13: 12 DB BELOW GEVS QUALIFICATION
GEVS Qualification -12 dB
20 .001625
20-50 +6dB/oct
50-800 .01
800-2000 -6dB/oct
2000 .001625
Overall 3.53
45
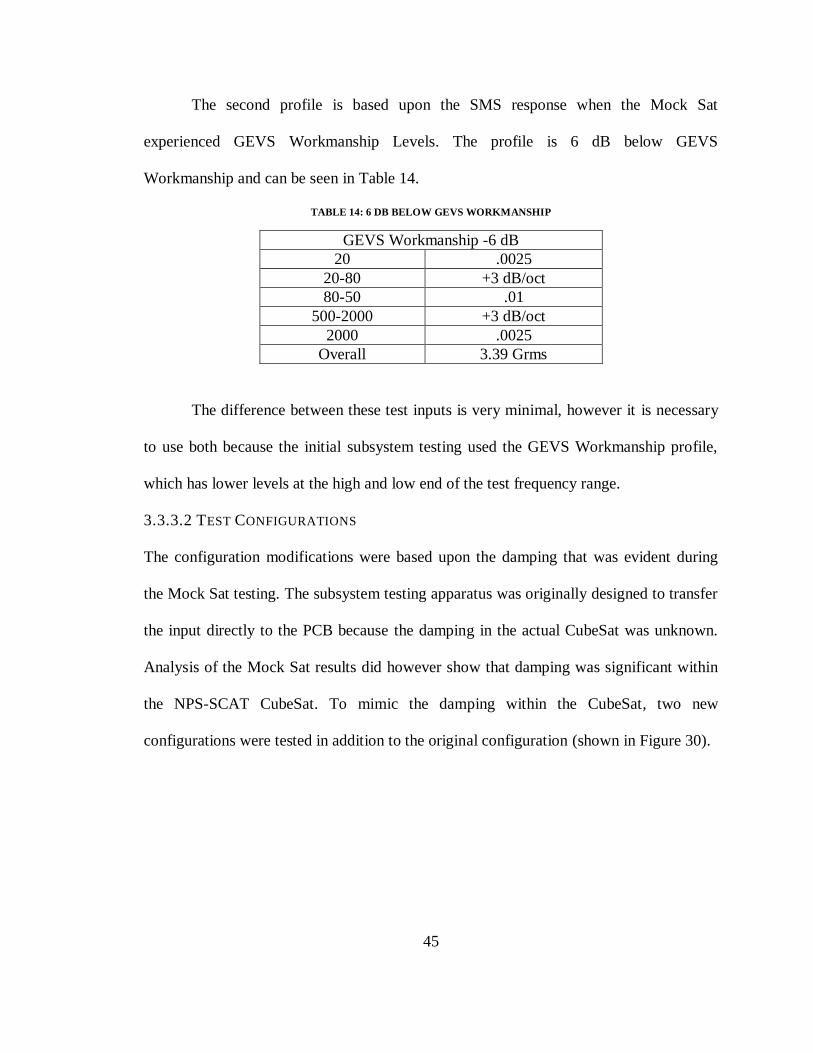
The second profile is based upon the SMS response when the Mock Sat
experienced GEVS Workmanship Levels. The profile is 6 dB below GEVS
Workmanship and can be seen in Table 14.
TABLE 14: 6 DB BELOW GEVS WORKMANSHIP
GEVS Workmanship -6 dB
20 .0025
20-80 +3 dB/oct
80-50 .01
500-2000 +3 dB/oct
2000 .0025
Overall 3.39 Grms
The difference between these test inputs is very minimal, however it is necessary
to use both because the initial subsystem testing used the GEVS Workmanship profile,
which has lower levels at the high and low end of the test frequency range.
3.3.3.2 TEST CONFIGURATIONS
The configuration modifications were based upon the damping that was evident during
the Mock Sat testing. The subsystem testing apparatus was originally designed to transfer
the input directly to the PCB because the damping in the actual CubeSat was unknown.
Analysis of the Mock Sat results did however show that damping was significant within
the NPS-SCAT CubeSat. To mimic the damping within the CubeSat, two new
configurations were tested in addition to the original configuration (shown in Figure 30).

46
FIGURE 30: RE-TEST OF ORIGINAL SUBSYSTEM CONFIGURATION
In the NPS-SCAT CubeSat, subsystem PCBs are separated by short metal stand-
offs and attached on one end by two 52-pin connectors. It is assumed the 52-pin
connectors significantly contribute to the damping. The first modified configuration was
a PCB elevated above the subsystem testing interface plate by a set of stand-offs.
FIGURE 31: SUBSYSTEM BOARD ON STANDOFFS
The second modified configuration was a stack of two PCBs, separated by stand-
offs and elevated above the subsystem testing apparatus by a set of stand-offs, the same
as the first modified configuration.

47
FIGURE 32: SUBSYSTEM CONFIGURATION, TWO BOARD STACK ON STANDOFFS
3.3.3.3 TEST RESULTS
The following paired graphs show the responses for the lowered GEVS Qualification
level testing and the lowered GEVS Workmanship level testing, respectively. All of the
results presented are the Z-Axis response because these results were the largest factor in
recommending a future subsystem testing configuration.
The first pair of graphs show the results for the original subsystem testing
configuration (Figure 33), which consisted of a single board directly attached to the
interface plate.
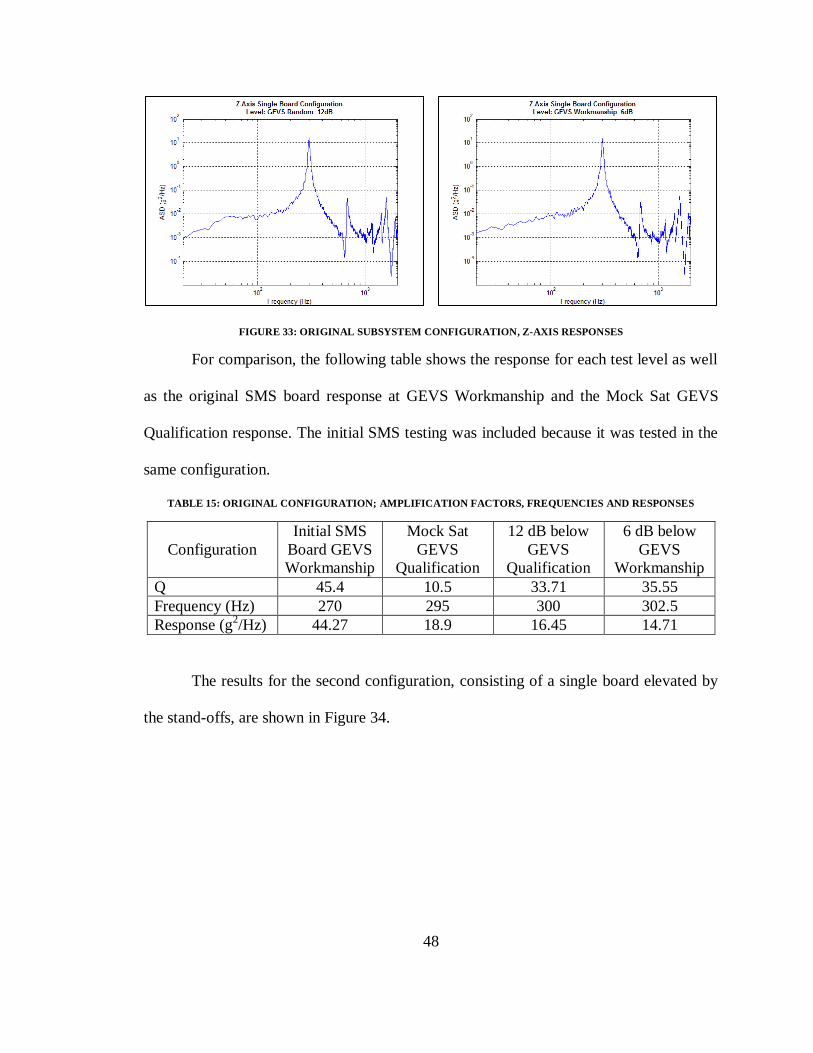
48
FIGURE 33: ORIGINAL SUBSYSTEM CONFIGURATION, Z-AXIS RESPONSES
For comparison, the following table shows the response for each test level as well
as the original SMS board response at GEVS Workmanship and the Mock Sat GEVS
Qualification response. The initial SMS testing was included because it was tested in the
same configuration.
TABLE 15: ORIGINAL CONFIGURATION; AMPLIFICATION FACTORS, FREQUENCIES AND RESPONSES
Configuration
Initial SMS
Board GEVS
Workmanship
Mock Sat
GEVS
Qualification
12 dB below
GEVS
Qualification
6 dB below
GEVS
Workmanship
Q 45.4 10.5 33.71 35.55
Frequency (Hz) 270 295 300 302.5
Response (g2/Hz) 44.27 18.9 16.45 14.71
The results for the second configuration, consisting of a single board elevated by
the stand-offs, are shown in Figure 34.

49
FIGURE 34: SINGLE BOARD WITH STANDOFFS, Z-AXIS RESPONSES
A slight decrease in amplification was noted for this configuration over the
original configuration, as seen in Table 16.
TABLE 16: SINGLE BOARD WITH STANDOFFS; AMPLIFICATION FACTORS, FREQUENCIES AND RESPONSES
Configuration Mock Sat GEVS
Qualification
12 dB below
GEVS
Qualification
6 dB below
GEVS
Workmanship
Q 10.5 30.05 33.75
Frequency (Hz) 295 282.5 282.5
Response (g2/Hz) 18.9 12.31 16.7
The responses from the final configuration, which consisted of two boards stacked
(SMS on top), are shown in Figure 35. This configuration was expected to offer damping
based on the added stiffness from the 52-pin connectors which attach between the boards.
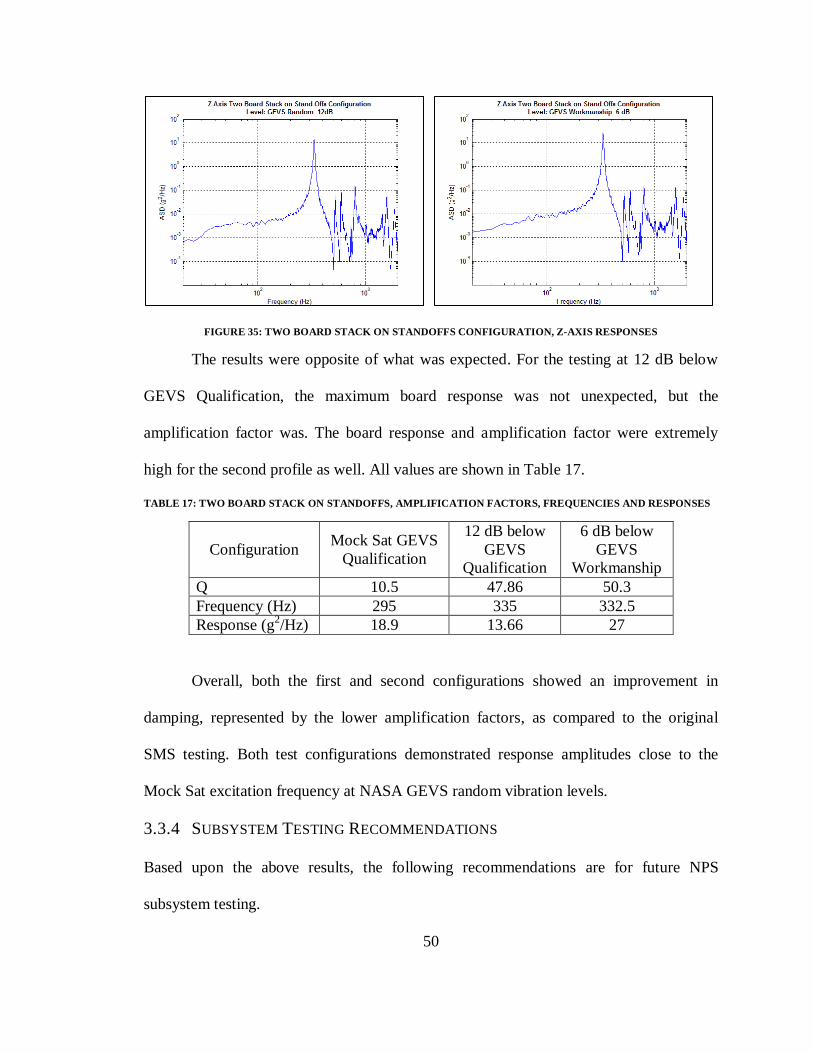
50
FIGURE 35: TWO BOARD STACK ON STANDOFFS CONFIGURATION, Z-AXIS RESPONSES
The results were opposite of what was expected. For the testing at 12 dB below
GEVS Qualification, the maximum board response was not unexpected, but the
amplification factor was. The board response and amplification factor were extremely
high for the second profile as well. All values are shown in Table 17.
TABLE 17: TWO BOARD STACK ON STANDOFFS, AMPLIFICATION FACTORS, FREQUENCIES AND RESPONSES
Configuration Mock Sat GEVS
Qualification
12 dB below
GEVS
Qualification
6 dB below
GEVS
Workmanship
Q 10.5 47.86 50.3
Frequency (Hz) 295 335 332.5
Response (g2/Hz) 18.9 13.66 27
Overall, both the first and second configurations showed an improvement in
damping, represented by the lower amplification factors, as compared to the original
SMS testing. Both test configurations demonstrated response amplitudes close to the
Mock Sat excitation frequency at NASA GEVS random vibration levels.
3.3.4 SUBSYSTEM TESTING RECOMMENDATIONS
Based upon the above results, the following recommendations are for future NPS
subsystem testing.
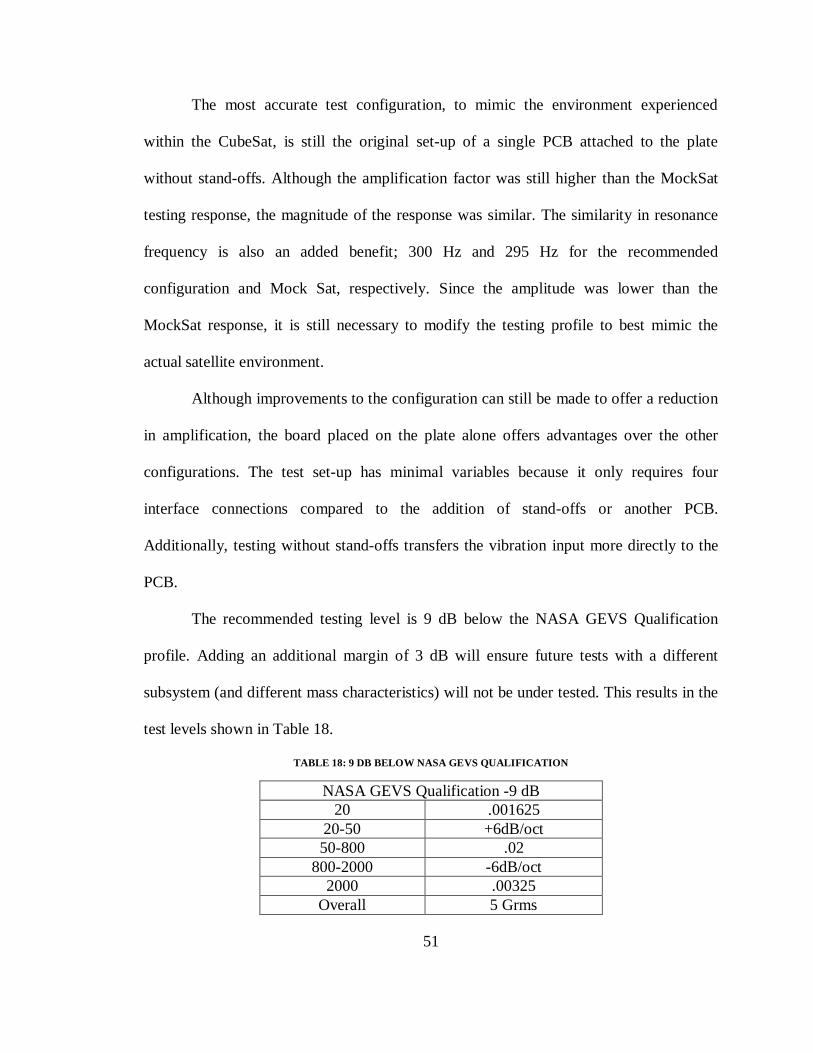
51
The most accurate test configuration, to mimic the environment experienced
within the CubeSat, is still the original set-up of a single PCB attached to the plate
without stand-offs. Although the amplification factor was still higher than the MockSat
testing response, the magnitude of the response was similar. The similarity in resonance
frequency is also an added benefit; 300 Hz and 295 Hz for the recommended
configuration and Mock Sat, respectively. Since the amplitude was lower than the
MockSat response, it is still necessary to modify the testing profile to best mimic the
actual satellite environment.
Although improvements to the configuration can still be made to offer a reduction
in amplification, the board placed on the plate alone offers advantages over the other
configurations. The test set-up has minimal variables because it only requires four
interface connections compared to the addition of stand-offs or another PCB.
Additionally, testing without stand-offs transfers the vibration input more directly to the
PCB.
The recommended testing level is 9 dB below the NASA GEVS Qualification
profile. Adding an additional margin of 3 dB will ensure future tests with a different
subsystem (and different mass characteristics) will not be under tested. This results in the
test levels shown in Table 18.
TABLE 18: 9 DB BELOW NASA GEVS QUALIFICATION
NASA GEVS Qualification -9 dB
20 .001625
20-50 +6dB/oct
50-800 .02
800-2000 -6dB/oct
2000 .00325
Overall 5 Grms

52
Ideally, future testing will also include use of two 52-pin headers attached to the
test apparatus and subsystem board. The minimal difference in the results for the one or
two board stack (with standoffs) demonstrated that the 52-pin headers anchored to the
satellite contribute significantly to the stiffness of the satellite configuration and
dramatically increase the damping (shown above by the decrease in amplification factor
for the Mock Sat configuration).
Another difference between the test set-up and the CubeSat configuration is the
use of mid-plane stand-offs. These small metal attachments connect the stacked
subsystem boards to the top of the CubeSat frame. The high amplification of the two-
board testing configuration demonstrated these attachments to the structure significantly
contribute to the constraint of the subsystem stack within the satellite. Therefore, if
further modifications were made, a clamped configuration should be considered.

53
4 NPS-SCAT QUALIFICATION AND FLIGHT TESTING
The NPS-SCAT EDU completed qualification level vibration testing and thermal-
vacuum testing during the summer of 2010. A summary of the EDU vibration testing is
presented with additional recommendations for the Flight Unit testing that should follow.
Detailed procedures and test plans can be referenced by NPS students on the SSAG
server, in the CubeSat folder.
4.1 NPS-SCAT ENGINEERING DEVELOPMENT UNIT (EDU)
The NPS-SCAT EDU vibration qualification test represented the first vibration test for
many of the NPS-SCAT subsystems. Although the Mock Sat did include many similar
subsystems, they were not operational, therefore only their structural integrity was
verified during the previous testing. Unlike the previous SMS testing, the EDU testing
included a fully functional payload with the Sinclair Sun Sensor.
4.1.1 QUALIFICATION TESTING
Preparation for qualification testing of NPS-SCAT included modification of the satellite
integration procedures to include torque values and staking compound placement. After
these additions, the entire process was extended to 3-days due to the drying time for the
staking compound on the fasteners and connectors.
After integration, the satellite completed a Comprehensive Functional Test (CFT)
to ensure all subsystems worked individually and as an integrated system. The CFT
included both indoor and outdoor testing of the satellite.
The original Cal Poly Test POD was used for the qualification test because no
requirements had been set forth by the integrating contractor regarding the testing

54
apparatus. In Figure 36, NPS-SCAT is shown in the Test POD before the top plate was
attached according to the Test POD Users Guide.21
FIGURE 36: NPS-SCAT EDU IN TEST POD
The test set-up for the EDU was different than prior testing because there was no
way to instrument the inside of the CubeSat. An inner accelerometer is preferred in order
to monitor the pre and post-test sine sweeps for changes which might indicate a broken
test item. A compromise was found by placing an accelerometer on the outside of the
CubeSat, after integration into the Test POD. The accelerometer can be seen in Figure 37,
it is the tri-axial accelerometer that is slightly recessed into the access port on the top of
the Test POD. This accelerometer was only monitored for change rather than the
magnitude of the response.

55
FIGURE 37: NPS-SCAT EDU ON SHAKE TABLE
The testing profile for the EDU vibration test was the NASA GEVS Qualification
level. The EDU was tested in all three axes and each random vibration qualification test
was encompassed by a pre and post-test .25g sine sweep. The results from the outer
accelerometer, placed on the Test POD are shown in Figures 38, 39 and 40.
The Test POD User‟s Guide does not identify a fundamental frequency for the Y-
Axis and the NPS EDU testing also showed this to be true.
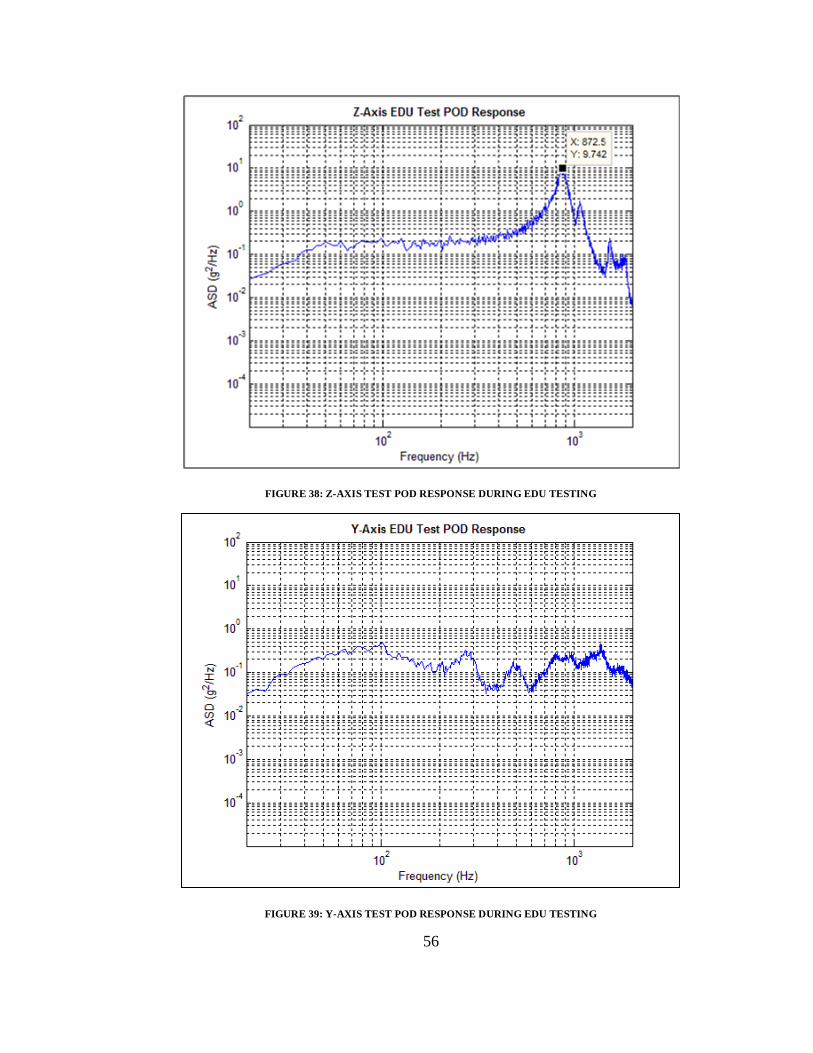
56
FIGURE 38: Z-AXIS TEST POD RESPONSE DURING EDU TESTING
FIGURE 39: Y-AXIS TEST POD RESPONSE DURING EDU TESTING

57
FIGURE 40: X-AXIS TEST POD RESPONSE DURING EDU TESTING
Initially, the NPS-SCAT EDU successfully passed the post-test CFT, but during
further functional testing an issue with the radio developed. Due to the uncertainty of the
cause of the malfunction, the satellite was de-integrated and inspected. It was found that
the cable to the patch antenna was actually damaged. The cable was staked to the bottom
part of the CubeSat structure, with a thick layer of the dried staking compound covering
the chord. Despite this protection, the slight motion of a sharp metal protrusion from the
bottom of the FM430 sliced into the staking compound and slightly into the cable
covering. For future use the protrusion was removed and the cable functioned properly
without the metal protruding into it.
The value of an EDU was demonstrated with this one testing anomaly. On many
other occasions it was also important to have the ability to remove and replace
58
subsystems and components, which offered further proof that an EDU allows a much
greater amount of flexibility in the CubeSat development process.
4.2 FLIGHT UNIT TESTING
The launch delays thus far have allowed an increased development and test time.
Unfortunately, each time there is a launch slip, the publication of the launch environment
and CubeSat requirements are further delayed as well. For this reason, the NASA GEVS
testing levels will be used for acceptance or proto-flight testing.
The choice between acceptance and proto-flight levels will not be determined
until the flight unit is fully integrated. The shorter duration acceptance testing
specification can be used in the case that the CubeSat has no major structural changes
from the NPS-SCAT EDU. It is unlikely any major modifications will take place,
however the Cal Poly beacon board was not available when the EDU was tested,
therefore that subsystem has not been qualified.
One option is to qualify the beacon board individually, using the modified testing
levels and configuration, and then use acceptance testing levels for the integrated
CubeSat. This would provide assurance that the beacon board can withstand qualification
levels and will not force the entire satellite to be tested at the proto-flight levels. Although
there is a scheduling consideration with this option, it does mitigate risks by identifying
any beacon board vibration issues prior to flight unit integration. Scheduling is a
consideration because the beacon board subsystem testing will require a three-axis test
with functional tests between axes.
The second option for flight unit testing is to substitute the beacon board in the
satellite and use proto-flight levels. Proto-flight testing levels are normally used for a

59
one-of-a-kind system when qualification is not an option, but in this case it would be used
because the beacon board has never been vibration tested. Qualification of the EDU
showed the structural integrity of the system and that does not change when the beacon
board is substituted for the previously tested board. Therefore, this option could be
utilized if there is limited time for testing due to late delivery of the new beacon board or
a change in the launch schedule.
Although the launch date and beacon board delivery are drivers behind the flight
unit build and test timeline, the other factor is the personnel turnover that is characteristic
of a university team. NPS does have the advantage of requiring a thesis to graduate,
which allows newer team members to reference the development of the satellite fairly
easily, but these documents are no substitute for learning from another engineer. At this
advanced stage in the satellite development it is to the team‟s advantage to have all
subsystems acceptance tested and ready for integration before key project engineers
graduate. The ideal situation involves the completion of system and environmental testing
before the end of March regardless of the launch date.
4.3.1 RECOMMENDED SATELLITE CONFIGURATION AND TEST LEVELS
The flight unit configuration of NPS-SCAT will be identical to the EDU except for the
substitution of the Cal Poly beacon board. The satellite will use the original Cal Poly Test
POD because the Test POD Mk III will not yet be available.
The vibration testing for NPS-SCAT will only take place after thorough
integrated testing. A Comprehensive Functional Test (CFT) is the minimum testing
necessary to ensure the satellite is operating as set forth in the KPPs. The applicable
NASA GEVS acceptance and proto-flight testing levels are defined earlier, in Figure 9.

60
5 CUBESAT VIBRATION RESPONSE TESTING
The underlying assumption of qualifying the NPS-SCAT CubeSat in the Cal Poly Test
POD is that the test environment is the same or worse than the qualification environment
within the P-POD Mk III.
Previous versions of the P-POD and Test POD had been tested22
, however the
newly re-designed Test POD Mk III had not been qualified or compared to the P-POD
Mk III during the time period in which NPS vibration testing was taking place. The
chance to further evaluate the NPS-SCAT testing methodology while also providing test
results to Cal Poly and the CubeSat community, allowed the Test POD Mk III and P-
POD Mk III response testing to take place at NPS. The opportunity to use the advanced
testing capabilities at NPS was an additional benefit because the CubeSat mass models
were instrumented inside the P-POD and Test POD rather than only instrumenting the
outer structure.
5.1 TEST POD MK. III CUBESAT RESPONSE TESTING
The objective of the Test POD Mk III testing is to record the response of the CubeSat
mass model and compare the data to the response of CubeSats within the P-POD.
5.1.1 TEST CONFIGURATION AND LEVELS
The Test POD Mk III was previously introduced and can be seen in Figure 41.

61
FIGURE 41: CAL POLY TEST POD MK III
A mass model was used to evaluate the Test POD, and two additional mass
models were also necessary for P-POD testing. The accelerometer placement for the Test
POD Mk III testing was in accordance with the following list:
o 2 Single axis control accelerometers
o 1 Tri-axial accelerometer on outer surface of 1U Mass Model
o 1 Tri-axial accelerometer on inner surface of 1U Mass Model
o 3 Single axis accelerometers on outer edges of Test POD
An example of the mass model and internal accelerometer placement is shown in Figure
42.

62
FIGURE 42: CUBESAT MASS MODEL AND EXAMPLE ACCELEROMETER PLACEMENT
The Test POD Mk III is integrated in accordance with the older Test POD User‟s
Guide for the time being. Modifications to the procedure were made to accommodate the
new set screws that must be inserted after the helicoils are adjusted.
The Test Pod and P-POD have similar hole patterns, which limit the way in which
the items can be attached to the vibration table. The holes are located on the bottom of
each item, therefore an oversized interface plate was used to accommodate both the Test
POD and the P-POD on the vibration table. The vibration table mounting holes can be
seen in the figure below, located on the flange created by the interface plate.

63
FIGURE 43: TEST POD MK III ON VIBRATION INTERFACE PLATE
For the horizontal testing axis the single interface plate is sufficient for attachment
to the slip table. However, in the vertical testing axis, the NPS shake table only has a
circular hole pattern. Therefore most test items require an additional interface plate to
accommodate the circular pattern. Due to the high use of the NPS vibration table, a
circular plate used by the Space Systems Academic Group (SSAG), was already available
for testing purposes. Only small modifications were made to allow for attachment of the
Test Pod interface plate.
NASA GEVS Qualification test levels were used, however the testing sequence
was slightly different than previous tests. The modified sequence was because Cal Poly
requested the Test POD Mk III undergo two random vibration tests to see if there was
any change in the sine sweep, and therefore the satellite response, after the second
64
random vibration test. A sine sweep was completed before and after testing, with an
additional test in between the random vibration tests.
5.1.2 RESULTS
Due to the large amount of data from this testing sequence, only two graphs are shown
for each shake axis. The random vibration response graphs shown represent the highest
response, or worst case, of the two tests completed. The sine sweep data shown is the best
representative of the three sweeps done. In this testing, a dissimilar first sine sweep was
not uncommon due to the space available for the satellite to shift within the Test POD,
however the second and third sine sweeps generally matched and indicated the satellite
had “settled” into a position.
The Z-Axis results are presented first in Figure 44 and Figure 45. The random
vibration GEVS Qualification test showed a peak response at 815 Hz and 15.22 g2/Hz
based on the Z-Axis output of the tri-axial accelerometer located within the mass model.

65
FIGURE 44: Z-AXIS TEST POD MK III GEVS QUALIFICATION MASS MODEL RESPONSE
The .25g sine sweep in the Z-Axis indicated a mode at 882 Hz and 4.296 g2/Hz,
as seen in Figure 45.

66
FIGURE 45: Z-AXIS TEST POD MK III SINE SWEEP MASS MODEL RESPONSE
A summary of all the Test POD Mk III results are shown in Table 19.
TABLE 19: Z-AXIS TEST POD MK III RESULTS
Test Sine
Sweep 1
GEVS
Random Qual
1
Sine
Sweep 2
GEVS
Random Qual
2
Sine
Sweep 3
Frequency 887 820 882.7 815 882.7
Response 4.23 12.04 4.29 15.22 4.221
The Y-Axis Test POD results show a much lower response than the Z-Axis data.
For the random vibration test the mass model response peaked at 702.5 Hz and 2.656
g2/Hz.

67
FIGURE 46: Y-AXIS TEST POD MK III GEVS QUALIFICATION MASS MODEL RESPONSE
The sine sweep for the Y-Axis of the Test POD Mk III indicated a mode at 798.4
Hz and a response of 7.23 g2/Hz.

68
FIGURE 47: Y-AXIS TEST POD MK III SINE SWEEP MASS MODEL RESPONSE
All of the results for the Y-Axis can be compared in Table 20.
TABLE 20: Y-AXIS TEST POD MK III RESULTS
Test Sine Sweep 1 GEVS Random
Qual 1
Sine
Sweep 2
GEVS Random
Qual 2
Sine
Sweep 3 Peak 1 Peak 2
Frequency 599.2 917.2 695 817 702.5 798.4
Amplitude 2.18 3.808 2.63 5.61 2.66 7.23
Finally, the X-Axis data is shown below for the random vibration testing. The X-
Axis response was at a much higher frequency, 1150 Hz, and indicated a response of 4.44
g2/Hz.
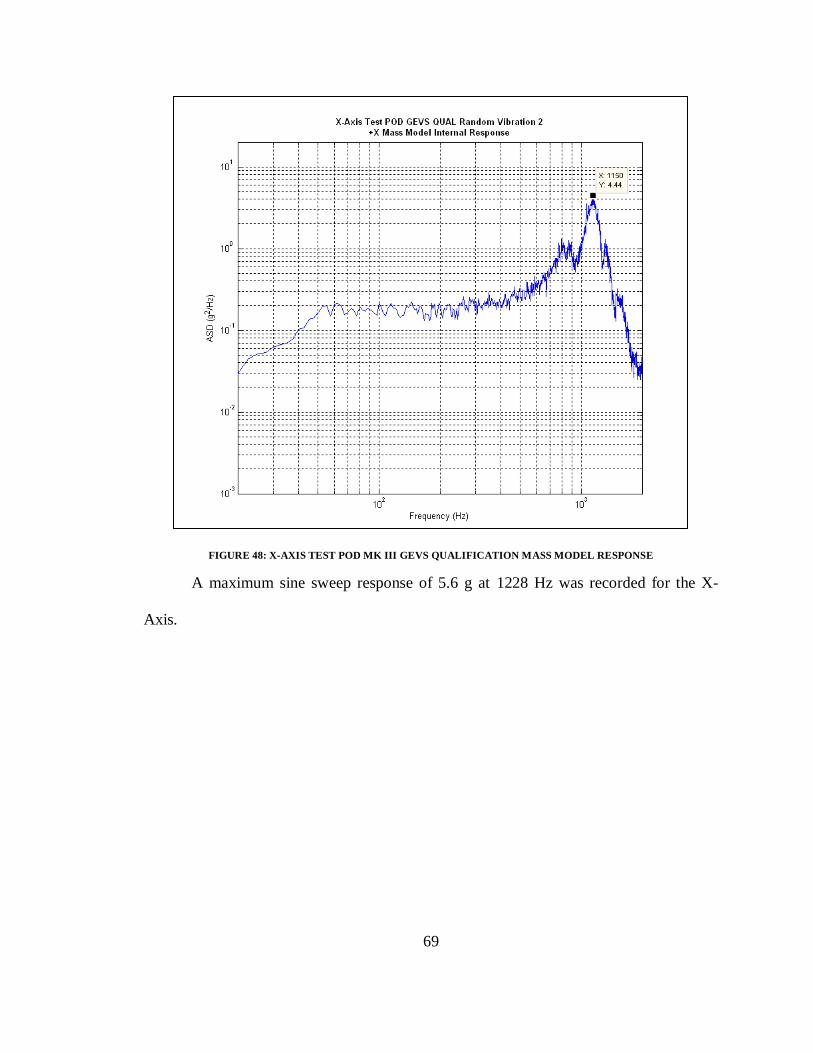
69
FIGURE 48: X-AXIS TEST POD MK III GEVS QUALIFICATION MASS MODEL RESPONSE
A maximum sine sweep response of 5.6 g at 1228 Hz was recorded for the X-
Axis.

70
FIGURE 49: X-AXIS TEST POD MK III SINE SWEEP MASS MODEL RESPONSE
Table 21 shows a summary of the X-Axis testing results for the Test POD Mk III.
TABLE 21: X-AXIS TEST POD MK III RESULTS
Test Sine
Sweep 1
GEVS Random
Qual 1
Sine
Sweep 2
GEVS Random
Qual 2
Sine
Sweep 3
Frequency 1187 1140 1234 1150 1228 Hz
Amplitude 6.68 3.44 4.95 4.44 5.6 g
Another important factor in this testing, which was not represented by the
accelerometer data, was the use of the newly-added set screws. There was no indication
of the spring plungers loosening during testing, so they did act as intended during the
vibration testing.

71
One drawback of using the set screws however, was the evidence that the spring
plunger threads were slightly damaged after testing. This was not initially seen by the Cal
Poly engineers when they threaded the set screws in and took them out for a fit- check,
therefore it was a result of the loads on the spring plungers during vibration and the
resulting interaction between the spring plungers and set screws. The Cal Poly CubeSat
team will determine if further testing and/or modifications are necessary.
5.2 P-POD MK III CUBESAT RESPONSE TESTING
Previous modeling and testing of the P-POD Mk III was completed by Wenschel Lan and
documented in her Cal Poly thesis, “Redesign and Modal Analysis of the Poly
Picosatellite Orbital Deployer.”17
At that time, the modes of the P-POD structure were
identified and the new design of the P-POD Mk III was qualified. The additional data
collected for this project was necessary for comparison of the P-POD Mk III and Test
POD Mk III because there was no data regarding the response of the mass model(s)
within the test items.
In addition, instrumentation was placed on all three individual mass models
within the P-POD to record any differences in the CubeSat‟s responses based upon the
satellite‟s placement in the deployer.
5.2.1 TEST CONFIGURATION AND LEVELS
To record the response of each mass model, a tri-axial accelerometer was placed on each
one. The mass model that was used for Test POD Mk III testing and for P-POD testing
utilized the same accelerometer for the entirety of the testing and was never removed or
re-glued to ensure the measurements were comparable between the different test items.
Figure 50 shows the P-POD and mass models during integration.

72
FIGURE 50: CAL POLY P-POD AND MASS MODELS DURING INTEGRATION
The following accelerometers were used for testing:
o 2 Control Accelerometers (single axis), on interface plate
o 1 Single Axis Accelerometer attached externally in the shake axis
o 1 Single Axis Accelerometer attached to P-POD Door
o 3 Tri-axial Accelerometers: One per 1U Mass Model
The P-POD was tested at GEVS Qualification levels and ramped up in 3 dB
increments to record the response as the levels increased. The P-POD is shown attached
to the shake table in Figure 51.
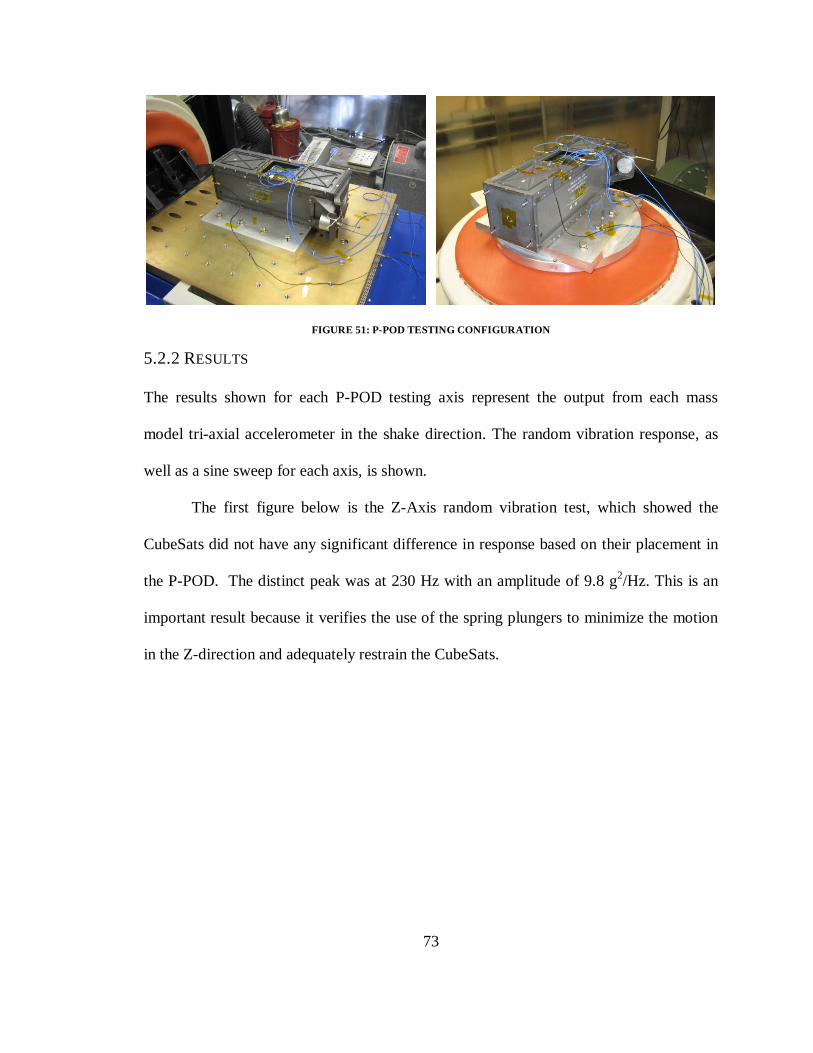
73
FIGURE 51: P-POD TESTING CONFIGURATION
5.2.2 RESULTS
The results shown for each P-POD testing axis represent the output from each mass
model tri-axial accelerometer in the shake direction. The random vibration response, as
well as a sine sweep for each axis, is shown.
The first figure below is the Z-Axis random vibration test, which showed the
CubeSats did not have any significant difference in response based on their placement in
the P-POD. The distinct peak was at 230 Hz with an amplitude of 9.8 g2/Hz. This is an
important result because it verifies the use of the spring plungers to minimize the motion
in the Z-direction and adequately restrain the CubeSats.
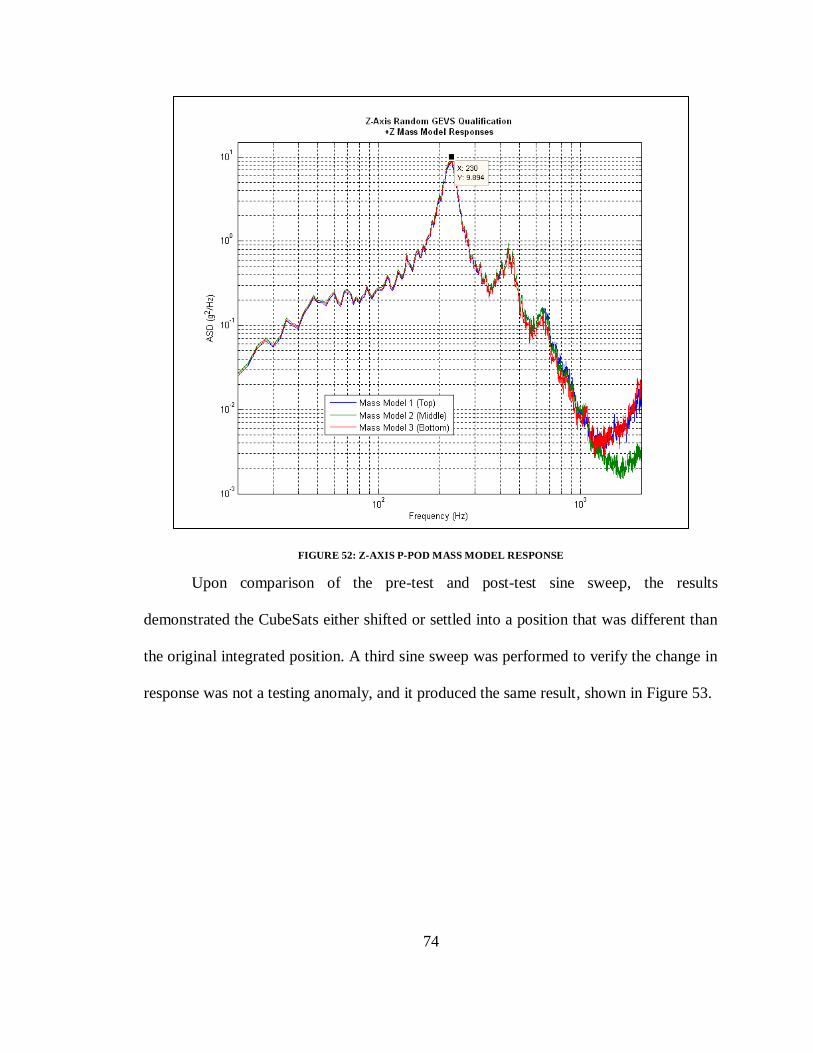
74
FIGURE 52: Z-AXIS P-POD MASS MODEL RESPONSE
Upon comparison of the pre-test and post-test sine sweep, the results
demonstrated the CubeSats either shifted or settled into a position that was different than
the original integrated position. A third sine sweep was performed to verify the change in
response was not a testing anomaly, and it produced the same result, shown in Figure 53.
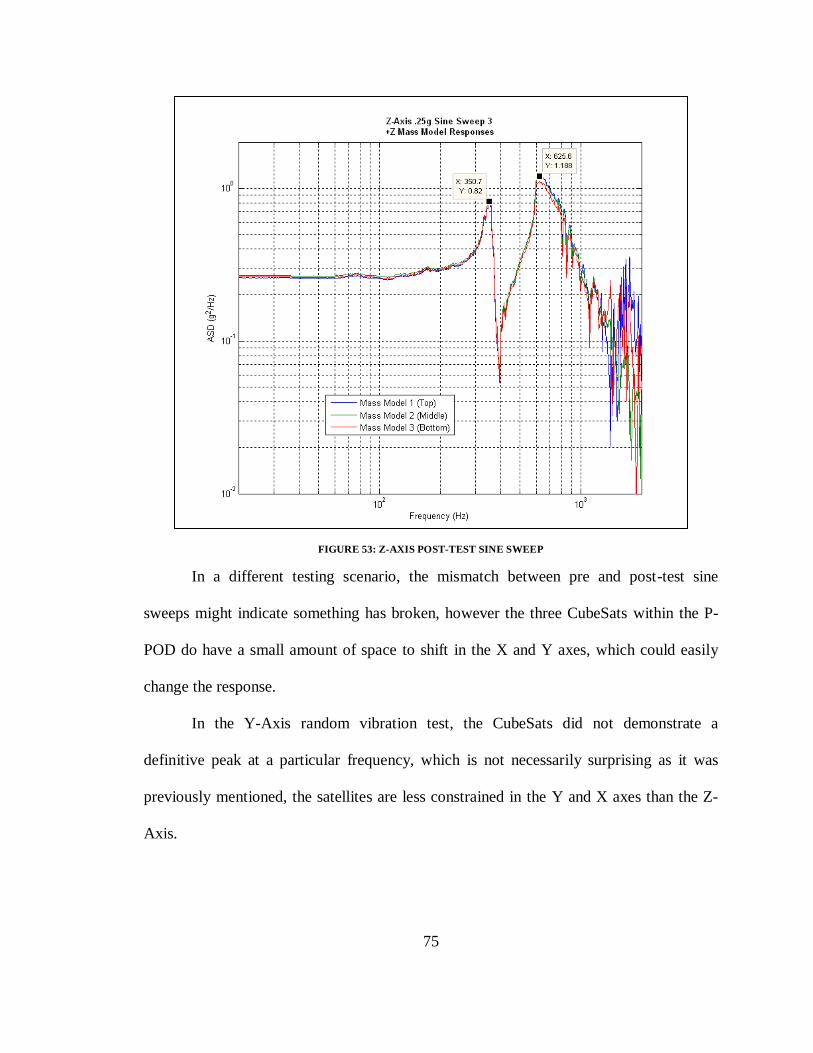
75
FIGURE 53: Z-AXIS POST-TEST SINE SWEEP
In a different testing scenario, the mismatch between pre and post-test sine
sweeps might indicate something has broken, however the three CubeSats within the P-
POD do have a small amount of space to shift in the X and Y axes, which could easily
change the response.
In the Y-Axis random vibration test, the CubeSats did not demonstrate a
definitive peak at a particular frequency, which is not necessarily surprising as it was
previously mentioned, the satellites are less constrained in the Y and X axes than the Z-
Axis.

76
FIGURE 54: Y-AXIS P-POD MASS MODEL RESPONSES
The mass models did show a similar response until reaching 107.5 Hz (0.64
g2/Hz), where the top mass model shows a slightly different and higher response than the
other two mass models.
The pre and post-test sine sweeps for the Y-Axis also did not match, but again the
third sine sweep to confirm the change was almost an exact match (refer to Figure 55).
The sweep indicated a system mode at 243.8 Hz with a response of 3.6 g2/Hz.

77
FIGURE 55: Y-AXIS POST-TEST SINE SWEEP
The X-Axis further showed that the individual CubeSats‟ responses to the
vibration environment were similar to each other. The peak response for random
vibration was at 297.5 Hz, with an amplitude of 2.3 g2/Hz.
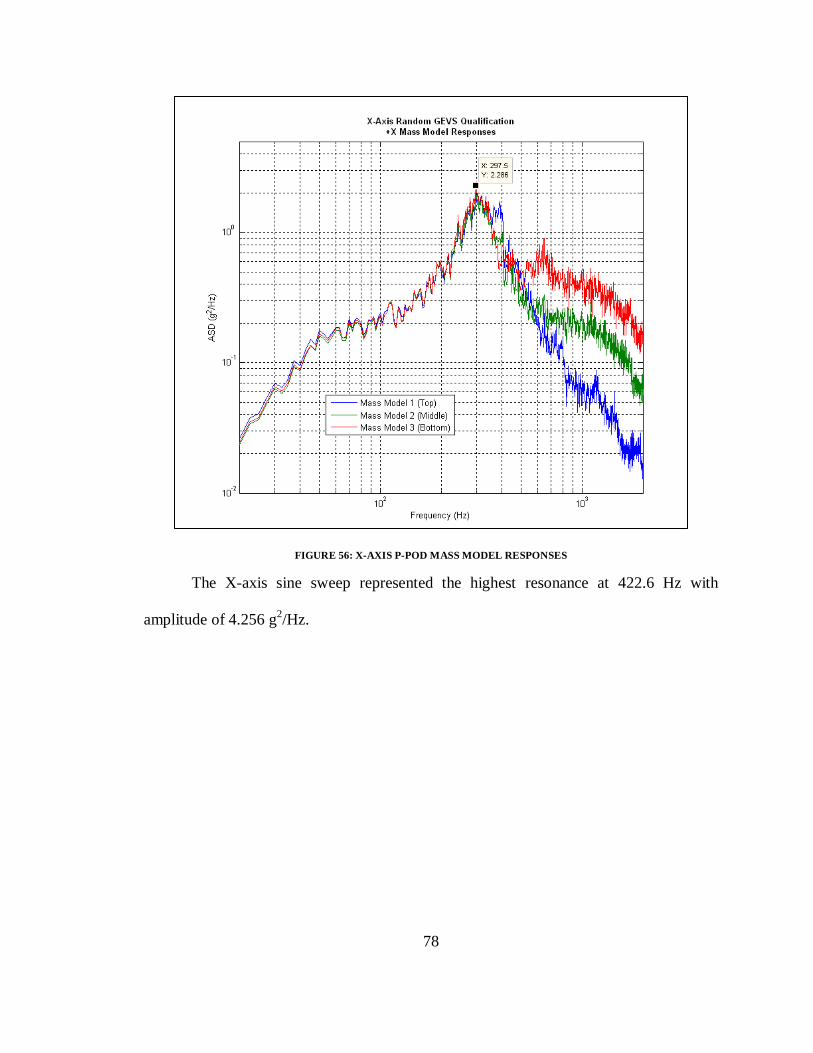
78
FIGURE 56: X-AXIS P-POD MASS MODEL RESPONSES
The X-axis sine sweep represented the highest resonance at 422.6 Hz with
amplitude of 4.256 g2/Hz.
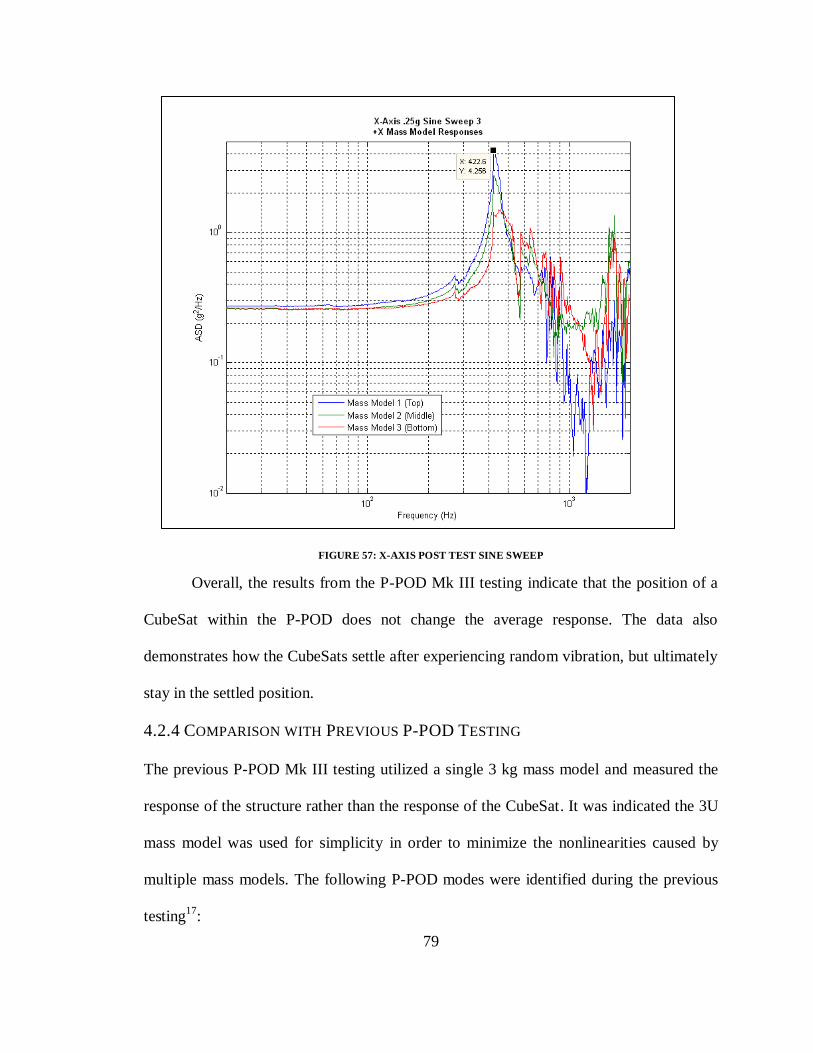
79
FIGURE 57: X-AXIS POST TEST SINE SWEEP
Overall, the results from the P-POD Mk III testing indicate that the position of a
CubeSat within the P-POD does not change the average response. The data also
demonstrates how the CubeSats settle after experiencing random vibration, but ultimately
stay in the settled position.
4.2.4 COMPARISON WITH PREVIOUS P-POD TESTING
The previous P-POD Mk III testing utilized a single 3 kg mass model and measured the
response of the structure rather than the response of the CubeSat. It was indicated the 3U
mass model was used for simplicity in order to minimize the nonlinearities caused by
multiple mass models. The following P-POD modes were identified during the previous
testing17
:
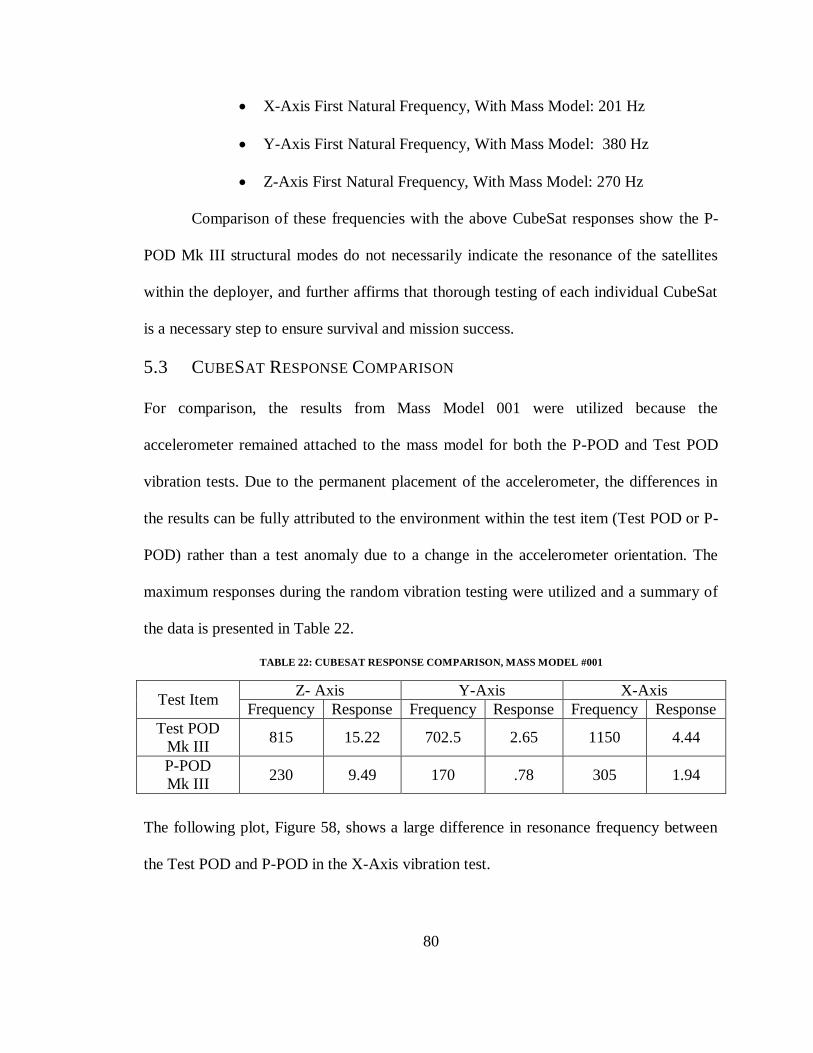
80
X-Axis First Natural Frequency, With Mass Model: 201 Hz
Y-Axis First Natural Frequency, With Mass Model: 380 Hz
Z-Axis First Natural Frequency, With Mass Model: 270 Hz
Comparison of these frequencies with the above CubeSat responses show the P-
POD Mk III structural modes do not necessarily indicate the resonance of the satellites
within the deployer, and further affirms that thorough testing of each individual CubeSat
is a necessary step to ensure survival and mission success.
5.3 CUBESAT RESPONSE COMPARISON
For comparison, the results from Mass Model 001 were utilized because the
accelerometer remained attached to the mass model for both the P-POD and Test POD
vibration tests. Due to the permanent placement of the accelerometer, the differences in
the results can be fully attributed to the environment within the test item (Test POD or P-
POD) rather than a test anomaly due to a change in the accelerometer orientation. The
maximum responses during the random vibration testing were utilized and a summary of
the data is presented in Table 22.
TABLE 22: CUBESAT RESPONSE COMPARISON, MASS MODEL #001
Test Item Z- Axis Y-Axis X-Axis
Frequency Response Frequency Response Frequency Response
Test POD
Mk III 815 15.22 702.5 2.65 1150 4.44
P-POD
Mk III 230 9.49 170 .78 305 1.94
The following plot, Figure 58, shows a large difference in resonance frequency between
the Test POD and P-POD in the X-Axis vibration test.

81
FIGURE 58: X-AXIS MASS MODEL RESPONSE COMPARISON
Due to the large discrepancy in resonance frequency, a transfer function was calculated to
define the difference between the two responses. The transfer function shown is the
response of the Test POD divided by the response of the P-POD. Although the large
discrepancy was identified after testing was completed, the data will be utilized to tailor
future Test POD vibration tests.
The X-Axis transfer function is shown in Figure 59. It will be necessary to increase the
input to the Test POD in the vicinity of 300 Hz and lower the input in the vicinity of 1150
Hz.
82
FIGURE 59: X-AXIS P-POD AND TEST POD TRANSFER FUNCTION
The Y-Axis response comparison is shown in Figure 60. In this axis, the Test POD
results again diverged from the P-POD environment in the 300 to 1000 Hz range.

83
FIGURE 60: Y-AXIS MASS MODEL RESPONSE COMPARISON
Figure 61 illustrates the largest discrepancy is at approximately 700 Hz. For the Test
POD to represent a qualification environment which is greater than the P-POD, the
transfer function plots would all be above 1. At 1, the Test POD would be the same as the
P-POD, therefore some above 1 shows Test POD as a worse environment.

84
FIGURE 61: Y-AXIS P-POD AND TEST POD TRANSFER FUNCTION
In the Z-Axis a similar upward shift in the Test POD frequency as compared to the P-
POD frequency was recorded. Figure 62 illustrates maxima at similar magnitude, but
different frequencies of 815 Hz and 230 Hz respectively.

85
FIGURE 62: Z-AXIS MASS MODEL RESPONSE COMPARISON
The Z-Axis transfer function further illustrates the strong response of the Test POD at
higher frequencies than the P-POD. The challenge in tailoring the Test POD profile is
modifying the input to encompass the P-POD maxima. When the Test POD has a greater
response, the input can be scaled down in that frequency range, but when the P-POD
represents the higher response it is not as simple to mimic the response at the correct
frequency.

86
FIGURE 63: Z-AXIS P-POD AND TEST POD TRANSFER FUNCTION
Based on the comparison, the Test POD Mk III will need structural modifications and/or
further testing based on a tailored profile.
With the data presented here, Cal Poly can evaluate each axis of the Test POD
individually by running a profile and then immediately comparing the data to the P-POD
results. If the transfer function does not present the desired results, the test profile can be
modified and further testing can be completed in a time effective way. With better
knowledge of the test items, this would have been the original testing format.
Additionally, Cal Poly now has the ability to complete this evaluation in-house because
the Test POD instrumentation only includes a single tri-axial accelerometer.

87
Though the Test POD was not able to be fully qualified based on this comparison, the
environment recorded from within the P-POD can be used for future development and
testing.
88
6 CONCLUSIONS AND FUTURE WORK
6.1 CONCLUSIONS
The two most significant contributions of this thesis are the long term benefits of
developing in-house CubeSat testing capabilities at NPS and the evaluation of a new
CubeSat Test POD Mk III for use throughout the CubeSat community.
6.1.1 SUBSYSTEM TESTING & SATELLITE QUALIFICATION
The vibration testing that was completed in order to qualify the NPS-SCAT CubeSat has
laid the foundation for Flight Unit testing as well as future CubeSat testing. The plans and
procedures developed for NPS-SCAT are all available to future NPS students and will
allow new missions to spend time on payload development rather than test development.
Significant progress has also been made towards defining a subsystem testing
configuration that more closely represents the environment inside of a CubeSat. Although
a new payload board will have different characteristics than the NPS-SCAT SMS,
tailoring of the suggested profile will at least minimize over-testing in the event that
further analysis is not possible.
6.1.3 CUBESAT RESPONSE TESTING IN THE TEST POD MK III AND P-POD MK
III
Through CubeSat response testing inside of the new Test POD Mk III and the P-POD Mk
III, a comparison of the environments was completed. The data showed that the Test
POD vibration profile must be modified or the Test POD itself must have structural
modifications in order to accurately represent the P-POD at qualification levels. The P-
POD results shared with Cal Poly will allow further testing to be completed.
89
The P-POD testing verified the similarity in the responses of the individual mass
models, which confirms there is not preferential position within the P-POD.
6.2 FUTURE WORK
Multiple launch delays have extended the development and testing of NPS-SCAT,
therefore the environmental testing of the flight unit is not complete at this time.
An additional project, to include an accelerometer on a CubeSat subsystem board,
was also researched. Although one sensor was acquired, the compressed development
timeline was found to be unrealistic based on the need for outside design and
manufacturing.
6.2.1 NPS-SCAT BEACON BOARD AND FLIGHT UNIT TESTING
The most critical future work for students at NPS is to complete the qualification of the
Cal Poly Beacon Board and the Flight Unit environmental testing – both vibration and
thermal-vacuum. It is essential to continue the satellite integration and testing regardless
of launch date because the personnel most familiar with the satellite are quickly
graduating and unexpected issues are most likely to appear during testing.
Thorough documentation and test plans are available to new students, and SSAG
staff are always willing to support, however there is no substitution for learning from the
person who wrote the procedure or designed the subsystem.
Upon arrival at NPS, the Cal Poly Beacon Board will need to undergo vibration
qualification testing according to the newly defined subsystem testing configuration and
levels. It may also need to complete individual thermal-vacuum testing if required for
90
radio testing. After integration the satellite will undergo vibration testing in the Test POD
at either proto-flight or acceptance levels.
6.2.2 ACCELEROMETER BOARD DEVELOPMENT
NPS is also interested in the development of a CubeSat subsystem board that could act as
a launch recorder, a transportation vibration recorder, or a vibration testing recorder.
A new Analog Devices accelerometer, the Digital Tri-Axial Vibration Sensor
(ADIS16223) was acquired because of its high vibration sensing range of ±70 g. The
original plan was to develop a stand-alone board that would not only fit in a NPS
CubeSat, but could also be used autonomously. After the board was proposed it became
more obvious the development and manufacture would not be complete in time for the
testing endeavors addressed in this thesis. The accelerometer is currently at NPS and
there are two obvious steps toward building the board mentioned above. First, basic
characterization of the accelerometer is necessary. This would require an external power
source and the necessary software to interface with the sensor. The second task is
identifying the parts, including a microprocessor, memory, and batteries in order to lay
out the circuitry for a stand-alone board.
6.2.3 TEST POD
For Test POD evaluation to be complete, another three axis test must be completed with a
modified profile. Additionally, the use of set screws must be reevaluated based upon the
spring plunger damage shown in the completed tests.
91
LIST OF REFERENCES
1Cal Poly CubeSat Program. CubeSat Design Specification, Rev. 12, 2009.
2California Polytechnic State University Satellite Project. PolySat. 1999-2009.
http://www.polysat.calpoly.edu (accessed November 2010).
3Cal Poly CubeSat Program. Poly Picosatellite Orbital Deployer Mk III ICD, 2007.
4 Kramer, H.J., Cracknell, A.P., An Overview of Small Satellites in Remote Sensing,
International Journal of Remote Sensing, 2008.
5Kitts, C., et al., “Flight Results from the GeneSat Biological Microsatellite Mission,”
Proceedings of the 21st Annual AIAA/USU Conference on Small Satellites, Logan UT,
2007.
6Radio Aurora Explorer, Mission Overview. http://rax.engin.umich.edu/?page_id=291
(accessed November 2010).
7 Newton, K., “Sailing Among the Stars,” Marshall Space Flight Center, August 17,
2010. http://www.nasa.gov/mission_pages/smallsats/10-109.html.
8”The MAST Experiment Blog: A Low-Cost Picosat Experiment to Demonstrate Space
Tether Technologies,” May 7, 2007. http://www.tethers.com/MAST_Blog.html.
9 Swartwout, M. A., “The Role of Universities in Small Satellite Research,” Space
Systems Development Laboratory, Stanford University, 1997.
10Naval Postgraduate School, “Key Performance Parameters,” March 2010.
11Mortensen, C., “NPS-SCAT; Communications System Design, Test, and Integration of
NPS‟s First CubeSat,” Master‟s Thesis, Naval Postgraduate School, 2010.
12 Liftoff of Falcon 1 RazakSAT Mission. http://www.spacex.com/photo_gallery.php.

92
13Space Exploration Technologies, “Falcon 1 Launch Vehicle Payload User‟s Guide”,
Rev 7, 2008.
14 White, J., Wright, C., “Test Like You Fly: A Risk Management Approach,” Aerospace
Corporation, Space Systems Engineering and Risk Management Symposium, 2005.
15NASA Goddard Space Flight Center, “General Environmental Verification Standard,”
GSFC-STD-7000, 2005.
16Driscoll, S., Kaushish, V., NPSCuL Vibration Testing Procedure, Rev 0, 2010.
17Lan, Wenschel., “Redesign and Modal Analysis of the Poly Picosatellite Orbital
Deployer,” Master‟s Thesis, Cal Poly San Luis Obispo Aerospace Engineering
Department, 2008.
18National Aeronautics and Space Administration, Payload Vibroacoustic Test Criteria,
NASA-STD-7001, Goddard Space Flight Center: NASA GSFC, 1996.
19Forgrave, John C., Man, Kin F., Newell, James M., “Acoustic and Random Vibration
Test Tailoring for Low-Cost Missions,” Proceedings of the 44th Institute of
Environmental Sciences Annual Technical Meeting, Phoenix, AZ, 1998.
20Wijker, J. Jaap., Mechanical Vibrations in Spacecraft Design, Springer-Verlag, Berlin
Heidelberg New York, 2004.
21Cal Poly CubeSat Program. Test POD User‟s Guide, Revision 6, 2006.
22Bashbush, V., “Characterization of the Internal and External Environments of the
CubeSat P-POD and Test Pod,” Master‟s Thesis, Cal Poly San Luis Obispo Aerospace
Engineering Department, 2004.

93
APPENDIX A: CUBESAT STANDARD

94
APPENDIX B: AMPLIFICATION FACTOR CALCULATION
From “Mechanical Vibrations in Spacecraft Design” by J. Jaap Wijker:
The half power method estimates the modal viscous damping, , by measuring the
frequency increment, , at the half power point.
Modal viscous damping, , is
To find the amplification factor, it is known that
Therefore

95
APPENDIX C: SUBSYSTEM TEST RESULTS
Z No Standoffs Qual -12dB
Z No Standoffs Work -6dB
Input Spectrum (g^2/Hz) 0.01 0.01
Average Value of Peak(g^2/Hz) 16.45 14.71
3dB below Peak Value (g^2/Hz) 8.24 7.37
Bandwidth @ 3dB Below (Hz) 8.90 8.51
Grms 12.10 11.19
Static G's (g) 36.30 33.57
Resonant Frequency (Hz) 300.00 302.50
Q factor (Frequency Method) 33.71 35.55
Z With Standoffs Qual -12dB
Z With Standoffs Work -6dB
Input Spectrum (g^2/Hz) 0.01 0.01
Average Value of Peak(g^2/Hz) 12.30 16.70
3dB below Peak Value (g^2/Hz) 6.16 8.37
Bandwidth @ 3dB Below (Hz) 9.40 8.37
Grms 10.75 11.82
Static G's (g) 32.26 35.47
Resonant Frequency (Hz) 282.50 282.50
Q factor (Frequency Method) 30.05 33.75
Z With board and Standoffs Qual -12 dB
Z With Board and Standoffs Work -6dB
Input Spectrum (g^2/Hz) 0.01 0.01
Average Value of Peak(g^2/Hz) 13.66 27.00
3dB below Peak Value (g^2/Hz) 6.85 13.53
Bandwidth @ 3dB Below (Hz) 7.00 6.61
Grms 9.78 13.36
Static G's (g) 29.34 40.08
Resonant Frequency (Hz) 335.00 332.50
Q factor (Frequency Method) 47.86 50.30