development of crash reduction factors
TRANSCRIPT

Development of Crash Reduction Factors
Peter W. Hovey, PhD
University of Dayton
Mashrur Chowdhury, PhD Clemson University
Prepared for the Ohio Department of Transportation
Office of Research and Development
State Job Number 14801(0)
September 2005

Form DOT F 1700.7 (8-72) Reproduction of completed pages authorized
12. Sponsoring Agency Name and Address
Ohio Department of Transportation
1980 West Broad Street
Columbus, Ohio 43223
9. Performing Organization Name and Address
University of Dayton
300 College Park Dr.
Dayton, OH 45469
4. Title and subtitle
Development of Crash Reduction Factors 7. Author(s)
Dr. Peter Hovey
Dr. Mashrur (Ronnie) Chowdhury, P.E.
13. Type of Report and Period Covered
15. Supplementary Notes
14. Sponsoring Agency Code
6. Performing Organization Code
8. Performing Organization Report No.
10. Work Unit No. (TRAIS)
11. Contract or Grant No.
14801(0)
1. Report No.
FHWA/OH-2005/12
2. Government Accession No. 3. Recipient's Catalog No.
5. Report Date
September 2005
16. Abstract
Crash reduction factors are used to identify and prioritize the most effective safety improvement measures, and prioritize and allocate available resources optimally for a highway safety improvement project. Simple before-and after analysis does account for the regression-to-the-mean bias. This research employs an Empirical Bayes (EB) methodology that overcomes the regression-to-the-mean property that is encountered in traditional before- and after analysis. Traffic, geometric and crash data for both the treatment and comparison sites were collected from Ohio in developing the crash reduction factors. Using data collected from Ohio, the EB methodology was applied in developing crash reduction factors for the following improvement categories:add a two-way left turn lane, install a median barrier, flatten slope and remove guardrail, remove or relocate a fixed object, flatten vertical curve, providing highway lighting and close median opening.
18. Distribution Statement
No restrictions. This document is available to the
public through the National Technical Information
Service, Springfield, Virginia 2216119. Security Classif. (of this report)
Unclassified20. Security Classif. (of this page)
Unclassified21. No. of Pages
8622. Price
17. Key Words
Crash Reduction Factors, Empirical Bayes, Safety
i
Development of Crash Reduction Factors
Final Repor t
By:
Peter W. Hovey
Department of Mathematics
University of Dayton
and
Mashrur Chowdhury
Department of Civil Engineer ing
Clemson University
Acknowledgement: Prepared in cooperation with the Ohio Department of Transportation and the U.S. Department of Transportation, Federal Highway Administration.
Disclaimer: The contents of this repor t reflect the views of the authors who are responsible for the facts and the accuracy of the data presented herein. The contents do not necessar ily reflect the official views or policies of the Ohio Department of Transportation or the Federal Highway Administration. This repor t does not constitute a standard, specification or regulation.

ii
TABLE OF CONTENTS
1. Introduction.................................................................................................................1
2. L iterature Review on CRFs.......................................................................................2
2.1 Upgrade pavement markings--general ..................................................................2
2.2 Install raised pavement markers, locations & sections.........................................2
2.3 Install left turn bay & extra pavement without signal...........................................3
2.4 Upgrade existing flasher ...........................................................................................3
2.5 Install flasher.........................................................................................................3
2.6 Upgrade existing signal - general .........................................................................3
2.7 Install traffic signal - all types ..............................................................................4
2.8 Add left turn phase with new left turn lane............................................................4
2.9 Add left turn phase with existing left turn lane.....................................................4
2.10 Add left turn phase without left turn lane............................................................4
2.11 Install rumble strips .............................................................................................4
2.12 Upgrading Post-mounted signals to Mast-mounted..............................................5
2.13 Upgrading Bidirectional Median Crossovers to Directional ................................5
2.14 Upgrading Intersections into Roundabouts...........................................................5
2.15 Seasonally Changing Speed Limits......................................................................6
3. Methodology ................................................................................................................8
3.1 Statistical Considerations for Evaluating Crash Reduction Factors.....................8
3.2 Empirical Bayes Estimation..................................................................................8
3.3 Multivariate Modeling........................................................................................10
4. Data Collection ..........................................................................................................14
5. Modeling & Analysis.................................................................................................15
5.1 Add Two-way Left Turn Lane............................................................................15
5.2 Install Median Barrier .........................................................................................16
5.3 Flatten Slope, Remove Guardrail ........................................................................17
5.4 Remove/Relocate Fixed Object ..........................................................................18
5.5 Flatten Vertical Curve.........................................................................................18
5.6 Provide Interchange Lighting .............................................................................19
5.7 Close Median Opening .......................................................................................21
5.8 Computed CRFs..................................................................................................23
iii
6. Conclusions and Recommendations........................................................................24
7. References..................................................................................................................25
APPENDIX A - C++ Program for Data Extraction.....................................................A-1
APPENDIX B – EB Modeling Steps: Add Two-Way Left Turn Lanes......................B-1
APPENDIX C – EB Modeling Steps: Install Median Barriers ...................................C-1
APPENDIX D – EB Modeling Steps: Flatten Slope, Remove Guardrail ....................D-1
APPENDIX E – EB Modeling Steps: Remove/Relocate Fixed Objects..................... E-1
APPENDIX F – EB Modeling Steps: Flatten Vertical Curve......................................F-1
APPENDIX G – EB Modeling Steps: Provide Interchange Lighting.........................G-1
APPENDIX H – Summary of Selected Studies...........................................................H-1

iv
LIST OF ABBREVIATIONS
CRF Crash Reduction Factor
EB Empirical Bayes
µλ Mean of crash rates
σ2λ Variance of crash rates
µNB Mean of the negative binomial distribution
σNB2 Variance of the negative binomial distribution
K Site count
1
1. Introduction
Crash reduction factors (CRFs) represent the proportion of crashes that are expected to be eliminated from a site as a result of receiving a specific spot improvement(s). CRFs are used to identify and prioritize the most effective safety improvement measures and prioritize and allocate available resources optimally for a highway safety project. Crash reduction factors, which are based on previous research and field studies of before- and after crash statistics, need to be revised and updated periodically to reflect the most current knowledge regarding the effectiveness of various highway improvement measures. The validity of the CRFs is a key factor in maintaining project prioritization and resource allocation tasks in an optimal and orderly manner. Crash reduction factors have not been updated in Ohio since the early 1980s. It is important to verify and update these CRFs periodically to ensure their accuracy.
The primary objective of this research was to develop CRFs for seven improvement categories that were ranked by ODOT as most important. The researchers also performed a literature review to identify additional CRFs, which were developed from previous experimental studies, for various improvement categories.
The following seven improvement categories were selected by ODOT for model development and analysis for computing the CRFs.
• Add two-way left turn lane
The installation of a median lane that provides access to developments on both sides of the corridor.
• Install median barriers
The installation of new concrete barriers in the median.
• Remove/relocate fixed object
The removal of an object that is adjacent to the roadway, or the relocation of such an object to a safe distance from the roadway. These objects shall include utility poles, trees, guardrails, sign supports, and fire hydrants.
• Flatten slope, remove guardrail
Clear-zone grading or roadside grading is used to eliminate the need for barrier (guardrail) protection of a fixed object and slope protection. The guardrail is also removed in this improvement.
• Flatten vertical curve
The vertical realignment of the roadway such that a vertical curve gradient is reduced.
• Provide interchange lighting
The installation of lighting along the roadway to provide illumination. This study only evaluated interchange lighting because of data availability.

2
• Close median opening
The elimination of access through a median by construction of a raised median or the use of barricades.
2. Literature Review on CRFs
A literature review of published reports from various departments of transportation (DOTs) and transportation research organizations were performed. The CRFs reported below were developed based on experimental studies. In addition, several reports, such as the Kentucky Transportation Cabinet report on CRF (1996) included CRFs based on surveys or without providing any details on the process of development. We have not included any CRFs where we could not identify any statistical process on its development.
2.1 Upgrade pavement markings--general
Research conducted in the state of Indiana by Al-Masaeid and Sinha found a crash reduction factor of 0.13 for upgrading pavement markings. In the Analysis of Accident Reduction Potentials of Pavement Markings paper published in the Journal of Transportation Engineers, accident data from 2 years before and after was considered and computed the accident reduction factor by using the Bayesian approach to eliminate the regression-to-the-mean effect to account for biases. 7 sites where pavement markings were either installed or upgraded were studied.
2.2 Install raised pavement markers, locations & sections
Research conducted in the state of Indiana for the Indiana Department of Transportation found a crash reduction factor of 0.04 for the installation of raised pavement markers. In the Accident Reduction Factors for Indiana study by Purdue University, accident data from 3 years before and after was considered and before computing the accident reduction factor using regression-to-the-mean analysis, the accidents were adjusted using the traffic volumes rather than statewide growth factors to account for biases. 61 sites where raised pavement markers were installed were studied.

3
2.3 Install left turn bay & extra pavement without signal
Research conducted in the state of Iowa for the Iowa Department of Transportation found a crash reduction factor of 0.12 for the installation of a left turn bay and extra pavement without a signal. In the Effectiveness of Roadway Safety Improvements study by Iowa State University, accident data from 3 years before and after was considered and the empirical Bayesian Method was used to remove biases. 8 sites where a left turn bay and extra pavement was installed without a signal were studied.
2.4 Upgrade existing flasher
Research conducted in the state of Indiana for the Indiana Department of Transportation found a crash reduction factor of 0.09 for upgrading an existing flasher. In the Accident Reduction Factors For Indiana study by Purdue University, accident data from 3 years before and after was considered and before computing the accident reduction factor using regression-to-the-mean analysis, the accidents were adjusted using the traffic volumes rather than statewide growth factors to account for biases. 1 site where a flasher was upgraded was studied.
2.5 Install flasher
Research conducted in the state of Indiana for the Indiana Department of Transportation found a crash reduction factor of 0.07 for installing a flasher. In the Accident Reduction Factors For Indiana study by Purdue University, accident data from 3 years before and after was considered and before computing the accident reduction factor using regression-to-the-mean analysis, the accidents were adjusted using the traffic volumes rather than statewide growth factors to account for biases. 8 sites where flashers were installed were studied.
2.6 Upgrade existing signal - general
Research conducted in the state of Indiana for the Indiana Department of Transportation found a crash reduction factor of 0.11 for upgrading an existing signal. In the Accident Reduction Factors For Indiana study by Purdue University, accident data from 3 years before and after was considered and before computing the accident reduction factor using regression-to-the-mean analysis, the accidents were adjusted using the traffic volumes rather than statewide growth factors to account for biases. 110 sites where signals were upgraded were studied.
4
2.7 Install traffic signal - all types
Research conducted in the state of Iowa for the Iowa Department of Transportation found a crash reduction factor of 0.27 for the installation of all types of traffic signals. In the Effectiveness of Roadway Safety Improvements study by Iowa State University, accident data from 3 years before and after was considered and the empirical Bayesian Method was used to remove biases. 16 sites where signals were installed were studied.
2.8 Add left turn phase with new left turn lane
Research conducted in the state of Iowa for the Iowa Department of Transportation found a crash reduction factor of 0.20 when a left turn phase is added with a new left turn lane. In the Effectiveness of Roadway Safety Improvements study by Iowa State University, accident data from 3 years before and after was considered and the empirical Bayesian Method was used to remove biases. 11 sites where left turn phases were included with new left turn lanes were studied.
2.9 Add left turn phase with existing left turn lane
Research conducted in the state of Iowa for the Iowa Department of Transportation found a crash reduction factor of 0.36 when a left turn phase is added to an existing left turn lane. In the Effectiveness of Roadway Safety Improvements study by Iowa State University, accident data from 3 years before and after was considered and the empirical Bayesian Method was used to remove biases. 7 sites where left turn phases were added to with an existing left turn lane were studied.
2.10 Add left turn phase without left turn lane
Research conducted in the state of Iowa for the Iowa Department of Transportation found a crash reduction factor of 0.58 when a left turn phase is added without adding a left turn lane. In the Effectiveness of Roadway Safety Improvements study by Iowa State University, accident data from 3 years before and after was considered and the empirical Bayesian Method was used to remove biases. 4 sites where left turn phases were added without a left turn lane were studied.
2.11 Install rumble strips

5
Research conducted in the state of California for Caltrans found a crash reduction factor of 0.19 when rumble strips were installed along a stretch of roadway. In The Evaluation of Accident Reduction Factors On California State Highways study by California State University, accident data from 3 years before and after was considered and the empirical Bayesian Method was used to remove biases. 2 treatment sites and 3 reference sites were included in this study.
2.12 Upgrading Post-mounted signals to Mast-mounted
Research conducted in Kansas City, Missouri by the Public Works Department found a crash reduction factor of 0.25 for upgrading signal head mounting. In the Impacts of Mast-Mounted Signal Heads on Accident Reduction paper published in the Institute of Transportation Engineers (ITE) Journal, accident data from 1 year before and after was applied. A conservative Chi-squared test was used to test the significance. This test was chosen to eliminate biases, due to the limited amount of data available. Six intersections were included in this study
2.13 Upgrading Bidirectional Median Crossovers to Directional
Research conducted in the state of Michigan by the Michigan Department of Transportation and Michigan State University found a crash reduction rate of 0.30 for upgrading median crossovers. In the Effect on Crashes After Construction of Directional Median Crossovers paper, published in the Transportation Research Record, ten years of crash data were used for each site. A paired t-test was used to determine statistical significance of the results. It is important to note that since traffic volume information was not available for all of the years of this study, crash frequency was compared rather than crash per million vehicle mile traveled. Eight intersections were included in this study.
2.14 Upgrading Intersections into Roundabouts
Research conducted in seven states for the Insurance Institute for Highway Safety found a crash reduction rate of 0.40 for upgrading intersections into roundabouts. This study was conducted also in conjunction with Ryerson Polytechnic University and University of Maine. In the paper Safety Effect of Roundabout Conversions in the United States, published in the Transportation Research Record, crash data for at least 15 months before and after was applied. An empirical Bayesian method was applied to remove biases.
6
This study observed 23 intersections, including rural and urban single lane roundabouts, and urban multilane roundabouts. These categories were not large enough to draw statistically significant conclusions.
2.15 Seasonally Changing Speed Limits
Research conducted in Finland by the Technical Research Center of Finland, found a crash reduction factor of 0.14 for seasonally changing speed limits. This study was conducted also in conjunction with the Ministry of Transport and Communications and the Finnish National Road Administration. In the paper, Seasonally Changing Speed Limits, published in the Transportation Research Record, crash data for one year before and after were studied. A 10 year follow-up study confirmed the initial results. The speed limits were lowered 10 km/h for 4 months during winter. A total of 4000 km of roadway were studied initially. This was broken into 294 sections. An additional 7000 km of roadway were added in the follow-up study period. Generalized linear modeling techniques and t-tests were used to determine significance.
2.16 Wet Pavement Crashes
A CALTRAN study reported a crash reduction factor of 30% for pavement grooving and 25% for open graded asphalt overlays. These reduction factors apply to wet pavement crashes only. This study employed Empirical Bayes and Frequentist methods to estimate the crash reduction factors. In estimating the crash reduction factor for pavement grooving, only one treatment site and 10 corresponding reference sites were used. The estimate of crash reduction factor for open graded asphalt overlays included 4 treatment sites and 29 reference sites.
2.17 Left Turn Pr ior ity Treatment at Intersections
A study conducted in Toronto, Canada evaluated two types of left turn priority treatments at intersections: flashing advanced green and left turn green arrow. These priority phasing were applied as a leading operation at one or more approaches during certain period of a day. This study evaluated the safety effectiveness of priority treatments at 35 intersections in the City of Toronto over the three year period 1997-1999 using empirical Bayes methodology. This study found a 16 percent reduction of left turn crashes with a standard error of 4% for implementing flashing advanced green at intersections and a 17 percent reduction in left turn crashes with a standard error of 3.2% for implementing a left turn green arrow signal indication.

7
2.18 Traffic Signal Backboards Conspicuity
This study evaluated the safety impacts of improved signal conspicuity with the improvements to the traffic signal backboards (Sayed et al., 2005). Improvements include addition of yellow micro-prismatic retroreflective sheeting along the outer edge in order to frame the signal head and make these more visible to the drivers. This study employed time series analysis and empirical Bayes methodology to evaluate the safety impacts. Safety evaluations were done on 17 signalized intersections. The study found that the visibility improvements to the traffic signal backboards reduced crashes about 15 percent.
2.19 Two-Way Left Turn Lane
Bowman et al., found that arterials with two-way left turn lanes had lower vehicular crash rates compared to those with raised curb medians and undivided cross section in the central business districts. In the central business district area, they found a 21 percent lower crash rate for the midblock median segments of arterials with two-way left lane compared to the median mid block segments of an undivided highway.
2.20 Directional Median Crossovers
This study evaluated safety impacts of replacing bidirectional crossovers with directional median crossovers on arterial streets. Eight arterial road segments were studied where these changes were made, which varied in length from 1.17 km to 8.91 km. This study evaluated 54 bidirectional crossovers that were replaced by directional crossovers on these eight segments. Analysis of data showed a 30 percent reduction in both total crashes and crashes involving at least one injured party.

8
3. Methodology
The following section presents the statistical methodology adopted for developing CRFs.
3.1 Statistical Considerations for Evaluating Crash Reduction Factors
Evaluating the impact of roadway improvements poses a unique statistical challenge. The traditional approach of designed experiments is to select a random sample of subjects, apply the treatment to a random subset of the subjects and compare the responses of the two groups. The assumption is made that subjects are generally similar and that the treatment is relatively inexpensive to apply. Neither of these assumptions can be made in regard to roadway improvements.
Road improvements are a major undertaking and cannot practically be subjected to random sampling. Improvements are generally made in reaction to perceived problems at specific sites, which generally means the site has experienced a high number of crashes. The site could be unusually dangerous, or it could have just randomly experienced an unusual number of crashes. If the high crash rate were part of the natural distribution of crashes, the rate should go down without any improvement, a phenomenon known as regression to the mean. Because of the way sites are selected for improvement, it is impossible to discern whether a drop in observed crash rates is due to the improvement or due to regression to the mean without relating the results to comparison sites that have not undergone the improvement.
Despite general geometric similarities such as number of lanes and the presence of an intersection, there are still many factors that can vary between similar roadway sites. Average daily traffic (ADT) will have a big impact on the number of crashes and varies considerably between sites. Additional factors such as shoulder width and the type of development will also affect the number of crashes. These factors must be taken into account when comparing control and treatment sites.
The impact of regression to the mean can be reduced through the use of Empirical Bayes (EB) estimation, which uses distribution of crashes at the comparison sites to adjust the observed crashes at the treatment sites. Removing the impact of site variations is accomplished by building a multivariate model that predicts the expected number of crashes as a function of various site traits and measurements. The methods used in this study are detailed below.
3.2 Empirical Bayes Estimation
Bayesian estimation provides a means for combining information in a sample with another source of information to provide estimates of parameters. In a typical application, the other source of information, referred to as a prior distribution for the parameter, is based on previous experience or expert opinion. Empirical Bayes estimation uses data from similar experiments to formulate the prior distribution.

9
In roadway safety studies, the parameter is the crash rate for a specific site. Since relatively few observations will be collected for one site, data from similar sites must be used to improve precision. Empirical Bayes estimation provides the means for incorporating the information about crash rates from similar sites and reducing the impact of regression to the mean.
The Empirical Bayes estimation in roadway safety analysis has been adopted by several researchers (Hauer, et al., 2002 and Harwood, et al. 2000). The underlying theory of the Empirical Bayes analysis is that the crash rate at a specific site comes from a distribution that can be estimated by collecting crash data from a number of similar sites. Empirical Bayes estimation combines information about this distribution with data collected from a treatment site to offset the impact of a temporary, random increase in crashes.
The negative binomial distribution has been shown to be a reasonable model for the variation in number of crashes from year to year or site to site. The negative binomial model can be derived as a mixture of Poisson random variables with different rates. The number of crashes for an individual site can be modeled as a Poisson random variable. Since specific characteristics vary from site to site, the crash rates for individual sites will vary. The total crashes for different sites form a mixture of Poisson random variables with different rates. The result is that crash counts have a negative binomial distribution if crash rates have a gamma distribution. Experience has shown the negative binomial model to be a reasonable fit to observed data on crash counts.
In a Poisson random variable, the variance is equal to the mean; however this is not the case for the negative binomial distribution. The variance for the negative binomial is larger than the mean. One parameterization of the negative binomial is to use the mean and the overdispersion parameter. The overdispersion parameter measures the increase in the variance with respect to a Poisson distribution.
There are two common definitions of the overdispersion parameter. In his discussions of Empirical Bayes estimation, Hauer defines the overdispersion as ϕ where variance = mean*(1 + mean/ϕ). In the SAS system (SAS 8.2), which is used in this study to conduct the analysis, the overdispersion parameter is k = 1/ϕ, so that variance = mean*(1 + k*mean). This difference was taken into account in the calculations performed in this study.
The basic formula for the Empirical Bayes estimate of the mean number of crashes for a site, based on the negative binomial model is:
22)( with,)1(
NB
NBNBEB K σ
µσµ
µαααµµλλ
λ =+=−+=�
where, µλ and σ2λ are the mean and variance of crash rates and µNB and σNB
2 are the mean and variance of the negative binomial distribution and K is the site count. The precision of an estimate is measured by the variance of the estimate, designated by

10
)ˆ(θV , or, equivalently, by the standard error, which is the square root of the variance of the estimate. The variance of the EB estimate of the mean number of crashes is:
EBEBV µαµ )1()ˆ( −= and it is estimated by using EBand µα ˆ, from the
previous equation.
In this form, the Empirical Bayes estimate assumes that the negative binomial distribution would apply to a group of sites that are exactly the same as the site under study. Estimating the parameters of this negative binomial distribution is impractical since even the most similar sites would have differences in some traits such as average daily traffic. A multivariate modeling approach is used to account for these differences.
3.3 Multivariate Modeling
Standard multivariate modeling builds a model of the mean as a function of various traits. The traits could be categorical or numerical and the assumption is made that the modeled variable has a normal distribution with a constant variance. Obviously, the number of crashes is not a normal random variable and using the negative binomial model we see that the variance is a function of the mean. A specialized form of multivariate modeling called negative binomial regression must be used for crash count data.
The general form for the model in negative binomial regression is:
( )�+= ii Xββµ 0exp
Where µ is the mean and the X i’s are the traits that are used to predict the mean. The iteratively reweighted least squares algorithm is used to estimate the parameters. The SAS system was used to conduct the computations in this study.
The strategy used to select the best traits to use in the model was a forward selection stepwise procedure. In the first step, all the traits that were available were fit to the data individually. The trait that individually provides the most information about crashes is selected for the model. The measure of information used in this process is the p-value for the factor from the SAS analysis. On subsequent tests, remaining traits, or factors, are individually added to the model and the one with the lowest p-value is added to the model, unless none of the factors is significant at the 0.05 level of significance. The process stops when none of the remaining factors is significant at the 0.05 level of significance.
If the p-value for any previously entered variable rose above the 0.05 level of significance it was removed from the model, except for Average Daily Traffic. If ADT rose above the 0.05 level of significance, the most recently added variable is removed.
Another concern in the model building process is that this is an observational study, so that all levels of class variables may not be represented in the data, or class variables may be confounded with other variables in the model. When class variables were entered into the model in the stepwise procedure, they were evaluated to make sure that these

11
problems did not apply. For example, when the functional classification (FC) of the roadway was included in one of the steps for two way left turn lanes, it was noted that only one level of FC was different from the others. Upon examining the data it was noted that only one site was in that FC category. In this case FC is confounded with the single site, so FC was not used in the final model.
The traits that were available in this study were: midpoint of the collection period, the duration of the collection period, average daily traffic, the percentage of truck traffic, the number of lanes, section length, the road width, the shoulder width, the median width and four classification variables MCL, SYS_CL, ACS and FC. The descriptions and levels of the classification variables are given below.
Explanation of Classification Var iables
A). MCL: Indicates whether road is inside or outside of incorporated areas.
1 - Rural
2 - Municipal (incorporated)
4 - Rural and Municipal (split)
B). SYS CL: System classification
I - Interstate
M - Major thoroughfare
A - Auxiliary
L - Local, State
C). ACS: Highway Access Type as Journalized.
N - No Access Control
L - Limited Access Control
F - Full Access Control
D). FC: Functional classification
01 - Rural Interstate
02 - Rural Principal Arterial
06 - Rural Minor Arterial
07 - Rural Major Collector
08 - Rural Minor Collector
09 - Rural Local
11 - Urban Interstate
12 - Urban Freeway & Expressway

12
14 - Urban Principal Arterial
16 - Urban Minor Arterial
17 - Urban Collector
19 - Urban Local
The data used in building the model included all time periods for the comparison sites and the data for the treatment sites that were collected prior to construction. The resulting model was then used to calculate the negative binomial mean and variance corresponding to the treatment sites for both the before and after construction time periods. The crash data from the treatments sites during construction was not used. The negative binomial means and variances were used with the actual count data for each time period to calculate the Empirical Bayes estimates for the crash rate for that site in that time period.
The next step in the process of calculating crash reduction factors is to project what the crash rates for the treatment sites would have been if the treatment had not been applied. The projections are based on the assumption that crash rates for an individual site maintain the same proportion to the average crash rates for all sites across time.
The projections are calculated by picking a base year from the time periods before construction and normalizing the mean crash rates for all time periods to the mean crash rate for the base. The projections of crash rates for the post construction period are independent of the choice of the base year. The normalized mean crash rate for year y is symbolized by Cy and is calculated as Cy = λy/λb, where λy and λb are the predicted crash rates from the multivariate model for year y and the base year.
The base value for projecting the expected post treatment crash rate is the weighted average of the Empirical Bayes estimates of crash rates of all years prior to construction. The formulae for the estimate of the base rate and an estimate of the sampling variance are:
2
,, )ˆ()ˆV( with
ˆˆ
��
���
��
�=
�
�=
beforey
beforeyEB
b
beforey
beforeyEB
b
C
V
C
λλ
λλ
The projected crash rate for the treatment site in year z after construction is
)ˆ()ˆV( withˆˆ 2bzzbzz VCC λλλλ == .
The crash reduction factors are calculated by comparing the actual crash counts after construction with the projected crash rates as calculated above. The crash reduction factor is derived from the index of effectiveness which is symbolized by θ. The index of effectiveness is the crash rate for an improved site divided by the crash rate for an unimproved site. The maximum likelihood estimate (mle) of the index of effectiveness is

13
�
�=
afterz
afterzK
λθ ˆˆ
Since the mle of θ is the ratio of random variables, there is an inherent bias, which is estimated by
�
�+=
afterz
afterz
Vb
)ˆ(
ˆ
1ˆλ
λ
so that an unbiased estimate of θ is given by
�����
�
�
�����
�
�
��
���
��
�+
����
����
�== 2
2
ˆ
)ˆ(1
ˆ
ˆ)ˆV( withˆ
ˆˆ
afterz
afterz
afterz
uu
V
Kbb λ
λθθθθ .
The estimate of the crash reduction factor is then )ˆ1(100 uCRF θ−= with the standard
error given by )ˆ(100 uV θ . The standard error represents the maximum error that will
occur about 68 percent of the time.
The standard error can also be used to evaluate whether or not the estimated CRF is statistically significantly larger than 0. The standard difference of the CRF from 0 is calculated by dividing the estimate of the CRF by it’s standard error. Generally, values of the standard difference that are less than 1.65 are not considered significant while larger values are considered to be statistically significant.
A more precise evaluation is determined by calculating the p-value associated with the calculated standard difference. The p-value is the probability that a standard normal random variable will exceed the calculated standard difference. P-values less than 0.05 are generally considered significant while larger values are considered to be insufficient evidence that the CRF is larger than 0.
The limited amount of data and the large variability in the data in this study resulted in very few of the CRF estimates being significantly larger than 0. This should not be interpreted as evidence that the improvements are ineffective. The statistical tests are set up to evaluate the strength of evidence that CRF’s are larger than 0, not the strength of evidence that they are equal to or less than 0. Collecting more data would likely increase the number of CRF estimates that are significantly larger than 0.
These basic procedures were applied to seven improvement categories. The specific results for each improvement category are discussed separately in Section 4.

14
4. Data Collection
A treatment site is defined as a roadway project where particular improvements were implemented to enhance its safety. A particular treatment group is a compilation of roadway projects, where each site has received the same safety treatment. Each treatment group consisted of two to five treatment sites. The following lists the treatment groups considered for this study:
1. Add two-way left turn lane.
2. Install median barriers.
3. Remove/relocate fixed object.
4. Flatten slope, remove guardrail.
5. Flatten vertical curve.
6. Provide interchange lighting.
7. Close median opening.
For each treatment site, the following roadway and traffic characteristics were considered for analysis using SAS program:
1. Roadway Width (RW)
2. Shoulder Width (SW)
3. Median Width (MW)
4. Crash Data
5. Average Daily Traffic (ADT)
6. Average Daily Trucks
7. Section Length
In this study, crash counts were collected for the before- and after- period following treatment. Most of the improvements were carried out in the mid 1990s. Information on physical characteristics of road segment and crash counts were made available by ODOT.
The ODOT Office of the Technical Services published seven different Roadway Inventory Reports for the development and maintenance of a Linear Referencing System (LRS) for state, county, township and municipal road and street systems:
1. State System Basic Road Inventory (RI-06)
2. Listing of Local Roads – sorted by county (RI-34A)
3. NHS and PAS Mileage by Functional Class (RI-339)
4. Listing of Local Roads Sorted by Township (RI-34B)
5. Centerline Miles, Lane Miles and Vehicle Miles Traveled Report (State Highway System only) (RI-82B)

15
6. State Highway System Lane Miles (RI-367)
7. Roadway Description Inventory Report (DESTAPE) – sorted by county and district.
The State System Basic Road Inventory (RI-06) is a list of data field descriptions. It contains physical characteristics such as surface type, surface width, roadway width, system classification, median width, highway access type, number of driving lanes, functional classification and urban area code of the specified road segment. DESTAPE helps to establish treatment and comparison sites location by route type and log points. The difference between begin log and end log gives length of the roadway segment. The treated road segment was located with the help of log distance on a particular route.
Crash data for treatment sites before, during and after treatment for a particular road section was collected by using –
• Annual reports on highway safety improvement programs for the State of Ohio
• Highway safety evaluation report of improvements
• Interaction with districts
Crash data for comparison sites was provided by the ODOT central office through their central crash history database. The UD research team compiled the received data into the required format for analysis.
The date of start and the date of completion of work for the treatment site denoted the precise construction period. The month in which construction began and ended were considered whole months for the treatment period. For example, for work that began on September 15, 1997 and ended on December 16, 1997, the construction period was from September 1997 to December 1997. It was ensured that crashes that occurred during the construction period were not added while computing the crash data.
Compiled crash data was further classified by crash type and severity. A C++ program was written and used to extract crashes by month, year and by crash type and severity for the before, during and after treatment periods (see Appendix A).
5. Modeling & Analysis
This section presents the modeling and analysis for the seven improvement categories.
5.1 Add Two-way Left Turn Lane
The forward selection procedure resulted in the models:
µTotal = exp (–7.3310 + ln(Dy) + 0.9613* ln(ADT))

16
By following a similar forward selection process, the final model selected for I/F crashes
was:
µTI/F = exp (–8.3417 + ln(Dy) + 0.9335* lnADT), or
Where Dy is an offset value for the duration of the time period. The Dy term corrects for the fact that some of the time periods immediately after construction did not last a full year. The Wald statistics, which are a test for significance of the terms in the model, indicate a level of significance of less than 0.0001 for total crashes and 0.0004 for injury and fatality crashes. Both P-values are significantly less than 0.05 indicating a strong fit.
In the model building phase, the class variable FC appeared to provide a statistically significant contribution to modeling crashes. A detailed analysis of the impact of FC indicated that only FC level 7, rural major collector, was significantly different from the other levels of FC. However, only one of the comparison sites was a rural major collector, so there is no way to determine whether the significant difference is due to the functional class, or to the specific site, so FC was not included in the model. This is a common problem in observational studies because there is no way to control the balance of levels of class variables.
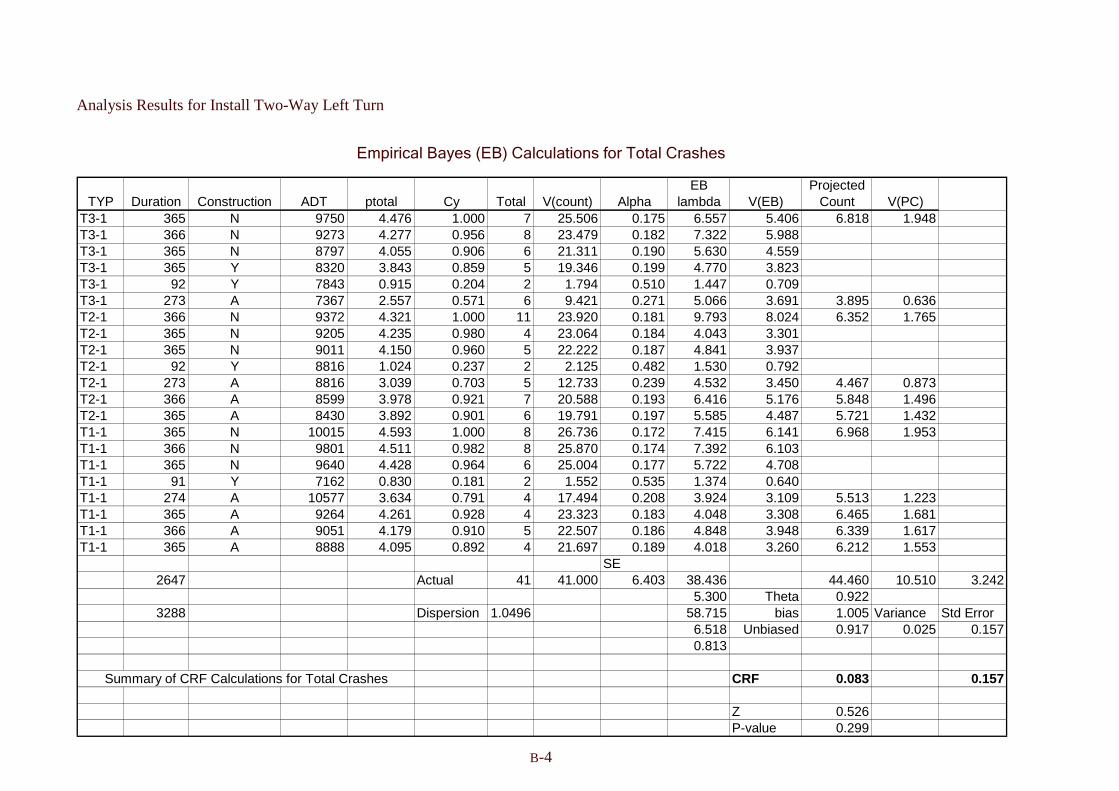
After the model was selected, SAS was used to generate predicted values for each treatment site during all time periods both before and after construction. The predicted values are the means of the negative binomial distribution, which are used with the observed numbers of crashes to compute the Empirical Bayes (EB) estimates of the number of crashes for each observation of a treatment site. The SAS output for the final selected models are given in Appendix B. The EB estimates are used in the calculation of Crash Reduction Factors (CRF), which are also shown in Appendix B.
The estimated CRF for total crashes after adding a two way left turn lane is 0.083 with a standard error of estimate of 0.157. The standard difference from 0 is 0.52 with a p-value of 0.299 indicating little evidence that the CRF for two way left turn lanes is significantly larger than 0. The estimated CRF for injury and fatality accidents is 0.199 with a standard error of estimate of 0.254. The standard difference from 0 for the CRF for injury and fatality accidents is 0.78 with a p-value of 0.22, which is slightly more significant than for total crashes but still not generally considered statistically significant.
5.2 Install Median Barrier
The forward selection procedure resulted in the models:
µTotal = exp (–19.6388+ Dy + 1.9505* lnADT)
and
µTI/F = exp (–20.7886+ Dy + 2.0602* lnADT – 0.0005*Midpoint)

17
Where Dy is an offset value for the duration of the time period. The Dy term corrects for the fact that some of the time periods immediately after construction did not last a full year. The Wald statistics, which are a test for significance of the terms in the model, indicate a level of significance for both total crashes and injury and fatality crashes. The P-values for total crashes and injury and fatality crashes are significantly less than 0.05 indicating a strong fit.
After the model was selected, SAS was used to generate predicted values for each treatment site during all time periods both before and after construction. The predicted values are the means of the negative binomial distribution, which are used with the observed numbers of crashes to compute the Empirical Bayes (EB) estimates of the number of crashes for each observation of a treatment site. The SAS output for the final selected models are given in Appendix C. The EB estimates are used in the calculation of Crash Reduction Factors (CRF), which are also shown in Appendix C.
The estimated CRF for total crashes after Installing Median Barrier is 0.863 with a standard error of estimate of 0.029. The standard difference from 0 is 29.5 and the associated p-value is less than 0.0001. The estimated CRF for injury and fatality accidents is 0.884 with a standard error of estimate of 0.052. For injury and fatality accidents, the standard difference from 0 is 16.9 and the associated p-value is less than 0.0001. For both cases, there is strong statistical evidence of a reduction in crashes based on the data available in this study.
5.3 Flatten Slope, Remove Guardrail
The forward selection procedure resulted in the model:
µTotal = exp (-6.4369+ Dy + 0.5703* lnADT + 0.6545* lnTrcks�
Where Dy is an offset value for the duration of the time period. The Dy term corrects for the fact that some of the time periods immediately after construction did not last a full year. The Wald statistics, which are a test for significance of the terms in the model, indicate a level of significance for total crashes. P-value is significantly less than 0.05 indicating a strong fit. The model for injury/fatal severity type was could not be developed as no injury/fatal crashes were observed for the sites selected in before and after period of improvement. Consequently, CRFs for I/F crashes could not be estimated for this category of improvement.
After the model was selected for total crashes, SAS was used to generate predicted values for each treatment site during all time periods both before and after construction. The predicted values are the means of the negative binomial distribution, which are used with the observed numbers of crashes to compute the Empirical Bayes (EB) estimates of the number of crashes for each observation of a treatment site. The SAS output for the final selected model is given in Appendix D. The EB estimates are used in the calculation of Crash Reduction Factors (CRF), which are also shown in Appendix D.
The estimated CRF for total crashes after flattening slopes and removing guardrail is 0.424 with a standard error of estimate of 0.575. The standard difference from 0 is 0.74

18
with a P-value of 0.23. The CRF for injury and fatality crashes could not be computed because there were no injury or fatality crashes reported for either treatment site during the course of the study.
5.4 Remove/Relocate Fixed Object
The forward selection procedure resulted in the models:
µTotal = exp (1.4827 + Dy + FC + 0.1995* lnADT – 1.1324* lnSW + ACS – 0.4754* lnTrcks), where the FC term is equal to: 2.1956 for FC = 6, -0.2449 for FC=7, -1.3426 for FC = 8, 0.5334 for FC = 14, and 0.0 for FC = 16 and the ACS term is equal to - 0.6847 for ACS=L and 0.0 for ACS=N.
and
µTI/F = exp (–1.1020 + Dy + FC + 0.4051* lnADT – 1.4265* lnSW + ACS), where the FC term is equal to: 2.2433 for FC = 6, -0.1002 for FC=7, -0.8018 for FC = 8, 0.4796 for FC = 14, and 0.0 for FC = 16 and the ACS term is equal to -0.6406 for ACS = L and 0 for ACS = N.
Where Dy is an offset value for the duration of the time period. The Dy term corrects for the fact that some of the time periods immediately after construction did not last a full year. The Wald statistics, which are a test for significance of the terms in the model, indicate a level of significance for both total crashes and injury and fatality crashes. The P-values for total crashes and injury and fatality crashes are significantly less than 0.05 indicating a strong fit.
After the model was selected, SAS was used to generate predicted values for each treatment site during all time periods both before and after construction. The predicted values are the means of the negative binomial distribution, which are used with the observed numbers of crashes to compute the Empirical Bayes (EB) estimates of the number of crashes for each observation of a treatment site. The SAS output for the final selected models are given in Appendix E. The EB estimates are used in the calculation of Crash Reduction Factors (CRF), which are also shown in Appendix E.
The estimated CRF for total crashes after removing or relocating a fixed object is 0.382 with a standard error of estimate of 0.103. The standard difference from 0 is 3.01 and the associated p-value is 0.0001. The estimated CRF for injury and fatality accidents is 0.381 with a standard error of estimate of 0.134. For injury and fatality accidents, the standard difference from 0 is 2.84 and the associated p-value is 0.0022. For both cases, there is a statistically significant reduction in crashes based on the data available in this study.
5.5 Flatten Vertical Curve
The forward selection procedure resulted in the models:
µTotal = exp (–2.9451 + Dy + 0.5470* lnADT + 0.8849* lnSL + SYS_CL),

19
with the SYS_CL term equal to -0.82 for SYS_CL = A, -0.18 for SYS_CL = L and 0 for SYS_CL = M,
and
µTI/F = exp (–4.3707 + Dy + 0.7448* lnADT – 1.4310* lnTrcks)
Where Dy is an offset value for the duration of the time period. The Dy term corrects for the fact that some of the time periods immediately after construction did not last a full year. The Wald statistics, which are a test for significance of the terms in the model, indicate a level of significance of less than 0.0004 for total crashes and 0.0024 for injury and fatality crashes. Both P-values are significantly less than 0.05 indicating a strong fit.
After the model was selected, SAS was used to generate predicted values for each treatment site during all time periods both before and after construction. The predicted values are the means of the negative binomial distribution, which are used with the observed numbers of crashes to compute the Empirical Bayes (EB) estimates of the number of crashes for each observation of a treatment site. The SAS output for the final selected models are given in Appendix F. The EB estimates are used in the calculation of Crash Reduction Factors (CRF), which are also shown in Appendix F.
The estimated CRF for total crashes after flattening the vertical curvature in the roadway profile is 0.196 with a standard error of estimate of 0.191. The standard difference from 0 is 1.02 and the associated p-value is 0.1526. The estimated CRF for injury and fatality accidents is 0.512 with a standard error of estimate of 0.190. For injury and fatality accidents, the standard difference from 0 is 2.69 and the associated p-value is 0.0035. Estimated CRF for injury and fatality accidents appear to be statistically significant reductions, whereas for total crashes it is slightly significant, based on the available data in this study.
The estimated CRF’s for both the total crashes and injury and fatality accidents were calculated after removing treatment site #2 from the data set. Treatment site #2, from mile markers 8.56 to 9.16 on State Route 310 in Licking County, Ohio showed unusual crash statistics compared to the rest of the data set. In the before construction period, over a 3 year duration, 18 total crashes (6 injury and fatality accidents) occurred. However, after flattening the vertical curve, over a 3 year 304 day duration, 39 total crashes (16 injury and fatality accidents) occurred. This represents a 170% increase in total crashes and a 209% increase in injury and fatality accidents. Because of this drastic increase, treatment site #2 was excluded from the calculations, however the crash reduction factors with treatment site #2 included in the calculations are also shown in Appendix F.
5.6 Provide Interchange Lighting
The forward selection procedure resulted in the models:
µTotal = exp (1.9432+ Dy - 0.2212* lnADT + 0.0405*SW)

20
And
µTI/F = exp (-2.1013 + Dy + 0.1531* lnADT)
Where Dy is an offset value for the duration of the time period. The Dy term corrects for the fact that some of the time periods immediately after construction did not last a full year. The Wald statistics, which are a test for significance of the terms in the model, indicate a level of significance for total crashes and injury and fatality crashes.
After the model was selected, SAS was used to generate predicted values for each treatment site during all time periods both before and after construction. The predicted values are the means of the negative binomial distribution, which are used with the observed numbers of crashes to compute the Empirical Bayes (EB) estimates of the number of crashes for each observation of a treatment site. The SAS output for the final selected models are given in Appendix G. The EB estimates are used in the calculation of Crash Reduction Factors (CRF), which are also shown in Appendix G.
The estimated CRF for total crashes after providing highway lighting is 0.504with a standard error of estimate of 0.166. The standard difference from 0 is 3.04 with a P value of 0.0012. The estimated CRF for injury and fatality crashes is 0.260 with a standard error of 0.381. The standard difference from 0 for the CRF for injury and fatality crashes is only 0.68 with a p-value of 0.25 indicating weak statistical significance for this CRF value.
An additional analysis was attempted using only the crashes from 6:00 PM to 6:00 AM since highway lighting should mainly affect night time crashes. There were an insufficient number of injury and fatality crashes to calculate the CRF and although there were sufficient total crashes to calculate the CRF, the result should be used cautiously because of the low number of crashes.
The model for night time crashes was built using night time traffic figures. Night time traffic figures were generated by multiplying ADT by standard percentages based on functional class of the roadway. The final model selected for predicting night time crashes was:
µNight = exp(6.6802 + Dy – 1.4183* lnNDT + 1.13* lnTrcks + 0.0804*SW)
where lnNDT is the logarithm of the average daily night time traffic counts. Note that according to this model an increase in night time traffic will result in a decrease in the night time crash rate. It is not clear why night time crashes should decrease with increased traffic. This could be an artifact of the small number of total night time crashes, or perhaps more traffic helps keep night time drivers awake.
The CRF for night time crashes was calculated to be 0.941 with a standard error of 0.057. The standard difference from 0 for total night time crashes is 16.4 with a p-value that is essentially 0. This is extreme statistical significance and may be impacted by the few number of night time crashes considered in this study.

21
5.7 Close Median Opening
The Empirical Bayes estimation procedure broke down for the data collected for the close median opening improvement. A basic assumption of the EB method is that the comparison sites and the treatment sites form a homogeneous population so that the crash rates at the treatment sites can be viewed as a random variable whose distribution is given by that population. Although the comparison sites were selected based on similarity of geometric configurations, they do not form a homogeneous population with the treatment sites selected for this category. The treatment sites were in the vicinity of the Dayton Mall, while the comparison sites were in primarily residential areas.
Figure 1 shows plots of crash rates per year per thousand ADT versus date for both treatment sites and their associated comparison sites. The treatment sites are labeled T1-1 and T2-1. The comparison sites are labeled by their association with the treatment sites as Cm-n where m represents the treatment site it is associated with and n represents the specific comparison site within the m treatment group. There is clear visual evidence that the crash rates for the treatment sites are much larger than the crash rates for the comparison sites. This is a violation of the assumptions behind the EB method, so that method could not be applied to this improvement category.
The changes in crash rates for the comparison sites were also too different from the changes in crash rates for the treatment sites, so the before/after method with comparison sites could not be used either. The naïve before/after analysis, which uses only the data from the treatment sites, was used for analyzing the data for the close median opening improvement category. The results for this improvement category should be used with caution, because of the need to use the naïve before and after analysis. There should be some effort to identify a better set of comparison sites and redo the analysis with the Empirical Bayes procedure at some point in the future.
The time periods before and after the improvements were constructed were of different lengths, so the crash counts were converted to rates per year by dividing by the duration. There was roughly an 8 percent increase in ADT after the construction, so the before crash rate was multiplied by 1.08 to account for the expected increase in crashes due to increased ADT. The index of effectiveness and crash reduction factors were then calculated from the after crash rate and the projection of the before crash rate to the after period.
The formulae for these calculations are:

22
( )
( ) ( )
( ) ( ) ( ) ( ) ( )
( )θθ
λλ
λλ
λλθθ
λλλ
λ
θ
λλλλ
λλ
ˆ)()ˆ1(
ˆˆ
1ˆ
ˆ
ˆ
ˆˆˆ
ˆˆ
1
ˆˆ
ˆ
ˆˆˆˆ
afteror beforefor aor b i where,ˆˆ
2
2222
2
P
a
2
P
2
VCRFseandCRF
VVVVand
V
ADT
ADTVVand
ADT
ADT
D
KVand
D
K
P
P
P
P
a
a
P
P
before
afterbP
before
afterb
i
ii
i
ii
=−=
���
����
�+
��
�
�
��
�
�+=
+=
��
�
�
��
�
�==
===
The specific estimates for total crashes are
( ) 0.11302ˆV with0.93825ˆ == θθ
The CRF for total crashes is 0.062 with a standard error of 0.11 and for injury and fatality crashes –0.032 with a standard error of 0.225. The standard score for total crashes being greater than 0 is 0.55 with a p-value of 0.29. There was an apparent increase in the rate of injury and fatality crashes. The results indicate that this particular improvement is not significantly impacting safety both in terms of total crashes and injury and fatality crashes.
Looking at Figure 1 it can be seen that crashes increased for one treatment site and decreased for the other. The net effect is that there is no apparent change in crash rates based on this data.

23
Figure 1. Time trends of crash rates for close median opening sites.
5.8 Computed CRFs
Table 1 provides a list of Crash Reduction Factors (CRFs) for both the total crashes and I/F crashes. These are experimental results, as these values were estimated based on field data.
Table 1. Computed CRFs for crashes and crash rates
Category of Improvement CRF for all Crashes
CRF for I /F Crashes
Add two-way left turn lane 0.827 0.1994
Install new median barrier 0.8634 0.8837
Remove/relocate fixed object 0.3824 0.3814
Flatten slope, remove guard rail 0.5358 *
Flatten vertical curve 0.1956 0.5118
24
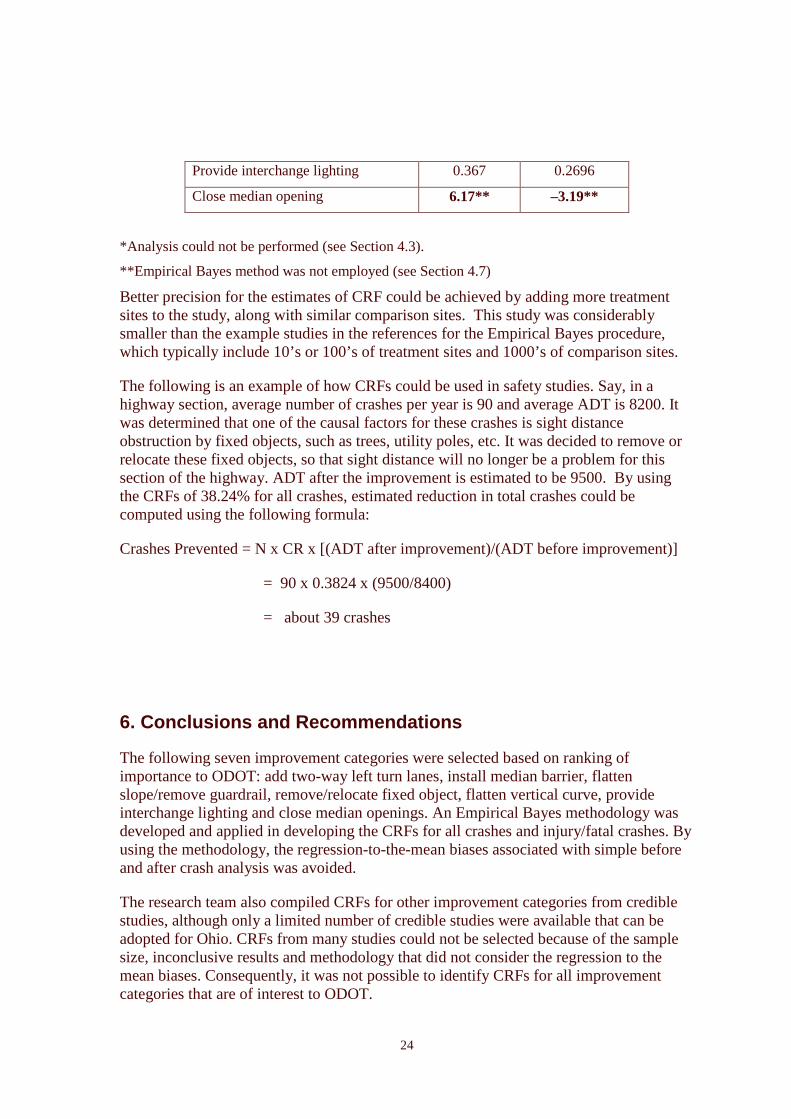
Provide interchange lighting 0.367 0.2696
Close median opening 6.17** –3.19**
*Analysis could not be performed (see Section 4.3).
* *Empirical Bayes method was not employed (see Section 4.7)
Better precision for the estimates of CRF could be achieved by adding more treatment sites to the study, along with similar comparison sites. This study was considerably smaller than the example studies in the references for the Empirical Bayes procedure, which typically include 10’s or 100’s of treatment sites and 1000’s of comparison sites.
The following is an example of how CRFs could be used in safety studies. Say, in a highway section, average number of crashes per year is 90 and average ADT is 8200. It was determined that one of the causal factors for these crashes is sight distance obstruction by fixed objects, such as trees, utility poles, etc. It was decided to remove or relocate these fixed objects, so that sight distance will no longer be a problem for this section of the highway. ADT after the improvement is estimated to be 9500. By using the CRFs of 38.24% for all crashes, estimated reduction in total crashes could be computed using the following formula:
Crashes Prevented = N x CR x [(ADT after improvement)/(ADT before improvement)]
= 90 x 0.3824 x (9500/8400)
= about 39 crashes
6. Conclusions and Recommendations
The following seven improvement categories were selected based on ranking of importance to ODOT: add two-way left turn lanes, install median barrier, flatten slope/remove guardrail, remove/relocate fixed object, flatten vertical curve, provide interchange lighting and close median openings. An Empirical Bayes methodology was developed and applied in developing the CRFs for all crashes and injury/fatal crashes. By using the methodology, the regression-to-the-mean biases associated with simple before and after crash analysis was avoided.
The research team also compiled CRFs for other improvement categories from credible studies, although only a limited number of credible studies were available that can be adopted for Ohio. CRFs from many studies could not be selected because of the sample size, inconclusive results and methodology that did not consider the regression to the mean biases. Consequently, it was not possible to identify CRFs for all improvement categories that are of interest to ODOT.
25
The research team developed a statistical analysis tool using SAS for developing CRFs that can be easily applied to any improvement category that is of interest to ODOT. The research team recommends that ODOT develop their own reduction factors using the methodology developed through this research for other categories of improvements that are of importance to ODOT. This will provide the highest confidence in the application of the CRFs for future safety improvement projects and resource allocations.
7. References
Al-Masaeid, H. R., and K. C. Sinha, Analysis of Accident Reduction Potentials of Pavement Markings. Journal of Transportation Engineering, Vol. 120, No. 5, pp. 723-736 (Sept./Oct. 1994) Bhesania, R.P. "Impact of Mast-Mounted Signal Heads on accident Reduction." ITE Journal, p. 25-29, October 1991. Brian Bowman and Robert L. Vecello, “Effects of Urban and Suburban Median Types on Both Vehicular and Pedestrian Safety,” Transportation Research record, 1445, 1994.
Ermer, O. J., Accident Reduction Factors for Indiana, Report No. FHWA/IN/JHRP-91/11, Joint Highway Research Program, Purdue University School of Engineering, Indiana Department of Transportation, May 1991.
Hanley, K.E., A. R. Gibby, and T. C. Ferrara, The Evaluation of Accident Reduction Factors on California State Highways, Report No. FHWA/CA-TO-96- , California Department of Transportation, Federal Highway Administration, December 1996.
Hauer, E., D.W. Harwood, F.M. Council, M.S. Griffith, The Empirical Bayes method for estimating safety: A tutorial. Transportation Research Record 1784, pp. 126-131. National Academies Press, Washington, D.C. 2002
Harwood, D., F. Council, E. Hauer, W. Hughes and A. Vogt, Prediction of the Expected Safety Performance of Rural Two-Lane Highways, Final Report, Report No. FHWA-RD-99-207, December 2000.
Lyon, C., A. Huq, B. Persaud and Steven Kodama, Development of safety Performance Functions for Signalized Intersections in a Large Urban Area and Application to Evaluation of Left Turn Priority Treatment, Transportation Research Board 2005 Annual Meeting CD-ROM.
Persaud B.N., Retting R.A.,Garder P.E., and D. Lord, “Safety effect of roundabout conversions in the United States: Empirical Bayes observational before-after study,” Transport. Res. Rec., no. 1751, pp. 1-8, 2001.
Sayed, T., P. de Leur and J. Pump, Safety Impacts of Increased Traffic Signal backboards Conspicuity, Transportation Research Board 2005 Annual Meeting CD-ROM.
SAS 8.2, SAS Institute Inc., Cary, North Carolina

26
Thomas G.B., Smith D.J., Effectiveness of Roadway Safety Improvement, CTRE management project pp. 00-61, Iowa State University, Ames, Iowa.
William C. Taylor,Inkyu Lim, and Dale R. Lightizer, Effect on Crashes After Construction of Directional Median Crossovers, Transportation Research Record 1758, pp 30-35, National Academy Press, Washington D.C., 2001.

A-1
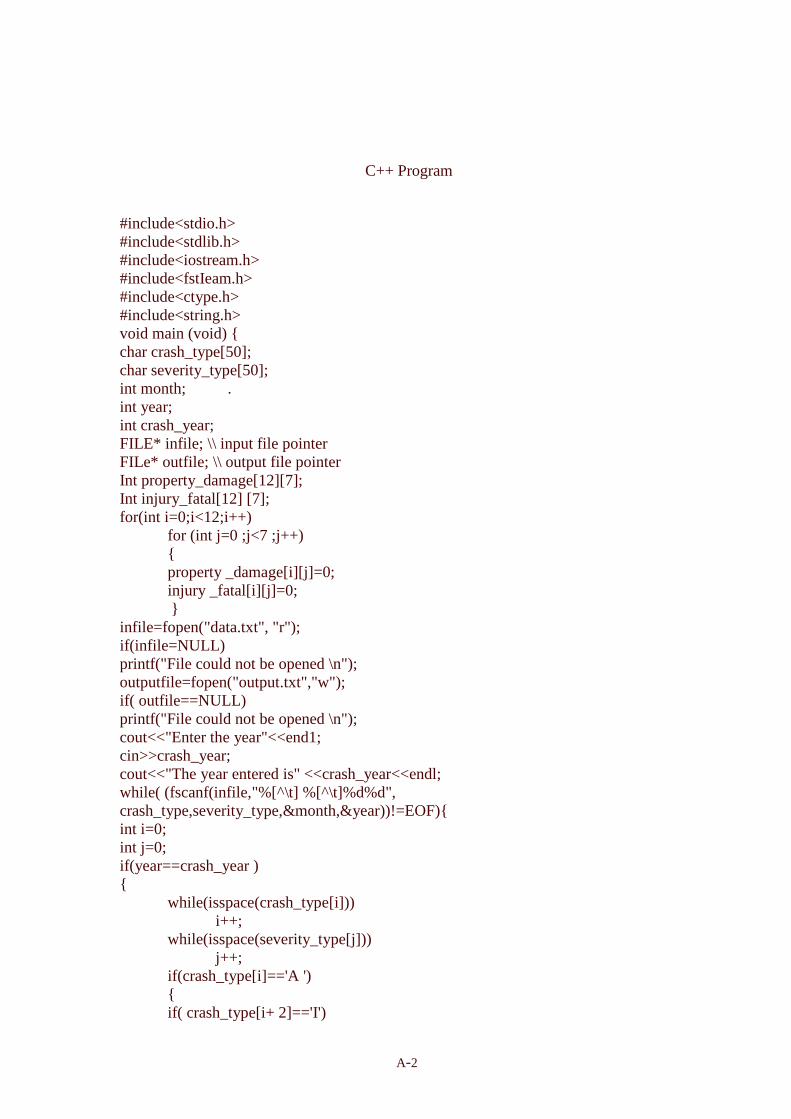
APPENDIX A - C++ Program for Data Extraction
A-2
C++ Program
#include<stdio.h> #include<stdlib.h> #include<iostream.h> #include<fstIeam.h> #include<ctype.h> #include<string.h> void main (void) { char crash_type[50]; char severity_type[50]; int month; . int year; int crash_year; FILE* infile; \\ input file pointer FILe* outfile; \\ output file pointer Int property_damage[12][7]; Int injury_fatal[12] [7]; for(int i=0;i<12;i++)
for (int j=0 ;j<7 ;j++) { property _damage[i][j]=0; injury _fatal[i][j]=0; }
infile=fopen("data.txt", "r"); if(infile=NULL) printf("File could not be opened \n"); outputfile=fopen("output.txt","w"); if( outfile==NULL) printf("File could not be opened \n"); cout<<"Enter the year"<<end1; cin>>crash_year; cout<<"The year entered is" <<crash_year<<endl; while( (fscanf(infile,"%[^\t] %[^\t]%d%d", crash_type,severity_type,&month,&year))!=EOF){ int i=0; int j=0; if(year==crash_year ) {
while(isspace(crash_type[i])) i++;
while(isspace(severity_type[j])) j++;
if(crash_type[i]=='A ') { if( crash_type[i+ 2]=='I')

A-3
{ if(severity_type[j]=='P') property_damage[month-l][6]++;
else injury_fatal[month-l][ 6]++;
} else
{ if( severity _type[j]==' P') property_damage[month-1[0]++; else injury_fatal[month -1][0]++;
} }
else if(crash_type[i]=='R') {
if(severity_type[j]==' P') property_damage[month-l][]++; else injury_fatal[ month-1][1]++;
} else if(crash_type[i]=='F')
{ if(crash_type[i+1]==' A') property_damage[month-1][6]++; else { if (severity_type [j]=='P') property_damage[month-l][2]++; else injury_fatal[month-l][2]++;
} }
else if(crash_type[i]=='S') {
if( severity_type[j]=='P') property_damage[month-1][3]++;
else injury_fatal[month-l][3]++; }
else if(crash_type[i]='H') {
if(severity_type[j]=='P') property_damage[month-l][ 4 ]++; else injury_fatal[month-l][4]++;
A-4
} else if(crash_type[i]=='L')
{ if(severity_type [j]=='P') property _damage[month-l][5]++; else injury _fatal[ month-1][5]++; }
else property_damage[month-l] [6]++;
} // if(crash_year=year) } // while fprintf(outfile,"Table of crash of the year %d is \n", crash_year); fprintf(outfile,'--------------------------------- -----------------------------\n"); fprintf(outfile,"A R F S H L o\n"); fprintf(outfile," I/PDO I/PDO I/PDO I/PDO I/PDO I/PDO I/PDO \n\n"); for(i=0;i<12;i++ ) { for (int j=0;j<7;j++) " fprintf(outfile,"%d/%d\t", injury_fatal [i ][j],property_damage[i] [j]); fprintf(outfile,"\n\n"); , } fclose(infile ); fc1ose( outfile); }

Analysis Results for Install Two-Way Left Turn
B-1
APPENDIX B - EB Modeling Steps: Add Two-Way Left Turn Lanes

Analysis Results for Install Two-Way Left Turn
B-2
� ����������������������������������������������������������������� ��������������������������������������������������������������������������������� !"��� ��������������������������������������������!��#�$�%! ��&!�������������������������������������������'��()�*+�,�-�����������������& &.�&!�������������/�&0���&�!�&�#����������������+&�1�2��"&!������������������������+!/������������������3������4� &�.#�������������#5%5� �������#5%5� �������������������%%��4� &�.#������������������������6�����6�����������������.� 0�&!��'����������������������7������������������&&�/�4�#�������������������������������������������������������������������8#��+�0�#�$�%! ��&!�������������8#��������������+�0�#����4�#���������������6��������������������99����8�:��8�:���8�:��8�:9�8�:��8�:,�8�:-�8�:7�8�:��8�:����������������������������������������8�:��8�:���8�:��8�:9�8�:��8�:,�8�:-�8�:7�8�:��8�:����������������������������������������89:��89:���89:��89:9�89:��89:,�89:-�89:7�89:��89:������������������������������������������:����:���9:������������� ������������������������8��������������&�3!&�������������������������(�� �� �� �������(�- �� �� �������(�� �� �� ���������������������������������������������(�, �� �� �������(�7 �� �� �������(�� �� �� ���������������������������������������������(�� �� �� ����,����9 �� �� ����,����� �� �� ������������������������������������������-��(�� �� �� ����-�'+�� �� �� ����-�'+�� �� �� ������������������������������������������-�8��7 �� �� ���9���4�� �� �� ���)))�����������8!� �"&!������������9��������6�����������8��6���������������������������;�<�8+�;�<�8(�;�<�8'6;��<�+�(;9<��'�;,<���(;�<���������������������������������������4��;�<�*��;��<�*�6;�<�"#� 1�;7<������������8+��������������������9���������������������6�58+�������������������������������������8��������������������������+�������������28���������������������,����-�7�����-��7������������8��������������������������������7�9�������-��-7�7���7�,�777�����������+������������������������������������������������������������������������ ���� �$�%! ��&!����������������������������������������� ���� ��������%%�"��������������������������������������� ��������������$�� "�3�������������������������������������� ��������������#�������������������������������������8 &� &��2! ���&�/��!!�����%�2&���������������������8 &� &!�������������������2�����������4�#����������4�#��=�2�����������������������0&��"�������������������77�����������)9,�,�����������)���-���������������������"�#�����0&��"������������77�����������)9,�,�����������)���-����������������������� !��8�&:�>�� ���������77���������,�)�-�,�����������)�,�7�������������������������������������������������������������������� �������������������������������������������������������������������������������� !"��� ���������������������������������8 &� &��2! ���&�/��!!�����%�2&���������������������8 &� &!�������������������2�����������4�#����������4�#��=�2����������������������"�#������ !��?����������77���������,�)�-�,�����������)�,�7��������������������+!/�+&1�#&�!!�����������������������7�7)-,����������������#/! &���"!�0� /��)����������������������������������#�&��%�$�&&�#��� ���� ��&���������������������������������������������� ������*�#���,@�8!�%&���"��������8�&:������� ���� ������2�����&����������� ! �����������+&�&�������������>�� ������ �A�8�&�>������$�� "�3������������:7)99���������)9��7����:��)���������:�)-�����������)����������B)���������#����������������������)�-�9�������)�,���������)--9-�������)�,����������)�,��������B)����������&3� &!��������������)���-�������)���,�������)7�9��������)9�7-������ �������/�&0��.&�!�&�#��&3� &!��3� ���� �C���&�����.����D&����#&1�#&�!!�)�

Analysis Results for Install Two-Way Left Turn
B-3
��������������������������������������������!��#�$�%! ��&!����������������������������8! �#�&!��� �"� ����������������$���3���������������������������������.E�"��%%�"�������������������6��;99�#�0�#<�����������������������������.� �!%�8#�� ���������������������������99��������������������������8#�� �*&���&&�/�4�#��������������������9��������������������������8! �#�&!���� &D��&���&!������������������������������������������������D&����8#�� ��&F���������������������������7���������������������������&�&����8#�� ��&F���������������������������9��������������#/! &���"!�0� /��)������������������������������������#�&��%������� ���� ��&��������������������������������������3& &"�#������ ��� ! ��&����������������������������������������������� �����,@�8!�%&���"���������������������� ���� ��&�������� ! �������+&�&������������G�� �A�HGH��������������������$�� "�3��:7)99������)�-�,�:��)������:9)�7�����:9)7�����)�����������������������#������������)�-�9����)���-����),�,�����)9�7,�����)9����B)������������������������������������������������������������������������ ���������������������������9���������������������������������������������������� !"��� ��������������������������������*�#����&&"�2! ���3��9��������#�&�������������������������������������������������������8�&:�����������������������������!� "�������������2������>�� ������ �A�8�&�>�����������������������������#��������������������������)--��������B)������
Analysis Results for Install Two-Way Left Turn
B-4
������������ �������������� ����������� �� �
TYP Duration Construction ADT ptotal Cy Total V(count) AlphaEB
lambda V(EB)Projected
Count V(PC)T3-1 365 N 9750 4.476 1.000 7 25.506 0.175 6.557 5.406 6.818 1.948T3-1 366 N 9273 4.277 0.956 8 23.479 0.182 7.322 5.988T3-1 365 N 8797 4.055 0.906 6 21.311 0.190 5.630 4.559T3-1 365 Y 8320 3.843 0.859 5 19.346 0.199 4.770 3.823T3-1 92 Y 7843 0.915 0.204 2 1.794 0.510 1.447 0.709T3-1 273 A 7367 2.557 0.571 6 9.421 0.271 5.066 3.691 3.895 0.636T2-1 366 N 9372 4.321 1.000 11 23.920 0.181 9.793 8.024 6.352 1.765T2-1 365 N 9205 4.235 0.980 4 23.064 0.184 4.043 3.301T2-1 365 N 9011 4.150 0.960 5 22.222 0.187 4.841 3.937T2-1 92 Y 8816 1.024 0.237 2 2.125 0.482 1.530 0.792T2-1 273 A 8816 3.039 0.703 5 12.733 0.239 4.532 3.450 4.467 0.873T2-1 366 A 8599 3.978 0.921 7 20.588 0.193 6.416 5.176 5.848 1.496T2-1 365 A 8430 3.892 0.901 6 19.791 0.197 5.585 4.487 5.721 1.432T1-1 365 N 10015 4.593 1.000 8 26.736 0.172 7.415 6.141 6.968 1.953T1-1 366 N 9801 4.511 0.982 8 25.870 0.174 7.392 6.103T1-1 365 N 9640 4.428 0.964 6 25.004 0.177 5.722 4.708T1-1 91 Y 7162 0.830 0.181 2 1.552 0.535 1.374 0.640T1-1 274 A 10577 3.634 0.791 4 17.494 0.208 3.924 3.109 5.513 1.223T1-1 365 A 9264 4.261 0.928 4 23.323 0.183 4.048 3.308 6.465 1.681T1-1 366 A 9051 4.179 0.910 5 22.507 0.186 4.848 3.948 6.339 1.617T1-1 365 A 8888 4.095 0.892 4 21.697 0.189 4.018 3.260 6.212 1.553
SE2647 Actual 41 41.000 6.403 38.436 44.460 10.510 3.242
5.300 Theta 0.9223288 Dispersion 1.0496 58.715 bias 1.005 Variance Std Error
6.518 Unbiased 0.917 0.025 0.1570.813
CRF 0.083 0.157
Z 0.526P-value 0.299
Summary of CRF Calculations for Total Crashes

Analysis Results for Install Two-Way Left Turn
B-5
���������������������������������������������������������������� ������ ������"!.� �-�����,��������������������������������������������������������� !"��� ��������������������������������������������!��#�$�%! ��&!�������������������������������������������'��()�*+�,�-�����������������& &.�&!�������������/�&0���&�!�&�#����������������+&�1�2��"&!������������������������+!/������������������3������4� &�.#�������������$25%5� ������$25%5� �������������������%%��4� &�.#������������������������6�����6�����������������.� 0�&!��'����������������������7������������������&&�/�4�#�������������������������������������������������������������������8#��+�0�#�$�%! ��&!�������������8#��������������+�0�#����4�#���������������6��������������������99����8�:��8�:���8�:��8�:9�8�:��8�:,�8�:-�8�:7�8�:��8�:����������������������������������������8�:��8�:���8�:��8�:9�8�:��8�:,�8�:-�8�:7�8�:��8�:����������������������������������������89:��89:���89:��89:9�89:��89:,�89:-�89:7�89:��89:������������������������������������������:����:���9:������������� ������������������������8��������������&�3!&�������������������������(�� �� �� �������(�- �� �� �������(�� �� �� ���������������������������������������������(�, �� �� �������(�7 �� �� �������(�� �� �� ���������������������������������������������(�� �� �� ����,����9 �� �� ����,����� �� �� ������������������������������������������-��(�� �� �� ����-�'+�� �� �� ����-�'+�� �� �� ������������������������������������������-�8��7 �� �� ���9���4�� �� �� ���)))�����������8!� �"&!������������9��������6�����������8��6���������������������������;�<�8+�;�<�8(�;�<�8'6;��<�+�(;9<��'�;,<���(;�<���������������������������������������4��;�<�*��;��<�*�6;�<�"#� 1�;7<������������8+��������������������9���������������������6�58+�������������������������������������8��������������������������+�������������28���������������������,����-�7�����-��7������������8��������������������������������7�9�������-��-7�7���7�,�777�����������+������������������������������������������������������������������������ ���� �$�%! ��&!����������������������������������������� ���� ��������%%�"��������������������������������������� ��������������$�� "�3�������������������������������������� ��������������#�������������������������������������8 &� &��2! ���&�/��!!�����%�2&���������������������8 &� &!�������������������2�����������4�#����������4�#��=�2�����������������������0&��"�������������������77���������7�)--�������������)�7,,���������������������"�#�����0&��"������������77���������7�)--�������������)�7,,����������������������� !��8�&:�>�� ���������77���������,-)���������������)��-7����������������������������������������������������������������� ������ ������"!.� �-�����,���,����������������������������������������������������� !"��� ���������������������������������8 &� &��2! ���&�/��!!�����%�2&���������������������8 &� &!�������������������2�����������4�#����������4�#��=�2����������������������"�#������ !��?����������77���������,-)���������������)��-7��������������������+!/�+&1�#&�!!����������������������:���)-��-���������������#/! &���"!�0� /��)�����������������������������������#�&��%�$�&&�#��� ���� ��&���������������������������������������������� ������*�#���,@�8!�%&���"��������8�&:������� ���� ������2�����&����������� ! �����������+&�&�������������>�� ������ �A�8�&�>������$�� "�3������������:�)9��7�������)7�-,����:��)7�-������:�)�779�������9)-���������B)���������#����������������������)�99,�������)��7��������),--7�������)9��9��������)����������B)����������&3� &!��������������)�-���������)�-,��������)7����������)��7���

Analysis Results for Install Two-Way Left Turn
B-6
���� �������/�&0��.&�!�&�#��&3� &!��3� ���� �C���&�����.����D&����#&1�#&�!!�)����������������������������������������������!��#�$�%! ��&!����������������������������8! �#�&!��� �"� ����������������$���3���������������������������������.E�"��%%�"�������������������6��;99�#�0�#<�����������������������������.� �!%�8#�� ���������������������������99��������������������������8#�� �*&���&&�/�4�#��������������������9��������������������������8! �#�&!���� &D��&���&!������������������������������������������������D&����8#�� ��&F���������������������������7���������������������������&�&����8#�� ��&F���������������������������9��������������#/! &���"!�0� /��)������������������������������������#�&��%������� ���� ��&��������������������������������������3& &"�#������ ��� ! ��&����������������������������������������������� �����,@�8!�%&���"���������������������� ���� ��&�������� ! �������+&�&������������G�� �A�HGH��������������������$�� "�3��:�)9��7����)9,-��:��)�-����:9)7�99���:9),�����)�����������������������#������������)�99,����)�-�9����)���,����)��7-����9),-����)������������������������������������*�#����&&"�2! ���3��9��������#�&�������������������������������������������������������8�&:�����������������������������!� "�������������2������>�� ������ �A�8�&�>�����������������������������#��������������������������)-7���������)����

Analysis Results for Install Two-Way Left Turn
B-7
������������ �������������� ������������ � ���������� �� �
TYP Duration Construction ADT pIF Cy I_F V(count) AlphaEB
lambda V(EB)Projected
Count V(PC)T3-1 365 N 9750 1.262 1.000 2 3.112 0.405 1.701 1.011 1.751 0.357T3-1 366 N 9273 1.207 0.957 3 2.901 0.416 2.254 1.316T3-1 365 N 8797 1.146 0.908 1 2.673 0.429 1.063 0.607T3-1 365 Y 8320 1.088 0.862 1 2.464 0.442 1.039 0.580T3-1 92 Y 7843 0.260 0.206 2 0.338 0.768 0.663 0.154T3-1 273 A 7367 0.727 0.576 2 1.340 0.542 1.309 0.599 1.008 0.118T2-1 366 N 9372 1.220 1.000 3 2.948 0.414 2.263 1.327 1.698 0.336T2-1 365 N 9205 1.196 0.981 1 2.858 0.418 1.082 0.629T2-1 365 N 9011 1.172 0.961 2 2.769 0.423 1.650 0.951T2-1 92 Y 8816 0.290 0.237 1 0.387 0.748 0.468 0.118T2-1 273 A 8816 0.859 0.704 2 1.717 0.500 1.429 0.714 1.196 0.167T2-1 366 A 8599 1.125 0.923 0 2.597 0.433 0.488 0.276 1.567 0.286T2-1 365 A 8430 1.102 0.903 3 2.512 0.439 2.167 1.217 1.534 0.274T1-1 365 N 10015 1.294 1.000 2 3.239 0.399 1.718 1.032 2.343 0.474T1-1 366 N 9801 1.272 0.983 5 3.150 0.404 3.495 2.084T1-1 365 N 9640 1.249 0.965 2 3.060 0.408 1.693 1.002T1-1 91 Y 7162 0.236 0.182 0 0.301 0.785 0.185 0.040T1-1 274 A 10577 1.022 0.790 1 2.236 0.457 1.010 0.548 1.851 0.296T1-1 365 A 9264 1.203 0.930 1 2.885 0.417 1.085 0.632 2.178 0.410T1-1 366 A 9051 1.180 0.912 2 2.800 0.422 1.654 0.957 2.138 0.395T1-1 365 A 8888 1.157 0.895 0 2.714 0.426 0.494 0.283 2.096 0.379
SE2647 Actual 11 11.000 3.317 9.636 13.568 2.325 1.525
1.329 ThetaHat 0.8113288 16.919 bias 1.013 Variance Std Error
1.878 ThetaHatU 0.801 0.065 0.2540.708
CRF 0.199 0.254
Z 0.784P-value 0.217
Summary of CRF Calculations for Total Crashes

C-1
APPENDIX C - EB Modeling Steps: Install Median Barriers

Analysis Results for Install Median Barrier
C-2
������������������������������������������������������������������ �����������������������������
��������������������������������������������������������������������������������������������������
������������������������������������������������� !"#���!�����������������������������������������
��������������������������������������������������������������������������������������������������
����������������������������������������"����$%&"!�'"%������������������������������������������
��������������������������������������������������������������������������������������������������
����������������������������������������(�)*+���������������������������������������������������
���������������'�!',�'"%������������-�'.��/'%"'�����������������������������������������������
��������������0'%1�2�%#'"%�����������������������0"-���������������������������������������������
����������������3�%��%�4�!'�,�������������������"�������"��������������������������������������
���������������&&���4�!'�,�������������������������5�����5���������������������������������������
���������������,��!.�'"%��6����������������������������������������������������������������������
��������������������������������������������������������������������������������������������������
��������������������������������������������������������������������������������������������������
������������������������������������7�����0�.���$%&"!�'"%���������������������������������������
��������������������������������������������������������������������������������������������������
���������7�����������������0�.�������4������������������������������������������������������������
��������������������������������������������������������������������������������������������������
����������5 �������������������������7�8��7�8���7�8��7�89�7�8��7�8��7�8��7�8��7�8:�7�8������������
�������������������������������������7�8��7�8���7�8��7�89�7�8��7�8��7�8��7�8��7�8:�7�8������������
�������������������������������������798��798���798��7989�798��798��798��798��798:�798������������
�������������������������������������7�8��7�8���7�8��7�89�7�8��7�8��7�8��7�8��7�8:�7�8������������
���������������������������������������8����8���98����8�������������������������������������������
����������!���%�������������������7������������������������������������������������������������
���������7"%�!�#'"%�����������������������������������������������������������������������������
���������7��5������������������������765;��<���0;�<�2)�;�<�=��;:<��6�;�<��������������������������
����������70��������������������������������������������������������������������������������������
����������5�>70����������������������$������������������������������������������������������������
����������7��������������������������2�0����������������������������������������������������������
���������27���������������������������������������������������������������������������������������
��������������������������������������������������������������������������������������������������
��������������������������������������������������������������������������������������������������
�������������������������������������� �!���!�$%&"!�'"%���������������������������������������
��������������������������������������������������������������������������������������������������
������������������������������������ �!���!��������&&�#����������������������������������������
��������������������������������������������������������������������������������������������������
������������������������������������ !�������������$%�!#�3�������������������������������������
������������������������������������ !��������������%��������������������������������������������
��������������������������������������������������������������������������������������������������
��������������������������������������������������������������������������������������������������
�����������������������������7!'�!'��2"!�������'%-��""�%�����&�2'�������������������������������
��������������������������������������������������������������������������������������������������
������������������7!'�!'"%������������������2�����������4������������4����?�2��������������������
��������������������������������������������������������������������������������������������������
��������������������.'�%#�����������������������������9��+99�9�����������+������������������������
�������������������#�������.'�%#����������������������9��+99�9�����������+������������������������
������������������ ��!�"%�7�'8�@��!�������������������9��+���������������+������������������������
�������������������#����� ��!�"%�A��������������������9��+���������������+������������������������
������������������0"-�0'1��'�""����������������������9���+�9��������������������������������������
��������������������������������������������������������������������������������������������������
��������������������������������������������������������������������������������������������������
�������������-"!'��#"%.�!-��+�������������������������������������������������������������������
����

Analysis Results for Install Median Barrier
C-3
��������������������������������������������������������������� ���������������������������:�
��������������������������������������������������������������������������������������������������
������������������������������������������������� !"#���!�����������������������������������������
��������������������������������������������������������������������������������������������������
������������������������������%����'���&�$%''��� �!���!���'���������������������������������
��������������������������������������������������������������������������������������������������
��������������������������������������%��!������(������B�7"%&'��%#��������7�'8�������������������
���� �!���!������2������'����������!!"!�����������0''��������������@��!����� !�C�7�'�@�����
��������������������������������������������������������������������������������������������������
����$%�!#�3�����������8��+�9::������9+��������8��+�:������8��+������������+99��������D+���������
�����%���������������������+�����������+99::�������+�:���������+����������99+����������D+���������
�����'�3�!�'"%�������������+��:9�������+�9���������+9����������+��9�������������������������������
��������������������������������������������������������������������������������������������������
���� �����%�-�'.��,'%"'����'�3�!�'"%�3�!���!�E�����'����,���F'���'1��'�""�+�������������
��������������������������������������������������������������������������������������������������
��������������������������������������������������������������������������������������������������
�������������������������������������������"����$%&"!�'"%���������������������������������������
��������������������������������������������������������������������������������������������������
�������������������������7"!!���'"%��!�#�!����������������$%��3�%��%��������������������������
���������������������������,G�#��&&�#�������������������5 �;�����.���<��������������������������
���������������������������,�!�"&�7����!��������������������������������������������������������
�������������������������7"!!���'"%���!'F��'�%�'"%������������������:��������������������������
���������������������������F'��7����!��'H���������������������������:��������������������������
��������������������������'%'��7����!��'H���������������������������9��������������������������
��������������������������������������������������������������������������������������������������
��������������������������������������������������������������������������������������������������
�������������-"!'��#"%.�!-��+�������������������������������������������������������������������
��������������������������������������������������������������������������������������������������
��������������������������������������������������������������������������������������������������
�������������������������������%����'���&����� �!���!���'������������������������������������
��������������������������������3'!'#�����%��!���!!"!���'������������������������������������
��������������������������������������������������������������������������������������������������
��������������������������������������%��!������B�7"%&'��%#��������������������������������������
����������������� �!���!���'�������!!"!�������0''�������������I� !�C�JIJ�������������������
��������������������������������������������������������������������������������������������������
�����������������$%�!#�3�8��+�9::����+�����89�+9�:���8�+�������89+9�����+�����������������������
������������������%�����������+��������+��������+���9����+��������9+:�����+�����������������������
��������������������������������������������������������������������������������������������������
��������������������������������������������������������������������������������������������������
����������������������������(������'�'#��2"!���3��9������%����'��������������������������������
��������������������������������������������������������������������������������������������������
����������������������������������������������������7�'8������������������������������������������
���������������������������"�!#�������������2������@��!����� !�C�7�'�@����������������������������
��������������������������������������������������������������������������������������������������
���������������������������%�������������������������+�����������+�������������������������������
�
�
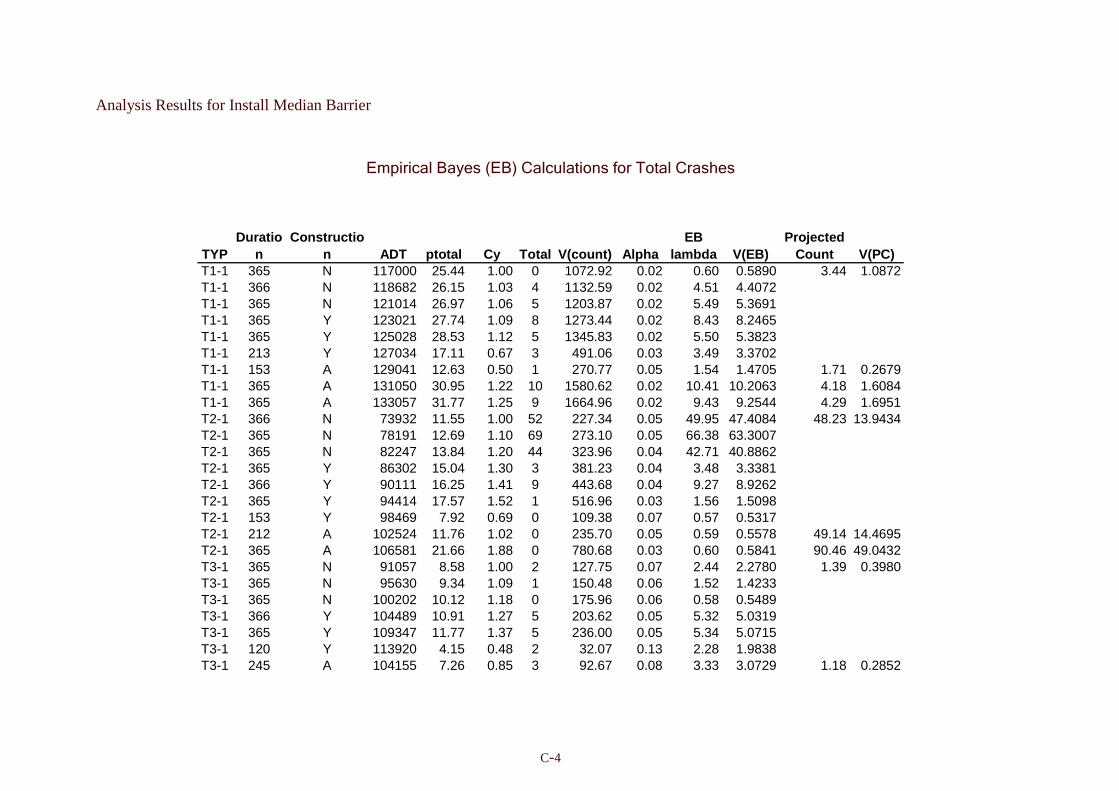
Analysis Results for Install Median Barrier
C-4
�
������������ �������������� ����������� ��
TYPDuratio
nConstructio
n ADT ptotal Cy Total V(count) AlphaEB
lambda V(EB)Projected
Count V(PC)T1-1 365 N 117000 25.44 1.00 0 1072.92 0.02 0.60 0.5890 3.44 1.0872T1-1 366 N 118682 26.15 1.03 4 1132.59 0.02 4.51 4.4072T1-1 365 N 121014 26.97 1.06 5 1203.87 0.02 5.49 5.3691T1-1 365 Y 123021 27.74 1.09 8 1273.44 0.02 8.43 8.2465T1-1 365 Y 125028 28.53 1.12 5 1345.83 0.02 5.50 5.3823T1-1 213 Y 127034 17.11 0.67 3 491.06 0.03 3.49 3.3702T1-1 153 A 129041 12.63 0.50 1 270.77 0.05 1.54 1.4705 1.71 0.2679T1-1 365 A 131050 30.95 1.22 10 1580.62 0.02 10.41 10.2063 4.18 1.6084T1-1 365 A 133057 31.77 1.25 9 1664.96 0.02 9.43 9.2544 4.29 1.6951T2-1 366 N 73932 11.55 1.00 52 227.34 0.05 49.95 47.4084 48.23 13.9434T2-1 365 N 78191 12.69 1.10 69 273.10 0.05 66.38 63.3007T2-1 365 N 82247 13.84 1.20 44 323.96 0.04 42.71 40.8862T2-1 365 Y 86302 15.04 1.30 3 381.23 0.04 3.48 3.3381T2-1 366 Y 90111 16.25 1.41 9 443.68 0.04 9.27 8.9262T2-1 365 Y 94414 17.57 1.52 1 516.96 0.03 1.56 1.5098T2-1 153 Y 98469 7.92 0.69 0 109.38 0.07 0.57 0.5317T2-1 212 A 102524 11.76 1.02 0 235.70 0.05 0.59 0.5578 49.14 14.4695T2-1 365 A 106581 21.66 1.88 0 780.68 0.03 0.60 0.5841 90.46 49.0432T3-1 365 N 91057 8.58 1.00 2 127.75 0.07 2.44 2.2780 1.39 0.3980T3-1 365 N 95630 9.34 1.09 1 150.48 0.06 1.52 1.4233T3-1 365 N 100202 10.12 1.18 0 175.96 0.06 0.58 0.5489T3-1 366 Y 104489 10.91 1.27 5 203.62 0.05 5.32 5.0319T3-1 365 Y 109347 11.77 1.37 5 236.00 0.05 5.34 5.0715T3-1 120 Y 113920 4.15 0.48 2 32.07 0.13 2.28 1.9838T3-1 245 A 104155 7.26 0.85 3 92.67 0.08 3.33 3.0729 1.18 0.2852 �
�
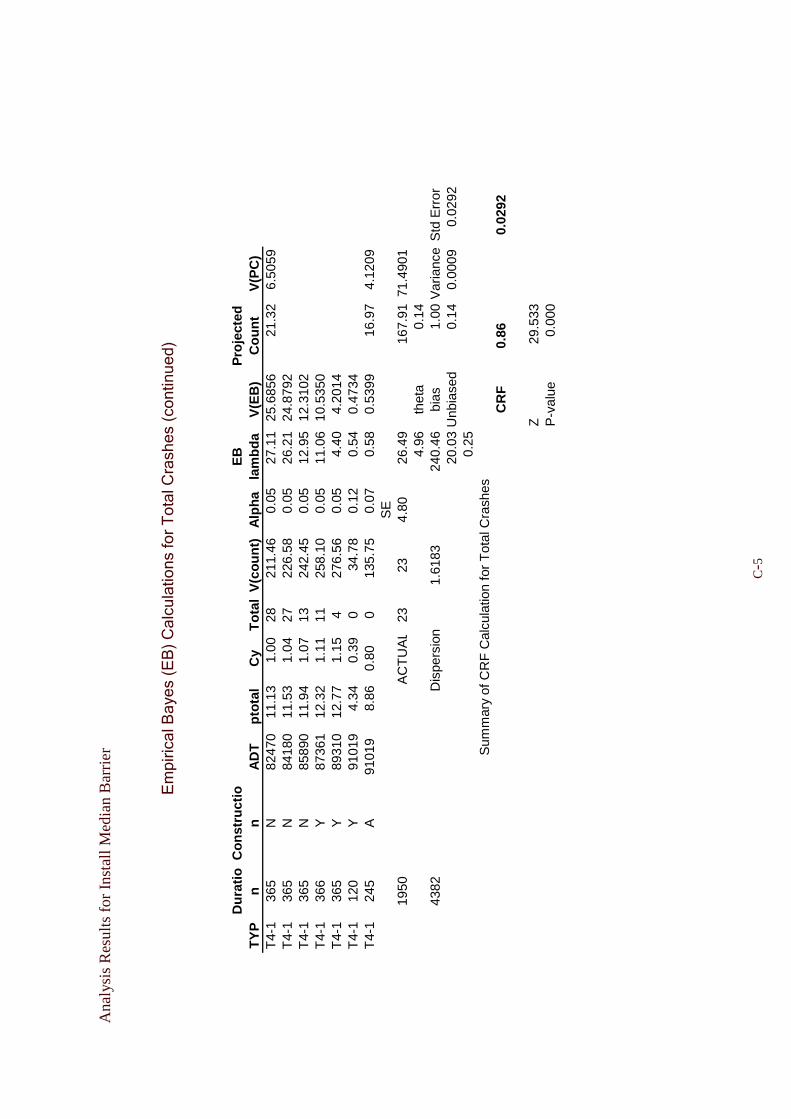
Ana
lysi
s R
esul
ts f
or I
nsta
ll M
edia
n B
arri
er
C-5
�
��
�����
��
��� �
�
��
���
���
���� ���
����
��
�� �� �
����������
TY
PD
ura
tio
nC
on
stru
ctio
nA
DT
pto
tal
Cy
To
tal
V(c
ou
nt)
Alp
ha
EB
la
mb
da
V(E
B)
Pro
ject
ed
Co
un
tV
(PC
)T
4-1
365
N82
470
11.1
31.
0028
211.
460.
0527
.11
25.6
856
21.3
26.
5059
T4-
136
5N
8418
011
.53
1.04
2722
6.58
0.05
26.2
124
.879
2T
4-1
365
N85
890
11.9
41.
0713
242.
450.
0512
.95
12.3
102
T4-
136
6Y
8736
112
.32
1.11
1125
8.10
0.05
11.0
610
.535
0T
4-1
365
Y89
310
12.7
71.
154
276.
560.
054.
404.
2014
T4-
112
0Y
9101
94.
340.
390
34.7
80.
120.
540.
4734
T4-
124
5A
9101
98.
860.
800
135.
750.
070.
580.
5399
16.9
74.
1209
SE
1950
AC
TU
AL
2323
4.80
26.4
916
7.91
71.4
901
4.96
thet
a0.
1443
82D
ispe
rsio
n 1.
6183
240.
46bi
as1.
00V
aria
nce
Std
Err
or20
.03
Unb
iase
d0.
140.
0009
0.02
920.
25
CR
F0.
860.
0292
Z29
.533
P-v
alue
0.00
0
Sum
mar
y of
CR
F C
alcu
latio
n fo
r T
otal
Cra
shes
��

Analysis Results for Install Median Barrier
C-6
���������������������������������������������������������� ���������������������������9�
��������������������������������������������������������������������������������������������������
������������������������������������������������� !"#���!�����������������������������������������
��������������������������������������������������������������������������������������������������
����������������������������������������"����$%&"!�'"%������������������������������������������
��������������������������������������������������������������������������������������������������
����������������������������������������(�)*+���������������������������������������������������
���������������'�!',�'"%������������-�'.��/'%"'�����������������������������������������������
��������������0'%1�2�%#'"%�����������������������0"-���������������������������������������������
����������������3�%��%�4�!'�,�������������������"�������"��������������������������������������
���������������&&���4�!'�,�������������������������5�����5���������������������������������������
���������������,��!.�'"%��6����������������������������������������������������������������������
��������������������������������������������������������������������������������������������������
��������������������������������������������������������������������������������������������������
������������������������������������7�����0�.���$%&"!�'"%���������������������������������������
��������������������������������������������������������������������������������������������������
���������7�����������������0�.�������4������������������������������������������������������������
��������������������������������������������������������������������������������������������������
����������5 �������������������������7�8��7�8���7�8��7�89�7�8��7�8��7�8��7�8��7�8:�7�8������������
�������������������������������������7�8��7�8���7�8��7�89�7�8��7�8��7�8��7�8��7�8:�7�8������������
�������������������������������������798��798���798��7989�798��798��798��798��798:�798������������
�������������������������������������7�8��7�8���7�8��7�89�7�8��7�8��7�8��7�8��7�8:�7�8������������
���������������������������������������8����8���98����8�������������������������������������������
����������!���%�������������������7������������������������������������������������������������
���������7"%�!�#'"%�����������������������������������������������������������������������������
���������7��5������������������������765;��<���0;�<�2)�;�<�=��;:<��6�;�<��������������������������
����������70��������������������������������������������������������������������������������������
����������5�>70����������������������$������������������������������������������������������������
����������7��������������������������2�0����������������������������������������������������������
���������27���������������������������������������������������������������������������������������
��������������������������������������������������������������������������������������������������
��������������������������������������������������������������������������������������������������
�������������������������������������� �!���!�$%&"!�'"%���������������������������������������
��������������������������������������������������������������������������������������������������
������������������������������������ �!���!��������&&�#����������������������������������������
��������������������������������������������������������������������������������������������������
������������������������������������ !�������������$%�!#�3�������������������������������������
������������������������������������ !��������������%��������������������������������������������
������������������������������������ !9�������������'�3"'%��������������������������������������
��������������������������������������������������������������������������������������������������
��������������������������������������������������������������������������������������������������
�����������������������������7!'�!'��2"!�������'%-��""�%�����&�2'�������������������������������
��������������������������������������������������������������������������������������������������
������������������7!'�!'"%������������������2�����������4������������4����?�2��������������������
��������������������������������������������������������������������������������������������������
��������������������.'�%#�������������������:���������9�9+���������������+������������������������
�������������������#�������.'�%#������������:���������9�9+���������������+������������������������
������������������ ��!�"%�7�'8�@��!���������:���������999+���������������+���:��������������������
�������������������#����� ��!�"%�A����������:���������999+���������������+���:��������������������
������������������0"-�0'1��'�""��������������������������+�9��������������������������������������
��������������������������������������������������������������������������������������������������
��������������������������������������������������������������������������������������������������
�������������-"!'��#"%.�!-��+�������������������������������������������������������������������
��������

Analysis Results for Install Median Barrier
C-7
��������������������������������������������������� �����������������������������
��������������������������������������������������������������������������������������������������
������������������������������������������������� !"#���!�����������������������������������������
��������������������������������������������������������������������������������������������������
������������������������������%����'���&�$%''��� �!���!���'���������������������������������
��������������������������������������������������������������������������������������������������
��������������������������������������%��!������(������B�7"%&'��%#��������7�'8�������������������
���� �!���!������2������'����������!!"!�����������0''��������������@��!����� !�C�7�'�@�����
��������������������������������������������������������������������������������������������������
����$%�!#�3�����������8��+�::�������9+�9������8�:+���:����8�9+������������+::��������D+���������
�����%���������������������+�����������+9����������+9:���������+�9��������9�+�:��������D+���������
�����'�3"'%�������������8�+�����������+���������8�+���������8�+���9��������+:���������D+���������
�����'�3�!�'"%�������������+�����������+�����������+�����������+����������������������������������
��������������������������������������������������������������������������������������������������
���� �����%�-�'.��,'%"'����'�3�!�'"%�3�!���!�E�����'����,���F'���'1��'�""�+�������������
��������������������������������������������������������������������������������������������������
��������������������������������������������������������������������������������������������������
�������������������������������������������"����$%&"!�'"%���������������������������������������
��������������������������������������������������������������������������������������������������
�������������������������7"!!���'"%��!�#�!����������������$%��3�%��%��������������������������
���������������������������,G�#��&&�#�������������������5 �;�����.���<��������������������������
���������������������������,�!�"&�7����!��������������������������������������������������������
�������������������������7"!!���'"%���!'F��'�%�'"%������������������:��������������������������
���������������������������F'��7����!��'H���������������������������:��������������������������
��������������������������'%'��7����!��'H���������������������������9��������������������������
��������������������������������������������������������������������������������������������������
��������������������������������������������������������������������������������������������������
�������������-"!'��#"%.�!-��+�������������������������������������������������������������������
��������������������������������������������������������������������������������������������������
��������������������������������������������������������������������������������������������������
�������������������������������%����'���&����� �!���!���'������������������������������������
��������������������������������3'!'#�����%��!���!!"!���'������������������������������������
��������������������������������������������������������������������������������������������������
��������������������������������������%��!������B�7"%&'��%#��������������������������������������
����������������� �!���!���'�������!!"!�������0''�������������I� !�C�JIJ�������������������
��������������������������������������������������������������������������������������������������
�����������������$%�!#�3�8��+�::�����+��:��89�+9�:9��8�+��:����89+������+�����������������������
������������������%�����������+��������+��������+:�9����9+��������9+������+�����������������������
������������������'�3"'%���8�+��������+������8�+������8�+�������89+������+�����������������������
��������������������������������������������������������������������������������������������������
��������������������������������������������������������������������������������������������������
����������������������������(������'�'#��2"!���3��9������%����'��������������������������������
��������������������������������������������������������������������������������������������������
����������������������������������������������������7�'8������������������������������������������
���������������������������"�!#�������������2������@��!����� !�C�7�'�@����������������������������
��������������������������������������������������������������������������������������������������
���������������������������%�������������������������+�:���������+��������������������������������
���������������������������'�3"'%�������������������+�9���������+������������������������������

Analysis Results for Install Median Barrier
C-8
�
������������ �������������� ������������ � ���������� ��
TYP Duration Construction ADT ptotal Cy Total V(count) AlphaEB
lambda V(EB)Projected
Count V(PC)T1-1 365 N 117000 13.79 1.00 0 313.582 0.04 0.61 0.580 1.70 0.592T1-1 366 N 118682 12.51 0.91 1 259.231 0.05 1.56 1.480T1-1 365 N 121014 11.39 0.83 2 215.948 0.05 2.50 2.364T1-1 365 Y 123021 10.35 0.75 5 179.126 0.06 5.31 5.002T1-1 365 Y 125028 9.39 0.68 1 148.522 0.06 1.53 1.434T1-1 213 Y 127034 5.11 0.37 0 46.214 0.11 0.56 0.502T1-1 153 A 129041 3.54 0.26 0 23.316 0.15 0.54 0.456 0.44 0.039T1-1 365 A 131050 7.94 0.58 3 107.454 0.07 3.37 3.117 0.98 0.197T1-1 365 A 133057 7.20 0.52 0 88.943 0.08 0.58 0.536 0.89 0.161T2-1 366 N 73932 5.53 1.00 27 53.708 0.10 24.79 22.238 27.64 8.497T2-1 365 N 78191 5.37 0.97 36 50.832 0.11 32.76 29.303T2-1 365 N 82247 5.18 0.94 25 47.507 0.11 22.84 20.348T2-1 365 Y 86302 4.98 0.90 1 44.044 0.11 1.45 1.286T2-1 366 Y 90111 4.75 0.86 5 40.368 0.12 4.97 4.386T2-1 365 Y 94414 4.54 0.82 0 37.052 0.12 0.56 0.488T2-1 153 Y 98469 1.88 0.34 0 7.426 0.25 0.47 0.354T2-1 212 A 102524 2.62 0.47 0 13.467 0.19 0.51 0.411 13.11 1.913T2-1 365 A 106581 4.38 0.79 0 34.636 0.13 0.55 0.484 21.90 5.336T3-1 365 N 91057 3.43 1.00 1 22.009 0.16 1.38 1.164 1.14 0.331T3-1 365 N 95630 3.30 0.96 1 20.502 0.16 1.37 1.150T3-1 365 N 100202 3.17 0.92 0 18.960 0.17 0.53 0.440T3-1 366 Y 104489 3.02 0.88 4 17.349 0.17 3.83 3.163T3-1 365 Y 109347 2.87 0.84 2 15.904 0.18 2.16 1.768T3-1 120 Y 113920 0.94 0.27 1 2.313 0.40 0.97 0.580T3-1 245 A 104155 1.53 0.45 2 5.222 0.29 1.86 1.317 0.51 0.066 �
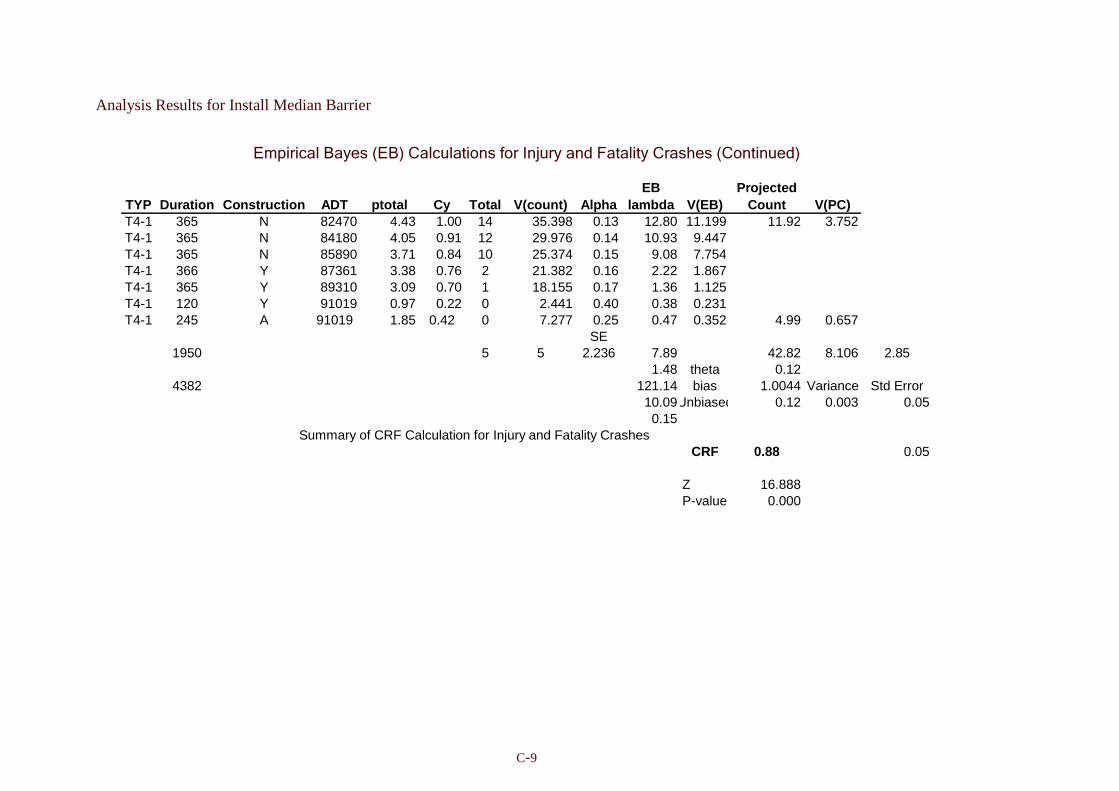
Analysis Results for Install Median Barrier
C-9
������������ �������������� ������������ � ���������� �� ���������� �
TYP Duration Construction ADT ptotal Cy Total V(count) AlphaEB
lambda V(EB)Projected
Count V(PC)T4-1 365 N 82470 4.43 1.00 14 35.398 0.13 12.80 11.199 11.92 3.752T4-1 365 N 84180 4.05 0.91 12 29.976 0.14 10.93 9.447T4-1 365 N 85890 3.71 0.84 10 25.374 0.15 9.08 7.754T4-1 366 Y 87361 3.38 0.76 2 21.382 0.16 2.22 1.867T4-1 365 Y 89310 3.09 0.70 1 18.155 0.17 1.36 1.125T4-1 120 Y 91019 0.97 0.22 0 2.441 0.40 0.38 0.231T4-1 245 A 91019 1.85 0.42 0 7.277 0.25 0.47 0.352 4.99 0.657
SE1950 5 5 2.236 7.89 42.82 8.106 2.85
1.48 theta 0.124382 121.14 bias 1.0044 Variance Std Error
10.09Unbiased 0.12 0.003 0.050.15
CRF 0.88 0.05
Z 16.888P-value 0.000
Summary of CRF Calculation for Injury and Fatality Crashes
��

D-1
APPENDIX D - EB Modeling Steps: Flatten Slope, Remove Guardrail
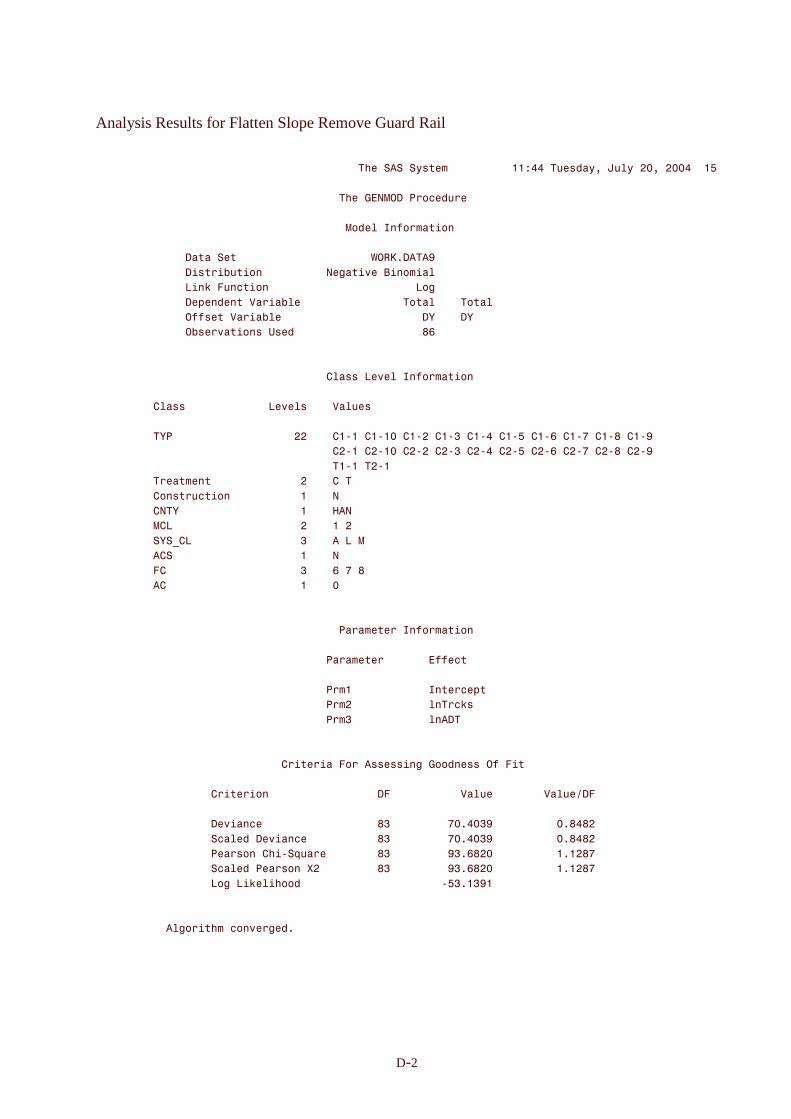
Analysis Results for Flatten Slope Remove Guard Rail
D-2
������������������������������������������������������������������ ���������������������� �����
�
���������������������������������������������������� ������
�
���������������������������������������������!"#���$�"�
�
�����������������������������������������%�&'(����)�
���������������$��$*�$�"������������+�$,��-$"�$���
��������������.$"/�0�" $�"�����������������������.�+�
����������������1�"��"�2��$�*�������������������������������
���������������##���2��$�*�������������������������3�����3�
���������������*���,�$�"��4�����������������������56�
�
�
������������������������������������7�����.�,���!"#���$�"�
�
���������7�����������������.�,�������2������
�
����������3��������������������������7�8��7�8���7�8��7�89�7�8 �7�8��7�86�7�8:�7�85�7�8)�
�������������������������������������7�8��7�8���7�8��7�89�7�8 �7�8��7�86�7�8:�7�85�7�8)�
���������������������������������������8����8��
��������������"�������������������7���
���������7�"��� $�"������������������
���������7��3������������������������;���
����������7.�����������������������������
����������3�<7.�����������������9������.���
����������7����������������������������
���������07���������������������9����6�:�5�
����������7����������������������������
�
�
����������������������������������������������!"#���$�"�
�
���������������������������������������������������##� �
�
���������������������������������������������������!"�� �1�
����������������������������������������������������"�� /��
��������������������������������������9�������������"����
�
�
�����������������������������7�$��$��0���������$"+�����"�����#�0$�
�
������������������7�$��$�"������������������0�����������2������������2����=�0�
�
��������������������,$�" �������������������59���������:�( �9)�����������(5 5��
������������������� �������,$�" ������������59���������:�( �9)�����������(5 5��
������������������������"�7�$8�>������������59���������)9(65�������������(��5:�
������������������� �����������"�?����������59���������)9(65�������������(��5:�
������������������.�+�.$/��$��������������������������8�9(�9)��
�
�
�������������+��$�� �",��+��(�
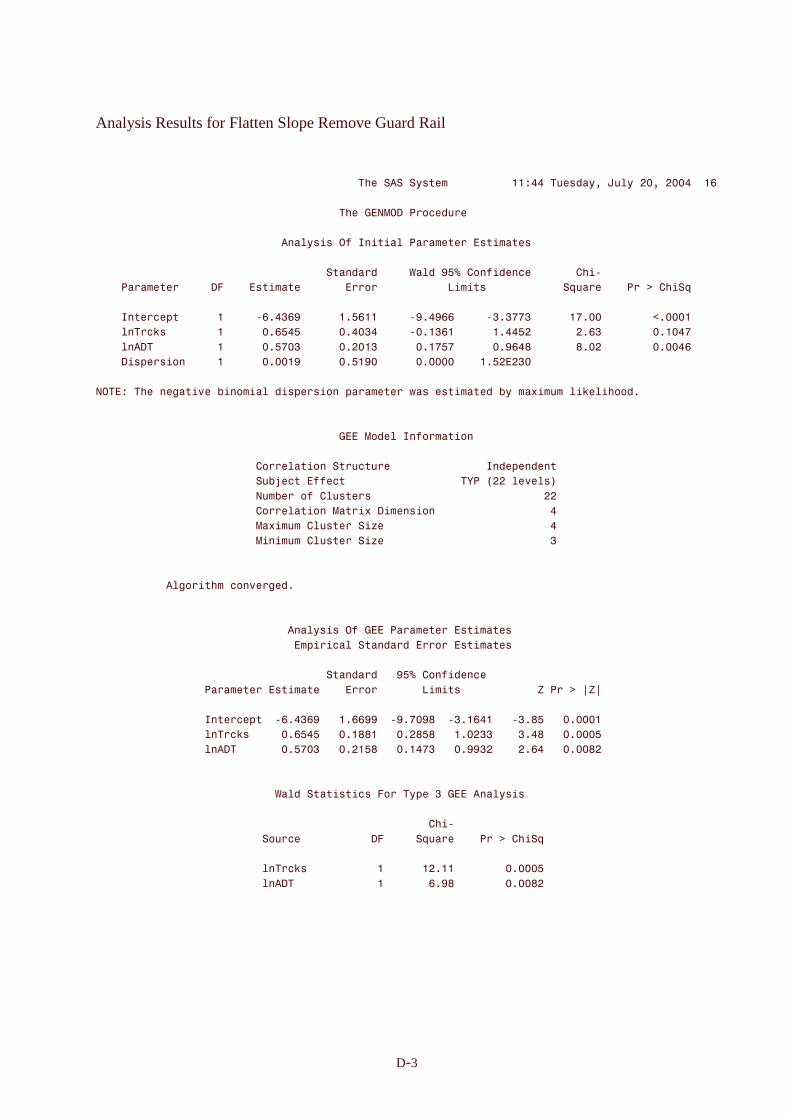
Analysis Results for Flatten Slope Remove Guard Rail
D-3
�
������������������������������������������������������������������ ���������������������� ���6�
�
���������������������������������������������������� ������
�
������������������������������"����$���#�!"$$�������������$����
�
��������������������������������������"���������%����)�@�7�"#$��" ��������7�$8�
�����������������0������$�������������������������.$$��������������>�����������A�7�$�>�
�
����!"�� �1������������86( 96)�������(�6�������8)( )66�����89(9::9�������:(����������B(�����
�����"�� /�����������������(6� ��������( �9 �����8�(�96��������( ����������(69���������(�� :�
�����"���������������������(�:�9�������(���9�������(�:�:�������()6 5�������5(�����������(�� 6�
�����$�1���$�"�������������(���)�������(��)��������(���������(����9��
�
����������"�+�$,��*$"�$����$�1���$�"�1�������C�����$����*���D$���$/��$����(�
�
�
������������������������������������������������!"#���$�"�
�
�������������������������7������$�"���� ������������������!"��1�"��"�
���������������������������*E� ��##� �������������������3��F�����,���G�
���������������������������*����#�7������������������������������������
�������������������������7������$�"����$D��$�"�$�"������������������ �
���������������������������D$��7�������$H��������������������������� �
��������������������������$"$��7�������$H���������������������������9�
�
�
�������������+��$�� �",��+��(�
�
�
�������������������������������"����$���#���������������$����
��������������������������������1$�$ �����"�������������$����
�
��������������������������������������"�������)�@�7�"#$��" ��
���������������������������$������������������.$$�������������I����A�JIJ�
�
�����������������!"�� �1��86( 96)����(66))��8)(:�)5��89(�6 ����89(5�����(�����
������������������"�� /�������(6� �����(�55�����(�5�5����(��99����9( 5����(�����
������������������"�����������(�:�9����(���5����(� :9����())9������(6 ����(��5��
�
�
����������������������������%������$�$ ��0�����1��9������"����$��
�
����������������������������������������������������7�$8�
������������������������������ �������������0������>�����������A�7�$�>�
�
���������������������������"�� /���������������������(�����������(�����
���������������������������"������������������������6()5���������(��5� �
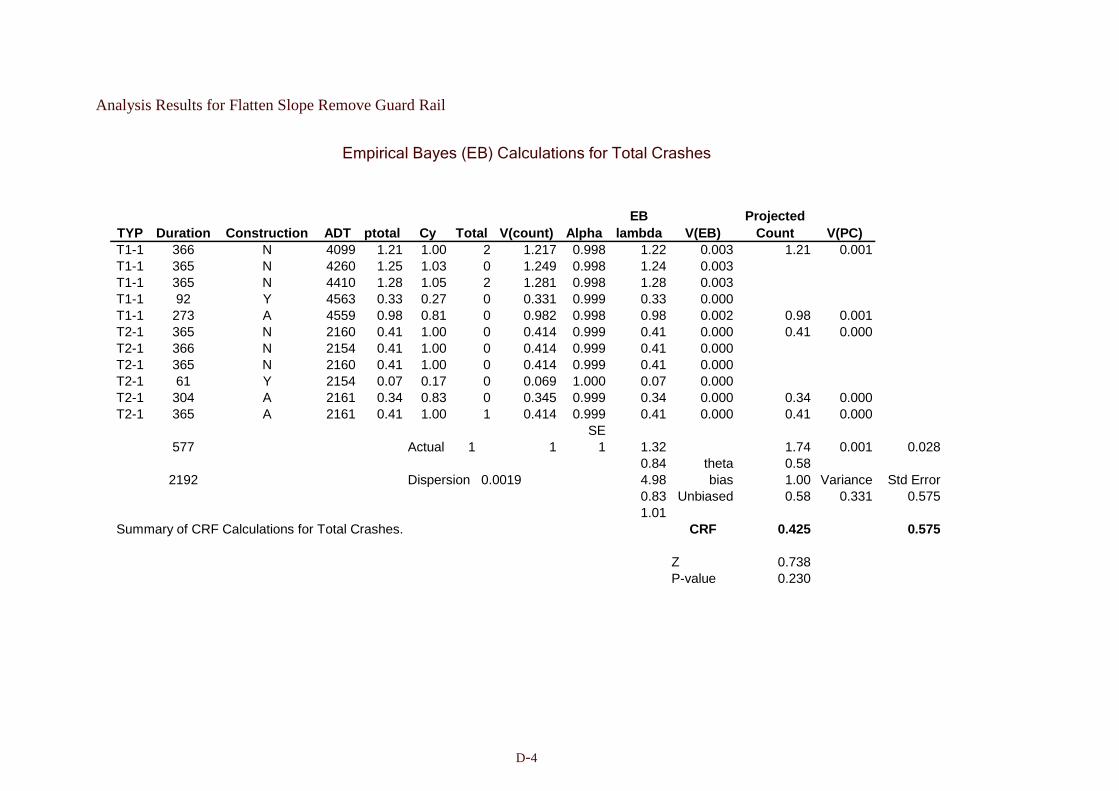
Analysis Results for Flatten Slope Remove Guard Rail
D-4
������������ �������������� ����������� �� �
�
TYP Duration Construction ADT ptotal Cy Total V(count) AlphaEB
lambda V(EB)Projected
Count V(PC)T1-1 366 N 4099 1.21 1.00 2 1.217 0.998 1.22 0.003 1.21 0.001T1-1 365 N 4260 1.25 1.03 0 1.249 0.998 1.24 0.003T1-1 365 N 4410 1.28 1.05 2 1.281 0.998 1.28 0.003T1-1 92 Y 4563 0.33 0.27 0 0.331 0.999 0.33 0.000T1-1 273 A 4559 0.98 0.81 0 0.982 0.998 0.98 0.002 0.98 0.001T2-1 365 N 2160 0.41 1.00 0 0.414 0.999 0.41 0.000 0.41 0.000T2-1 366 N 2154 0.41 1.00 0 0.414 0.999 0.41 0.000T2-1 365 N 2160 0.41 1.00 0 0.414 0.999 0.41 0.000T2-1 61 Y 2154 0.07 0.17 0 0.069 1.000 0.07 0.000T2-1 304 A 2161 0.34 0.83 0 0.345 0.999 0.34 0.000 0.34 0.000T2-1 365 A 2161 0.41 1.00 1 0.414 0.999 0.41 0.000 0.41 0.000
SE577 Actual 1 1 1 1.32 1.74 0.001 0.028
0.84 theta 0.582192 4.98 bias 1.00 Variance Std Error
0.83 Unbiased 0.58 0.331 0.5751.01
CRF 0.425 0.575
Z 0.738P-value 0.230
Summary of CRF Calculations for Total Crashes.
Dispersion 0.0019

E-1
APPENDIX E - EB Modeling Steps: Remove/Relocate Fixed Objects
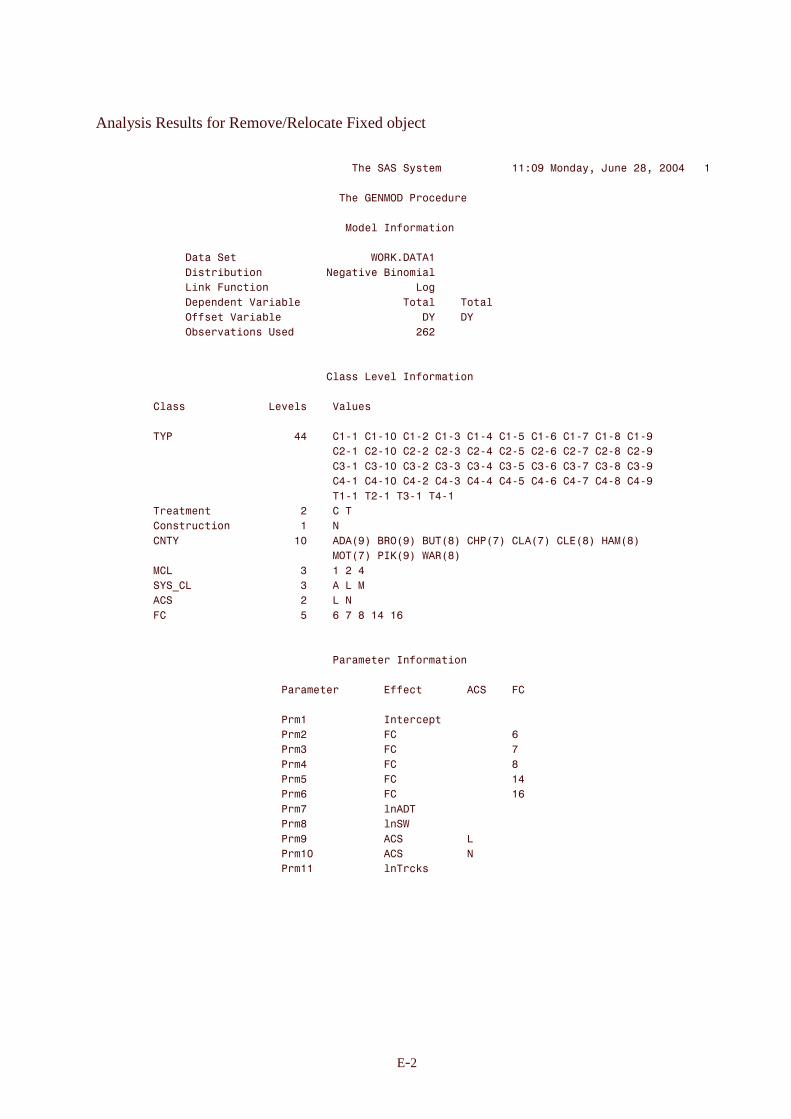
Analysis Results for Remove/Relocate Fixed object
E-2
������������������������������������������������������������������ �������������������� ������
��������������������������������������������������������������������������������������������������
�������������������������������������������������� �!��� �����������������������������������������
��������������������������������������������������������������������������������������������������
�������������������������������������������"�#�$� �%��������������������������������������������
��������������������������������������������������������������������������������������������������
�����������������������������������������&�'()��������������������������������������������������
���������������%� %*�%��������������+�%,��-%��%�"���������������������������������������������
��������������.%�/�0��!%�������������������������.�+���������������������������������������������
����������������1������2� %�*"��������������������"�������"������������������������������������
���������������$$���2� %�*"������������������������3�����3���������������������������������������
���������������*�� ,�%����4�����������������������5����������������������������������������������
��������������������������������������������������������������������������������������������������
��������������������������������������������������������������������������������������������������
������������������������������������6"����.�,�"�#�$� �%�����������������������������������������
��������������������������������������������������������������������������������������������������
���������6"����������������.�,�"�����2�"����������������������������������������������������������
��������������������������������������������������������������������������������������������������
����������3��������������������������6�7��6�7� �6�7��6�78�6�7��6�79�6�75�6�7:�6�7��6�7������������
�������������������������������������6�7��6�7� �6�7��6�78�6�7��6�79�6�75�6�7:�6�7��6�7������������
�������������������������������������687��687� �687��6878�687��6879�6875�687:�687��687������������
�������������������������������������6�7��6�7� �6�7��6�78�6�7��6�79�6�75�6�7:�6�7��6�7������������
���������������������������������������7����7���87����7�������������������������������������������
���������� �����������������������6������������������������������������������������������������
���������6��� �!%�������������������������������������������������������������������������������
���������6��3������������������� �������;�<�-'�;�<�-4�;�<�6=�;:<�6.�;:<�6.�;�<�=��;�<�������������
����������������������������������������;:<��#(;�<�&�';�<�����������������������������������������
����������6.��������������������8�����������������������������������������������������������������
����������3�>6.�����������������8������.����������������������������������������������������������
����������6��������������������������.������������������������������������������������������������
���������06���������������������9����5�:�������5��������������������������������������������������
��������������������������������������������������������������������������������������������������
��������������������������������������������������������������������������������������������������
��������������������������������������� ��� �#�$� �%������������������������������������������
��������������������������������������������������������������������������������������������������
������������������������������� ��� ��������$$�!��������6�����06�������������������������������
��������������������������������������������������������������������������������������������������
������������������������������ �������������#�� !�1��������������������������������������������
������������������������������ �������������06������������������5��������������������������������
������������������������������ 8������������06������������������:��������������������������������
������������������������������ �������������06���������������������������������������������������
������������������������������ 9������������06���������������������������������������������������
������������������������������ 5������������06�������������������5�������������������������������
������������������������������ :������������"����������������������������������������������������
������������������������������ �������������"��&�������������������������������������������������
������������������������������ ��������������6�����������.���������������������������������������
������������������������������ � ������������6���������������������������������������������������
������������������������������ �������������"�� !/�����������������������������������������������
��������������������������������������������������������������������������������������������������
��������������������������������������������������������������������������������������������������
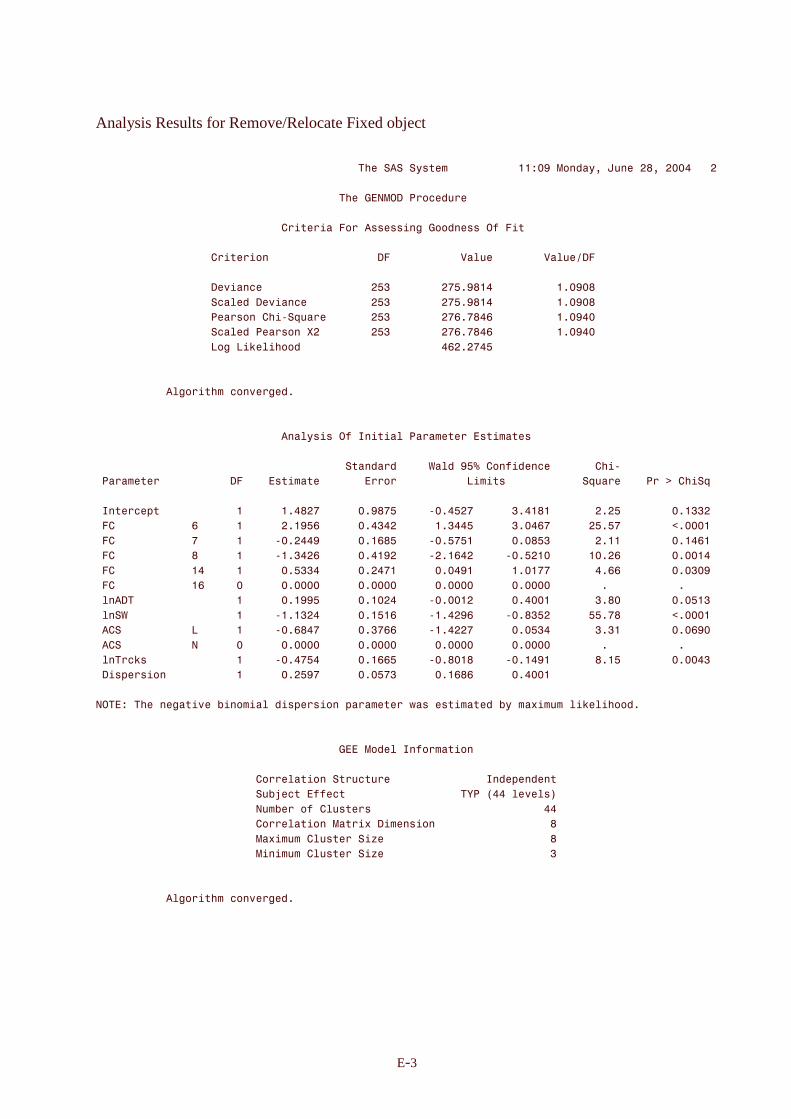
Analysis Results for Remove/Relocate Fixed object
E-3
������������������������������������������������������������������� �������������������� ������
��������������������������������������������������������������������������������������������������
�������������������������������������������������� �!��� �����������������������������������������
��������������������������������������������������������������������������������������������������
�����������������������������6 %� %��0� �������%�+�����������$�0%�������������������������������
��������������������������������������������������������������������������������������������������
������������������6 %� %��������������������0�����������2�"����������2�"��?�0��������������������
��������������������������������������������������������������������������������������������������
��������������������,%��!�������������������98���������:9)���������������) � ���������������������
�������������������!�"�����,%��!������������98���������:9)���������������) � ���������������������
��������������������� ����6�%7�@�� ���������98���������:5):��5�����������) �� ��������������������
�������������������!�"������ ����A����������98���������:5):��5�����������) �� ��������������������
������������������.�+�.%/�"%���������������������������5�)�:�9������������������������������������
��������������������������������������������������������������������������������������������������
��������������������������������������������������������������������������������������������������
������������"+� %��!��,� +��)�������������������������������������������������������������������
��������������������������������������������������������������������������������������������������
��������������������������������������������������������������������������������������������������
��������������������������������"��%���$�#�%%�"��� ��� ���%���������������������������������
��������������������������������������������������������������������������������������������������
�������������������������������������������� ������&�"���9B�6��$%���!��������6�%7����������������
��� ��� ������������0������%���������� � �����������.%%��������������@�� ������ �C�6�%�@��
��������������������������������������������������������������������������������������������������
�#�� !�1��������������������)���:������ )��:9�����7 )�9�:������8)������������)�9�������� )�88���
�06������������5��������������)��95������ )�8���������)8��9������8) �5:�������9)9:��������D) ���
�06������������:������������7 )���������� )�5�9�����7 )9:9������� ) �98��������)���������� )��5���
�06�������������������������7�)8��5������ )���������7�)�5�������7 )9�� ������� )�5�������� ) ����
�06�������������������������� )988������� )��:������� ) ����������) �::��������)55�������� ) 8 ���
�06�������������5����� ������ ) ������ ) ������ ) ������ ) ��������)�����������)������
�"��������������������������� )���9������ )� �������7 ) �������� )� ��������8)� �������� ) 9�8��
�"��&�����������������������7�)�8�������� )�9�5�����7�)���5�����7 )�89�������99):���������D) ���
��6������������.������������7 )5��:������ )8:55�����7�)���:������ ) 98��������8)8��������� ) 5� ��
��6������������������� ������ ) ������ ) ������ ) ������ ) ��������)�����������)������
�"�� !/���������������������7 )�:9������� )�559�����7 )� �������7 )������������)�9�������� ) �8��
��%�1� �%�������������������� )�9�:������ ) 9:8������ )�5�5������ )� ����������������������������
��������������������������������������������������������������������������������������������������
������������+�%,��*%��%�"��%�1� �%���1� ��� �E�����%����*���F%��"%/�"%����)�������������
��������������������������������������������������������������������������������������������������
��������������������������������������������������������������������������������������������������
����������������������������������������������"�#�$� �%�����������������������������������������
��������������������������������������������������������������������������������������������������
�������������������������6� �"�%���� �!� ����������������#���1�������������������������������
���������������������������*G�!��$$�!�������������������3��;���"�,�"�<��������������������������
���������������������������*� ��$�6"��� ��������������������������������������������������������
�������������������������6� �"�%����� %F��%���%�����������������������������������������������
���������������������������F%��6"��� ��%H������������������������������������������������������
��������������������������%�%��6"��� ��%H���������������������������8��������������������������
��������������������������������������������������������������������������������������������������
��������������������������������������������������������������������������������������������������
������������"+� %��!��,� +��)�������������������������������������������������������������������
��������������������������������������������������������������������������������������������������
��������������������������������������������������������������������������������������������������
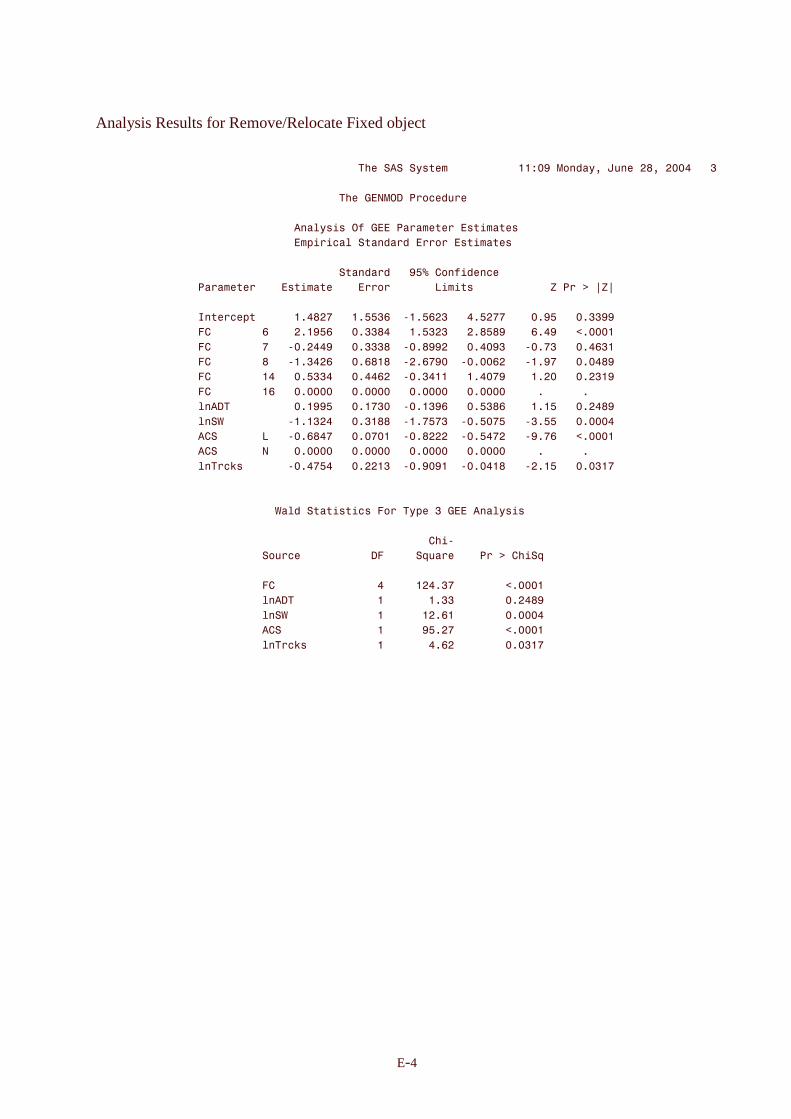
Analysis Results for Remove/Relocate Fixed object
E-4
������������������������������������������������������������������� �������������������� ����8�
��������������������������������������������������������������������������������������������������
�������������������������������������������������� �!��� �����������������������������������������
��������������������������������������������������������������������������������������������������
����������������������������������"��%���$������� ��� ���%�����������������������������������
��������������������������������1% %!�"������ ��� � ���%������������������������������������
��������������������������������������������������������������������������������������������������
������������������������������������������� �����9B�6��$%���!������������������������������������
������������������ ��� ������%������� � �������.%%�������������I�� �C�JIJ�����������������
��������������������������������������������������������������������������������������������������
����������������#�� !�1�������)���:����)9985��7�)95�8����)9�::���� )�9��� )88�������������������
����������������06��������5�����)��95��� )88������)98�8����)�9������5)�����D) ������������������
����������������06��������:���7 )������� )888���7 )������� )� �8���7 ):8��� )�58������������������
����������������06������������7�)8��5��� )5�����7�)5:� ��7 ) 5����7�)�:��� ) ��������������������
����������������06������������� )988���� )��5���7 )8�������)� :������)� ��� )�8�������������������
����������������06���������5��� ) ��� ) ��� ) ��� ) �����)������)���������������������
����������������"�������������� )���9��� )�:8 ��7 )�8�5��� )98�5�����)�9��� )���������������������
����������������"��&����������7�)�8����� )8�����7�):9:8��7 )9 :9���78)99��� ) ������������������
�����������������6��������.���7 )5��:��� ) : ���7 )������7 )9�:����7�):5���D) ������������������
�����������������6������������� ) ��� ) ��� ) ��� ) �����)������)���������������������
����������������"�� !/��������7 )�:9���� )���8��7 )� ����7 ) ������7�)�9��� ) 8�:�����������������
��������������������������������������������������������������������������������������������������
��������������������������������������������������������������������������������������������������
����������������������������&�"����%�%!��0� ���1��8��������"��%��������������������������������
��������������������������������������������������������������������������������������������������
����������������������������������������������������6�%7������������������������������������������
����������������������������� !�������������0������@�� ������ �C�6�%�@����������������������������
��������������������������������������������������������������������������������������������������
��������������������������06�������������������������)8:��������D) �����������������������������
��������������������������"��������������������������)88�������� )��������������������������������
��������������������������"��&�����������������������)5��������� ) �����������������������������
���������������������������6������������������������9)�:��������D) �����������������������������
��������������������������"�� !/���������������������)5��������� ) 8�:����������������������������
��������������������������������������������������������������������������������������������������
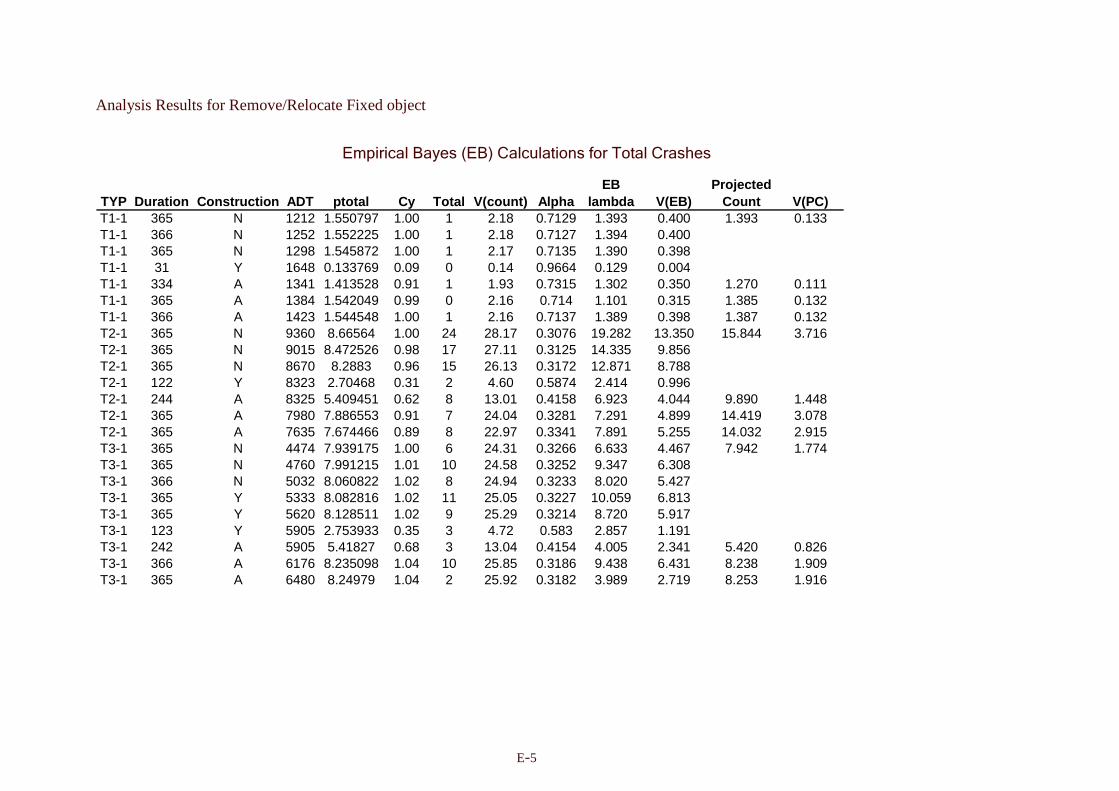
Analysis Results for Remove/Relocate Fixed object
E-5
������������ �������������� ����������� �� �
TYP Duration Construction ADT ptotal Cy Total V(count) AlphaEB
lambda V(EB)Projected
Count V(PC)T1-1 365 N 1212 1.550797 1.00 1 2.18 0.7129 1.393 0.400 1.393 0.133T1-1 366 N 1252 1.552225 1.00 1 2.18 0.7127 1.394 0.400T1-1 365 N 1298 1.545872 1.00 1 2.17 0.7135 1.390 0.398T1-1 31 Y 1648 0.133769 0.09 0 0.14 0.9664 0.129 0.004T1-1 334 A 1341 1.413528 0.91 1 1.93 0.7315 1.302 0.350 1.270 0.111T1-1 365 A 1384 1.542049 0.99 0 2.16 0.714 1.101 0.315 1.385 0.132T1-1 366 A 1423 1.544548 1.00 1 2.16 0.7137 1.389 0.398 1.387 0.132T2-1 365 N 9360 8.66564 1.00 24 28.17 0.3076 19.282 13.350 15.844 3.716T2-1 365 N 9015 8.472526 0.98 17 27.11 0.3125 14.335 9.856T2-1 365 N 8670 8.2883 0.96 15 26.13 0.3172 12.871 8.788T2-1 122 Y 8323 2.70468 0.31 2 4.60 0.5874 2.414 0.996T2-1 244 A 8325 5.409451 0.62 8 13.01 0.4158 6.923 4.044 9.890 1.448T2-1 365 A 7980 7.886553 0.91 7 24.04 0.3281 7.291 4.899 14.419 3.078T2-1 365 A 7635 7.674466 0.89 8 22.97 0.3341 7.891 5.255 14.032 2.915T3-1 365 N 4474 7.939175 1.00 6 24.31 0.3266 6.633 4.467 7.942 1.774T3-1 365 N 4760 7.991215 1.01 10 24.58 0.3252 9.347 6.308T3-1 366 N 5032 8.060822 1.02 8 24.94 0.3233 8.020 5.427T3-1 365 Y 5333 8.082816 1.02 11 25.05 0.3227 10.059 6.813T3-1 365 Y 5620 8.128511 1.02 9 25.29 0.3214 8.720 5.917T3-1 123 Y 5905 2.753933 0.35 3 4.72 0.583 2.857 1.191T3-1 242 A 5905 5.41827 0.68 3 13.04 0.4154 4.005 2.341 5.420 0.826T3-1 366 A 6176 8.235098 1.04 10 25.85 0.3186 9.438 6.431 8.238 1.909T3-1 365 A 6480 8.24979 1.04 2 25.92 0.3182 3.989 2.719 8.253 1.916

Analysis Results for Remove/Relocate Fixed object
E-6
TYP Duration Construction ADT ptotal Cy Total V(count) AlphaEB
lambda V(EB)Projected
Count V(PC)T4-1 365 N 1026 0.147932 1.00 0 0.15 0.963 0.142 0.005 0.142 0.002T4-1 365 N 1035 0.148824 1.01 0 0.15 0.9628 0.143 0.005T4-1 366 N 1040 0.149889 1.01 0 0.16 0.9625 0.144 0.005T4-1 31 Y 1048 0.012755 0.09 1 0.01 0.9967 0.016 0.000T4-1 334 A 1043 0.137357 0.93 0 0.14 0.9656 0.133 0.005 0.132 0.002T4-1 365 A 1061 0.150955 1.02 0 0.16 0.9623 0.145 0.005 0.145 0.002
3711 Actual 40 40 6.325 43.606 64.572 12.470 3.5314.289 theta 0.619
4383 75.094 bias 1.003 Variance Std Error0.2597 6.254 Unbiased 0.618 0.011 0.103
0.686
CRF 0.382 0.103
Z 3.712P-value 0.000
Summary of CRF Calculation for Total Crashes
Dispersion

Analysis Results for Remove/Relocate Fixed object
E-7
���������������������������������������������������������������������������������������� ������
��������������������������������������������������������������������������������������������������
�������������������������������������������������� �!��� �����������������������������������������
��������������������������������������������������������������������������������������������������
�������������������������������������������"�#�$� �%��������������������������������������������
��������������������������������������������������������������������������������������������������
�����������������������������������������&�'()��������������������������������������������������
���������������%� %*�%��������������+�%,��-%��%�"���������������������������������������������
��������������.%�/�0��!%�������������������������.�+���������������������������������������������
����������������1������2� %�*"��������������������"�������"������������������������������������
���������������$$���2� %�*"������������������������3�����3���������������������������������������
���������������*�� ,�%����4�����������������������5����������������������������������������������
��������������������������������������������������������������������������������������������������
��������������������������������������������������������������������������������������������������
������������������������������������6"����.�,�"�#�$� �%�����������������������������������������
��������������������������������������������������������������������������������������������������
���������6"����������������.�,�"�����2�"����������������������������������������������������������
��������������������������������������������������������������������������������������������������
����������3��������������������������6�7��6�7� �6�7��6�78�6�7��6�79�6�75�6�7:�6�7��6�7������������
�������������������������������������6�7��6�7� �6�7��6�78�6�7��6�79�6�75�6�7:�6�7��6�7������������
�������������������������������������687��687� �687��6878�687��6879�6875�687:�687��687������������
�������������������������������������6�7��6�7� �6�7��6�78�6�7��6�79�6�75�6�7:�6�7��6�7������������
���������������������������������������7����7���87����7�������������������������������������������
���������� �����������������������6������������������������������������������������������������
���������6��� �!%�������������������������������������������������������������������������������
���������6��3������������������� �������;�<�-'�;�<�-4�;�<�6=�;:<�6.�;:<�6.�;�<�=��;�<�������������
����������������������������������������;:<��#(;�<�&�';�<�����������������������������������������
����������6.��������������������8�����������������������������������������������������������������
����������3�>6.�����������������8������.����������������������������������������������������������
����������6��������������������������.������������������������������������������������������������
���������06���������������������9����5�:�������5��������������������������������������������������
��������������������������������������������������������������������������������������������������
��������������������������������������������������������������������������������������������������
��������������������������������������� ��� �#�$� �%������������������������������������������
��������������������������������������������������������������������������������������������������
������������������������������� ��� ��������$$�!��������6�����06�������������������������������
��������������������������������������������������������������������������������������������������
������������������������������ �������������#�� !�1��������������������������������������������
������������������������������ �������������06������������������5��������������������������������
������������������������������ 8������������06������������������:��������������������������������
������������������������������ �������������06���������������������������������������������������
������������������������������ 9������������06���������������������������������������������������
������������������������������ 5������������06�������������������5�������������������������������
������������������������������ :������������"����������������������������������������������������
������������������������������ �������������"��&�������������������������������������������������
������������������������������ ��������������6�����������.���������������������������������������
������������������������������ � ������������6���������������������������������������������������
��������������������������������������������������������������������������������������������������
��������������������������������������������������������������������������������������������������
�����������������������������6 %� %��0� �������%�+�����������$�0%�������������������������������
��������������������������������������������������������������������������������������������������
������������������6 %� %��������������������0�����������2�"����������2�"��?�0��������������������
��������������������������������������������������������������������������������������������������
��������������������,%��!�������������������9����������:�)�58������������) � 5��������������������
�������������������!�"�����,%��!������������9����������:�)�58������������) � 5��������������������

Analysis Results for Remove/Relocate Fixed object
E-8
���������������������������������������������������������������������������������������� ������
��������������������������������������������������������������������������������������������������
�������������������������������������������������� �!��� �����������������������������������������
��������������������������������������������������������������������������������������������������
�����������������������������6 %� %��0� �������%�+�����������$�0%�������������������������������
��������������������������������������������������������������������������������������������������
������������������6 %� %��������������������0�����������2�"����������2�"��?�0��������������������
��������������������������������������������������������������������������������������������������
��������������������� ����6�%7�@�� ���������9���������8 �)��89�����������)��8���������������������
�������������������!�"������ ����A����������9���������8 �)��89�����������)��8���������������������
������������������.�+�.%/�"%���������������������������8�)�5��������������������������������������
��������������������������������������������������������������������������������������������������
��������������������������������������������������������������������������������������������������
������������"+� %��!��,� +��)�������������������������������������������������������������������
��������������������������������������������������������������������������������������������������
��������������������������������������������������������������������������������������������������
��������������������������������"��%���$�#�%%�"��� ��� ���%���������������������������������
��������������������������������������������������������������������������������������������������
�������������������������������������������� ������&�"���9B�6��$%���!��������6�%7����������������
��� ��� ������������0������%���������� � �����������.%%��������������@�� ������ �C�6�%�@��
��������������������������������������������������������������������������������������������������
�#�� !�1������������������7�)� � ������ )��95�����7�)��5 ������ ):�����������)���������� )�88���
�06������������5��������������)��88������ )���9�������)85�8������8)���8�������9) ���������D) ���
�06������������:������������7 )� ������� )��:������7 )�5:������� )�55:������� )���������� )9��9��
�06�������������������������7 )� �������� )���������7�):�5������� )��8���������)::�������� ) �58��
�06�������������������������� )�:�5������ )�5 :�����7 ) 8�8������ )�� 9�������8)8��������� ) 59���
�06�������������5����� ������ ) ������ ) ������ ) ������ ) ��������)�����������)������
�"��������������������������� )� 9������� )� 8������ )� �9������ )5 �:�������5)8���������D) ���
�"��&�����������������������7�)��59������ )�:�������7�):58������7�) ���������5�)5:��������D) ���
��6������������.������������7 )5� 5������ )8� 8�����7�)8�9������� )� �:��������)���������� ) �����
��6������������������� ������ ) ������ ) ������ ) ������ ) ��������)�����������)������
��%�1� �%�������������������� )�� ������� ) 598������ ) �:9������ )8:8����������������������������
��������������������������������������������������������������������������������������������������
������������+�%,��*%��%�"��%�1� �%���1� ��� �E�����%����*���F%��"%/�"%����)�������������
��������������������������������������������������������������������������������������������������
��������������������������������������������������������������������������������������������������
����������������������������������������������"�#�$� �%�����������������������������������������
��������������������������������������������������������������������������������������������������
�������������������������6� �"�%���� �!� ����������������#���1�������������������������������
���������������������������*G�!��$$�!�������������������3��;���"�,�"�<��������������������������
���������������������������*� ��$�6"��� ��������������������������������������������������������
�������������������������6� �"�%����� %F��%���%�����������������������������������������������
���������������������������F%��6"��� ��%H������������������������������������������������������
��������������������������%�%��6"��� ��%H���������������������������8��������������������������
��������������������������������������������������������������������������������������������������
��������������������������������������������������������������������������������������������������
������������"+� %��!��,� +��)�������������������������������������������������������������������
��������������������������������������������������������������������������������������������������
��������������������������������������������������������������������������������������������������

Analysis Results for Remove/Relocate Fixed object
E-9
���������������������������������������������������������������������������������������� ����8�
��������������������������������������������������������������������������������������������������
�������������������������������������������������� �!��� �����������������������������������������
��������������������������������������������������������������������������������������������������
����������������������������������"��%���$������� ��� ���%�����������������������������������
��������������������������������1% %!�"������ ��� � ���%������������������������������������
��������������������������������������������������������������������������������������������������
������������������������������������������� �����9B�6��$%���!������������������������������������
������������������ ��� ������%������� � �������.%%�������������I�� �C�JIJ�����������������
��������������������������������������������������������������������������������������������������
����������������#�� !�1�����7�)� � ����)8�95��78)��:5����)5�8:���7 )� ��� )��5������������������
����������������06��������5�����)��88��� )9��:����)�� ����8)�59������)8 ���D) ������������������
����������������06��������:���7 )� ���� )��95��7 )�8����� ):8� ���7 )����� )��8������������������
����������������06������������7 )� ����� ):��9��7�)�� ��� )5 5����7�)����� )�5�������������������
����������������06������������� )�:�5��� )9�����7 )98������)���8���� )����� )895������������������
����������������06���������5��� ) ��� ) ��� ) ��� ) �����)������)���������������������
����������������"�������������� )� 9���� )�5����� ) :����� ):85������)� ��� ) �59�����������������
����������������"��&����������7�)��59��� )8�� ��7�)� ���7 ):9�����7�)�9���D) ������������������
�����������������6��������.���7 )5� 5��� )�8�5��7 )���5��7 )8��9���7�)�:���D) ������������������
�����������������6������������� ) ��� ) ��� ) ��� ) �����)������)���������������������
��������������������������������������������������������������������������������������������������
��������������������������������������������������������������������������������������������������
����������������������������&�"����%�%!��0� ���1��8��������"��%��������������������������������
��������������������������������������������������������������������������������������������������
����������������������������������������������������6�%7������������������������������������������
����������������������������� !�������������0������@�� ������ �C�6�%�@����������������������������
��������������������������������������������������������������������������������������������������
��������������������������06������������������������9)�9��������D) �����������������������������
��������������������������"�������������������������9):9�������� ) �59����������������������������
��������������������������"��&����������������������:)����������D) �����������������������������
���������������������������6������������������������8)5���������D) ��������������������������
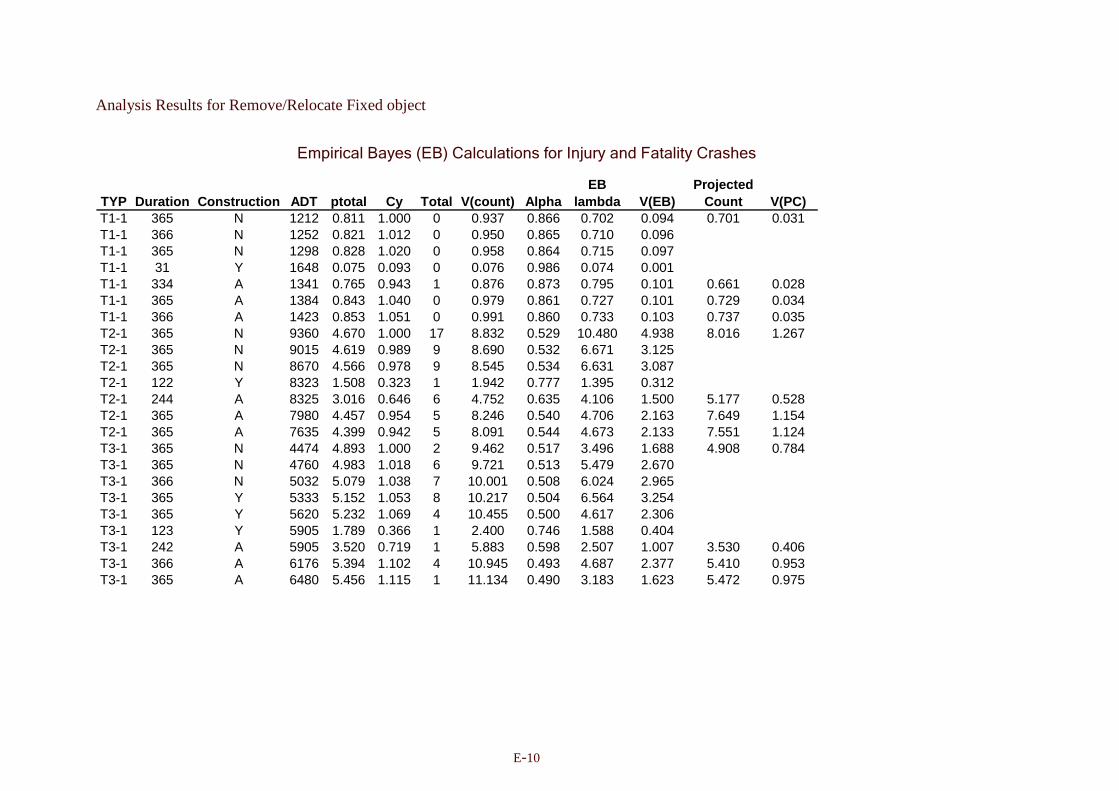
Analysis Results for Remove/Relocate Fixed object
E-10
������������ �������������� ������������ � ���������� �� �
TYP Duration Construction ADT ptotal Cy Total V(count) AlphaEB
lambda V(EB)Projected
Count V(PC)T1-1 365 N 1212 0.811 1.000 0 0.937 0.866 0.702 0.094 0.701 0.031T1-1 366 N 1252 0.821 1.012 0 0.950 0.865 0.710 0.096T1-1 365 N 1298 0.828 1.020 0 0.958 0.864 0.715 0.097T1-1 31 Y 1648 0.075 0.093 0 0.076 0.986 0.074 0.001T1-1 334 A 1341 0.765 0.943 1 0.876 0.873 0.795 0.101 0.661 0.028T1-1 365 A 1384 0.843 1.040 0 0.979 0.861 0.727 0.101 0.729 0.034T1-1 366 A 1423 0.853 1.051 0 0.991 0.860 0.733 0.103 0.737 0.035T2-1 365 N 9360 4.670 1.000 17 8.832 0.529 10.480 4.938 8.016 1.267T2-1 365 N 9015 4.619 0.989 9 8.690 0.532 6.671 3.125T2-1 365 N 8670 4.566 0.978 9 8.545 0.534 6.631 3.087T2-1 122 Y 8323 1.508 0.323 1 1.942 0.777 1.395 0.312T2-1 244 A 8325 3.016 0.646 6 4.752 0.635 4.106 1.500 5.177 0.528T2-1 365 A 7980 4.457 0.954 5 8.246 0.540 4.706 2.163 7.649 1.154T2-1 365 A 7635 4.399 0.942 5 8.091 0.544 4.673 2.133 7.551 1.124T3-1 365 N 4474 4.893 1.000 2 9.462 0.517 3.496 1.688 4.908 0.784T3-1 365 N 4760 4.983 1.018 6 9.721 0.513 5.479 2.670T3-1 366 N 5032 5.079 1.038 7 10.001 0.508 6.024 2.965T3-1 365 Y 5333 5.152 1.053 8 10.217 0.504 6.564 3.254T3-1 365 Y 5620 5.232 1.069 4 10.455 0.500 4.617 2.306T3-1 123 Y 5905 1.789 0.366 1 2.400 0.746 1.588 0.404T3-1 242 A 5905 3.520 0.719 1 5.883 0.598 2.507 1.007 3.530 0.406T3-1 366 A 6176 5.394 1.102 4 10.945 0.493 4.687 2.377 5.410 0.953T3-1 365 A 6480 5.456 1.115 1 11.134 0.490 3.183 1.623 5.472 0.975

Analysis Results for Remove/Relocate Fixed object
E-11
TYP Duration Construction ADT ptotal Cy Total V(count) AlphaEB
lambda V(EB)Projected
Count V(PC)T4-1 365 N 1026 0.064 1.000 0 0.065 0.988 0.064 0.001 0.064 0.000T4-1 365 N 1035 0.065 1.003 0 0.065 0.988 0.064 0.001T4-1 366 N 1040 0.065 1.007 0 0.066 0.988 0.064 0.001T4-1 31 Y 1048 0.006 0.085 1 0.006 0.999 0.007 0.000T4-1 334 A 1043 0.059 0.919 0 0.060 0.989 0.059 0.001 0.059 0.000T4-1 365 A 1061 0.065 1.010 0 0.066 0.988 0.064 0.001 0.064 0.000
3711 Actual 23 23.000 4.796 26.241 37.039 5.235 2.2882.581 theta 0.621
4383 41.100 bias 1.004 Variance Std Error0.1908 3.423 Unbiased 0.619 0.018 0.134
0.754
CRF 38.140 13.402
Z 2.846P-value 0.002
Dispersion
Summary of CRF Calculation for Injury and Fatality Crashes

F-1
APPENDIX F - EB Modeling Steps: Flatten Vertical Curve

Analysis Results for Flatten Vertical Curve
F-2
������������������������������������������������������������������� ���������������������������
�
������������������������������������������������� �!"������
�
����������������������������������������!����#$%!���!$�
�
����������������������������������&��'(�)*+����+�� ��,�
����������������-��!$������������������.��/��0�$!����
�����������1�$2���$"�!$�����������������������������1!.�
�������������3�$��$�)����-������������������������+3��������+3����
������������%%���)����-�������������������������������4�����4�
������������-���/��!$��&������������������������������5�
����������������$.�)�������������������������������������
�
�
������������������������������������*�����1�/���#$%!���!$�
�
���������*�����������������1�/�������)������
�
����������4 �������������������6�����*�7��*�7���*�7���*�7��*�7��*�7��*�76�*�78�*�79�
�������������������������������������*�75�*�7:�*�7��*�7���*�7���*�7���*�7���*�7��*�7��
�������������������������������������*�7��*�76�*�78�*�79�*�75�*�7:�*�7��*�7���*�7���
�������������������������������������*�7���*�7��*�7��*�7��*�76�*�78�*�79�*�75�*�7:�*�7��
�������������������������������������*�7���*�7���*�7���*�7��*�7��*�7��*�76�*�78�*�79�
�������������������������������������*�75�*�7:�(((�
��������������$�������������������*���
���������������������������������������������
���������*!$���"�!$��������������������4�
���������*��4�������������������8�������;�<��&1;�<�1#*;6<��&�;6<�'#*;�<�=��;��<�
����������*1�������������������������������
����������4�+*1������������������������1���
����������*����������������������������
����������*����������������������������8�9�5�
���������1$����������������������������
�
�
�������������������������������������� �������#$%!���!$�
�
������������������������������� ��������������%%�"��������4�+*1�
�
������������������������������� ��������������#$��"�3�
������������������������������� ���������������$����
������������������������������� ���������������$�1�
������������������������������� ���������������4�+*1���������
������������������������������� �6�������������4�+*1�������1�
������������������������������� �8�������������4�+*1���������
�
�
�����������������������������*��������!���������$.��!!�$�����%����
�
������������������*�����!$������������������������������)������������)����>���
�
��������������������/��$"�������������������������������6(�9�������������(:�58�
�������������������"�������/��$"������������������������6(�9�������������(:�58�
������������������ ����!$�*��7�?�����������������������6:(995������������(���6�

Analysis Results for Flatten Vertical Curve
F-3
�
������������������������������������������������������������������� ���������������������������
�
������������������������������������������������� �!"������
�
�����������������������������*��������!���������$.��!!�$�����%����
�
������������������*�����!$������������������������������)������������)����>���
�
�������������������"����� ����!$�@���������������������6:(995������������(���6�
������������������1!.�1�2����!!����������������������7���(598��
�
�
�������������.!����"!$/��.��(�
�
�
�����������������������������$��������%�#$����� ��������������
�
����������������������������������������$���������=����:6A�*!$%���$"��������*��7�
� �������������������������������������!������������1����������������?�������� ��B�*���?�
�
�#$��"�3�����������������7�(:�6��������(:�5������7�(98�������7�(��69��������(�9���������(���6�
��$��������������������������(6�9��������(�::5�������(�6�6�������(9��6��������(�9��������C(�����
��$�1������������������������(55�:�������(�5���������(6�::�������(������������(59��������C(�����
��4�+*1��������������������7�(5��6�������(���8�����7�(�689�����7�(�5���������8(�:���������(���6�
��4�+*1��������1�����������7�(�5�9�������(��5:�����7�(955��������(���9��������(�6���������(66���
��4�+*1����������������������(�����������(�����������(�����������(������������(�����������(�
����3����!$������������������(�98��������(��95�������(���9�������(56���
�
���� �����$�.��/��-�$!�������3����!$�3�������D����������-���E�����2����!!�(�
�
�
�������������������������������������������!����#$%!���!$�
�
�������������������������*!������!$����"������������������#$��3�$��$�
���������������������������-F�"��%%�"�������������������4 �;6����/���<�
���������������������������-���!%�*���������������������������������6��
�������������������������*�������=��������$.�)�������������������������
�������������������������*!������!$�����E����$��!$������������������5�
���������������������������E���*��������G���������������������������9�
���������������������������$���*��������G�����������������������������
�
�
�������������.!����"!$/��.��(�
�
�
�������������������������������$��������%����� ��������������
��������������������������������3���"�����$��������!���������
�
���������������������������������������$�������:6A�*!$%���$"��
���������������� ���������������������!��������1���������������H� ��B�IHI�
�
����������������#$��"�3����7�(:�6�����(�5�5��76(866���7�(���:���7�(������(�����
�����������������$�������������(6�9�����(�6������(��8�����(5�99�����(69����(�����
�����������������$�1�����������(55�:����(��86����(��6�����(6��:�����(9�����(��89�
�����������������4�+*1�������7�(5��6����(�8�9��7�(6�96��7�(�������7�(�9����(���:�

Analysis Results for Flatten Vertical Curve
F-4
�
������������������������������������������������������������������� ���������������������������
�
������������������������������������������������� �!"������
�
�������������������������������$��������%����� ��������������
��������������������������������3���"�����$��������!���������
�
���������������������������������������$�������:6A�*!$%���$"��
���������������� ���������������������!��������1���������������H� ��B�IHI�
�
�����������������4�+*1����1��7�(�5�9����(���:��7�(��98����(8������7�(������(88���
�����������������4�+*1���������(��������(��������(��������(���������(������(�
�
�
����������������������������=���������"���!����3���������$�������
�
����������������������������������������������������*��7�
���������������������������!��"��������������������?�������� ��B�*���?�
�
���������������������������$�������������������������(9����������(�����
���������������������������$�1����������������������9(�6���������(��89�
���������������������������4�+*1��������������������:(�5���������(�����
�
�

Analysis Results for Flatten Vertical Curve
F-5
������������ �������������� ����������� �� �
TYP Duration Construction ADT ptotal Cy Total V(count) AlphaEB
lambda V(EB)Projected
Count V(PC)T1-1 365 N 1693 0.732 1.000 3 1.469 0.498 1.870 0.938 1.502 0.246T1-1 366 N 1805 0.760 1.039 3 1.555 0.489 1.905 0.974T1-1 365 N 1918 0.784 1.071 1 1.628 0.481 0.896 0.465T1-1 212 Y 1918 0.515 0.704 0 0.881 0.585 0.301 0.125T1-1 153 A 2030 0.452 0.618 0 0.733 0.616 0.279 0.107 0.928 0.094T1-1 365 A 2145 0.833 1.138 0 1.788 0.466 0.388 0.207 1.710 0.319T1-1 366 A 2260 0.859 1.174 2 1.876 0.458 1.477 0.801 1.764 0.339T1-1 365 A 2160 0.836 1.143 5 1.798 0.465 3.064 1.639 1.716 0.321T2-1 365 N 3935 2.581 1.000 7 11.749 0.220 6.029 4.705 5.022 1.250T2-1 366 N 4360 2.738 1.061 8 13.051 0.210 6.896 5.450T2-1 365 N 4720 2.851 1.105 3 14.038 0.203 2.970 2.367T2-1 61 Y 4720 1.240 0.480 0 3.355 0.370 0.458 0.289T2-1 304 A 5080 2.511 0.973 6 11.191 0.224 5.217 4.046 4.886 1.183T2-1 365 A 5440 3.081 1.194 14 16.148 0.191 11.917 9.643 5.995 1.781T2-1 366 A 5800 3.200 1.240 9 17.293 0.185 7.927 6.460 6.226 1.921T2-1 365 A 6160 3.298 1.278 10 18.269 0.181 8.790 7.203 6.417 2.041T3-1 366 N 1300 1.202 1.000 1 3.189 0.377 1.076 0.671 0.888 0.189T3-1 365 N 1220 1.158 0.963 0 3.001 0.386 0.446 0.274T3-1 365 N 1140 1.115 0.928 1 2.827 0.394 1.046 0.633T3-1 31 Y 1060 0.429 0.357 0 0.683 0.629 0.270 0.100T3-1 334 A 980 0.943 0.785 1 2.167 0.435 0.975 0.551 0.697 0.116T3-1 366 A 980 1.030 0.857 0 2.489 0.414 0.426 0.250 0.761 0.139T3-1 365 A 990 1.033 0.859 0 2.500 0.413 0.426 0.250 0.763 0.139T3-1 365 A 1000 1.038 0.864 0 2.522 0.412 0.427 0.251 0.767 0.141

Analysis Results for Flatten Vertical Curve
F-6
TYP Duration Construction ADT ptotal Cy Total V(count) AlphaEB
lambda V(EB)Projected
Count V(PC)T4-1 366 N 7830 0.927 1.000 4 2.110 0.439 2.650 1.486 4.534 0.850T4-1 365 N 7710 0.917 0.989 10 2.074 0.442 5.984 3.339T4-1 365 N 7712 0.917 0.989 8 2.074 0.442 4.869 2.716T4-1 275 Y 7713 0.717 0.773 3 1.424 0.503 1.850 0.919T4-1 90 A 7715 0.432 0.466 4 0.688 0.627 1.762 0.657 2.112 0.184T4-1 366 A 7715 0.920 0.992 2 2.084 0.441 1.523 0.851 4.498 0.837T4-1 365 A 7717 0.917 0.989 4 2.076 0.442 2.638 1.472 4.486 0.832T4-1 365 A 7718 0.917 0.989 2 2.076 0.442 1.522 0.849 4.487 0.832
SE5265 A Actual 59 59 7.681 48.758 48.214 11.219 3.350
3.380 ThetaHat 1.2244384 N Dispersion 36.637 bias 1.005Variance Std Error
3.050ThetaHatU 1.218 0.032 0.1791.108
Summary of CRF Calculations for Total Crashes All Treatment Sites CRF -0.218 0.179
Z -1.218P-value 0.888
SE20 20 4.472 40.430 24.689 4.293
3.380 ThetaHat 0.810113.564 bias 1.007Variance Std Error
3.050ThetaHatU 0.804 0.036 0.1911.108
All Treatment Sites Except for T2 CRF 0.196 0.191
Z 1.025P-value 0.153
1.3762

Analysis Results for Flatten Vertical Curve
F-7
������������������������������������������������������������������� 66�������������������������
�
������������������������������������������������� �!"������
�
����������������������������������������!����#$%!���!$�
�
����������������������������������&��'(�)*+����+�� ��,�
����������������-��!$������������������.��/��0�$!����
�����������1�$2���$"�!$�����������������������������1!.�
�������������3�$��$�)����-����������������������#�+3�������#�+3����
������������%%���)����-�������������������������������4�����4�
������������-���/��!$��&������������������������������5�
����������������$.�)�������������������������������������
�
�
������������������������������������*�����1�/���#$%!���!$�
�
���������*�����������������1�/�������)������
�
����������4 �������������������6�����*�7��*�7���*�7���*�7��*�7��*�7��*�76�*�78�*�79�
�������������������������������������*�75�*�7:�*�7��*�7���*�7���*�7���*�7���*�7��*�7��
�������������������������������������*�7��*�76�*�78�*�79�*�75�*�7:�*�7��*�7���*�7���
�������������������������������������*�7���*�7��*�7��*�7��*�76�*�78�*�79�*�75�*�7:�*�7��
�������������������������������������*�7���*�7���*�7���*�7��*�7��*�7��*�76�*�78�*�79�
�������������������������������������*�75�*�7:�(((�
��������������$�������������������*���
���������������������������������������������
���������*!$���"�!$��������������������4�
���������*��4�������������������8�������;�<��&1;�<�1#*;6<��&�;6<�'#*;�<�=��;��<�
����������*1�������������������������������
����������4�+*1������������������������1���
����������*����������������������������
����������*����������������������������8�9�5�
����������*����������������������������
���������1$����������������������������
�
�
�������������������������������������� �������#$%!���!$�
�
������������������������������������ ��������������%%�"�
�
������������������������������������ ��������������#$��"�3�
������������������������������������ ���������������$����
������������������������������������ ���������������$��"2��
�
�
�����������������������������*��������!���������$.��!!�$�����%����
�
������������������*�����!$������������������������������)������������)����>���
�
��������������������/��$"��������������������6�����������(�:6������������(6:���
�������������������"�������/��$"�������������6�����������(�:6������������(6:���
������������������ ����!$�*��7�?�������������6����������:(9655�����������(:�85�
�������������������"����� ����!$�@�����������6����������:(9655�����������(:�85�
������������������1!.�1�2����!!����������������������7�5�(�56��

Analysis Results for Flatten Vertical Curve
F-8
�
������������������������������������������������������������������� 66�������������������������
�
������������������������������������������������� �!"������
�
�������������.!����"!$/��.��(�
�
�
������������������������������$��������%�#$����� ��������������
�
��������������������������������������$���������=����:6A�*!$%���$"��������*��7�
���� ��������������������������������!������������1����������������?�������� ��B�*���?�
�
����#$��"�3������������7�(�9�9�������(�58������78(�::������7�(�����������8(����������C(�����
�����$���������������������(9��5�������(��6:�������(�655�������(���:�������8(�6��������C(�����
�����$��"2���������������7�(�����������(�8�������7�(:��������7�(:�55�������:(::��������C(�����
�������3����!$�������������(�55��������(�68��������(8��6�������(69:��
�
���� �����$�.��/��-�$!�������3����!$�3�������D����������-���E�����2����!!�(�
�
�
�������������������������������������������!����#$%!���!$�
�
�������������������������*!������!$����"������������������#$��3�$��$�
���������������������������-F�"��%%�"�������������������4 �;6����/���<�
���������������������������-���!%�*���������������������������������6��
�������������������������*�������=��������$.�)�������������������������
�������������������������*!������!$�����E����$��!$������������������5�
���������������������������E���*��������G���������������������������9�
���������������������������$���*��������G�����������������������������
�
�
�������������.!����"!$/��.��(�
�
�
�������������������������������$��������%����� ��������������
��������������������������������3���"�����$��������!���������
�
��������������������������������������$�������:6A�*!$%���$"��
����������������� �������������������!��������1���������������H� ��B�IHI�
�
�����������������#$��"�3��7�(�9�9����(��89��78(996���7�(:88����7�(68����(�����
������������������$�����������(9��5����(��55����(�98:����(���5�����(������(���5�
������������������$��"2�����7�(��������(�9����7�(�68���7�(6�69���7�(������(�����
�
�
����������������������������=���������"���!����3���������$�������
�
����������������������������������������������������*��7�
���������������������������!��"��������������������?�������� ��B�*���?�
�
���������������������������$������������������������:(9����������(���5�
���������������������������$��"2��������������������:(�:���������(����

Ana
lysi
s R
esul
ts f
or F
latt
en V
erti
cal C
urve
F-9
��
�����
��
��� �
�
��
���
���
���� ���
����
���
���
���
�����
�� ��
TY
PD
ura
tio
nC
on
stru
ctio
nA
DT
pto
tal
Cy
I_F
V(c
ou
nt)
Alp
ha
EB
la
mb
da
V(E
B)
Pro
ject
ed
Co
un
tV
(PC
)T
1-1
365
N16
930.
200
1.00
00
0.25
10.
796
0.15
90.
032
0.21
80.
014
T1-
136
6N
1805
0.23
91.
196
10.
312
0.76
50.
418
0.09
8T
1-1
365
N19
180.
279
1.39
60
0.37
90.
736
0.20
50.
054
T1-
121
2Y
1918
0.18
30.
918
00.
226
0.80
90.
148
0.02
8T
1-1
153
A20
300.
183
0.91
80
0.22
60.
809
0.14
80.
028
0.20
00.
012
T1-
136
5A
2145
0.34
71.
737
00.
501
0.69
10.
240
0.07
40.
378
0.04
3T
1-1
366
A22
600.
366
1.83
51
0.53
90.
679
0.56
90.
182
0.39
90.
048
T1-
136
5A
2160
0.36
11.
808
20.
529
0.68
30.
881
0.28
00.
393
0.04
7T
2-1
365
N39
350.
632
1.00
02
1.14
70.
551
1.24
60.
559
1.20
70.
175
T2-
136
6N
4360
0.68
61.
086
31.
293
0.53
11.
772
0.83
1T
2-1
365
N47
200.
705
1.11
51
1.34
50.
524
0.84
50.
402
T2-
161
Y47
200.
306
0.48
50
0.42
70.
717
0.22
00.
062
T2-
130
4A
5080
0.61
90.
980
21.
113
0.55
61.
232
0.54
71.
182
0.16
8T
2-1
365
A54
400.
753
1.19
15
1.48
20.
508
2.84
41.
400
1.43
70.
248
T2-
136
6A
5800
0.77
81.
232
31.
559
0.49
91.
891
0.94
71.
486
0.26
5T
2-1
365
A61
600.
803
1.27
06
1.63
30.
492
3.44
51.
752
1.53
30.
282
T3-
136
6N
1300
0.79
81.
000
11.
619
0.49
30.
900
0.45
60.
613
0.11
3T
3-1
365
N12
200.
694
0.86
90
1.31
40.
528
0.36
60.
173
T3-
136
5N
1140
0.59
90.
751
01.
062
0.56
40.
338
0.14
7T
3-1
31Y
1060
0.20
50.
257
00.
259
0.79
10.
162
0.03
4T
3-1
334
A98
00.
396
0.49
60
0.59
80.
662
0.26
20.
089
0.30
40.
028
T3-
136
6A
980
0.43
20.
542
00.
673
0.64
20.
278
0.09
90.
332
0.03
3T
3-1
365
A99
00.
441
0.55
20
0.69
10.
638
0.28
10.
102
0.33
80.
034
T3-
136
5A
1000
0.45
00.
564
00.
712
0.63
30.
285
0.10
50.
346
0.03
6

Analysis Results for Flatten Vertical Curve
F-10
TYP Duration Construction ADT ptotal Cy I_F V(count) AlphaEB
lambda V(EB)Projected
Count V(PC)T4-1 366 N 7830 1.182 1.000 3 2.982 0.396 2.279 1.376 3.232 0.640T4-1 365 N 7710 1.240 1.049 6 3.221 0.385 4.168 2.563T4-1 365 N 7712 1.232 1.042 5 3.188 0.387 3.544 2.174T4-1 275 Y 7713 0.957 0.809 0 2.135 0.448 0.428 0.237T4-1 90 A 7715 0.573 0.484 0 0.995 0.576 0.329 0.140 1.565 0.150T4-1 366 A 7715 1.220 1.032 2 3.136 0.389 1.696 1.037 3.334 0.681T4-1 365 A 7717 1.204 1.019 2 3.074 0.392 1.688 1.027 3.293 0.664T4-1 365 A 7718 1.201 1.016 0 3.058 0.393 0.471 0.286 3.283 0.660
SE5265 A Actual 23 23.000 4.796 16.541 19.804 3.401 1.844
1.147 ThetaHat 1.1614384 N Dispersion 16.240 bias 1.009 Variance Std Error
1.352 ThetaHatU 1.151 0.068 0.2610.848
Summary of CRF Calculations for Injury and Fatality Crashes All Treatment Sites CRF -0.151 0.261
Z -0.581P-value 0.719
SE7 7 2.646 16.907 14.165 2.437
1.147 ThetaHat 0.49445.771 bias 1.012 Variance Std Error1.352 ThetaHatU 0.488 0.036 0.1900.848
All Treatment Sites Except for T2 CRF 0.512 0.190
Z 2.695P-value 0.004
1.2883

Analysis Results for Provide Interchange Lighting
G-1
APPENDIX G - EB Modeling Steps: Provide Interchange Lighting

Analysis Results for Provide Interchange Lighting
G-2
������������������������������������������������������������������� �����������������������������
�
������������������������������������������������ �!�"#������
�
�����������������������������������������"��$�%�&"���"��
�
��������������� �������������������������'�()* ����+�
��������������� ����,��"�������������-��.��/��"��$�
���������������0��1����#�"������������������������0"-�
��������������� �2������3����,$�������������$4&4!��������$4&4!����
����������������&&���3����,$����������������������� 5���� 5�
����������������,���.��"���6�����������������������7+�
�
�
�������������������������������������8$����0�.�$�%�&"���"��
�
����������8$����������������0�.�$�����3�$����
�
�����������5!�������������������+�����8�9��8�9���8�9��8�9+�8�9��8�9��8�9��8�9:�8�9;�8�97�
��������������������������������������8�9��8�9���8�9��8�9+�8�9��8�9��8�9��8�9:�8�9;�8�97�
��������������������������������������8�9��8�9��8�9+�8�9��8�9��8�9��8�9:���9����9����9��
�����������������������������������8���
����������8"����#�"�������������������
����������8��5�������������������;����8�(<��=�8�0�<��=����<��=�0%8<�=�068<�=����<:=�
��������������������������������������!�(<�=��(6<�=�
�����������80��������������������+����������
�����������5�480��������������������������
�����������8��������������������������0���
�����������8������������������������������:�������
�����������8����������������������������+;������:�+�7�:���
�
�
��������������������������������������!�������%�&"���"��
�
������������������������������������!��������������&&�#�
�
������������������������������������!��������������%���#�2�
������������������������������������!��������������$�� ��
������������������������������������!�+�������������'�
�
�
������������������������������8��������"����������-��""�������&����
�
�������������������8�����"������������������ ������������3�$����������3�$��> ��
�
������������������� �.���#�������������������7����������7;*:��������������*�����
��������������������#�$��� �.���#������������7����������7;*:��������������*�����
�������������������!����"��8��9�?������������7�����������;*���������������*�7���
��������������������#�$���!����"��@����������7�����������;*���������������*�7���
�������������������0"-�0�1�$��""�����������������������97�*��;��
�
�
������������$-"����#"�.��-��*�
�
������������������������������������������������������������������� ���������������������������:�
�
������������������������������������������������ �!�"#������

Analysis Results for Provide Interchange Lighting
G-3
�
��������������������������������$������&�%����$�!��������������
�
������������������������������������������������'�$��7�A�8"�&����#��������8��9�
����!����������� ��������������������"������������0����������������?��������!��B�8���?�
�
����%���#�2��������������*7�+��������*:��;�����9�*��7��������*+�����������*�;���������*��;;�
����$�� �����������������9�*�����������*��+������9�*��7��������*�::���������*�;���������*�:���
�����'���������������������*�����������*���;�������*��:��������*�:+���������*;����������*�����
���� ��2����"��������������*�+;��������*�7���������*:��7�������*�7���
�
���� �������-��.��,��"��$����2����"��2�������C����������,���D���$�1�$��""�*�
�
�
�������������������������������������������"��$�%�&"���"��
�
�������������������������8"���$��"�����#������������������%���2������
���������������������������,E�#��&&�#�������������������5!�<+��$�.�$�=�
���������������������������,���"&�8$��������������������������������+��
�������������������������8"���$��"������D� �����"�������������������;�
���������������������������D���8$�������F���������������������������;�
�������������������������������8$�������F�����������������������������
�
�
������������$-"����#"�.��-��*�
�
�
����������������������������������$������&�����!��������������
���������������������������������2���#�$������������"���������
�
�����������������������������������������������7�A�8"�&����#��
������������������!�������������������"��������0���������������G�!��B�HGH�
�
������������������%���#�2����*7�+�����*�7;���9�*��7�����*���������*7+����*+����
������������������$�� �������9�*��������*������9�*:�+:����*�;�+���9�*;�����*+;;+�
�������������������'�����������*��������*�+�:��9�*��������*���������*�;����*�����
�
�
�����������������������������'�$�������#���"����2��+��������$�����
�
�����������������������������������������������������8��9�
����������������������������"��#������������ �������?��������!��B�8���?�
�
���������������������������$�� �����������������������*:����������*+;;+�
����������������������������'�������������������������*�+���������*�����

Analysis Results for Provide Interchange Lighting
G-4
�� � � ���� � � � � � ��� ��� � � � � ��� � ��� ��� � �� �� �� � � �
�
TYP Duration Construction ADT ptotal Cy Total V(count) AlphaEB
lambda V(EB)Projected
Count V(PC)T1-1 364 N 6287 1.186 1.000 3 2.648 0.448 2.187 1.207 1.359 0.375T1-1 364 N 6250 1.188 1.001 0 2.653 0.448 0.532 0.294T1-1 183 Y 6195 0.596 0.503 0 0.966 0.618 0.368 0.141T1-1 181 A 6197 0.640 0.539 0 1.064 0.601 0.384 0.153 0.732 0.109T1-1 365 A 6160 1.292 1.089 0 3.023 0.427 0.552 0.316 1.479 0.444T1-1 364 A 6141 1.289 1.086 1 3.013 0.428 1.124 0.643 1.476 0.442T1-1 364 A 6105 1.291 1.088 0 3.020 0.427 0.552 0.316 1.478 0.443T2-1 366 N 8173 1.823 1.000 4 5.275 0.346 3.248 2.125 2.916 0.952T2-1 365 N 7900 1.832 1.005 3 5.316 0.345 2.598 1.702T2-1 365 Y 7650 1.845 1.012 2 5.379 0.343 1.947 1.279T2-1 303 Y 7354 1.545 0.847 1 4.024 0.384 1.209 0.745T2-1 62 A 7353 0.372 0.204 0 0.515 0.722 0.268 0.075 0.594 0.040T2-1 366 A 7041 2.216 1.215 0 7.312 0.303 0.671 0.468 3.543 1.406T2-1 365 A 6765 2.229 1.223 5 7.388 0.302 4.164 2.907 3.564 1.423T2-1 365 A 6470 2.251 1.235 1 7.512 0.300 1.375 0.963 3.600 1.452T5-1 366 N 7156 1.732 1.000 3 4.845 0.357 2.547 1.636 1.312 0.292T5-1 365 N 8978 1.643 0.948 0 4.443 0.370 0.607 0.383T5-1 365 N 10780 1.577 0.911 0 4.160 0.379 0.598 0.371T5-1 365 Y 12582 1.524 0.880 2 3.937 0.387 1.816 1.113T5-1 305 Y 14242 1.239 0.716 1 2.834 0.437 1.105 0.622T5-1 61 A 14379 0.247 0.143 0 0.311 0.796 0.197 0.040 0.187 0.006T5-1 365 A 16186 1.442 0.833 1 3.600 0.401 1.177 0.706 1.092 0.203T5-1 365 A 17988 1.408 0.813 1 3.468 0.406 1.166 0.692 1.067 0.193T5-1 365 A 19790 1.379 0.796 1 3.353 0.411 1.156 0.681 1.045 0.185
SE
3588 Actual 10 10.000 3.162 12.785 19.859 6.347 2.5191.301 theta 0.504
2555 12.316 bias 1.016 Variance Std Error1.759 Unbiased 0.496 0.028 0.166
CRF 0.504 0.166
Z 3.035P-value 0.0012
Summary of CRF Calculations for Total Crashes
Dispersion 1.0381

Analysis Results for Provide Interchange Lighting
G-5
�
������������������������������������������������������������� �7����������������7�����������
�
����������������������������������������������� �!�"#������
�
����������������������������������������"��$�%�&"���"��
�
�������������� ��������������������������'�()* �����
�������������� ����,��"�������������-��.��/��"��$�
��������������0��1����#�"������������������������0"-�
�������������� �2������3����,$������������������"�$�����"�$�
���������������&&���3����,$����������������������� 5���� 5�
���������������,���.��"���6�����������������������7+�
�
�
������������������������������������8$����0�.�$�%�&"���"��
�
���������8$����������������0�.�$�����3�$����
�
����������5!�������������������+�����8�9��8�9���8�9��8�9+�8�9��8�9��8�9��8�9:�8�9;�8�97�
�������������������������������������8�9��8�9���8�9��8�9+�8�9��8�9��8�9��8�9:�8�9;�8�97�
�������������������������������������8�9��8�9��8�9+�8�9��8�9��8�9��8�9:���9����9����9��
����������������������������������8���
���������8"����#�"�������������������
���������8��5�������������������;����8�(<��=�8�0�<��=����<��=�0%8<�=�068<�=����<:=�
�������������������������������������!�(<�=��(6<�=�
����������80�����������������������������+�������
����������5�480��������������������������
����������8��������������������������0���
����������8������������������������������:�������
����������8����������������������������+;������:�+�7�:���
��������������������������������+����������
�
�
��������������������������������������!�������%�&"���"��
�
������������������������������������!��������������&&�#�
�
������������������������������������!��������������%���#�2�
������������������������������������!��������������$�� ��
�
�
�����������������������������8��������"����������-��""�������&����
�
������������������8�����"������������������ ������������3�$����������3�$��> ��
�
������������������ �.���#�������������������7������������*+��7�����������*:7:��
�������������������#�$��� �.���#������������7������������*+��7�����������*:7:��
������������������!����"��8��9�?������������7����������;�*��7������������*7�7��
�������������������#�$���!����"��@����������7����������;�*��7������������*7�7��
������������������0"-�0�1�$��""����������������������9���*�7���
�
�
������������$-"����#"�.��-��*�
��
�
����������������������������������������������������������������� �7����������������7�����������
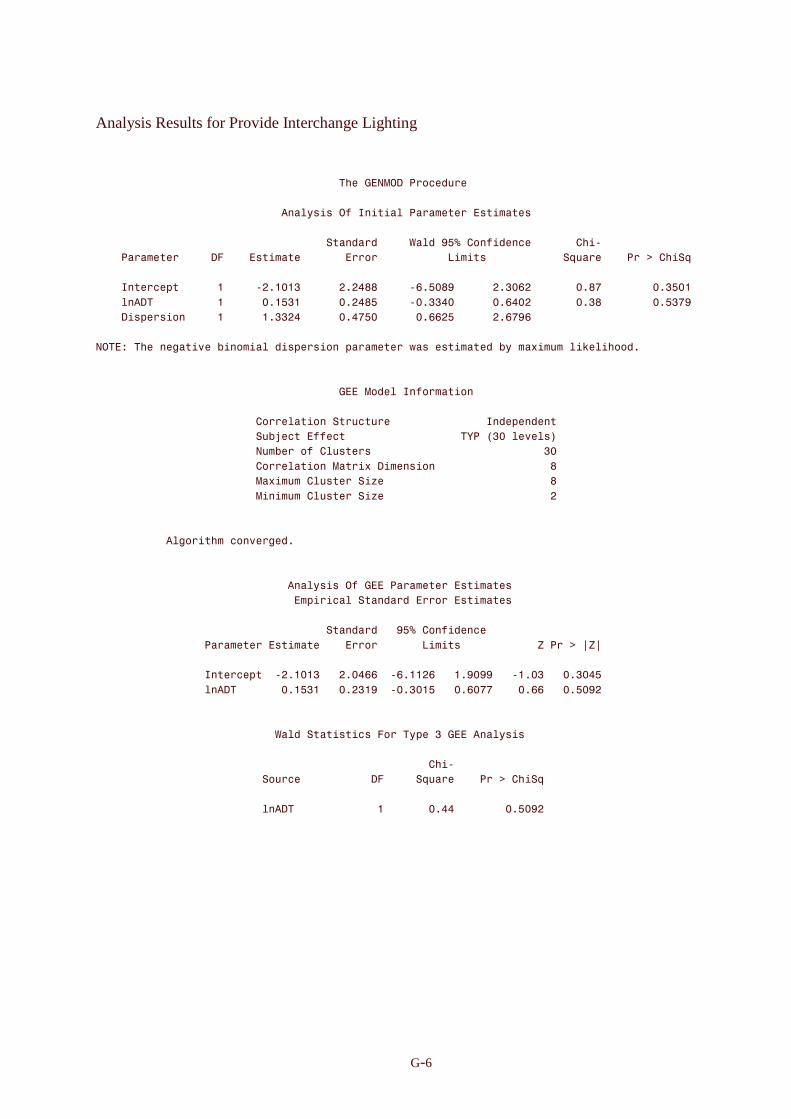
Analysis Results for Provide Interchange Lighting
G-6
�
����������������������������������������������� �!�"#������
�
��������������������������������$������&�%����$�!��������������
�
������������������������������������������������'�$��7�A�8"�&����#��������8��9�
����!����������� ��������������������"������������0����������������?��������!��B�8���?�
�
����%���#�2������������9�*���+�������*��;;�����9�*��;7�������*+�����������*;:���������*+����
����$�� �������������������*��+��������*��;������9�*++���������*������������*+;���������*�+:7�
���� ��2����"��������������*++���������*�:���������*�����������*�:7��
�
���� �������-��.��,��"��$����2����"��2�������C����������,���D���$�1�$��""�*�
�
�
�������������������������������������������"��$�%�&"���"��
�
�������������������������8"���$��"�����#������������������%���2������
���������������������������,E�#��&&�#�������������������5!�<+��$�.�$�=�
���������������������������,���"&�8$��������������������������������+��
�������������������������8"���$��"������D� �����"�������������������;�
���������������������������D���8$�������F���������������������������;�
�������������������������������8$�������F�����������������������������
�
�
������������$-"����#"�.��-��*�
�
�
���������������������������������$������&�����!��������������
��������������������������������2���#�$������������"���������
�
����������������������������������������������7�A�8"�&����#��
�����������������!�������������������"��������0���������������G�!��B�HGH�
�
�����������������%���#�2��9�*���+����*������9�*��������*7�77���9�*�+����*+����
�����������������$�� ���������*��+�����*�+�7��9�*+�������*��::�����*������*��7��
�
�
����������������������������'�$�������#���"����2��+��������$�����
�
����������������������������������������������������8��9�
���������������������������"��#������������ �������?��������!��B�8���?�
�
��������������������������$�� �����������������������*�����������*��7�

Analysis Results for Provide Interchange Lighting
G-7
�� � � ���� � � � � � ��� ��� � � � � ��� � ��� ���� �� �� �� � � �� � �� ��� �� �� � � �
�
TYP Duration Construction ADT ptotal Cy Total V(count) AlphaEB
lambda V(EB)Projected
Count V(PC)T1-1 364 N 6287 0.466 1.000 0 0.756 0.617 0.288 0.110 0.288 0.055T1-1 364 N 6250 0.466 0.999 0 0.755 0.617 0.287 0.110T1-1 183 Y 6195 0.233 0.500 0 0.306 0.763 0.178 0.042T1-1 181 A 6197 0.231 0.495 0 0.302 0.765 0.177 0.042 0.142 0.014T1-1 365 A 6160 0.465 0.997 0 0.753 0.617 0.287 0.110 0.287 0.055T1-1 364 A 6141 0.464 0.994 1 0.750 0.618 0.668 0.255 0.286 0.054T1-1 364 A 6105 0.463 0.993 0 0.749 0.618 0.286 0.109 0.286 0.054T2-1 366 N 8173 0.487 1.000 3 0.803 0.606 1.476 0.581 0.888 0.175T2-1 365 N 7900 0.483 0.992 0 0.794 0.608 0.294 0.115T2-1 365 Y 7650 0.481 0.987 1 0.789 0.610 0.684 0.267T2-1 303 Y 7354 0.397 0.815 0 0.606 0.654 0.260 0.090T2-1 62 A 7353 0.081 0.167 0 0.090 0.902 0.073 0.007 0.148 0.005T2-1 366 A 7041 0.476 0.977 0 0.778 0.612 0.291 0.113 0.868 0.168T2-1 365 A 6765 0.472 0.969 2 0.768 0.614 1.062 0.410 0.861 0.165T2-1 365 A 6470 0.469 0.962 1 0.761 0.616 0.673 0.259 0.855 0.162T5-1 366 N 7156 0.477 1.000 1 0.781 0.611 0.680 0.264 0.414 0.053T5-1 365 N 8978 0.493 1.032 0 0.816 0.604 0.297 0.118T5-1 365 N 10780 0.507 1.062 0 0.849 0.597 0.302 0.122T5-1 365 Y 12582 0.519 1.087 1 0.877 0.591 0.715 0.292T5-1 305 Y 14242 0.442 0.926 1 0.702 0.629 0.649 0.240T5-1 61 A 14379 0.088 0.185 0 0.099 0.895 0.079 0.008 0.077 0.002T5-1 365 A 16186 0.539 1.130 0 0.927 0.582 0.314 0.131 0.468 0.067T5-1 365 A 17988 0.548 1.148 0 0.948 0.578 0.317 0.134 0.475 0.069T5-1 365 A 19790 0.556 1.165 0 0.968 0.574 0.319 0.136 0.482 0.072
SE
3588 Actual 4 4.000 2.000 4.547 5.235 0.887 0.9420.463 theta 0.764
2555 3.625 bias 1.032 Variance Std Error0.518 Unbiased 0.740 0.145 0.381
CRF 0.260 0.381
Z 0.682P 0.248
Summary of CRF Calculations for Injury/Fatal Crashes
Dispersion 1.3324
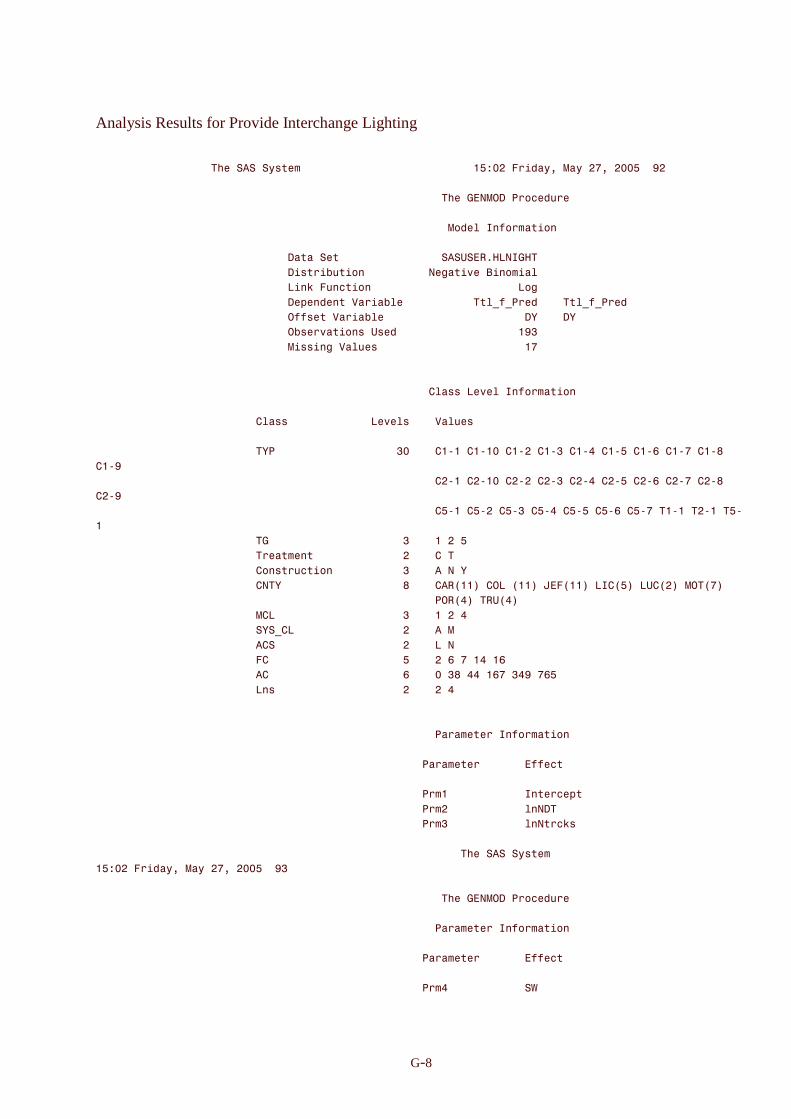
Analysis Results for Provide Interchange Lighting
G-8
����������������������������������������������������������� ����������������:��������7��
�
��������������������������������������������������������������� �!�"#������
�
��������������������������������������������������������"��$�%�&"���"��
�
������������������������������ ������������������������6��(*I0�%�I��
������������������������������ ����,��"�������������-��.��/��"��$�
������������������������������0��1����#�"������������������������0"-�
������������������������������ �2������3����,$�������������$4&4!��������$4&4!����
�������������������������������&&���3����,$����������������������� 5���� 5�
�������������������������������,���.��"���6�����������������������7+�
������������������������������������-�3�$���������������������������:�
�
�
����������������������������������������������������8$����0�.�$�%�&"���"��
�
�������������������������8$����������������0�.�$�����3�$����
�
��������������������������5!�������������������+�����8�9��8�9���8�9��8�9+�8�9��8�9��8�9��8�9:�8�9;�
8�97�
�����������������������������������������������������8�9��8�9���8�9��8�9+�8�9��8�9��8�9��8�9:�8�9;�
8�97�
�����������������������������������������������������8�9��8�9��8�9+�8�9��8�9��8�9��8�9:���9����9����9
��
������������������������������������������������+����������
��������������������������������������������������8���
�������������������������8"����#�"������������+��������5�
�������������������������8��5�������������������;����8�(<��=�8�0�<��=����<��=�0%8<�=�068<�=����<:=�
�����������������������������������������������������!�(<�=��(6<�=�
��������������������������80��������������������+����������
��������������������������5�480��������������������������
��������������������������8��������������������������0���
��������������������������8������������������������������:�������
��������������������������8����������������������������+;������:�+�7�:���
�������������������������0�������������������������������
�
�
�����������������������������������������������������!�������%�&"���"��
�
���������������������������������������������������!��������������&&�#�
�
���������������������������������������������������!��������������%���#�2�
���������������������������������������������������!��������������$�� ��
���������������������������������������������������!�+������������$���#1��
�
������������������������������������������������������������������������������������������������
�� ����������������:��������7+�
�
��������������������������������������������������������������� �!�"#������
�
�����������������������������������������������������!�������%�&"���"��
�
���������������������������������������������������!��������������&&�#�
�
���������������������������������������������������!���������������'�
�
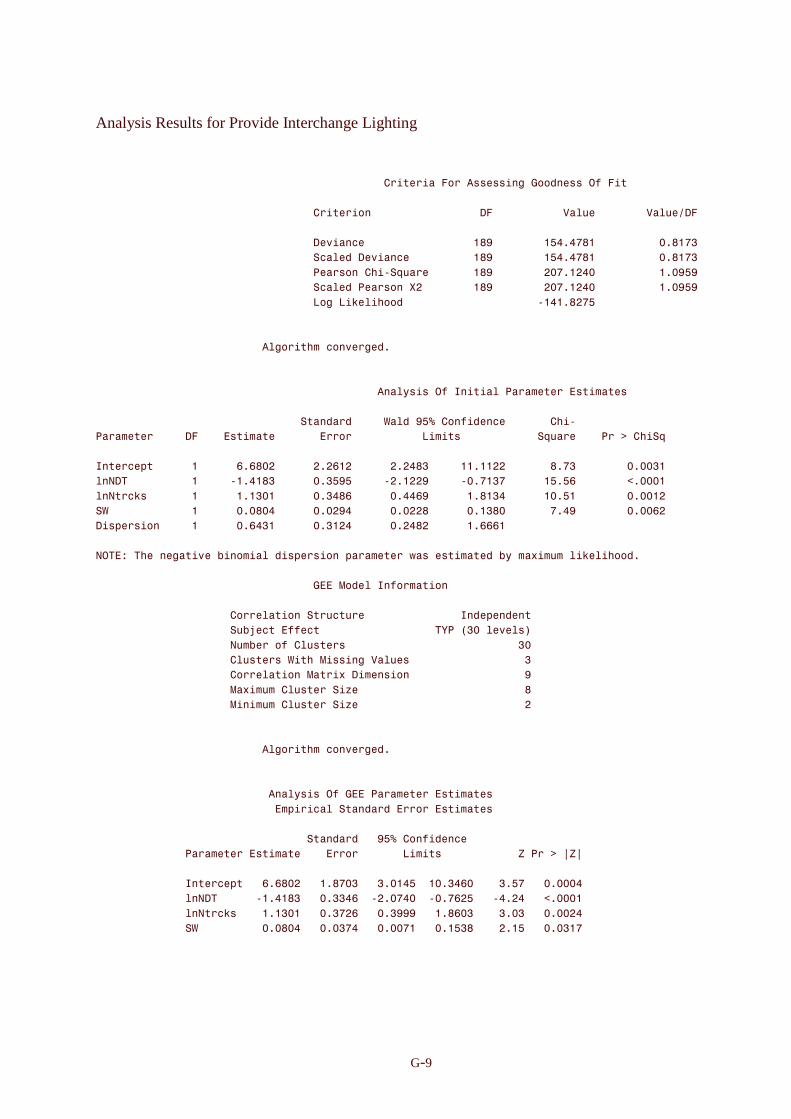
Analysis Results for Provide Interchange Lighting
G-9
�
���������������������������������������������8��������"����������-��""�������&����
�
����������������������������������8�����"������������������ ������������3�$����������3�$��> ��
�
���������������������������������� �.���#�������������������;7�����������*�:;������������*;�:+�
�����������������������������������#�$��� �.���#������������;7�����������*�:;������������*;�:+�
����������������������������������!����"��8��9�?������������;7����������:*���������������*�7�7�
�����������������������������������#�$���!����"��@����������;7����������:*���������������*�7�7�
����������������������������������0"-�0�1�$��""����������������������9���*;�:��
�
�
���������������������������$-"����#"�.��-��*�
�
�
�����������������������������������������������$������&�%����$�!��������������
�
��������������������������������������������'�$��7�A�8"�&����#��������8��9�
!����������� ��������������������"������������0����������������?��������!��B�8���?�
�
%���#�2��������������*�;���������*�����������*��;+�������*�����������;*:+���������*��+��
$�� �����������������9�*��;+�������*+�7������9�*���7�����9�*:�+:��������*����������J*�����
$���#1����������������*�+���������*+�;��������*���7�������*;�+���������*�����������*�����
�'���������������������*�;���������*��7��������*���;�������*�+;��������:*�7���������*�����
��2����"��������������*��+��������*+����������*��;��������*�����
�
���� �������-��.��,��"��$����2����"��2�������C����������,���D���$�1�$��""�*�
�
���������������������������������������"��$�%�&"���"��
�
���������������������8"���$��"�����#������������������%���2������
�����������������������,E�#��&&�#�������������������5!�<+��$�.�$�=�
�����������������������,���"&�8$��������������������������������+��
���������������������8$������'���������-�3�$���������������������+�
���������������������8"���$��"������D� �����"�������������������7�
�����������������������D���8$�������F���������������������������;�
���������������������������8$�������F�����������������������������
�
�
���������������������������$-"����#"�.��-��*�
�
�
������������������������������$������&�����!��������������
�����������������������������2���#�$������������"���������
�
�������������������������������������������7�A�8"�&����#��
��������������!�������������������"��������0���������������G�!��B�HGH�
�
��������������%���#�2����*�;������*;:�+���+*��������*+�������+*�:����*�����
��������������$�� �������9�*��;+����*++����9�*�:����9�*:������9�*�����J*�����
��������������$���#1������*�+������*+:������*+777����*;��+����+*�+����*�����
���������������'�����������*�;������*�+:�����*��:�����*��+;�����*������*�+�:�
�
�
����

Analysis Results for Provide Interchange Lighting
G-10
����������������������'�$�������#���"����2��+��������$�����
�
�������������������������������������������������8��9�
������������������������"��#������������ �������?��������!��B�8���?�
�
�����������������������$�� ����������������������:*7:��������J*�����
�����������������������$���#1�������������������7*�����������*�����
������������������������'�������������������������*�����������*�+�:

Ana
lysi
s R
esul
ts f
or P
rovi
de I
nter
chan
ge L
ight
ing
G-1
1 ��
������
��
��� ��
�
���
��
��
���� �����
��
���
�����
���
�� �� �
�
TY
PD
urat
ion
DY
Con
stru
ctio
nN
AD
Tpt
otal
Cy
Tot
alV
(cou
nt)
Alp
haE
B
lam
bda
V(E
B)
Pro
ject
ed
Cou
ntV
(PC
)T
1-1
365
0N
1666
0.10
1.00
20.
106
0.94
0.21
0.01
30.
150.
005
T1-
136
50.
00N
1656
0.10
1.01
00.
107
0.94
0.09
0.00
6T
1-1
183
-0.6
9Y
1646
0.05
0.51
00.
052
0.97
0.05
0.00
2T
1-1
181
-0.7
0A
1591
0.24
2.43
00.
279
0.87
0.21
0.02
80.
370.
027
T1-
136
50.
00A
1581
0.49
4.94
00.
647
0.76
0.37
0.09
00.
760.
112
T1-
136
40.
00A
1576
0.49
4.95
00.
648
0.76
0.37
0.09
00.
760.
113
T1-
136
40.
00A
1567
0.50
4.99
00.
655
0.76
0.38
0.09
10.
770.
115
T2-
136
60.
00N
2171
0.18
1.00
00.
201
0.90
0.16
0.01
70.
210.
011
T2-
136
50.
00N
2099
0.19
1.05
10.
211
0.89
0.28
0.03
0T
2-1
365
0.00
Y20
330.
201.
100
0.22
20.
890.
170.
020
T2-
130
3-0
.19
Y19
540.
170.
960
0.19
20.
900.
160.
016
T2-
162
-1.7
7A
2076
0.53
2.93
00.
704
0.75
0.39
0.09
90.
620.
095
T2-
136
60.
00A
1988
3.30
18.3
70
10.3
180.
321.
060.
719
3.92
3.74
4T
2-1
365
0.00
A19
103.
4919
.39
111
.300
0.31
1.77
1.22
24.
144.
171
T2-
136
50.
00A
1826
3.71
20.6
50
12.5
810.
301.
100.
773
4.41
4.73
3T
5-1
366
0.00
N19
160.
461.
001
0.59
50.
770.
580.
133
0.47
0.04
1T
5-1
365
0.00
N24
040.
330.
720
0.40
30.
820.
270.
048
T5-
136
50.
00N
2887
0.26
0.56
00.
298
0.86
0.22
0.03
1T
5-1
365
0.00
Y33
690.
210.
450
0.23
30.
880.
180.
021
T5-
130
5-0
.18
Y38
140.
140.
310
0.15
80.
920.
130.
011
T5-
161
-1.7
9A
3851
0.03
0.06
00.
029
0.98
0.03
0.00
10.
030.
000
T5-
136
50.
00A
4335
0.14
0.31
00.
157
0.92
0.13
0.01
10.
150.
004
T5-
136
50.
00A
4817
0.12
0.27
00.
134
0.93
0.11
0.00
80.
130.
003
T5-
136
50.
00A
5300
0.11
0.24
00.
116
0.93
0.10
0.00
70.
110.
002
SE
3588
9.83
Act
ual
11
16.
0216
.17
13.1
193.
620.
61T
heta
Hat
0.06
2557
7.01
1.82
bias
1.05
Var
ianc
eS
td E
rror
0.26
unbi
ased
0.06
0.00
30.
062.
36
CR
F0.
940.
06
Z16
.372
84P
-val
ue0
�