development of computerized … · in fulfilment of the requirement for the degree of master of...
TRANSCRIPT

UNIVERSITI PUTRA MALAYSIA
DESIGN AND DEVELOPMENT OF COMPUTERIZED PHOTOFLASH METHOD FOR
THERMAL DIFFUSIVITY MEASUREMENT
THAI MING YEOW
FS 2007 51

DESIGN AND DEVELOPMENT OF COMPUTERIZED PHOTOFLASH METHOD FOR
THERMAL DIFFUSIVITY MEASUREMENT
By
THAI MING YEOW
Thesis Submitted to the School of Graduate Studies, Universiti Putra Malaysia, in Fulfilment of the Requirement for the Degree of Master of Science
October 2007
ii
DEDICATION
To my dearest parents Thai Qui Yoong and Wong Ah Mooi
for their supports and concern……
To my beloved Fong Mei Mei
who loves and support me all the times...
To my supervisors
Assoc. Prof. Dr. Zaidan Abdul Wahab, Prof. Wan Mahmood Mat Yunus and
Prof. Mohd. Maarof Moksin
for their guidance and advice…
To all my friends
for their assistance and supports…
iii
Abstract of thesis presented to the Senate of Universiti Putra Malaysia in fulfilment of the requirement for the degree of Master of Science
DESIGN AND DEVELOPMENT OF COMPUTERIZED PHOTOFLASH
METHOD FOR THERMAL DIFFUSIVITY MEASUREMENT
By
THAI MING YEOW
October 2007
Chairman: Associate Professor Zaidan Abdul Wahab, PhD Faculty: Science Thermal diffusivity, α is a parameter that characterizes the rate of heat diffusion in
the material due to heat flux in an unsteady-state process. Flash method was
introduced by Parker et al (1960) as a fast and economical method for determination
of thermal diffusivity. A computerized experimental system was constructed in this
project to simplify and expedite the experimental process for determination of
thermal diffusivity of solid samples at room temperature.
In conventional photoflash method, a high intensity photoflash was used as the
energy pulse source. A thermocouple wire was used to monitor the temperature of
the rear surface of the sample and captured by an oscilloscope. The calculation of
thermal diffusivity value could be done either manually or with the aid of several
software tools.
The present work replaces these lengthy processes by automating the firing of the
photoflash and the capturing of temperature-time data of the sample rear surface. A
Personal Computer equipped with a National Instrument DAQ (Data Acquisition)
iv
card plays its role as a control center to control and monitor the experiment process
from firing of flash to the completion of thermal diffusivity determination.
Various electronics circuits were studied and developed in order to facilitate the
firing of flash such as relay driver circuits, photodiode amplifier and Schmitt Trigger
circuit. The circuit interacts with the DAQ card to perform specific functions such as
triggering acquisition or switching on the flash.
An event-driven application called ThermDiff was written using Microsoft Visual
Basic 6 allowing the user to control the experimental operations interactively. The
application provides a complete set of functions to the user include hardware control,
data acquisition, data conditioning and computation of thermal diffusivity value.
Besides, other features such as file storage, graphical presentation, printing and help
system are included into the application.
The functionality and workability of the computerized experimental system were
successfully tested. The reliability and accuracy was verified by testing several
samples of known thermal diffusivity value: Aluminum, Silicon Carbide and Boron
Carbide. As results, the computed thermal diffusivity values showed close
agreements to the literature values with difference of less than ±5%.
It is recommended that future researches can be carried out to develop a
computerized experimental system that is capable to determine thermal diffusivity
value accurately at various temperatures.

v
Abstrak tesis yang dikemukakan kepada Senat Universiti Putra Malaysia sebagai memenuhi keperluan untuk ijazah Master Sains
REKABENTUK DAN PEMBANGUNAN KAEDAH LAMPU KILAT
BERKOMPUTER UNTUK PENGUKURAN DAYA RESAPAN THERMAL
Oleh
THAI MING YEOW
Oktober 2007 Pengerusi: Profesor Madya Zaidan Abdul Wahab, PhD Fakulti: Sains Daya resapan terma, α merupakan salah satu parameter yang menyifatkan kadar
penyebaran haba dalam suatu bahan disebabkan oleh aliran haba dalam proses
keadaan tidak mantap. Kaedah lampu kilat diperkenalkan oleh Parker et al. (1960)
sebagai suatu kaedah yang cepat dan ekonomi untuk penentuan daya resapan terma.
Satu sistem eksperimen berkomputer telah dibangunkan dalam projek ini untuk
memudahkan dan mempercepatkan proses eksperimen bagi penentuan nilai daya
resapan terma bahan pepejal pada suhu bilik.
Dalam kaedah lampu kilat konvensyenal, suatu lampu kilat yang berkeamatan tinggi
digunakan sebaga sumber tenaga denyut. Dawai termogandingan digunakan untuk
memantau suhu pada permukaan belakang sampel dan direkodkan oleh sebuah
osiloskop. Pengiraan nilai daya resapan terma boleh dilakukan secara manual atau
dengan bantuan beberapa perisian komputer.
Dalam kajian ini, proses yang memakan masa ini digantikan dengan pengautomatik
pemancaran lampu kilat dan pencatatan data suhu-masa pada permukaan belakang
sampel. Sebuah komputer peribadi dilengkapi Kad DAQ dari “National Instruments”

vi
memainkan peranan sebagai pusat kawalan untuk mengawal dan memantau proses
eksperimen dari pemancaran lampu kilat hingga penyelesaian penentuan nilai daya
resapan terma.
Beberapa litar elektronik telah dikaji dan dibina untuk memudahkan pemancaran
lampu kilat seperti litar pemandu geganti, litar penguat diod peka cahaya dan litar
picuan Schmitt. Litar ini berinteraksi dengan Kad DAQ untuk menjalankan kerja-
kerja yang tertentu seperti picuan proses pemerolehan atau pengsuisan lampu kilat.
Suatu aplikasi berpandukan peristiwa dipanggil ThermDiff dibangunkan dengan
menggunakan Microsoft Visual Basic 6 membolehkan pengguna mengawal operasi
eksperimen secara interaktif. Aplikasi ini dilengkapkan dengan set fungsi yang
sempurna kepada pengguna termasuk pengawalan perkakas, pemerolehan data,
pelaziman data dan mengira nilai daya resapan terma. Di samping itu, fungsi-fungsi
lain seperti penyimpanan fail, pemaparan grafik, pencetakan dan sistem bantuan turut
dirangkumi aplikasi ini.
Fungsi dan kebolehan sistem eksperimen berpandukan komputer ini telah berjaya
diuji. Kebolehpercayaan dan kejituan sistem telah disahkan dengan pengujian
beberapa sampel yang nilai daya resapan termanya diketahui: Aluminium, Silikon
Karbida dan Boron Karbida. Sebagai keputusan, nilai daya resapan terma yang dikira
menunjukkan persetujuan yang hampir sama dengan nilai rujukan dengan perbezaan
kurang daripada ±5%. Adalah dicadangkan kajian ini dapat diteruskan dengan
pembangunan sistem berpandukan komputer yang dapat menentukan nilai daya
resapan terma pada sebarang suhu.

vii
ACKNOWLEDGEMENTS First of all, I would like to express my deepest gratitude to my parents for giving me
supports in material and spiritual form all the time and the immeasurable love given
to me keeping me living in comfortable and peaceful conditions.
My sincere thanks and highest respect to my supervisor, Assoc. Prof. Dr. Zaidan
Abdul Wahab who has been giving me advises and guidance throughout the whole
project. His willingness and helpfulness are always the strongest support for me to
keep going with the development process. Besides, I would like to express my
sincere gratitude to my co-supervisors, Prof. Dr. Wan Mahmood Mat Yunus and
Prof. Dr. Mohd. Maarof Moksin. Thanks for their guidance, advices and helpfulness.
Special thanks to my course mates and friend are also great supporters for me, I
appreciated all the helps and supports given to me.
Finally, may all of them who have helped and supported me living in peace,
happiness and prosperous.
viii
I certify that an Examination Committee has met on 4th October 2007 to conduct the final examination of Thai Ming Yeow on his Master of Science thesis entitled “Design and Development of Computerized Photoflash Method for Thermal Diffusivity Measurement” in accordance with Universiti Pertanian Malaysia (Higher Degree) Act 1980 and Universiti Pertanian Malaysia (Higher Degree) Regulations 1981. The Committee recommends that the student be awarded the degree of Master of Science. Members of the Examination Committee were as follows: Sidek Hj. Abd. Aziz, PhD Associate Professor Faculty of Science Universiti Putra Malaysia (Chairman) Zainal Abidin Sulaiman, PhD Associate Professor Faculty of Science Universiti Putra Malaysia (Internal Examiner) Azmi Zakaria, PhD Associate Professor Faculty of Science Universiti Putra Malaysia (Internal Examiner) Sinin Hamdan, PhD Associate Professor Faculty of Engineering Universiti Malaysia Sarawak (External Examiner) ________________________________
HASANAH MOHD GHAZALI, PhD Professor and Deputy Dean School of Graduate Studies Universiti Putra Malaysia
Date: 17 December 2007

ix
This thesis was submitted to the Senate of Universiti Putra Malaysia and has been accepted as fulfilment of the requirement for the degree of Master of Science. The members of the Supervisory Committee were as follows: Zaidan Abdul Wahab, PhD Associate Professor Faculty of Science Universiti Putra Malaysia (Chairman) W. Mahmood Mat Yunus, PhD Professor Faculty of Science Universiti Putra Malaysia (Member) Mohd Maarof Moksin, PhD Professor Faculty of Science Universiti Putra Malaysia (Member)
____________________ AINI IDERIS, PhD Professor and Dean School of Graduate Studies Universiti Putra Malaysia Date: 22 January 2008

x
DECLARATION
I hereby declare that the thesis is based on my original work except for quotations and citations which have been duly acknowledged. I also declare that it has not been previously or concurrently submitted for any other degree at UPM or other institutions.
__________________ THAI MING YEOW Date: 3 December 2007
xi
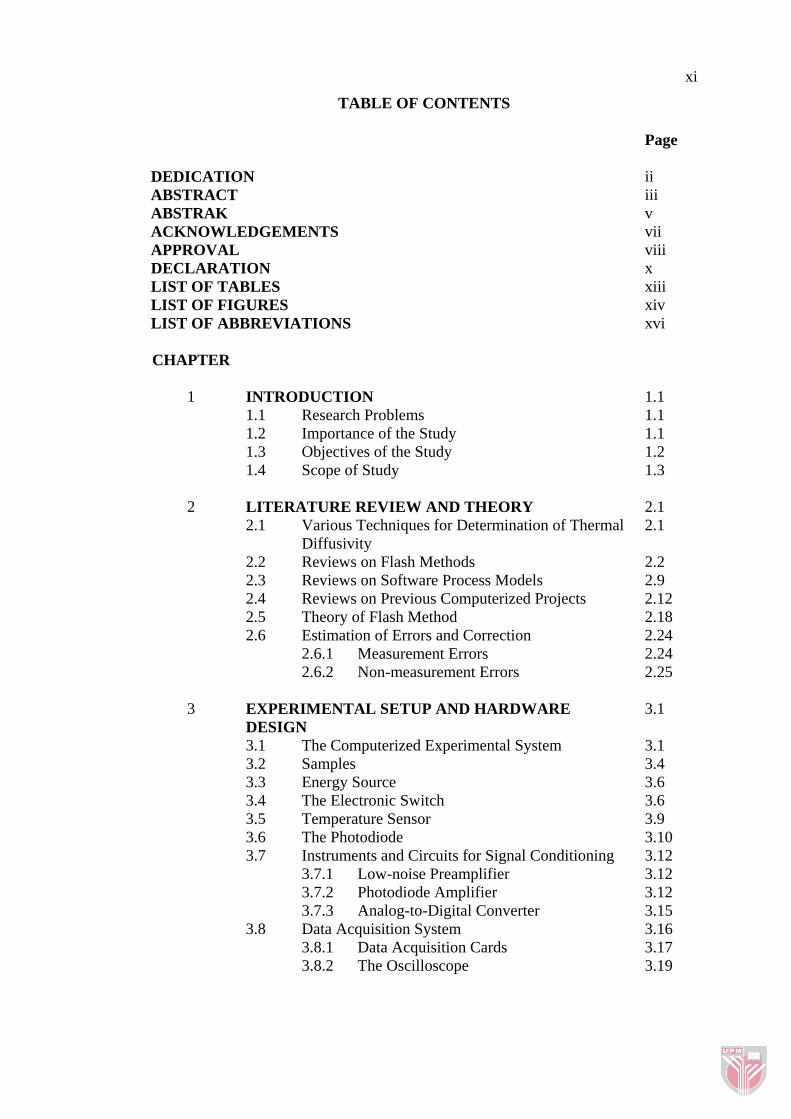
TABLE OF CONTENTS Page DEDICATION ii ABSTRACT iii ABSTRAK v ACKNOWLEDGEMENTS vii APPROVAL viii DECLARATION x LIST OF TABLES xiii LIST OF FIGURES xiv LIST OF ABBREVIATIONS xvi CHAPTER
1 INTRODUCTION 1.1 1.1 Research Problems 1.1 1.2 Importance of the Study 1.1 1.3 Objectives of the Study 1.2 1.4 Scope of Study 1.3 2 LITERATURE REVIEW AND THEORY 2.1 2.1 Various Techniques for Determination of Thermal
Diffusivity 2.1
2.2 Reviews on Flash Methods 2.2 2.3 Reviews on Software Process Models 2.9 2.4 Reviews on Previous Computerized Projects 2.12 2.5 Theory of Flash Method 2.18 2.6 Estimation of Errors and Correction 2.24 2.6.1 Measurement Errors 2.24 2.6.2 Non-measurement Errors 2.25 3 EXPERIMENTAL SETUP AND HARDWARE
DESIGN 3.1
3.1 The Computerized Experimental System 3.1 3.2 Samples 3.4 3.3 Energy Source 3.6 3.4 The Electronic Switch 3.6 3.5 Temperature Sensor 3.9 3.6 The Photodiode 3.10 3.7 Instruments and Circuits for Signal Conditioning 3.12 3.7.1 Low-noise Preamplifier 3.12 3.7.2 Photodiode Amplifier 3.12 3.7.3 Analog-to-Digital Converter 3.15 3.8 Data Acquisition System 3.16 3.8.1 Data Acquisition Cards 3.17 3.8.2 The Oscilloscope
3.19

xii
3.9 The Experimental Setup 3.19 3.9.1 Experimental Setup with DAQ card 3.19 3.9.2 Experimental Setup with Oscilloscope 3.22 4 SOFTWARE DESIGN 4.1 4.1 The Programming Language – Visual Basic 6 4.1 4.2 NI-DAQ 4.2 4.3 The Graphical User Interfaces (GUI) Design of
ThermDiff 4.3
4.4 Process Flows of ThermDiff 4.8 4.5 Algorithm Designs 4.11 4.5.1 The GUI Management Routine 4.11 4.5.2 Data Acquisition Routines 4.12 4.5.3 Memory Management Routines 4.13 4.5.4 Data Manipulation Routines 4.14 4.5.5 File Handling Procedures 4.23 4.5.6 Graphical Representation 4.23 4.5.7 Printing 4.23 4.6 The Help System 4.24 4.7 Deployment of ThermDiff 4.24 5 RESULTS AND DISCUSSIONS 5.1 5.1 The User Interfaces of ThermDiff 5.1 5.2 Functionalities and Features of ThermDiff 5.6 5.2.1 ThermDiff Settings 5.6 5.2.2 Data Acquisition 5.7 5.2.4 Features of ThermDiff 5.13 5.2.3 Data Processing and Manipulation 5.8 5.3 Reliability and Accuracy of the Computerized
System 5.14
6 CONCLUSION AND RECOMMENDATIONS 6.1 6.1 Conclusion 6.1 6.2 Suggestions For Framework 6.3 6.2.1 Hardware Improvement 6.3 6.2.2 Software Improvements 6.4 6.2.3 Further Studies 6.4
REFERENCES R.1 APPENDICES A.1 BIODATA OF THE AUTHOR B.1
xiii
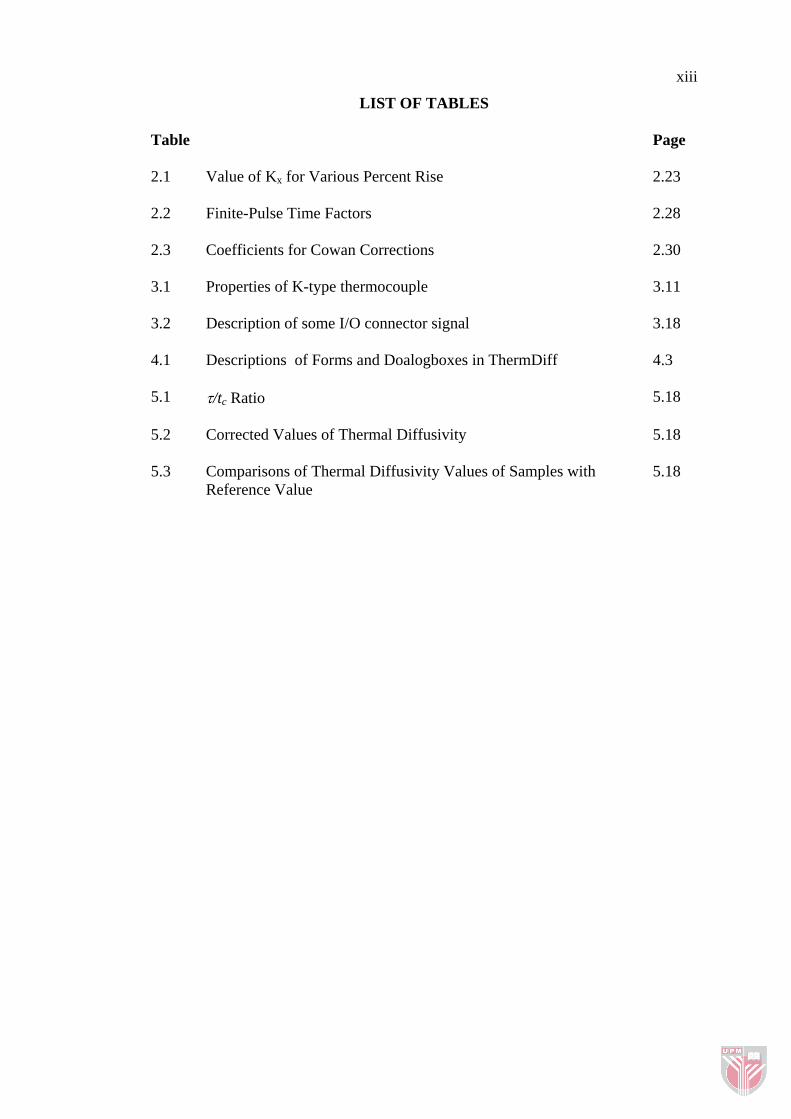
LIST OF TABLES
Table Page 2.1 Value of Kx for Various Percent Rise 2.23 2.2 Finite-Pulse Time Factors 2.28 2.3 Coefficients for Cowan Corrections 2.30 3.1 Properties of K-type thermocouple 3.11 3.2 Description of some I/O connector signal 3.18 4.1 Descriptions of Forms and Doalogboxes in ThermDiff 4.3 5.1 τ/tc Ratio 5.18 5.2 Corrected Values of Thermal Diffusivity 5.18 5.3 Comparisons of Thermal Diffusivity Values of Samples with
Reference Value 5.18

xiv
LIST OF FIGURES
Figure Page 2.1 Schematic of Boris Kirdric Institusion laser flash apparatus 2.17 2.2 An example screen of program developed by Teh, 2001 2.17 2.3 Dimensionless Plot of the Rear Surface Temperature History 2.23 2.4 Sawtooth pulse shape 2.27 3.1 The signal flow diagram for a computer-controlled instrument 3.5 3.2 Pulse Shape for Minolta 5400HS Photoflash 3.7 3.3 The socket and the custom-made adaptor 3.7 3.4 The relay driver circuit 3.8 3.5 Rise time of K-type Thermocouple 3.11 3.6 Schematic diagram for electronic circuits used for switching,
amplification and A/D conversion 3.13
3.7 Schematic diagram for photodiode amplifier 3.14 3.8 Schematic diagram for Schmitt Trigger 3.14 3.9 Schematic diagram for experimental setup with DAQ card 3.21 3.10 Schematic diagram for experimental setup with oscilloscope 3.21 3.11 Experimental setup with DAQ card 3.22 4.1 Organization of GUIs in ThermDiff 4.7 4.2 General Processes of Thermdiff 4.9 4.3 A Screenshot of macromedia Dreamweaver MX 4.25 4.4 A Screenshot of Package and Deployment Wizard 4.25 5.1 The GUI of the Main Window at Startup 5.2 5.2 A screenshot of ThermDiff with an Experiment Project 5.3 5.3 Acquisition setup
5.10

xv
5.4 The Satisfy? Messagebox Allows User to Accept of Discard the Acquired Data
5.10
5.5 The Outcome of Spike Removal (a) Before Spike Removal (b)
After Spike Removal 5.11
5.6 The Temperature History Curve of Boron Carbide Before
Adjacent Average Smoothing (RAW), After smoothing with 25 points (AV25 ), After smoothing with 50 points (AV50), After smoothing with 75 points (AV75) and After smoothing with 100 points (AV100)
5.12
5.7 The Temperature History Curve of Boron Carbide Before FFT
Smoothing (RAW), After FFT smoothing with 25 points (FFT25), After FFT smoothing with 50 points (FFT50), After FFT smoothing with 75 points (FFT75) and After FFT smoothing with 100 points (FFT100)
5.12
5.8 A Screenshot of Temperature History after Performing
Normalization Function 5.13
5.9 Computed Thermal Diffusivity for Aluminum Sample 5.15 5.10 Computed Thermal Diffusivity for Silicon Carbide Sample 5.16 5.11 Computed Thermal Diffusivity for Boron Carbide Sample 5.17

xvi
LIST OF ABBREVIATIONS ADC Analog to Digital Converter ANSI American National Standard Institution API Application Programming Interface BJT Bipolar Junction Transistor CAD Computer Aided Design CAM Computer Aided Modeling CPU Central Processing Unit CRT Cathode Ray Tube DAC Digital to Analog Converter DAQ Data Acquisition DC Direct Current DLL Dynamic Link Library DSP Digital Signal Processing DUT Device under Test FFT Fast Fourier Transform GB Gigabyte GPIB General Purposes Interface Bus GUI Graphical User Interface HTML Hypertext Markup Language IC Integrated Circuit I/O Input/Output ISA Industrial Standard Architecture LSI Large Scale Integration
xvii
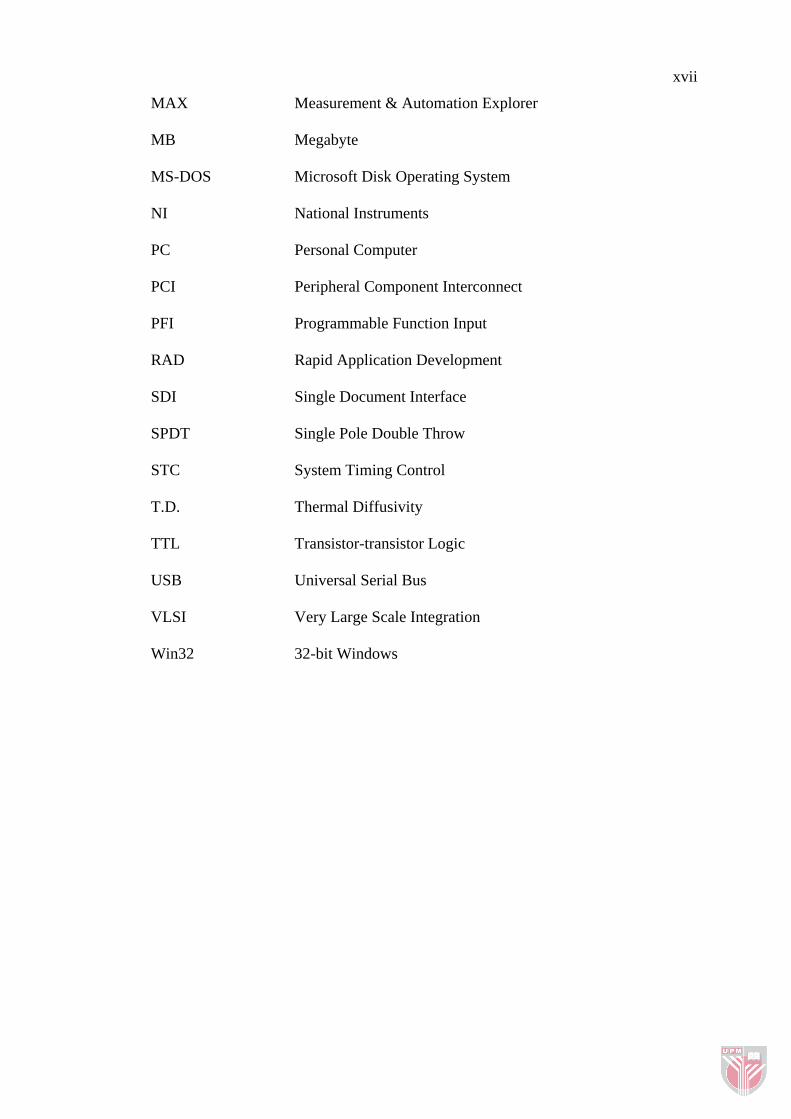
MAX Measurement & Automation Explorer MB Megabyte MS-DOS Microsoft Disk Operating System NI National Instruments PC Personal Computer PCI Peripheral Component Interconnect PFI Programmable Function Input RAD Rapid Application Development SDI Single Document Interface SPDT Single Pole Double Throw STC System Timing Control T.D. Thermal Diffusivity TTL Transistor-transistor Logic USB Universal Serial Bus VLSI Very Large Scale Integration Win32 32-bit Windows

xviii
LIST OF SYMBOLS
α thermal diffusivity
αcorrected corrected value of thermal diffusivity αx thermal diffusivity calculated at x percent rise β adjustable parameter of the energy pulse Δ sampling rate λ thermal conductivity ρ density ω dimensionless parameter τ pulse time ak raw data point with index k bi new data point derived from averaging of neighboring points c specific heat / number of adjacent points involved in averaging Cp heat capacity d sum of specified element values f frequency fn frequency estimated at the discrete value Fk parameter Fn parameter g small depth at the front surface i index of element in an array Ip current generated by photodiode KC correction factor for Cowan cooling curve data KR correction factor for Taylor rising curve data Kx constant corresponding to x% of maximum temperature rise

xix
L thickness of the sample N total number of data points / points of input Q energy of the light pulse Rf resistance S seeback coeffcient T temperature TM, TMax maximum temperature rise at the sample rear surface t time t1/2 time required for the back surface of the sample to reach half
the maximum temperature rise tc characteristic rise time tk time when k-th points is sampled tx time required to reach x% of TMax
t0.5 time required to reach half maximum temperature rise t0.25 time required to reach 25% maximum temperature rise t0.75 time required to reach 75% maximum temperature rise V voltage / dimensionless parameter Vb base voltage Vin input voltage Vout output voltage

CHAPTER 1
INTRODUCTION
Thermal diffusivity α is a parameter that characterizes the rate of heat diffusion in
the material due to a heat flux in an unsteady-state heat transfer process. It measures
how quickly a material can absorb heat from its surroundings and change
temperature. Higher value of thermal diffusivity implies higher rate of heat
propagation. Photoflash method is a simple and inexpensive method for
determination of thermal diffusivity, α.
1.1 Research Problems
Experiments that required routine data collection can be done more easily with the
help of computers. In photoflash experiment, data points were collected repeatedly in
very short intervals, and would be more effectively done in a computer-controlled
environment. Development of computerized system would help to enhance and
expedite the experiment.
1.2 Importance of the Study
Researches about thermal diffusivity are not something new. For instance, in
Universiti Putra Malaysia, many researches pertaining to thermal diffusivity were
carried out. (Teh, 2001), (Josephine, 2003). Regardless what methods are used, what
types of samples are tested or how the apparatuses are set up, computer is one of the
1.2
essential instruments in an experimental setup. Computers play important roles many
experimental processes such as data capturing, data manipulation and analysis,
equipments control, signal generation, simulation etc.
Computer interfacing and automation are common terms to many people yet projects
that computerize thermal diffusivity measurement are still rarely conducted.
Although computers have been used for the above-mentioned purposes, complete
and specialized solutions for the entire experimental procedure are still needed.
Considering the problems above, an all-in-one solution for determination of thermal
diffusivity is needed. Photoflash method was chosen because it is one of the fastest
and most economical methods for determination of thermal diffusivity while
providing reasonable accuracy. Thus, specialized software to computerize photoflash
method was developed.
1.3 Objectives of the Study
As mentioned in previous section, all-in-one solutions for determination of thermal
diffusivity are hardly available in the market. The objectives of this project are:
(i) To develop a user friendly computerized experimental system for
determination of thermal diffusivity of solids at room temperature based
on photoflash method that runs under the most popular Win32 (Windows
95, Windows NT or later) platform.
(ii) To perform thermal diffusivity measurement in a fraction of time
compare to the manual calculation method.

1.3
(iii) To attempt the usability of general-purpose programming language as an
alternative to the commonly used LabVIEW graphical language as a
development tool for computer interfacing.
1.4 Scope of Study
The project involves the following aspects:-
(i) Selection of a suitable programming language and tools and familiarized
with it. Microsoft Visual Basic 6 was used as the programming language,
development environment and compiler while NI-DAQ API (Application
Programming Interface) was used to interface with the acquisition
hardware.
(ii) Study or design related algorithms for manipulation and processing of
captured data such as smoothing, normalization, interpolation,
determination of parameters etc.
(iii) Design and handle GUI (Graphical User Interface).
(iv) Design electronic circuits for switching, amplification and triggering.
(v) Design routines for data capturing, flash switching and data storage.
(vi) Software integration – integration of GUI, processing routines and
acquisition routines to create a complete software system.
(vii) Test various samples and compare with reference values to verify the
reliability and accuracy of the system.
(viii) Creation of documentation or help system.

CHAPTER 2
LITERATURE REVIEW AND THEORY
2.1 Various Techniques for Determination of Thermal Diffusivity
Methods used for measuring thermal diffusivity can be categorised into two main
classes: transient heat-flow methods and periodic heat-flow methods. The basic
principle for the former is that if one end of a sample is heated periodically, then the
temperature of the sample also varies with the same period with diminishing
amplitude. As temperature wave travels along the sample with finite velocity there is
a varying phase relationship. Measurement of the amplitude decrement and either
phase difference or velocity enables the diffusivity to be determined. For the latter, a
sample is initially in equilibrium with uniform surrounding temperature, and then the
part of it is subjected to a change in thermal flux. The thermal diffusivity is evaluated
from changes in temperature which occur in measured time intervals at one or more
points within the sample. The naming of these methods are given based on the
originator or to the nature of the technique used (Toloukian, 1970):
i. transient heat-flow methods
a) Forbes' bar method
b) Moving heat-source method
c) Thermoelectric effect method
d) High intensity arc method
e) Flash method
ii. periodic heat-flow methods

2.2
a) Modified Angstrom's method
b) Temperature wave velocity
c) Temperature wave amplitude-decrement method
d) Phase-Lag method
e) Radial-wave method
Amongst these methods, more attention is given to the flash method and the
modified Angstrom's method. The have the advantages of being high speed and
considerable freedom from the effect of heat losses. These methods are valuable for
usage under extreme conditions, for instance at very high temperature.
2.2 Reviews on Flash Methods
Flash technique is not a new method for determination of thermal physical properties
of materials. The method was firstly used for homogenous, isotropic and opaque
materials. However, it was proven to work well when applied on disperse non-
homogenous materials, materials with two-dimensional anisotropy, multi-directional
anisotropic, layered materials as well as translucent materials. (Maglic et al., 1992)
The prototype of flash method was developed and studied by Parker et al in 1961. In
their research, the model was used to measure thermal diffusivity, heat capacity and
thermal conductivity of solid materials. A high intensity short duration heat pulse is
absorbed in the front surface of a thermally insulated specimen with a few millimeter
thickness and coated with camphor black to enhance heat absorption. An
oscilloscope was used to record the resulting temperature rise at the rear surface of
the specimen. The output of the oscilloscope was captured by oscilloscope camera.