development of an uav for the air cargo challenge 2017
TRANSCRIPT

UNIVERSIDADE DA BEIRA INTERIOR Engenharia
Development of an UAV for the Air Cargo
Challenge 2017 Competition
versão final após defesa
Alexandra Almeida Gomes
Dissertação para obtenção do Grau de Mestre em
Engenharia Aeronáutica (Ciclo de estudos integrado)
Orientador: Prof. Doutor Miguel Ângelo Rodrigues Silvestre
Covilhã, dezembro de 2017

ii

iii
‘’The best view comes after the
hardest climb’’
(Unknown)

iv

v
Acknowledgements
There are many people to whom I would like to thank for helping me over the last year in my
research and studies and that have made this dissertation possible.
First, I would like to thank to my supervisor, PhD Miguel Silvestre for allowing me the
opportunity to work and participate with you in several international projects along the last
three years.
Further, I would like to thank those with whom I worked with during the Air Cargo Challenge
2017 project. This obviously includes the team AERO@UBI_MARS, for the commitment and
dedication with which they have embraced this project.
At the same time, I would like to thank my life partner, Filipe Chaves, for everything you did
for me and for helping me keep it all in perspective.
Finally, and most importantly, I would like to thank my parents for allowing me to realize my
own potential. All the support they have provided me over the years was the greatest gift
anyone has ever given me.

vi

vii
Abstract
The present dissertation reports the development of an unmanned remotely piloted aircraft for
the Air Cargo Challenge 2017 competition. Air Cargo Challenge is a Design, Build, Fly
Aeronautical Engineering competition held in Europe every two years. Given the frequent
participation of the Department of Aerospace Sciences from University of Beira Interior in this
competition and considering the lack of documentation regarding these participations, this
Master of Science Dissertation aims to transmit the accumulated knowledge to future teams
and the UAV development community.
The aircraft was developed using computer aided engineering tools in the greatest possible
extent. The tools used for the development effort include: OpenFOAM®, XFOIL/XFLR5 for airfoil
development and detailed wing design and analysis; 3D CAD software as Dassault Systems
CATIA® V5 and SolidWorks®; CNC rapid prototyping like 3D printing and CNC hot wire foam core
cutting. Experimental test rigs were developed for different studies regarding LiPo batteries
for the propulsion and flight testing of high lift devices and roll control.
New low Reynolds number airfoils were designed as well as a Fowler flap with an innovative
extension mechanism. This mechanism was built using 3D printing technology. Several tests
were performed to different batteries to maximize propulsive system power. Furthermore, for
the first time in an Air Cargo Challenge, a University of Beira Interior team used mould
technology to build the aircraft in carbon fibre reinforced plastics.
Several delays and mishaps prevented the development of the aircraft from being completely
ready for the competition.
Keywords
Aircraft, UAV, Air Cargo Challenge, Fowler Flap, Low Reynolds Number, Airfoil, XFOIL, XFLR5

viii

ix
Resumo
A presente Dissertação reporta o desenvolvimento de um veículo aéreo não tripulado para a
competição Air Cargo Challenge 2017. O Air Cargo Challenge é uma competição de Engenharia
Aeronáutica do tipo Design, Build, Fly, que acontece na Europa a cada dois anos. Dada a
frequente participação do Departamento de Ciências Aeroespaciais da Universidade da Beira
Interior nesta competição e considerando a falta de documentação relativa a estas
participações, esta Dissertação de Mestrado pretende transmitir o conhecimento acumulado
para futuras equipas e para a comunidade que desenvolve UAV.
A aeronave foi desenvolvida, tanto quanto possível, com ferramentas de engenharia assistida
por computador. As ferramentas usadas incluem: OpenFOAM®, XFOIL/XFLR5 para o
desenvolvimento de perfis, desenho e análise detalhados da asa; software CAD 3D Dassault
Systems CATIA® V5 e SolidWorks®; ferramentas de prototipagem rápida como impressão 3D e
máquina CNC de corte de espuma com fio quente. Foram desenvolvidas diferentes bancadas de
teste para estudos de baterias LiPo para a propulsão e para ensaios de voo de dispositivos híper-
sustentadores e de controlo de rolamento.
Foram desenhados novos perfis de baixo Reynolds bem como um flap Fowler com um inovador
mecanismo de extensão. Este mecanismo foi construído com tecnologia de impressão 3D. Vários
testes foram feitos para diferentes baterias de forma a maximizar a potência do sistema
propulsivo. Além disso, pela primeira vez uma equipa da Universidade da Beira Interior utilizou
tecnologia de moldes para construir o avião em plásticos reforçados com fibra de carbono.
Diversos atrasos e imprevistos levaram a que a aeronave não estivesse plenamente desenvolvida
e pronta para participar na competição.
Palavras-Chave
Avião, UAV, Air Cargo Challenge, Flap Fowler, Baixo Número de Reynolds, Perfil Alar, XFOIL,
XFLR5

x

xi
Table of Contents
Acknowledgements ............................................................................................ v
Abstract........................................................................................................ vii
Keywords ...................................................................................................... vii
Resumo ......................................................................................................... ix
Palavras-Chave ................................................................................................ ix
Table of Contents ............................................................................................. xi
List of Figures ................................................................................................ xv
List of Tables ................................................................................................. xix
Nomenclature ................................................................................................ xxi
List of Symbols ............................................................................................. xxiii
1 Introduction .............................................................................................. 1
Motivation ............................................................................................ 1
The Air Cargo Challenge Competition ........................................................... 1
History of UBI’s Participation in the Air Cargo Challenge ................................... 5
Objectives ............................................................................................ 8
Overview ............................................................................................. 8
2 Literature Review ....................................................................................... 9
Basic Theory ......................................................................................... 9
2.1.1 Wing Design ................................................................................... 9
2.1.2 Low Reynolds Number Airfoils ........................................................... 12
State of Art ........................................................................................ 14
3 Methodology ............................................................................................ 21
Research ............................................................................................ 21
3.1.1 Propulsion ................................................................................... 21
3.1.1.1 Motor-propeller System Performance Testing ..................................... 21
3.1.1.2 Battery Testing and Selection ........................................................ 22
3.1.2 Aerodynamics .............................................................................. 23
3.1.2.1 Airfoil development .................................................................... 23
3.1.2.2 Fowler Flap development ............................................................. 23
3.1.2.3 Flight Testing ............................................................................ 24
3.1.2.3.1 Fowler Flap Effectiveness ......................................................... 24
3.1.2.3.2 Roll Control with Spoilers ......................................................... 25

xii
3.1.3 Construction Technology Preliminary Testing ........................................ 26
3.1.3.1 Wing panels .............................................................................. 26
3.1.3.2 Wing Panels Interfaces ................................................................ 27
3.1.4 Zagreb Region Mean Wind Speed ....................................................... 28
Conceptual Design ................................................................................ 29
3.2.1 Structural Design .......................................................................... 40
Preliminary Design ................................................................................ 41
3.3.1 Design Variables ........................................................................... 41
3.3.2 Theoretical Models ........................................................................ 42
3.3.2.1 Airplane Aerodynamics Model ........................................................ 42
3.3.2.2 Take-off Performance Model ......................................................... 45
3.3.2.3 Structure Weight Model ............................................................... 46
3.3.2.4 Propulsive Model ........................................................................ 47
3.3.2.5 Stability and Control Modelling ...................................................... 47
3.3.2.6 Performance Estimation ............................................................... 47
3.3.2.6.1 Available and required power versus airspeed ................................ 47
3.3.2.6.2 Flight Task Points Estimation .................................................... 48
3.3.2.7 Parametric Studies ..................................................................... 49
3.3.2.7.1 Design Point ......................................................................... 49
3.3.2.8 Weight and Balance .................................................................... 49
Detailed Design.................................................................................... 51
3.4.1 Wing Design ................................................................................. 51
3.4.2 Propulsion ................................................................................... 51
3.4.2.1 Motor controller – ESC ................................................................. 51
3.4.2.2 Battery ................................................................................... 51
3.4.3 Detailed Wing design...................................................................... 51
3.4.3.1 Fowler flap mechanism ................................................................ 52
Airplane Construction ............................................................................ 53
3.5.1 Wings ........................................................................................ 53
3.5.1.1 Spar ....................................................................................... 57
3.5.1.2 Vacuum Bag ............................................................................. 58
3.5.1.3 Wing Panels Attachment Interfaces ................................................. 60
3.5.2 Tails .......................................................................................... 62
3.5.3 Cargo Bay ................................................................................... 62

xiii
3.5.4 Fuselage ..................................................................................... 62
4 Results .................................................................................................. 64
Propulsion .......................................................................................... 64
Aerodynamics ...................................................................................... 67
4.2.1 Designed Airfoils ........................................................................... 67
4.2.2 Fowler Flap ................................................................................. 71
Parametric Studies ............................................................................... 74
Performance ....................................................................................... 75
4.4.1 Estimated Payload Versus Altitude ..................................................... 76
4.4.2 XFLR5 Final Design Wing Performance ................................................. 77
Stability and Control ............................................................................. 79
Final Airplane ...................................................................................... 79
4.6.1 Final Airplane 3D CAD..................................................................... 79
4.6.2 Flight Test Aircraft ........................................................................ 80
4.6.3 Wing Structure Testing ................................................................... 81
ACC17 Participation .............................................................................. 82
5 Conclusion .............................................................................................. 85
Bibliography ................................................................................................... 87

xiv

xv
List of Figures
Figure 1.1 - Structural validation test [3]. ................................................................ 5
Figure 1.2 - 100 m legs [3]. .................................................................................. 5
Figure 1.3-UBI teams ACC participant designs over the years ......................................... 7
Figure 2.1 – Estimated drag polar of UBI ACC2015 Aircraft, respective wing airfoil drag and total
drag minus the Induced Drag. Airfoil and aircraft maximum lift coefficients on the top. ..... 10
Figure 2.2 - The effect of Re number on lift curve and drag polar, [8]. ........................... 13
Figure 2.3 – XFOIL prediction performance (adapted from McArthur 2008), [9]. ................ 14
Figure 2.4 - UBI’s Winner Airplane 2011. ................................................................ 15
Figure 2.5 - AkaModell Stuttgart 2009 [10]. ............................................................. 16
Figure 2.6 – AkaModell Stuttgart 2013 wing Shells, [10]. ............................................. 16
Figure 2.7 – Euroavia Zagreb Team 2015, [11]. ........................................................ 17
Figure 2.8 - Born TU Lift aircraft in ACC 2015, [12]. .................................................. 18
Figure 2.9 - EUROLIFTER team from Rzeszow, [13].................................................... 18
Figure 2.10 – AERO@UBI aircraft from 2015 edition. .................................................. 19
Figure 3.1 - Thrust versus airspeed for the AXI 2826/10 motor with the APC 13x7 Sport propeller
for 11.7V in the electrical power supply. ............................................................... 21
Figure 3.2 - Battery test experimental setup scheme. ................................................ 23
Figure 3.3 – Slot parameters, [17]. ....................................................................... 24
Figure 3.4 - Glider prototype for the Fowler flap flight-testing. .................................... 25
Figure 3.5 - Glider prototype using spoilers in the Fowler flap wings to achieve roll control. 26
Figure 3.6 – Construction test of the wing panel, where in a) is one panel laminated, b) is joined
two panels, in c) 1.8m of span are ready to construction test represented in d) with a 7kg
battery. ........................................................................................................ 27
Figure 3.7 – Interface strength test. ..................................................................... 28
Figure 3.8 - Maximum flying weight with designs of chord optimized for maximum flying weight
as function of span (above) and Maximum Take Off weight for the 60m TO run. Designs using a
chord optimized for maximum flying weight as function of span considering the use of Fowler
Flap (𝑪𝑳 is 2.51 for b=3m increasing to 2.71 for 5m span). A head wind of 1.9 m/s was considered
(See Section 3.1.4). ......................................................................................... 31
Figure 3.9 – Payload Volume ............................................................................... 35
Figure 3.10 - Inside dimensions of the transportation box. .......................................... 36
Figure 3.11 - Cargo Bay attached to the body floor in UBI's ACC 2007 Pegasus Team winner
aircraft. ........................................................................................................ 37
Figure 3.12 - Typical Longitudinal Stability Map, [20] ................................................ 39
Figure 3.13 - Dutch Roll Action (Slightly Unstable), [20] ............................................. 39

xvi
Figure 3.14 - General configuration and main concepts adopted. .................................. 40
Figure 3.15 – Generic Wing section structure. .......................................................... 40
Figure 3.16 – Wing Section structure used in ACC17. .................................................. 41
Figure 3.17 - Design of mechanism in Dassault Systems SolidWorks software. ................... 52
Figure 3.18 – Male mould fabrication process. The figure shows the application of hollow
microballoons a), glass fibre layers b) another layer of hollow microballoons c), and coat of
paint d). ....................................................................................................... 54
Figure 3.19 -– Wing mould plug fabrication process. .................................................. 55
Figure 3.20 – Wing mould manufacturing. ............................................................... 55
Figure 3.21 – Wing shell manufacturing a) drawing the wing skins structure on clear flexible
plastic sheet and cutting the balsa wood core sheets to size; b) laying up the bi-axial carbon
fibre cloth with epoxy resin; c) cutting the carbon fibre to measure according to the clear
plastic sheets markings; d) applying balsa wood on the carbon fibre (note the gap for the
unidirectional carbon fibres spar cap on the lower right). ........................................... 57
Figure 3.22 – Wing shell manufacturing. ................................................................. 58
Figure 3.23 – Improvised vacuum bag. ................................................................... 59
Figure 3.24 – Wing manufacturing, joining the upper and lower surfaces ......................... 60
Figure 3.25 -2D drawing of an interface. The black bands correspond to the Dyneema® ...... 61
Figure 3.26 – a) The connection between wing panels showing the interface part: a); and the
hard-points in greater detail: b). ......................................................................... 61
Figure 3.27 – Tail surfaces.................................................................................. 62
Figure 3.28 – Cargo bay image on CATIA V5. ............................................................ 63
Figure 4.1 - Instantaneous voltage of the worst and the best batteries. .......................... 64
Figure 4.2 -Comparison of a heated versus a cold Turnigy A Spec 4500 battery. ................ 65
Figure 4.3 - Batteries performance data. ............................................................... 66
Figure 4.4 - Comparison of the specific energy of all batteries with the time of flight of 150s.
.................................................................................................................. 66
Figure 4.5 – Airfoils: MS115_437 initial airfoil; MS101_383 final airfoil used in the UBI ACC17.
.................................................................................................................. 67
Figure 4.6 -MS113_310, wing tip airfoil .................................................................. 67
Figure 4.7 - Airfoil lift to drag ratio comparison. MS115_437 is the airfoil initially developed;
MS101_383 is the final airplane airfoil; MS113_310 is the wingtip airfoil. ........................ 68
Figure 4.8 – Airfoils drag polars. .......................................................................... 69
Figure 4.9 – Airfoils lift curves. ............................................................................ 69
Figure 4.10 – Lower surface transition curves. ........................................................ 70
Figure 4.11 – Upper surface transition curves. ......................................................... 70
Figure 4.12 – Airfoil pitching moment comparison. .................................................... 71
Figure 4.13 - MS115_437 with the 0.3c Fowler Flap. .................................................. 72
xvii
Figure 4.14 - MARS_UBI_ACC2017 Airfoil and 0.3C Fowler Flap geometry with -0,025 gap, 0.02C
overlap, 30º deflection angle. Top left: lift curve. Top right: drag polar. Lower left:
aerodynamic efficiency versus lift coefficient. Lower Right: pitching moment coefficient versus
lift coefficient. ............................................................................................... 72
Figure 4.15 - Design of mechanism in Dassault Systems SolidWorks software. ................... 73
Figure 4.16 – Final design of the Fowler flap extension actuation mechanism. a) initial position,
b) intermediate position and c) final extended position. ............................................ 73
Figure 4.17 -Built 3D print Fowler flap actuation mechanism. ...................................... 74
Figure 4.18 - Parametric study results regarding the chord influence on the flight task points.
(b=4.26m) considering a constant TOW. ................................................................. 74
Figure 4.19 - Parametric study results regarding the chord influence on the flight task points
for different spans considering the TOW is limited by the 60m T/O run. ......................... 75
Figure 4.20 - Available and required power versus airspeed......................................... 76
Figure 4.21 – Payload versus altitude prediction. ...................................................... 76
Figure 4.22 -Wing Drag polar comparison. .............................................................. 77
Figure 4.23 - Final wing design prediction data obtained with XFLR5 (b=4.2m). ................ 78
Figure 4.24 – Final aircraft, designed in CATIA V5. .................................................... 79
Figure 4.25 – 3 View drawings of the ACC 2017 plane. ................................................ 80
Figure 4.26 – The finished aircraft. ....................................................................... 81
Figure 4.27 – Wing structural test. ....................................................................... 81
Figure 4.28 - AERO@UBI_MARS ACC team. .............................................................. 83
Figure 4.29 - AERO@UBI_PVG ACC team. ................................................................ 83

xviii

xix
List of Tables
Table 3.1 – Weather forecast in Zagreb region ......................................................... 29
Table 3.2 - Design Point .................................................................................... 50
Table 3.3 - Airplane weight and balance ................................................................ 50
Table 4.1 - AERO@UBI_MARS measures of final wing in XFLR5. ..................................... 78
Table 4.2 - AERO@UBI_MARS airplane dimensions. .................................................... 80

xx

xxi
Nomenclature
ABS - Acrylonitrile Butadiene Styrene
ACC – Air Cargo Challenge
ACC15 – Air Cargo Challenge 2015 edition
ACC17 – Air Cargo Challenge 2017 edition
APAE – Portuguese Association of Aeronautics and Space
CFD – Computational Fluid Dynamics
CFRP – Carbon Fibre Reinforced Plastic
CNC – Computer Numerical Control
EPS - Pultruded Polystyrene Foam
ESC – Electronic Speed Controller
EUROAVIA – European Association of Aerospace Students
FCP – Flight Competition Points
GFRP – Glass Fibre Reinforced Plastic
IST – Instituto Superior Técnico
MOSFET - Metal Oxide Semiconductor Field Effect Transistor
MTOW – Maximum Take-Off Weight
PB – Prediction Bonus
PCP – Project Competition Points
PID – Proportional Integral Derivative Controller
PLA - Polylactic Acid
RANS – Reynolds Averaged Navier-Stokes
R/C – Radio Controller
SAW – Simple Additive Weighting
TB – Time Bonus
UHMWPE - Ultra High molecular weight polyethylene, Dyneema®
UHMW - Ultra High molecular weight polyethylene, Dyneema®
UAV - Unmanned Aerial Vehicle
UBI – University of Beira Interior
URANS - Unsteady RANS

xxii

xxiii
List of Symbols
𝐴𝑅 – Aspect ratio
𝐴𝑅𝑊𝑖𝑛𝑔 – Wing aspect ratio
𝐴𝑅𝑉 – Vertical tail aspect ratio
𝐴𝑅𝐻 – Horizontal tail aspect ratio
𝑏 –Wing span
𝑏𝐻 –Horizontal tail span
𝑏𝑉 – Vertical tail span
𝑏𝑟𝑒𝑓 – Reference span
𝑐 – Airfoil chord
𝑐𝑟𝑒𝑓 – Reference chord
𝐶𝑑 – Drag coefficient of the airfoil
𝐶𝐷𝑝 – Total parasitic drag coefficient
𝐶𝐷𝑝𝑖 – Parasitic drag coefficient corrected for the Reynolds number
𝐶𝐷𝑝𝑖 𝑅𝑒𝑟𝑒𝑓
- Airfoil parasite drag coefficient at a known Reynolds
𝐶𝐷𝑝ℎ - Horizontal tail airfoil drag
𝐶𝐷𝑝𝑣 – Vertical tail airfoil drag
𝐶𝐷𝑝𝑊 – Wing airfoil drag
𝐶𝐷𝑖 – Total induced drag coefficient
𝐶𝐷𝑖𝑤 – Wings induced drag coefficient
𝐶𝐷𝑖ℎ – Horizontal tail induced drag coefficient
𝐶𝑑𝑚𝑖𝑛 – Airfoil minimum drag coefficient
𝐶𝐷𝑚𝑖𝑠 – Miscellaneous drag coefficient
𝐶𝑙 – Airfoil lift coefficient
𝐶𝐿 - Aircraft lift coefficient
𝐶𝐿ℎ - Lift coefficient of the horizontal tail
𝐶𝐿𝑚𝑎𝑥 – Maximum lift coefficient of the wing
𝐶𝑙𝛼𝑚𝑎𝑥-Highest lift curve slope
𝐶𝑙𝑚𝑎𝑥 – Airfoil maximum lift coefficient
𝐶𝑙𝑚𝑎𝑥 𝑅𝑒𝑅𝑒𝑓 – Maximum lift coefficient at reference Reynolds number
𝐶𝑚 – Pitching moment coefficient
𝐶𝑀𝑖𝑛𝐶𝑎𝑝𝐵𝑎𝑡𝑡𝑒𝑟𝑦 - Minimum capacity in the battery
𝐷 – Drag force
𝑒 – Oswald efficiency factor

xxiv
𝐹𝑙𝑒𝑔𝑠– Flown legs
𝐹𝑇𝑂- Take-off force
𝑔 - Gravitational acceleration
𝐺𝑆 – General Score
ℎ𝐶𝐺- Aircraft’s longitudinal distance from center of gravity to the datum in number of number
of wing mean geometric chords
ℎℎ- Wings aerodynamic center longitudinal distance
ℎ𝐻- Horizontal tail arm
ℎ𝑉- Vertical tail arm
I- Current intensity
𝑘 – Turbulence kinetic energy [𝑚2/𝑠2]
𝑘𝑖 – Constant value
𝐿 – Lift Force
𝐿/𝐷 – Lift-to-drag ratio
𝑚 – Mass [kg]
𝑚𝑏𝑎𝑡𝑡𝑒𝑟𝑖𝑒𝑠 – Batteries mass [kg]
𝑚𝐸𝑀𝑃𝑇𝑌 – Empty mass [kg]
𝑚𝑝𝑎𝑦𝑙𝑜𝑎𝑑 – Payload mass
𝑚𝑡𝑜𝑡𝑎𝑙 – Total mass
𝑀𝐴𝐶𝐸𝐻 – Horizontal tail mean aerodynamic chord
𝑀𝐴𝐶𝐸𝑉 – Vertical tail mean aerodynamic chord
𝑀𝐴𝐶𝑊𝑖𝑛𝑔 – Wing mean aerodynamic chord
𝑀 – Pitching moment [N/m]
𝑅𝐶 – Climb Rate
𝑃 – Penalties
𝑃𝑝𝑓𝑙𝑖𝑔ℎ𝑡 – Points for each flight
𝑅𝑒 – Reynolds number
𝑅𝑒𝐶𝑙𝑟𝑒𝑓 – Lift coefficient at reference Reynolds number
𝑅𝑒𝑅𝑒𝑓 – Reference Reynolds number
𝑅𝑒𝑒𝑥𝑝 – Correction exponent
𝑆 – Wing Area
𝑆𝐻 – Horizontal Tail Area
𝑆𝑉 – Vertical Tail Area
𝑆𝑓𝑢𝑠 - Fuselage area
𝑇 – Thrust
𝑇𝑎𝑣𝑎𝑖𝑙𝑎𝑏𝑙𝑒- Available thrust
𝑇𝑠𝑡𝑎𝑡𝑖𝑐 – Static thrust
𝑇𝐵 – Time Bonus

xxv
𝑇𝑅 – Required Thrust
𝑉∞ – Airspeed [𝑚/𝑠]
𝑉𝑓𝑙𝑖𝑔ℎ𝑡- Flight speed
𝑉𝐿𝑂- Lift-off speed
𝑥𝑁𝑃- Neutral point position
𝑥𝐶𝐺- CG position
𝑋𝑇𝑂- Take-off distance
𝑤- Proportionality function of the empty weight to the payload mass
𝑊 - Weight
𝑊𝐸𝑀𝑃𝑇𝑌 – Empty weight
𝑊𝑝𝑎𝑦 – Arbitrated Payload weight
𝑊𝑠𝑦𝑠 – Systems weight (motor, propeller, ESC, battery, receiver)
𝑊0𝑟𝑒𝑓 - Reference airplane weight
Greek Symbols
𝛼 – Angle of attack
𝛼𝑖 - wings induced angle of attack correction
𝛼𝐶𝑙𝑚𝑎𝑥 – Angle of attack for maximum lift coefficient
𝜇 – Dynamic viscosity [𝑁 ∙ 𝑠/𝑚2]
𝜇0 – Dynamic viscosity at 0m altitude [𝑁 ∙ 𝑠/𝑚2]
𝜌 – Fluid density [𝑘𝑔/𝑚3]
𝜌0 – Fluid density at 0m altitude [𝑘𝑔/𝑚3]
γ – Climb Angle
𝜋 – Pi number
𝜆𝑊𝑖𝑛𝑔 – Wing taper ratio

xxvi

1
1 Introduction
Motivation
The motivation for this work was the need to transmit the accumulated knowledge gathered
from Air Cargo Challenge (ACC) participations through a written document. To date, the
University of Beira Interior (UBI) has a large track record (See Section 1.3 History of UBI’s
Participation in the Air Cargo Challenge) on the ACC, but documentation on these participations
is scarce.
The main objective of this Master Degree dissertation is to document the development of the
AERO@UBI_MARS aircraft for participation in the Air Cargo Challenge 2017 (ACC17) competition.
Until now the knowledge that the teams had was transmitted by the faculty advisors, Dr. Miguel
Ângelo Silvestre and Dr. Pedro Gamboa. The former also pilot of UBI ACC teams.
The Air Cargo Challenge Competition
The Air Cargo Challenge is an Aeronautical Engineering competition in Europe that is held every
two years primarily directed to Aeronautical and Aerospace Engineering students [1]. It was
founded by the Portuguese Association of Aeronautics and Space, in Portuguese Associação
Portuguesa de Aeronáutica e Espaço (APAE). The first edition was in 2003 as a national
competition but now is a worldwide event in aeronautics academia.
The Air Cargo Challenge offers students the unique opportunity to develop a challenging
multidisciplinary project from the basic research to the finished product. By participating in
the ACC, the teams can test their knowledge and, at the same time, get involved with a wide
range of challenges which students will find in their future professional career: technical,
interpersonal and financial skills as well as strict deadlines.
In 2007 the competition grew to an international level under the umbrella of EUROAVIA, the
European Association of Aerospace Students, and the winning team got the possibility of
organizing the next edition.
The competition has several punctuation items: design report, technical drawings, oral
presentation, cargo loading time and flight task. The proof of flight is mandatory at the oral
presentation, otherwise the team is disqualified by the organizing committee based on safety
issues. A safety inspection is performed on every aircraft before the flight competition starts.
The safety inspections include the following: Physical inspection of the aircraft to ensure

2
structural integrity and to verify compliance with the design report and technical drawings and
before each flight a wing structural test is done (see Figure 1.1). To obtain points without
penalties, the aircraft must take off in a 60m runway strip and has design restrictions such as
the use of a specific motor and propeller and other limiting factors such as: limited span (2003,
2005 and 2007), limited lifting area (2009), limited empty weight (2011) and required to fit
inside a transportation box (since 2009). Typically, the main objective was to take-off with the
maximum possible payload; now, new and more specific tasks are required.
A major change began with the organization team of University of Stuttgart for ACC15. The
team had to design, build and fly a remotely controlled airplane that could lift off in 60m with
the maximum possible payload and fly as many 100 meter legs as possible in two minutes (see
Figure 1.2) [2]. The number of points was determined using the formula given by (Equation 1.1.
𝐹𝐶𝑃 = (2𝐹𝑤𝑒𝑖𝑔ℎ𝑡 [𝑘𝑔])(𝐹𝑙𝑒𝑔𝑠 + 𝑎)𝑏 (Equation 1.1)
Where FCP is Flight Competition Points, FWeight the Flown payload mass in kg, FLegs is Flown Legs.
a = 2 for a valid start + non-valid landing
a = 3 for a valid start + valid landing
b = 1 for a valid flight without crash
b = 0 for airplane losing parts or crashes or invalid start
The Maximum Take Off Weight (MTOW) was an important factor in the new flight task, but the
speed and agility of the aircraft proved to be a major factor in the outcome of the competition.
So, in the 2015 edition, the winning team was not the team that loaded the most weight. In
ACC15, the AERO@UBI team reached the 5th place, distinguished by the fact that it was one of
the lightest aircraft, about 2.2 kg and performed with a payload of 10.2kg for ten legs despite
having flown with a payload of 11.2kg in an invalid flight, having the best result amongst the
Portuguese teams. At the national level, a team from Instituto Superior Técnico (IST) - Olisipo,
and a team from the University of Porto - Phoenix ranked in 12th and 23rd places, respectively.
Over the years, rules and regulations have been modified, however, maximizing take-off weight
has remained one of the major goals. Typically, as in the current 2017 ACC edition, a bonus is
added to the final score if the payload prediction is close to the actual payload flown in the
competition. The payload Prediction Bonus (PB) is given according to Equation 1.2.
𝑃𝐵 = 10 (1 −|𝑝𝑟𝑒𝑑𝑖𝑐𝑡𝑒𝑑 𝑝𝑎𝑦𝑙𝑜𝑎𝑑 − 𝑎𝑐𝑡𝑢𝑎𝑙 𝑝𝑎𝑦𝑙𝑜𝑎𝑑|
𝑝𝑟𝑒𝑑𝑖𝑐𝑡𝑒𝑑 𝑝𝑎𝑦𝑙𝑜𝑎𝑑) (Equation 1.2)

3
Further bonification points are added if, at the flight competition, the teams load the aircraft
in under two minutes. For this Time Bonus (TB), the shorter the time a team uses to insert the
payload in the aircraft, the more points it gains. The relation is according to Equation 1.3.
𝑇𝐵 = 24 (1 −𝑡
120) <= 𝑡 < 120𝑠
𝑇𝐵 = 0 <= 𝑡 ≥ 120𝑠
(Equation 1.3)
If the team uses two minutes or more the bonus is zero, but there is no penalty if more than
two minutes are needed.
In the current edition, ACC17, as in previous editions, there is a 3-minute time window for
performing a successful take off and multiple attempts are possible during this time frame.
After that, there is a 30 second time window for the aircraft to gain altitude and airspeed to
prepare for taking the course before entering the 1st leg. Each leg is 100 meters long (see Figure
1.1 ). The countdown starts once the aircraft has passed the course start line (or after the 30
seconds for gaining altitude are over) and stops after 10 legs were fully flown [3].
According to the Requirements, Rules and Evaluation for the Air Cargo Challenge 2017 the
General Score (GS) is according to Equation 1.4:
𝐺𝑆 = 𝐹𝐶𝑃 + 𝑃𝐶𝑃 + 𝑃 + 𝐵𝑜𝑛𝑢𝑠 (Equation 1.4)
Where,
FCP are Flight Competition Points
PCP are Project Competition Points
P are the Penalties
The PCP score was:
- Detailed drawings = max. 30 points
- Report = max. 50 points
- Estimated Payload = max. 10 points
- Oral presentation = max. 30 points
Penalties would result from exceeding the oral presentation time or delays in delivery of reports
and other documents. The reports, drawings, the estimated payload chart and the 3-view
drawings should be delivered to the organization at or before the deadline. If the teams fail
this deadline or have delays in delivering reports/drawings and delays during the competition,

4
they can lose points or even be disqualified. The oral presentation is restricted to 15 minutes
and must include a movie that proves that the aircraft has previously flown, otherwise the team
can be penalized. The teams can be disqualified if they disregard the regulations, if the video
of proof of flight is missing, for breaking security rules or if aircraft parts are transported
outside the transportation box. Flying outside a specified area and flying over spectators
contributes to the team being disqualified in that round.
The biggest difference of ACC17 in respect to the 2015 edition is that it aimed to carry the
maximum possible weight and fly in the minimum time 10 legs in the same 100m course (see
Figure 1.2). The number of points are determined according to Equation 1.5.
𝑃𝑝𝑓𝑙𝑖𝑔ℎ𝑡 = 2 𝑚𝑝𝑎𝑦𝑙𝑜𝑎𝑑 (1000 [𝑚]
𝑡 [𝑠]+ 𝑎) 𝑏 (Equation 1.5)
Where,
Ppflight is points for each flight
mpayload is payload mass
a = 0 for a valid start + on-valid landing
a = 0.5 for a valid start + valid landing
b = 1 for a valid flight without crash
b = 0 for airplane losing parts or crashes or invalid start
The most significant rule change compared to previous editions is that the final flight
competition points correspond to the sum of the points of the two highest scored flights. The
payload prediction and time bonus is the same as in previous editions, see (Equation 1.2 and
Equation 1.3.).
In this edition, the aircraft must be able to perform the structure validation test before the
flight competition. The wing will be supported at two points located at each wing tip as seen
in Figure 1.1. The structural test consists of lifting by hand the fully loaded aircraft before each
flight and it must be able to withstand this load without failure. This test is to simulate a load
during the flight and it is done for safety reasons.

5
Figure 1.1 - Structural validation test [3].
Figure 1.2 - 100 m legs [3].
History of UBI’s Participation in the Air Cargo Challenge
UBI has participated in all editions of ACC, achieving an important record of results: 1st place
and 3rd in 2003, again 3rd in 2005 and 1st place in 2007 and 2011. In the last edition, 2015 ACC
the UBI team was fighting for victory but only got the 5th place after struggling with the
difficulty of the new pylon race flight task.
Many designs have been tested over successive ACC editions making UBI a competitive player
by the accumulated know-how. Various configurations (see Figure 1.3), structure types,
materials, concepts regarding various solutions have been tested. A peculiar methodology of

6
development has been established based in research and experimentation. By winning the 2007
and 2011 editions, UBI has organized the 2009 and 2013 ACC events, giving Akamodell Stuttgart
the opportunity to take the 1st place and host the last ACC, the 2015 edition. In 2015, the UBI
team got the 5th place in the competition with a payload of 10.2kg but only 10 legs against the
10kg and 14 legs of the winner, the team from Zagreb.

7
Figure 1.3-UBI teams ACC participant designs over the years
In 2017 the current Air Cargo Challenge is being organized by EUROAVIA Zagreb from University
of Zagreb. The University of Beira Interior is going to participate with two teams,

8
AERO@UBI_MARS and AERO@UBI_PVG, each with an aircraft of different configuration and
design philosophy and construction technology.
Objectives
The present dissertation shares the same basic objective as those of the ACC competition,
which is to stimulate student’s interest in aeronautics. But in particular, the present document
aims at:
- Describe the peculiar methodology of development that has been established based in
research and experimentation for UBI’s previous ACC participations;
- Share information for future teams;
- Contribute to the advancement of UAV development state of the art.
Overview
After this introductory chapter, in which the motivation, the essence of the Air Cargo Challenge
competition, the history of University of Beira Interior at the Air Cargo Challenge and the
objectives of this dissertation where described, the present dissertation is divided according to
the following structure:
Chapter 2 presents the literature review. Starting with a brief explanation of the
fundamental theory behind the design of wings and airfoils for Low Reynolds numbers,
the chapter closes with a state of the art presentation, were the most relevant
airplanes, in respect to the current 2017 ACC edition, to take part on the competition
are analysed.
Chapter 3 presents the methodology. It begins by describing the research that fed the
aircraft design. From the experiments regarding the propulsion system performance to
the aerodynamics, including the development of the airfoil and the Fowler flap, roll
control surfaces and the construction tests. The remainder of the Chapter is dedicated
to the conceptual, preliminary and detailed design. The final Section is a description
of the construction of the AERO@UBI_MARS Team aircraft for the ACC 2017.
Chapter 4 presents the results and respective analyses.
Chapter 5 concludes this dissertation with an overview of the work, main conclusions
and some recommendations for future work.
9
2 Literature Review
Basic Theory
2.1.1 Wing Design
The wing may be considered as the most important component of the airplane. Wing geometry,
with its basic characteristics, fundamentally span and mean chord, influences the aircraft
configuration. E.g., an airplane with high aspect ratio (high span and low mean wing chord) is
more prone to have the horizontal tail in front of the vertical tail and vice versa. The primary
function of the wing is to generate sufficient lift force (L). As consequences of generating lift,
there is a drag force (D) occurrence and normally a nose-down pitching moment (M). While it
is desired to maximize lift for a given dynamic pressure (0.5𝜌𝑉2, with 𝜌 being the air density
and 𝑉 the airspeed) the other two (drag and pitching moment) should be minimum for the sake
of the airplane performance. This is why the ration L/D is known as aerodynamic efficiency.
Wing pitching moment can be due to excessive wing sweep but for a straight wing it is mainly
due to the airfoil pitching moment coefficient [4].
Wing drag is typically the highest share of the airplane’s drag. Figure 2.1 shows the ACC2015
aircraft drag polar, it is seen that when going from a 2D airfoil to a 3D wing, the drag polar will
be the sum of the profile drag of the airfoil, 𝐶𝑑𝑝 and the miscellaneous parasite drag from the
rest of the aircraft and the induced drag, 𝐶𝐷𝑖. Hence the importance of minimizing profile drag
(i.e. pushing the profile drag curve to the left of the graph. Note that, as the lift coefficient
gets lower, the profile drag becomes an increasingly higher proportion of the overall drag. So,
the airfoil selection or design is an important stage of the aircraft development. For high aspect
ratio (𝐴 >> 6) the wing behaviour (Lift) is closer to that of a 2D airfoil due to small
tridimensional flow effect that is mostly concentrated on the wing tips.

10
Figure 2.1 – Estimated drag polar of UBI ACC2015 Aircraft, respective wing airfoil drag and total drag
minus the Induced Drag. Airfoil and aircraft maximum lift coefficients on the top.
The airplane’s performance is determined by the excess of thrust, considering its mass, along
the airspeed envelope. Excess thrust is the difference between the available propulsive thrust
and the required thrust to maintain level flight. The required thrust must be equal to the
airplane drag for permanent level flight as the lift must equal the weight in level flight.
In practice, the objective for any fixed wing aircraft design, i.e., any airplane, is to maximize
the aerodynamic efficiency, L/D, for any flight speed. Equation 2.1, gives the required thrust,
𝑇𝑅, for any airplane in level flight at constant airspeed. It is clear that the higher the
aerodynamic efficiency, the smaller the required energy per unit of travelled distance.
Equation 2.1 also shows that for a fixed available thrust versus airspeed, if you want to
maximize the weight and the speed at which you fly, improving 𝐿/𝐷 becomes fundamental in
increasing the payload and the cruise speed. The ACC flight competition score is directly
proportional to both payload and cruise speed.
𝑇𝑅 =𝑊
𝐿/𝐷 (Equation 2.1)
Where 𝑊 = 𝑚𝑔 is the aircraft’s weight, 𝑔 = 9.80665 𝑚/𝑠2and m is the mass.
An aerodynamic force coefficient is defined for the aerodynamic force dividing the force by the
dynamic pressure of the relative wind and also by the wing area. So, drag is given by Equation
2.2:
0.0
0.5
1.0
1.5
2.0
2.5
0.00 0.02 0.04 0.06 0.08 0.10 0.12 0.14 0.16
Cl,C
L
Cd,CD
Cdp CD-CDi
CDmisc
CDi
Cl
CL CD

11
𝐷 =1
2𝜌𝑉2𝑆𝐶𝐷 (Equation 2.2)
Where,
𝐶𝐷 = 𝐶𝑑𝑝 + 𝐶𝐷𝑚𝑖𝑠𝑐 + 𝐾𝐶𝐿2 (Equation 2.3)
With 𝐶𝐷𝑚𝑖𝑠𝑐 is the drag coefficient resulting from all other drag sources than the wing and 𝐾𝐶𝐿2
is the induced drag coefficient and K is referred to as induced drag factor and is modelled by
Equation 2.4.
𝐾 =1
𝜋𝐴𝑅𝑒 (Equation 2.4)
Where, 𝑒 is the Oswald factor that is a function of the wing sweep, dihedral and chord
distribution along the span, and the aspect ratio given by Equation 2.5:
𝐴𝑅 =𝑏2
𝑆 (Equation 2.5)
In order to maximize L/D, one must consider that its value is the same in the nondimensional
form: 𝐶𝐿/𝐶𝐷. So, if the minimum value of 𝐶𝐷 in reality tends to have a lower limit, the obvious
way of improving 𝐶𝐿/𝐶𝐷 is to increase the 𝐶𝐿 for the complete airspeed range. Considering that
the lower limit of the speed range is also defined, in general aviation by a maximum stall speed
limit but in ACC by the speed that can be reached in a 60 m take-off with a given mass and
propulsive system thrust, Equation 2.6 shows that to increase 𝐶𝐿, the wing loading, 𝑊/𝑆, also
has to be maximized. On the other hand, Equation 2.7 shows that the 𝐷 can increase
significantly with 𝐶𝐿 cancelling any gain in 𝐿/𝐷. So, according to Equation 2.8 the span loading
𝑊/𝑏 must be kept constant. I.e., a given weight must correspond to a constant span in the
effort of maximising 𝑊/𝑆. It becomes obvious that 𝑊/𝑆 must increase solelly by lowering the
mean chord raising the problem of wing structure strength and rigidity on one perspective and
also the problem of a lower Reynolds number effect in airfoil performance.
𝐶𝐿 =1
0.5𝜌𝑉2
𝑊
𝑆 (Equation 2.6)
𝐷𝑖 = 𝑊𝐾𝐶𝐿 (Equation 2.7)
𝐷𝑖 =1
0.5𝜌𝑉2𝜋𝑒(
𝑊
𝑏)
2
(Equation 2.8)

12
2.1.2 Low Reynolds Number Airfoils
The selection of an airfoil for the wing depends on the requirements of the airplane. For
instance, freighter aircraft design requirements are quite different from an aerobatic airplane
design objectives.
In general, the following are the criteria that some designers use to select an airfoil for the
wing [5]:
1. Maximum lift coefficient ( 𝐶𝑙max )
2. Lowest minimum drag coefficient ( 𝐶𝑑min )
3. Highest lift-to-drag ratio ((𝐶𝑙/𝐶𝑑)max)
4. Highest lift curve slope ( 𝐶𝑙αmax )
5. Lowest pitching moment coefficient ( 𝐶𝑚 )
In most of the cases, there is a compromise between these parameters and a weighting process,
because all design parameters have not the same importance.
The Reynolds number (Re) is a measure of the ratio of inertial forces order of magnitude to
viscous forces order of magnitude in a fluid flow. It is of great importance in the analysis of the
boundary layer flow. It is defined as Equation 2.9:
𝑅𝑒 =𝜌𝑉𝑐
𝜇 (Equation 2.9)
Where c is reference length (e.g. wing chord being analysed) in m,
V is the airspeed in m/s,
𝜌 is the air density in kg/m3,
𝜇 is the air absolute viscosity in Pa.s .
For the SI system at mean sea-level conditions: 𝜌0 = 1.225 𝑘𝑔. 𝑚−3 and 𝜇0 = 1.789 × 10⁻⁵ 𝑃𝑎. 𝑠,
the expression becomes:
𝑅𝑒 = 68500 𝑉𝑐 (Equation 2.10)
For the ACC UAVs, for their typical airspeed and medium aerodynamic chord, a low number
Reynolds (<500 000) will be present. However, for any given airplane in level flight, at constant
altitude, the product of Re times the square root of the lift coefficient remains constant.
𝑅𝑒√𝐶𝐿 = ki (Equation 2.11)
Where, 𝑘𝑖 is a constant value for a given aircraft mass, wing area and altitude.

13
Figure 2.2 shows the typical effect of Re number on an airfoil lift curve and drag polar. When
the Re increases, the drag polar typically gets wider see right side of Figure 2.2 because for
thick (t/c>0.06) airfoils, a higher Re delays the forward shift of the rear separation point with
increasing angle of attack (𝛼), ultimately delaying stall [5]. The slope and the intersection of
the linear region to horizontal and vertical axes are usually unaffected by the Reynolds number.
However, the higher the Reynolds number, the higher the stall angle of attack, 𝛼1, 𝛼2 and 𝛼3,
and respective maximum lift coefficients, 𝐶𝐿𝑚𝑎𝑥 1, 𝐶𝐿𝑚𝑎𝑥 2
and 𝐶𝐿𝑚𝑎𝑥 3 in a nonlinear behaviour.
This phenomena is more pronounced when the Re number gets below a given value known as
the critical Reynolds number of the airfoil. This effect is purely viscous but it can be estimated
with XFOIL [6][7] through XFLR5 [8].
Figure 2.2 - The effect of Re number on lift curve and drag polar, [4].
Mark Drela was the author of XFOIL program, in the 80’s with the objective of designing and
analysing airfoils with the condition of subsonic Mach number. The program can calculate the
pressure distribution, the lift, the drag in its pressure and friction parcels, the pitching moment
as well as the boundary layer transition position in upper and lower surfaces of the airfoil by
Computational Fluids Dynamics (CFD) with a viscous/inviscid two-dimensional panel method
formulation code. XFOIL has been widely validated and its results follow closely the
experimental data as shown in Figure 2.3. Nevertheless, as it is clear from the graph, XFOIL
seems to underestimate the drag coefficient by about 5%.

14
Figure 2.3 – XFOIL prediction performance (adapted from McArthur 2008), [9].
State of Art
In the present Section, the best ACC aircraft are described and analysed considering the
requirements of the current ACC2017 edition.
In 2011, the team from UBI was the winner of the competition. The idea was to lift the
maximum possible weight, but with a limitation on the Empty Weight (𝑊𝐸𝑀𝑃𝑇𝑌) of 1.800 kg. The
construction method (see Figure 2.4) was the most appropriated at the time. The tail surfaces
were a skin on frame structure made of balsa wood on the spars and ribs with foam cores. The
wing had a Carbon Fibre Reinforced Plastics (CFRP) tube spar with balsa wood ribs. The wing
interfaces were based on aeronautical grade aluminium alloy for the hard points and pultruded
CFRP. The wing surface was made from thermoplastic heat shrink film skin. The cargo bay was
made from balsa wood and pultruded CFRP rod reinforcements. The tail cone was made from
a CFRP tube from an off the shelf fishing rod. The payload in the cargo bay was locked in place
by a pultruded CFRP rod that passed through two carbon fibre rings on the bottom of the
fuselage side walls. The very light weight construction allowed for a very large wingspan with
high aspect ratio, which maximized wing surface while maintaining low drag. This allowed for
the lifting of a very large payload (by comparison with the other competitors). In 2011 the only
goal was to lift as much weight as possible.
CD

15
Figure 2.4 - UBI’s Winner Airplane 2011.
Figure 2.5 shows the ACC09 aircraft from AkaModell Stuttgart. It was one of the first aircraft
to use slotted Flaps because the regulations of 2009 limited the lifting surface to only 0.75𝑚2.
To lift the highest possible weight, one solution was to design an aircraft with high aspect ratio.
At the very high lift coefficient allowed by the slotted Flaps (see Figure 2.1), the drag of the
wings is mostly induced drag: 𝐶𝐷 ≈ 𝐶𝐷𝑖 and 𝐶𝐷𝑖 = 𝐾𝐶𝐿2, so by increasing the aspect ratio, K
decreases (see Equation 2.4) limiting the drag coefficient for those higher lift coefficients. This
maximizes excess power.
The slotted flaps maintain the airflow attached to the deflected flap upper surface, increasing
the lift compared to a conventional flap, and also allow the airflow on the main element of the
airfoil to remain attached for a longer distance along the upper surface, helping even further
to maximize the maximum lift coefficient. The aircraft seems to be built with CFRP in the
fuselage tube, Glass fibre reinforced plastic (GFRP) in the payload bay structural skin and
unidirectional CFRP stringers and transverse frames, and flexible skin on frame with heat shrink
film in balsa wood frame on the tail surfaces construction. The wings seem to be built from
bidirectional GFRP sandwich skins and unidirectional CFRP spar and the flaps from a sandwich
of solid foam core and lightweight bidirectional GFRP skins.
The design of the ACC2013 aircraft Stuttgart AkaModell was similar but the wing shells were
different. Figure 2.6 shows the construction method (materials) of the Stuttgart aircraft. The
wing had a foam core with an embedded wing spar. The core and the wing spar were then
covered with a layer of glass. On top of this glass layer, carbon roving was applied (in the wing
spar area) and then another layer of glass and carbon fibre spread tow was applied. The wing
is finished with a coat of paint.

16
Figure 2.5 - AkaModell Stuttgart 2009 [10].
Figure 2.6 – AkaModell Stuttgart 2013 wing Shells, [10].
The aircraft shown in Figure 2.7 was built by Euroavia Zagreb team for ACC 2015. It is entirely
made of bidirectional spread tow CFRP. They designed high relative chord slotted flaps to
maximize the maximum lift coefficient and increase the wing loading while achieving the 60m
take off run, [11]. To maximize the span fraction of the flaps, a rectangular wing planform was

17
used. The T tail was supported by a tail cone of apparent insufficient section as it wobbled
during flight from lack of rigidity. In the last round, mostly due to the skills of the pilot, the
Euroavia Zagreb team won the competition by lifting 10 kg and making 14 laps. They obtained
93.5 points in the oral presentation plus 370 points in the last flight, for a total of 463.5 points.
In the 2nd place was the team Born TU Lift from Munich with 436.25 points (see Figure 2.8) and
in 3rd place the EUROLIFTER team from Rzészow, Poland won with 379.15 (Figure 2.9).
For the conceptual design the winner of ACC15 used Simple Additive Weighting (SAW) method
[11]. This method implies the study of all possible configurations of the components of the
aircraft and then quantitatively evaluate these components in their positives and negative
aspects. In the end the final configuration corresponds to configurations with highest score.
Figure 2.7 – Euroavia Zagreb Team 2015, [11].
The Team Born TU Lift participated in ACC 2015, with a very competitive biplane (see Figure
2.8) but they did not win, even though they lifted the highest payload weight. Apparently after
a certain payload the more weight they lifted, the slower the airplane flew. Therefore, in their
last flight they lifted more weight but performed fewer laps giving the chance for the team
from Zagreb to do the last and victorious flight, going for first place. The airplane had a high
aspect ratio, but because the total wing area is divided by two planes and in 2015 there was a
wingspan limitation, each wing has a lower operating Reynolds number, leading to smaller
airfoil efficiency of the wings’ airfoil. On the other hand, they presented a remarkable full span
two element flap that morphed the airfoil camber to adjust from the take off to the fast legs
cruise and to the tight U turns high load factor flying condition at the end of each leg.

18
Figure 2.8 - Born TU Lift aircraft in ACC 2015, [12].
The Polish team got an honourable 3rd place with a high aspect ratio wing on the aircraft. Their
aircraft was more focused on speed, thus lifting less weight while being able to perform more
laps. The tail surfaces were skin on frame made out of the traditional balsa wood and heat
shrink film covering. See Figure 2.9.
Figure 2.9 - EUROLIFTER team from Rzeszow, [13].
In the 2015 Edition, as shown in Figure 2.10, the UBI aircraft construction was very similar to
the ACC 2011 winning airplane construction. The regulations limited the size of the aircraft to
fit in a square of 2.5m side length, so the maximum possible wingspan was the diagonal of that
square. The cargo bay was like the one of ACC 2011. In 2011, the payload was held in the cargo
bay by a pultruded CFRP tube that passed through two unidirectional CFRP rings hanging from

19
the sides on the rear of the cargo bay. In 2015, the payload was locked in place by the landing
gear itself which was placed on two hooks made from piano wire. These hooks design was
problematic; the hooks proved not to be sufficiently resistant: bending by the landing gear load
on them, which released the payload at the first take off in the competition. In subsequent
flights the payload was locked in place by tying it with tape to the cargo bay body. Both UBI
planes (ACC 2011 and ACC 2015) had a landing gear with only 2 wheels and a skid on the tail.
This solution is lighter and provides a centre of gravity position check, since the airplane is
balanced in the level position on the wheels, allowing a safe take off as long as the rudder has
sufficient directional control while the tail ski allows the steering. However, the aircraft must
gain sufficient speed for the rudder to become effective; this means that taking off with
crosswinds is nearly impossible and the initial acceleration must be negotiated by the pilot,
applying nose up command with the elevator and progressive throttle to prevent the drop of
the nose to the ground. The wings’ airfoil proved to be fundamental in the airplane’s ability to
lift 11.2 kg with a take-off in less than 60 meters in a non-valid flight. However, the aircraft
suffered from flutter when flying at top speed, which compromised its safety and limited the
speed in the legs. With the competition´s new focus on speed, the traditional full skin on frame
wings construction that UBI used to employ is no longer adequate.
Figure 2.10 – AERO@UBI aircraft from 2015 edition.

20
21
3 Methodology
Research
For a competition such as the Air Cargo Challenge, the only way to achieve victory is to present
the best concepts and solutions to all the details of the airplane. So, where it is possible to
choose or innovate, the choice or the search for the innovation must take place as much as
possible before the conceptual design stage of the aircraft development. So, an extensive
research takes place very early in the development process. A propulsion system
characterization took place in 2015 (Section 3.1.1) for the mandatory motor-propeller set to
establish the propulsive system theoretical model and feed the conceptual and preliminary
design calculations. Despite having already characterized the motor-propeller set at constant
supply voltage, a study of the performance of most affordable Hi-End LiPo batteries available
in the market was performed (Section 4.1).
3.1.1 Propulsion
3.1.1.1 Motor-propeller System Performance Testing
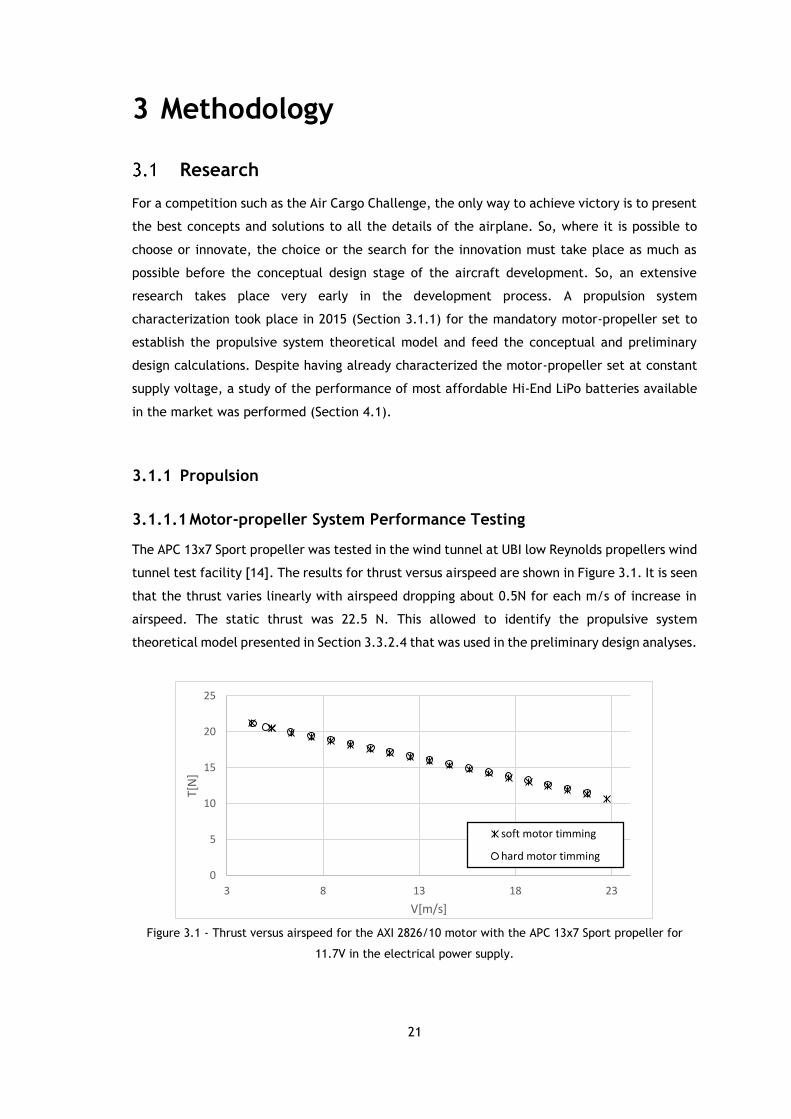
The APC 13x7 Sport propeller was tested in the wind tunnel at UBI low Reynolds propellers wind
tunnel test facility [14]. The results for thrust versus airspeed are shown in Figure 3.1. It is seen
that the thrust varies linearly with airspeed dropping about 0.5N for each m/s of increase in
airspeed. The static thrust was 22.5 N. This allowed to identify the propulsive system
theoretical model presented in Section 3.3.2.4 that was used in the preliminary design analyses.
Figure 3.1 - Thrust versus airspeed for the AXI 2826/10 motor with the APC 13x7 Sport propeller for
11.7V in the electrical power supply.
0
5
10
15
20
25
3 8 13 18 23
T[N
]
V[m/s]
soft motor timming
hard motor timming

22
3.1.1.2 Battery Testing and Selection
Batteries research is very important to maximise the performance of the propulsion system.
The propulsive system power is roughly proportional to the battery voltage squared. This is
explained by the fact that the electrical power is the product of current and the supply voltage.
The current is proportional to the supply voltage. So, the battery supply voltage is squared in
its correlation to the motor power. Therefore, the objective of this work was to identify the
best battery to use in the ACC17 airplane. It needed to have the lowest voltage drop for the
expected flight time. The battery temperature was expected to influence the battery voltage
drop at the full power current. A set of highest specification discharge rate candidate 3S LiPo
batteries were purchased and tested and a dedicated experimental setup was developed and
put in place. The equipment to test the batteries included: two Arduino Nano, one MOSFET,
three sensors of temperature, voltage and current, a power supply and one 3D printed box
made from ABS to withstand the batteries heating temperature.
In Figure 3.2, the battery test diagram showing the basic system is presented. One Arduino
Nano was used for the battery temperature versus time measurement, and the other Arduino
Nano was used to measure the current and voltage of the battery. Heated battery tests were
performed according to a purpose defined procedure, but using a temperature control device
based on a PID controller, to maintain constant temperature.
Additionally, the actual ACC airplane motor and propeller, the Electronic Speed Controller
(ESC) and R/C system were used to draw the battery current in realistic conditions. The test
consisted in doing various discharges with the motor at full throttle (simulating the full throttle
used in the competition flight). During each test, the time, voltage and current were measured.
The procedure was repeated for battery at both room temperature and heated temperature.
The results are presented in Section 4.1.

23
Figure 3.2 - Battery test experimental setup scheme.
3.1.2 Aerodynamics
3.1.2.1 Airfoil development
This part of the design affects the performance of the airplane as much as the propulsion system
alone, great attention to design the most suited airfoil was given throughout the airplane
development effort, starting from the beginning of the development works. Many purpose
design airfoils were created using XFOIL [6] via XFLR5 according to the reasoning of reference
[15] (mainly, delaying the transition for any lift coefficient throughout the lift curve) such that
the lift coefficient for minimum drag was just below 0.4, as the expected lift coefficient during
the flight competition legs was not expected to be any lower than this; the relative thickness
was kept greater than 10% for comfortable accommodation of a wing spar; the trailing edge
angle was sufficiently large to accommodate a Fowler flap and respective actuation mechanism;
it was to have the highest possible maximum lift coefficient and to have a highest possible
aerodynamic efficiency at a lift coefficient of about 1 for the airplane flying in tight turns, high
load factor conditions.
3.1.2.2 Fowler Flap development
Considering the requirement of the speed flight task implemented in ACC15 and the lack of
information concerning the use of high lift devices for low Reynolds number applications
(60,000<Re<500,000), an MSc dissertation work [16] was carried out where low Reynolds Fowler
flap design was studied based on the airfoil previously used in the airplanes of ACC11 and ACC15

24
UBI teams. For this flap design process, Computational Fluid Dynamics (CFD) Reynolds Averaged
Navier-Stokes (RANS) and Unsteady RANS (URANS) methods were used. In total, 16 different
combinations of flap gap, overlap, deflection angle and relative flap chord (see Figure 3.3 )
were simulated. The CFD calculations were performed using the k-ω SST turbulence model, for
a Reynolds number of 2×10⁵, with the open-source software OpenFOAM®. The computational
model used in the study was validated through a mesh independence analysis and benchmarking
tests without flap for the S1223 airfoil as well as the UBI_ACC11 airfoil. Although in certain
conditions a reasonable discrepancy with experimental results was verified, in these cases the
computational model was slightly pessimistic. Overall, the computational model was found to
be adequate for estimation of the maximum lift coefficient with the Fowler Flap resulting two
elements airfoils.
Figure 3.3 – Slot parameters, [17].
It was found that for the Fowler flaps configurations that were tested, the UBI_ACC2011 airfoil
performed better with 25% chord flap with a 2.5% gap, 2% overlap and 30° flap deflection was
the one with the most favourable performance, generating a 𝐶𝑙𝑚𝑎𝑥 of 2.96 for a 𝐶𝑑 of 0.081.
With this flap, the aerodynamic efficiency of the basic airfoil was not damaged by the flap and
even improved, with the (𝐿/𝐷)𝑚𝑎𝑥 reaching a value of 44 with the flap extended versus the
original airfoil (𝐿/𝐷)𝑚𝑎𝑥 of 37 for the same lift coefficient. As expected, the absolute value of
𝐶𝑚 greatly increased, going from a value of -0.251 without flap to -0.694 with flap.
3.1.2.3 Flight Testing
3.1.2.3.1 Fowler Flap Effectiveness
A prototype glider (see Figure 3.4) was tested to estimate the performance of a Fowler type
flap. The Fowler flap on this glider was connected to the wing, and fixed in place, through
balsa wood pieces. This flap did not have an extension/retraction mechanism. The glider was
hand launched and performed a slope soaring flight. The data that was collected showed that
with the Fowler flap, a 𝐶𝐿𝑚𝑎𝑥 or around 2.4 could be reached for the 3D glider wing. This
indicated a 2D Clmax of 2.95 for the wing geometry in use. The glider was instrumented with an
Flap angle
Slot overlap
Slot gap

25
Arduino Nano, GPS static pressure and temperature sensor and differential pressure sensor.
Figure 3.4 and Figure 3.5 show the glider being tested and the Fowler flap.
Figure 3.4 - Glider prototype for the Fowler flap flight-testing.
3.1.2.3.2 Roll Control with Spoilers
The usual design philosophy of UBI is to use rudder inputs for directional and roll control. This
was usually done, among other factors, to allow the wing to remain “clean” (without the
interference drag of the gap between ailerons and wing). It also allowed a lower weight since
fewer servos are required.
However, the ACC competition now includes a flight task where the ability to manoeuvre the
aircraft quickly and precisely is essential. The experience in the ACC 2015 has shown that this
requirement was not easily met with rudder inputs alone.
To this end, tests were performed with the same glider of Section 3.1.2.3.1. to check different
means of roll control. First, a new concept was tested with ailerons of just 3% of the wing chord
(percentage of chord selected based on XFLR5). During the slope soaring flight test, this concept
proved inadequate; the pilot stated that he had little authority over the aircraft and response
time was too long.
After this, the use of roll spoilers and ailerons was tested. The major advantage of using spoilers
is that these prevent the onset of adverse yaw by increasing parasitic drag on the wing that
drops (compensating the increase in induced drag on the wing that is rising). This concept had
satisfactory roll control authority and was eventually selected for the final aircraft.

26
Figure 3.5 - Glider prototype using spoilers in the Fowler flap wings to achieve roll control.
3.1.3 Construction Technology Preliminary Testing
3.1.3.1 Wing panels
To make a construction test of the wing panel, a 45cm span wing panel was laminated with
epoxy and two layers of unidirectional carbon fibre cloth with 30g/ m2 in a ±45º orientation on
the upper and lower surface of a solid pultruded polystyrene foam (EPS) core that was cut in
the 4-axis CNC hot wire cutting machine. The lamination was cured in a vacuum envelope using
0.35mm Mylar sheets in contact with the laminated surfaces to improve the surface quality
(Figure 3.6a)). Then, after four of these panels were built, they were joined together with a
mix of hollow glass microballoons and epoxy, with a consistency like peanut butter and the
interface was reinforced using two layers of the same carbon cloth arrangement (Figure 3.6 b).
The resulting 1.8m span wing was tested for flexural strength (Figure 3.6 c) and d)).
With a total weight of 9.5kg (the weight of a Lead Acid battery used as load and a lead plate
weight) (Figure 3.6 d), the wing structure failed. The two layer CFRP stressed skins wing with
a foam core was not enough to handle the flexural load expected for the ACC17 airplane. A
possible solution would be to use a wing spar, but this was not possible to do without deforming
the wing airfoil profile. It was, thus, decided to proceed with moulds technology to build the
wings (Section 3.5).

27
Figure 3.6 – Construction test of the wing panel, where in a) is one panel laminated, b) are two joined
panels, in c) 1.8m of span are ready to construction test represented in d) with a 7kg battery.
3.1.3.2 Wing Panels Interfaces
One of the requirements of the ACC, is for the aircraft to fit inside a box with specific
dimensions. On the other hand, the aircraft must pass on the structural test defined in the
regulations (See Section 1.2). Therefore, it is necessary to define the structural interface
between the wing panels, i.e.: how one wing panel is attached to the next wing panel. These
must be light but sufficiently strong to resist the bending loads to which the wings are
subjected.
One of the main aspects taken into consideration when developing the interfaces was to
guarantee that they were common to all the panels connections to ensure that in the case one
of these interfaces would be broken by a crash during the competition, it could be replaced
taking a minimum of spare parts. The second aspect was the structural strength of the
assembly. Several interface design concepts and structural tests were conducted to ensure the
strength of the panels connection. To conduct the test, the interface part was loaded with the
expected bending moment while connecting to two metal bars. A heavy battery was used to

28
bend load the connection. The value of the resisting bending moment was measured by a scale
that was indicating how much weight of the load battery was being supported thus relieving
the loading from the connection. Figure 3.7 shows the test just described. Several tests were
performed until the interfaces had the strength.
Figure 3.7 – Interface strength test.
3.1.4 Zagreb Region Mean Wind Speed
Research [18] indicated a mean wind speed of 1.9m/s at the assumed default height of 10m in
the region of Zagreb Airfield. This wind speed was accounted for the airplane preliminary design
because a take-off in null wind condition is, in fact, not the general case. Table 3.1 shows the
collected data.

29
Table 3.1 – Weather forecast in Zagreb region
Conceptual Design
The first stage of conceptual design is very important. Our professor in charge says:
“Only the best concept can result in the best optimum design”
Therefore, optimization is useless if performed on the wrong concepts. Concepts include the
aircraft configuration, airfoil characteristics, building materials and construction techniques,
etc. Conceptual design is the key moment of creation. To start the creative process, the
objectives and requirements are analysed. Fundamental theory is reviewed and the state of
the art is analysed, a basic theoretical model is established to quantify the performance of a
possible concept. At the same time, materials with their impact in the aircraft geometry and
their corresponding building costs and technology are surveyed. E.g.: full CFRP allows wings
with smaller thickness or higher aspect ratio wings and composite materials allow double
curvatures to be easily built.
The aircraft design will be defined by the competition objective, to carry the maximum possible
payload while reaching the maximum average airspeed in the flight task and by the regulatory
requirements and restrictions. The airplane development methodology used by our UBI teams
over successive ACC editions relies on a meticulous analysis of the requirements to find
limitations, risks and opportunity factors that can greatly affect the conceptual design, in not
only the aircraft configuration, but also the type of structure, materials, etc.. Therefore,
calculations are performed from the beginning of the design cycle to better define the problem
in the light of the requirements. E.g. it is useless to equate a pusher-ducted propeller aircraft
configuration if, from the beginning, a weight and balance calculation points out that the
payload must be placed at a far forward position from the desired centre of gravity location,
thus, making the unloaded aircraft to have an unacceptable rearward center of gravity (cg)
T[K] p[Pa] ρ[kg/m^3] μ[Pa/s] a[m/s] T/T_0 p/p_0 ρ/ρ_0 μ/μ_0 a/a_0
287.37 99891.70 1.211 1.81E-05 339.83 0.997293 0.985854 0.98853 0.997849 0.998646
Pressure Humidity
Pa %
Min. Av. Max. Av. Gust Av. Max. Av.
293.15 300.15 303.15 101730 2.995 1.922 2.816 67
292.15 298.15 301.15 101430 2.593 1.609 2.503 77
293.15 299.15 301.15 101540 2.190 1.296 2.101 81
293.15 299.15 302.15 101690 2.414 1.520 2.190 77
294.15 301.15 305.15 101620 2.906 1.788 2.593 61
292.15 298.15 301.15 101420 2.816 1.699 2.682 80
298.15 303.15 307.15 101560 4.292 2.682 4.202 55
295.15 300.15 304.15 101870 3.979 2.503 3.889 64
293.9 299.9 303.15 101608 3.023 1.878 2.872 70.25
2015
2016
AVERAGE
2009
2010
2011
2012
2013
2014
August Weather - 7km from Zagreb Lucko Airfield [CWOP - EW6370]
Latitude: 45.7669° ||| Longitude: 15.8486° ||| Altitude: 119 - 122 meters
Year
Temperature Wind Speed
m/sK

30
position and unsafe to fly. With the project spiralling towards the optimum objective, the best
concepts appear naturally, without the subjectivity of the traditional trade studies.
Besides the competition regulations, any ACC UAV is a RC model aircraft. Therefore, in the
present case, it must comply with the following basic restrictions, imposed by the Portuguese
law, [19]:
R1 - Maximum Flying Mass with fuel: 25kg – Calculations for a conventional configuration fixed
wing aircraft with the theoretical models described in Section 3.3.2, considering the propulsive
system and requirements R11 (propeller), R12 (battery voltage), R14 (current), R15 (no
reduction gear) and R16 (motor) - Described below, gave a rough estimative of the maximum
take-off weight that could be flown in the limit as a function of the span with optimized wings
mean chord. Figure 3.8 shows the results per these limitations, if the span is higher than about
3.3 m, there could be a chance that the aircraft weight had to be limited to 25kg by this legal
requirement. These results do not account for the need to take off in 60m. It can be
immediately concluded that the wingspan is the limiting factor for maximizing the airborne
weight with the propulsive power involved. On the other hand, the take-roll length limit also
limits the lift-off airspeed. Our team usually considers that headwind is present. Section 3.1.4
Zagreb Region Mean Wind Speed deals with getting rough estimate of how much wind to expect
at Zagreb in August. However, it seems that Zagreb is much less windy than Stuttgart and Ota.
Calculations in Section 3.3.2.2 also show the take-off in 60m aircraft weight limit is lower than
the flying weight limit. This 2017 edition does not limit the span but for the flight task, the
aircraft must handle effectively: with good roll rates. Additionally, the structural test is
demanding (See Figure 1.1). So, the maximum span is expected from the beginning to not
surpass the 4.5m value.

31
Figure 3.8 - Maximum flying weight with designs of chord optimized for maximum flying weight as
function of span (above) and Maximum Take Off weight for the 60m TO run. Designs using a chord
optimized for maximum flying weight as function of span considering the use of Fowler Flap (𝑪𝑳 is 2.51
for b=3m increasing to 2.71 for 5m span). A head wind of 1.9 m/s was considered (See Section 3.1.4).
R2 - Maximum Area of Lift Surfaces: 500dm2 – With the results of calculations described in
Section 3.3.2, it is seen that the wing chords involved, even for a 5m span result in a wings
surface of about 165 dm2, when optimized for minimum power required to fly. This is well
below the 500dm2 limit.
R3 - Maximum Wing Loading: 250g/dm2 - Per this limiting requirement, if the aircraft were to
be optimized for the maximum flying weight, the span would have to be greater than about
3.25m. This is a possibility but the take-off requirement and the need for an airplane that is
flying with a comfortable excess power for agile turns during the speed task, point towards a
much lower wing loading than the limit of 250g/dm2.
R4 - Piston Engine Maximum C.C.: 250cm3 – Not applicable requirements R13 mandates an
electrical propulsion set.
R5 - Maximum Voltage for Electric Engines (open circuit): 72Volt. – The ACC 2017 regulation
requirement that regards the batteries fits well within this limit (see requirement R13).
On top of these general restrictions the requirements imposed by this year’s competition
regulations were added:
0
50
100
150
200
250
300
350
400
3 3.5 4 4.5 5
MTO
W
b [m]

32
R6 - No rotary wing. – A fixed wing aircraft concept is used.
R7 - Not lighter than air. – Although this requirement seems not to prohibit the filling of some
internal volume with a lighter than air gas, e.g. the wing filled with helium, it was decided for
the sake of a fair play competition spirit that this concept is not put into consideration.
R8 - No external assisted take-off power. No external assisted take-off power was used.
R9 - Maximum Take-off Distance: 60 m. – In a 60 m take-off run, limited energy can be supplied
by the propulsive system. In fact, only 60m versus mean take-off thrust, taking all the losses
that rolling friction and drag account for, the total kinetic energy that can be achieved is the
limiting factor. If one wants to increase the mass, the take-off speed square, 𝑉𝑡𝑜2 , must decrease
to do so. That is the same as increasing the lift coefficient at take-off because it is inversely
proportional to 𝑉𝑡𝑜2 . Using a wing airfoil with the highest possible lift coefficient is the best way
to go. A single element airfoil, for the minimum Reynolds number involved gets to a maximum
lift coefficient of about 2.3. Since the present flight task demands a fast cruise and
manoeuvring speed, an extra interest in increasing the wing loading is present. Therefore, a
Multi-element airfoil was investigated (see Section 3.1.2). Having this in mind and analysing
the requirement of 60m take-off for the set of designs corresponding to Figure 4.19 the
calculations for the maximum take-off weight that satisfy the 60m, with zero head wind
condition, show that this take-off requirement is a stronger limiting factor than the propulsive
power available to fly. At the same time, confirms the span as a determining result factor. For
the same conditions, the higher span aircraft will get the higher take-off weight. The highest
possible span aircraft is a concept to go to and the span limit will be dictated by the empty
weight function of span and by the flying qualities of the aircraft since a higher span lowers the
roll rate, hence the turns at the ends of the 100m straight legs may be too sluggish with a 5m
span aircraft.
One can notice also that the presence of head wind during take-off leads to a higher take-off
weight and that this improvement gets more important with increasing span. Headwind during
initial climb will also improve the climb angle, an important safety feature. Head wind is the
general case not an exceptional one and is certainly a factor to consider. Note that these results
correspond to designs with wings chord optimized for the previous condition of maximum flying
weight for a given span. In this case the result would be designs that if with the weight limited
to take-off in 60 m would climb at the fastest rate or would be able to sustain level flight with
the maximum load factor during a turn. One important idea that comes out of the take-off
limiting factor is that the propulsive system must be optimized to the maximum mean thrust
during the take-off run. In our case, the propulsive set motor-propeller is prescribed so there

33
is not much to do for improving the take-off mean thrust. Even if the propeller were ducted,
the gain would be marginal since the pitch is prescribed at 7 inches.
R10 – The aircraft must accomplish 10 legs of 100m length with 180 degree turns after each
leg – his requirement mandates for an endurance of about 2 minutes for the 1000m course for
an average speed of about 10m/s (not considering the length of the turn trajectories),
𝑉 =∆𝑥
𝑡=
10 × 100 [𝑚]
2 × 60 [𝑠]≈ 8.3 𝑚. 𝑠−1 (Equation 3.1)
considering that, the turning trajectories are about the same order of lengths as the legs and
that the aircraft will have a mean airspeed lower than 20m/s. This means that a minimum
capacity of 1.5Ah must be used in the propulsion battery.
𝐶𝑀𝑖𝑛𝐶𝑎𝑝𝐵𝑎𝑡𝑡𝑒𝑟𝑦= 𝐴 × ∆𝑡 = 45 × (
2
60) = 1.5 𝐴ℎ (Equation 3.2)
where 𝐶𝑀𝑖𝑛𝐶𝑎𝑝𝐵𝑎𝑡𝑡𝑒𝑟𝑦corresponds to the minimum capacity used in the propulsion battery, A is
current and ∆𝑡 corresponds to time in hours.
For the safe side, the capacity should be much higher. When a battery is almost completely
discharged, there is a marked voltage drop. If the discharge process proceeds beyond the
threshold voltage (if a full discharge occurs) the battery elements may be damaged, which
would radically shorten the battery life. Even so, it was decided to not drain more than 70% of
the battery charge per flight because it is a risk the battery condition. So, a battery capacity
greater than 3Ah will be used.
𝐶𝑀𝑖𝑛𝐶𝑎𝑝𝐵𝑎𝑡𝑡𝑒𝑟𝑦= 1.5/0.70 = 2.55 ≈ 3 𝐴ℎ (Equation 3.3)
This requirement draws the attention to the need of being able to climb safely, to sustain flight
at a load factor n>1 for banked flight during turns. For completing tight turns, a minimum of
30º bank turn is adequate for a low turning radius. In this case, 𝑛 ≈ 1.155 and a reserve excess
power of 20% the required power is adopted to maintain the aircraft safe handling during flight
speed task.
R11 – Use of an unmodified APC 13x7 Sport propeller. – It is mandatory to use a propeller
with a 13 cm of diameter and 7 cm of pitch. This requirement together with R12, R15 and R16,
prescribes the available thrust versus airspeed propulsion curve. This performance was
measured in the wind tunnel and described in Section 3.1.1.

34
R12 - Electric propulsion with Lithium based secondary cells with a series of up to three
elements. – This corresponds to a nominal voltage range of 6.4 to 7.4V, in series of 2 elements
pack, or 9.6 to 11,1V, in a series of three elements, with the lower values corresponding to
LiFe and the higher to Li-Ion and LiPo. To maximize propeller thrust at take-off and propulsive
power during climb, assuming constant motor efficiency, the higher electrical power should be
used. This means 40A current, from requirement R16, at the highest possible voltage. The LiPo
batteries have higher voltage per cell for the same battery weight. So, a series of three Lipo
cells will be used.
R13 – No prescribed minimum capacity for the propulsion battery.
R14 - Minimum battery discharge current rating of 45 A. – R15 and R16 are not limiting
because, for the sake of maximum power, the current rating, proportional to the capacity
should be as high as possible if the excess battery weigh will not reduce the payload more than
it increases the relative voltage gain from a bigger capacity battery. Furthermore, a higher
voltage, per the motor model described in section 3.3.2.4., increases the motor peak efficiency
and, at the same time, makes the peak efficiency operating point occur at a higher current
closer to the maximum 45A working condition. In Section 3.1.1.2 the battery capacity, weight
and voltage under 45A discharge are experimentally investigated.
R15 - No reduction between the motor shaft and the propeller, i.e. propeller rpm equal to
motor rpm.
R16 - Motor: Model Motors - AXI 2826/10. – Motor characteristics: Kv=920 rpm/V,
Ri=42mIo=1.7A, m=181g.
If the propeller was ducted, an increased take-off thrust could be achieved. This concept brings
a mechanical complexity and losses as well as weight. The use of a duct was rejected from the
start because of the weight, but, above all, the possibility of damage during the flight
competition. A broken propeller issue is easy to repair in the field.
R17 – The aircraft must be able to perform the structure validation test: being supported
by its wingtips. – This requirement demands for a very robust wing spar construction. Especially
if one considers that, the speed flight task legs will be performed in a low lift coefficient. Thus,
requiring an airfoil that has it minimum drag coefficient at low lift coefficients. Such airfoil is
usually a small relative thickness one. Increasing the chord could be a solution for a strong and
light wing spar but increases the parasite drag and specially the induced drag just after lift-off
for a fixed span. This induced drag after lift-off is given by Equation 2.7.

35
According to our experimental research performed on the propulsion set (See Section 3.1.1),
the maximum thrust at lift off is about 18N at about 8m/s. In the lift off drag is about 1N. With
Equation 2.7 and a flying weight of about 160N, 𝐾 must be smaller than 0.05 for a lift coefficient
of approximately three. According to the Fowler Flap development research study (Section
3.1.2.2), 𝐾𝑝 is about 0.01. So, with Equation 2.4 with 𝐾𝑖 = 0.04 , 𝐴𝑅 must be greater than eight.
For a span limit of 4.5m, the mean geometrical chord should be smaller than 0.56m.
R18 - Maximum landing runway for the initial touchdown: 120 m – If the glide ratio is high,
shallow final approach may be expected, making a precision landing a hard task. It may be
necessary to use the propeller as a speed brake by setting the motor ESC brake OFF.
R19 - The payload distribution must not affect the stability characteristics. – The ratio of
payload to empty weight is so high, about 5, that the payload must be almost coincident with
the desired centre of gravity for the best compromise of stability and performance.
R20 - The payload material is steel in the form of plates. (Density of about 7800kg/m3)
R21 - Prescribed payload volume: 160x80x80 (minimum height) mm3. – This requirement,
together with the previous R20 and the results for the payload call for a check whether a 80mm
stack of steel plates can reach the payload value. Checking for the corresponding payload value,
considering R20, an increase of the payload compartment height from 80mm to 140mm was
chosen in order to be able to carry a 13kg payload.
Figure 3.9 – Payload Volume
R22 – No auto pilot or control assistance systems. – I.e. Piloted manually via remote control.
So, Good handling and stability must be achieved with the design. Thus, the centre of gravity
position must be set for comfortable R/C piloting not for top performance.

36
A comfortable climb angle and a broad speed envelope for the fully loaded aircraft is an
objective to keep a safe piloting condition and to obtain an agile aircraft for the speed flight
task. In the speed flight task, the turns will be performed in dangerous flight conditions. A wing
tip stall while turning near the ground can result in the loss of the aircraft. Thus, some extra
care must be taken to ensure that the wing tips stall well after the wings’ roots. This will be
accomplished by washout and extra chord at the wing tips than the optimal elliptical chord
distribution.
R23 - The aircraft must be loaded and ready for take-off in the least possible time. – Each 5
second will reduce 1 point to the total of 24 points maximum readiness bonus.
A fast payload loading, securing and closure in the aircraft must be conceived. One concept is
to load the cargo bay outside the aircraft and supported in a table, then, the aircraft is fitted
to the cargo bay as the later rests in the supporting table as in a previously used Aero@UBI ACC
airplane design. That concept was used in ACC 2007 for the first time and proved well again in
ACC 2011, where the body floor closure was supporting the cargo bay and the landing gear.
(Figure 3.11).
R24 - Aircraft must fit in a transportation box that may not exceed the inside dimensions
of 1000x500x400 mm3. – Considering the possible 4.5m span, the aircraft shall have interfaces
in the airframe, at least between wing panels. Interfaces are always an extra and significant
structural weight. In our case, this mandates the use of 5 wing panels.
Figure 3.10 - Inside dimensions of the transportation box.
R25 – An Rx battery pack with C > 600mAh is mandatory. – A LiFeO4 2S 700mAh receiver
battery will be used. It has a mass of 55g.

37
Figure 3.11 - Cargo Bay attached to the body floor in UBI's ACC 2007 Pegasus Team winner aircraft.
UBI has a long tradition in the Air Cargo competition. Ever since it started participating in the
very first edition in 2003, UBI has a bit of everything: from radical experimental configurations,
to more traditional ones. Although some of these experimental configurations were successful,
others were not. Meanwhile the more conventional, sound configurations have usually had good
results. Thus, the starting point for this year´s competition was our 2015 aircraft configuration.
From this, it was decided that the ACC2017 aircraft would have the same general configuration
of 2011 and 2015 aircraft with the difference that the tail cone would extend from the lowered
payload body because the extended Fowler flap wing will have a small angle of attack for
maximum lift coefficient of about 8 degrees. The parasol lifting surface concept.
Figure 3.14 shows the general configuration and main concepts adopted. A conventional tail
surfaces configuration is preferred. The reasoning is simple. It does not suffer from the very
low Re number problem found in a canard configuration at these airplane model size. Besides
this, a canard cannot profit from the maximum lift coefficient of its main lifting surface, the
wings. The canard must stall safely before the wing. It does not have the critical fore plane and
after plane that the tandem wings configurations. It does not have such a low wing Re number
as the multiplanes. A cruciform tail with the horizontal tail in the front of the vertical tail will
be used. This design gives low tail boom torsion loads and low interference drag between the
tail surfaces. The reason the vertical tail rests behind the horizontal tail is that the aspect ratio
of the wing is high as foreseen by early design calculations. At the same time, the tail boom
flexibility will act upon a smaller horizontal tail arm length to limit the dangerous change in
the horizontal tail incidence due to tail cone flexibility.

38
The parasol wing configuration was chosen because of two main factors, one is that in the event
of a crash the wings can separate from the cargo bay (where the payload and kinetic energy is
concentrated) and the other factor is due to a Fowler flap action, because the connection of
the right and left wing flaps allows an aerodynamic that is less disturbed by the presence of
the cargo bay and demands a simpler actuation mechanism.
The wings will have, besides of taper, the geometric washout that optimizes the lift distribution
at the design initial climb speed and prevents tip stall occurrence. An approximation to
elliptical wing planform will be used to reduce the induced drag [20] but not reach a high
torsion moment at the root. A slight negative wing pitching deflection proportional do the lift
magnitude was considered a necessity to keep a bending load stable structure.
Weight and balance dictates that the motor rests well in front of the wing in a puller
configuration. The fuselage consists of a CFRP tube for the motor, in front of the wings. An
interface of this motor nose extension with the wings is used to allow transportation in the box
according to the regulations. A lowered cargo compartment body is used as a way of raising the
wings position to profit from the higher wind to shorten the take-off distance and help
preventing wing tip strikes on the ground. The main landing gear will be attached to the cargo
compartment. Three pylons will connect the lower body to the wing.
Regarding stability and control, pitch control is achieved through a flying tail elevator to
maximize control authority with the 30% chord Fowler flaps (as found necessary in the early
flight testing) while keeping the corresponding parasite drag at a minimum by the absence of
a horizontal stabilizer to elevator gap. Roll control is achieved through rudder, ailerons and
spoilers (see Section 3.1.2.3). Looking at the qualitative influence of the static stability
proportions on the dynamic stability shown in Figure 3.12 and in Figure 3.13, one notices that
since the wing has a negative speed stability because of the airfoil strong negative pitching
moment, to minimize the risk of an unstable divergence dive, it is considered prudent to design
for a negative lift contribution in the horizontal tail such that the horizontal tail cancels the
wing negative speed stability. At the same time, to limit the performance penalty and prevent
excessive downward deflection of the flexible tail boom, this negative lift must be kept in the
smallest possible amount. Off course, this rationale can only be sustained with a precise centre
of gravity location. The landing gear plays an important role for this matter. It is located such
that the loaded aircraft will balance on the main wheels. So, a nose up attitude on the ground:
the aircraft falls on its tail. A nose down attitude and the nose will remain stable on the ground.
Another purpose of this concept is to minimize the load on the horizontal tail needed for
rotation during take-off, minimizing the corresponding loss of lift. Regarding the directional
stability, Figure 3.123 suggests that even with a high positive dihedral effect due to high wing

39
and raised wing tips (like winglets), the static directional stability can remain with a modest
value.
Figure 3.12 - Typical Longitudinal Stability Map, [21]
Figure 3.13 - Dutch Roll Action (Slightly Unstable), [21]
Regarding the lateral stability and control, initially it was decided not to use ailerons. Such
practice has long been UBI philosophy of design for the Air Cargo Competitions because ailerons
are prone to wing tip stall while prematurely taking off when trying to comply with the 60m
run limit. However, given the different nature of the pylon racing, the need for installation of
ailerons did arise. This was because early research testing glider prototypes in the mountain
slopes revealed that the airplane did not have sufficient control authority for fast turns.

40
Figure 3.14 - General configuration and main concepts adopted.
3.2.1 Structural Design
To start an initial study to insure a high torsional stiffness because of the massive pitching moment,
because of the implemented 0.3𝑐 and 0.85𝑏 Fowler flaps, the wing structure concept is based in 30
kg/m3 EPS foam cores sandwich panels with CFRP skins, corresponding to the wing upper and lower
surface. Each skin uses two ±30º orientation layers of unidirectional 30g/m2 high strength carbon fiber in
epoxy matrix with an outer ±45º bidirectional 30g/m2 glass fibre. Unidirectional high strength carbon
fibre roving reinforces the maximum thickness region in the upper and lower wing surface to resist the
structural wing-bending test. Close to the wing root, an internal C shaped ±45º bidirectional high
strength is joining those unidirectional spar caps. Figure 3.15 shows this structural concept. This initial
structural concept was later modified on the final aircraft. The final concept used is shown in
Figure 3.16.
Figure 3.15 – Generic Wing section structure.
sandwich skins wing
film covered balsa ribs and spar tail surfaces
Fishing rod CFRP fuselage
Nylon wheels with roller
bearing connected with CFRP
solid rod
30% chord, 84% span
Fowler flaps
Roll control
spoilers
solid foam core CFRP/GFRP skin
C profile CFRP shear web
CFRP spar caps

41
Our landing gear, just like our 2011 aircraft, will consist of only 2 wheels connect through a
unidirectional CFRP solid rod. Fairings made from simple foam and or iron on film will be made
to reduce parasitic drag from the circular shaped rod. The wheels shall be large enough to
reduce rolling resistance. In the rudder, a skid will provide limited directional control.
This solution is extremely lightweight and provides very low rolling resistance. One
disadvantage though is that during take-off, full power cannot be applied immediately from
the start. The aircraft must start rolling slowly and only then can full power be applied,
otherwise the static friction of the wheel is so large that a full power setting will generate a
nose down moment causing the aircraft to tip face first on its nose. Such was the case during
the first takeoff in Stuttgart in 2011.
The solution used was shown in
Figure 3.16, the upper and lower skins of the wing structure concept is in Balsa Wood 1 mm
thickness core sandwich panel with CFRP bidirectional ±45º of 80 𝑔/𝑚2 skins. The main and
unique spar, 0.3c, is in unidirectional Carbon Fiber.
Figure 3.16 – Wing Section structure used in ACC17.
Preliminary Design
3.3.1 Design Variables
For the design process, a Microsoft Excel spreadsheet was implemented to incorporate the
formulation for the aerodynamic, flight task performance, take-off performance, structure
weight, propulsion and International Standard Atmosphere (ISA) models. This spreadsheet uses
CG position (ℎ𝑐𝑔), horizontal tail arm (ℎℎ), horizontal tail area (𝑆ℎ), vertical tail arm (ℎ𝑣),
vertical tail area (𝑆𝑣), and 𝐶𝐿. Most importantly, the chord (c), span (b), and mass (m) are used
in the parametric study.
Balsa wood sandwich core CFRP upper skin sandwich
CFRP spar caps
hollow CFRP lower skin Balsa wood
expansive polyurethane
foam

42
3.3.2 Theoretical Models
3.3.2.1 Airplane Aerodynamics Model
Equation 3.4 is used to calculate the wing lift coefficient by applying a correction factor to the
airfoil lift coefficient.
𝐶𝐿𝑚𝑎𝑥 = 𝐶𝑙 𝑚𝑎𝑥 𝑅𝑒𝑅𝑒𝑓
(𝑅𝑒𝐶𝑙𝑟𝑒𝑓
𝑅𝑒)
𝐸𝑥𝑝𝑅𝑒
1+
𝐶𝑙𝑚𝑎𝑥 𝑅𝑒𝑅𝑒𝑓(
𝑅𝑒𝐶𝑙𝑟𝑒𝑓𝑅𝑒
)
𝐸𝑥𝑝𝑅𝑒
𝜋𝑒𝐴𝑅
+ 𝐶𝐿ℎ𝑆ℎ
𝑆 ⇐ 𝑅𝑒 < 𝑅𝑒𝑅𝑒𝑓
(Equation 3.4)
𝐶𝐿𝑚𝑎𝑥 =𝐶𝑙𝑚𝑎𝑥 𝑅𝑒𝑅𝑒𝑓
1+ 𝐶𝑙𝑚𝑎𝑥 𝑅𝑒𝑅𝑒𝑓
𝜋𝑒𝐴𝑅
+ 𝐶𝐿ℎ𝑆ℎ
𝑆 ⇐ 𝑅𝑒 ≥ 𝑅𝑒𝑅𝑒𝑓
Just like 𝐶𝐿, 𝐶𝐷 also has a profile correction factor to the Reynolds number of 1.5 as given in
equation 3.5.
𝐶𝐷 =𝐶𝑙
𝐶𝑙𝐶𝑑
(300000
𝑅𝑒√𝐶𝑙)
1.5
(Equation 3.5)
The theoretical model used to estimate the performance (the required thrust and power in
level flight and airspeed envelope at sea level) consists of the following equations (all in the
International System of Units):
𝐿 = 𝑊 =1
2𝜌𝑉∞
2𝐶𝐿𝑆 (Equation 3.6)
Where,
ρ is the ISA (International Standard Atmosphere) air density;
V∞ is the airspeed;
S is the reference area;
𝐶𝐿 is the aircraft lift coefficient;
𝐶𝐿 =𝑆ℎ
𝑆𝐶𝐿ℎ
+ 𝐶𝐿𝑊 (Equation 3.7)
With the subscript h denoting horizontal tail and w for wings.
For the wings lift coefficient:
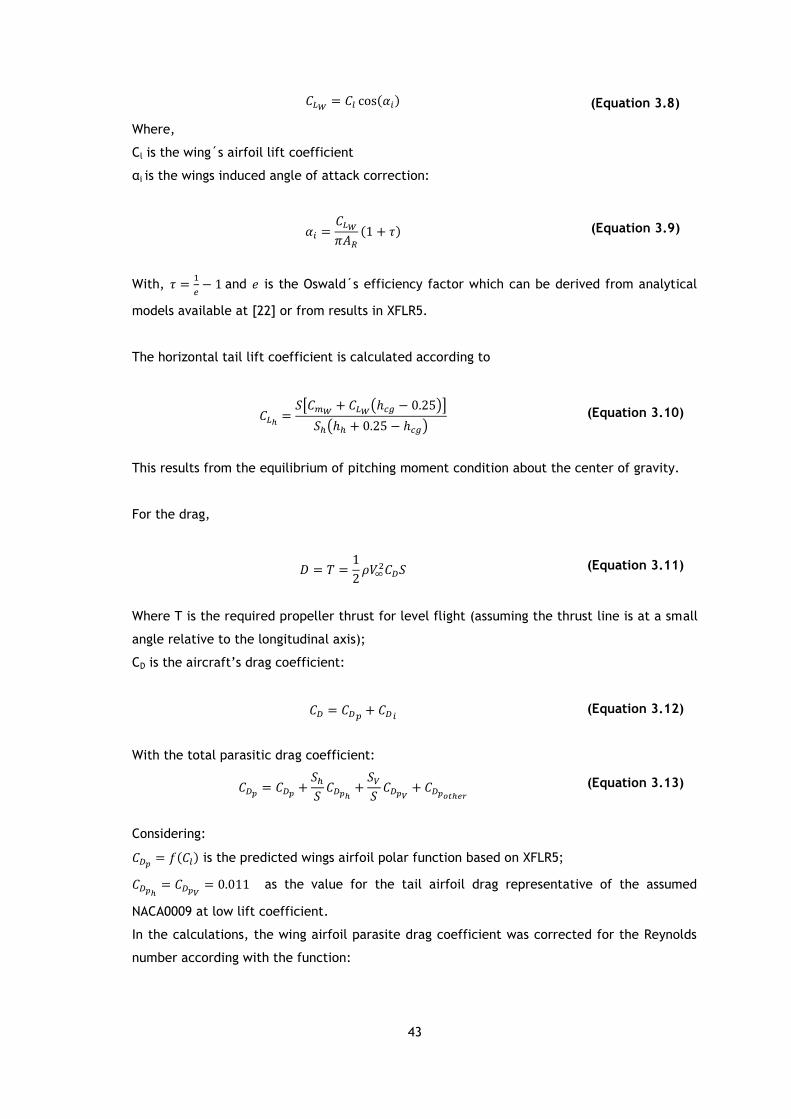
43
𝐶𝐿𝑊= 𝐶𝑙 cos(𝛼𝑖) (Equation 3.8)
Where,
Cl is the wing´s airfoil lift coefficient
αi is the wings induced angle of attack correction:
𝛼𝑖 =𝐶𝐿𝑊
𝜋𝐴𝑅
(1 + 𝜏) (Equation 3.9)
With, 𝜏 =1
𝑒− 1 and 𝑒 is the Oswald´s efficiency factor which can be derived from analytical
models available at [22] or from results in XFLR5.
The horizontal tail lift coefficient is calculated according to
𝐶𝐿ℎ=
𝑆[𝐶𝑚𝑊+ 𝐶𝐿𝑊
(ℎ𝑐𝑔 − 0.25)]
𝑆ℎ(ℎℎ + 0.25 − ℎ𝑐𝑔) (Equation 3.10)
This results from the equilibrium of pitching moment condition about the center of gravity.
For the drag,
𝐷 = 𝑇 =1
2𝜌𝑉∞
2𝐶𝐷𝑆 (Equation 3.11)
Where T is the required propeller thrust for level flight (assuming the thrust line is at a small
angle relative to the longitudinal axis);
CD is the aircraft’s drag coefficient:
𝐶𝐷 = 𝐶𝐷𝑝+ 𝐶𝐷𝑖
(Equation 3.12)
With the total parasitic drag coefficient:
𝐶𝐷𝑝= 𝐶𝐷𝑝
+𝑆ℎ
𝑆𝐶𝐷𝑝ℎ
+𝑆𝑉
𝑆𝐶𝐷𝑝𝑉
+ 𝐶𝐷𝑝𝑜𝑡ℎ𝑒𝑟 (Equation 3.13)
Considering:
𝐶𝐷𝑝= 𝑓(𝐶𝑙) is the predicted wings airfoil polar function based on XFLR5;
𝐶𝐷𝑝ℎ= 𝐶𝐷𝑝𝑉
= 0.011 as the value for the tail airfoil drag representative of the assumed
NACA0009 at low lift coefficient.
In the calculations, the wing airfoil parasite drag coefficient was corrected for the Reynolds
number according with the function:

44
𝐶𝐷𝑝𝑖= 𝐶𝐷𝑝𝑖𝑅𝑒𝑟𝑒𝑓
(𝑅𝑒
𝑅𝑒𝑟𝑒𝑓
)
𝑅𝑒𝑒𝑥𝑝
(Equation 3.14)
Where, 𝐶𝐷𝑝𝑖𝑅𝑒𝑟𝑒𝑓
is an airfoil parasite drag coefficient at a known Reynolds number 𝑅𝑒𝑟𝑒𝑓, 𝑅𝑒𝑒𝑥𝑝
is a suitable correction exponent in our case taken as -0.4.
For the remaining parasitic drag coefficient (which includes the fuselage parasitic and induced
drag, wing-fuselage interference drag, tail interference drag, cooling drag, landing gear drag,
etc...), a value was assumed. With, 𝐶𝐷𝑝𝑓𝑢𝑠= 0.03 for a thick airfoil shaped body fuselage
concept and 𝑆𝑓𝑢𝑠 = 0.06𝑚2.
𝐶𝐷𝑝𝑜𝑡ℎ𝑒𝑟= 𝐶𝐷𝑝𝑓𝑢𝑠
(𝑆𝑓𝑢𝑠
𝑆) + 0.25𝐶𝐷𝑝𝑤
(Equation 3.15)
The total induced drag coefficient is:
𝐶𝐷𝑖= 𝐶𝐷𝑖 𝑤
+𝑆ℎ
𝑆𝐶𝐷𝑖ℎ
(Equation 3.16)
where, 𝐶𝐷𝑖 𝑤=
𝐶𝐿𝑤2
𝜋𝐴𝑅𝑒 is the wings induced drag coefficient and 𝐶𝐷𝑖ℎ
=𝐶𝐿ℎ
2
𝜋𝐴𝑅𝑒 is the horizontal tail
induced drag coefficient.
The horizontal tail Oswald coefficient was assumed as 𝑒 = 0.975. The horizontal tail lift
coefficient is calculated with the equilibrium condition around the center of gravity position
by,
𝐶𝐿ℎ=
𝑆 (𝐶𝑚 + 𝐶𝐿𝑤(ℎ𝑐𝑔 − ℎ𝑤))
𝑆ℎ(ℎℎ + ℎ𝑐𝑔 − ℎ𝑤) (Equation 3.17)
Where,
ℎℎ is the wings aerodynamic center longitudinal distance from the datum in number of wing
mean geometric chords, ℎ𝑐𝑔 is the aircraft’s longitudinal distance from center of gravity to the
datum in number of wing mean geometric chords, hh is the longitudinal distance from the
horizontal tail’s 0.25 chord to the datum in number of wing mean geometric chords.
The required level flight propulsive power is,
𝑃𝑅 = 𝑇𝑉∞ (Equation 3.18)

45
3.3.2.2 Take-off Performance Model
The theoretical model used to estimate the performance in the take-off considers the ground
run acceleration as,
𝑑𝑉
𝑑𝑡=
𝑇 − 𝐷 − 𝜇𝑅𝑁
𝑚 (Equation 3.19)
Were 𝜇𝑅 is the rolling friction coefficient. The normal ground reaction:
𝑁 = 𝑊 − 𝐿 (Equation 3.20)
and D has a Reynolds number correction factor:
𝐷 =1
2𝜌𝑉2𝑆𝐶𝐷 (
𝜌𝑉𝑐𝜇
200000)
−0.4
(Equation 3.21)
and the rolling friction, that was determined experimentally as 𝜇𝑅0.055.
𝑑𝑉
𝑑𝑡=
𝑑𝑉
𝑑𝑠
𝑑𝑠
𝑑𝑡= 𝑉
𝑑𝑉
𝑑𝑠=
1
2
𝑑𝑉2
𝑑𝑠 (Equation 3.22)
Considering 𝑊 = 𝑚𝑔,
1
2
𝑑𝑉2
𝑑𝑆=
𝑔[𝑇 − 𝐷 − 𝜇(𝑊 − 𝐿)]
𝑊 (Equation 3.23)
Finally,
𝑑𝑠 =𝑊𝑑𝑉2
2𝑔[𝑇 − 𝐷 − 𝜇(𝑊 − 𝐿)] (Equation 3.24)
The integration of this last relation gives the total take-off run distance 𝑠𝑎𝑐𝑒𝑙 as a function of
the velocity increase necessary for taking-off, which is 𝑉𝑡𝑜 minus 𝑉𝑊𝑖𝑛𝑑.
𝑠𝑎𝑐𝑒𝑙 =𝑊(𝑉𝐿𝑂 − 𝑉∞)2
2𝑔[𝑇 − 𝐷 − 𝜇(𝑊 − 𝐿)]0.70𝑉𝐿𝑂
(Equation 3.25)
See Reference [23] for further insight on the implementation and use of the current
formulation.

46
The Lift-Off Speed,𝑉𝐿𝑂:
𝑉𝐿𝑂 = 1.1√
2 ×
𝑊𝐶𝐿𝑚𝑎𝑥
𝑐𝑏𝜌0
(Equation 3.26)
The distance of take-off, 𝑋𝑇𝑂:
A different model, that takes into account the static thrust available on take-off, is given by
𝑋𝑇𝑂:
𝑋𝑇𝑂 =
𝑊𝑔
𝐹𝑇𝑂
((𝑉𝐿𝑂 − 𝑉𝑤𝑖𝑛𝑑)2
2) (𝑚) (Equation 3.27)
where 𝑉𝐿𝑂 is the lift-off speed, g=9.81m/s and 𝑉𝑊𝑖𝑛𝑑 is the windspeed.
The take-off force is given by:
𝐹𝑇𝑂 = 𝑇𝑠𝑡𝑎𝑡𝑖𝑐
𝑉𝑇 − 𝑉𝐿𝑂
𝑉𝑇
−(
12
) 𝜌0𝑉𝐿𝑂2 𝑐𝑏
𝐶𝐿𝑚𝑎𝑥
103
− 0.025𝑊 (𝑁) (Equation 3.28)
where 𝑉𝑇 is thrust at a set velocity and (𝑉𝑇 − 𝑉𝐿𝑂)/𝑉𝑇 is a velocity correction factor.
3.3.2.3 Structure Weight Model
The design point is determined by evaluating multiple design point solutions using the
formulation above in a spreadsheet. Firstly, the performance of the design is evaluated by
setting the weight at the value that allows to take-off in 60m. The empty weight is modelled
as a function of span and chord by
𝑊0 = 𝑤𝑊𝑝𝑎𝑦𝑊0𝑟𝑒𝑓(
𝑏
𝑏𝑟𝑒𝑓
)
𝑒𝑏
(𝑐
𝑐𝑟𝑒𝑓
)
𝑒𝑐
+ 𝑊𝑠𝑦𝑠 (Equation 3.29)
Where, 𝑤 is a proportionality function of the empty weight to the payload mass;
𝑊𝑝𝑎𝑦 is an arbitrated payload weight for each design point;
𝑊0𝑟𝑒𝑓 is a reference airplane weight with similar structure concept (including material and
building technology) and 𝑏𝑟𝑒𝑓 =2.5, reference span and 𝑐𝑟𝑒𝑓 =0.2, reference mean chord;
𝑊𝑠𝑦𝑠 is the systems weight (motor, propeller, ESC, battery, receiver, etc);

47
𝑒𝑏=1.3 and 𝑒𝑐=1 are exponents that reflect the nonlinearity of the empty weight function with
the actual airplane span and chord. The constants 𝑒𝑏, 𝑒𝑐, 𝑏𝑟𝑒𝑓 and 𝑐𝑟𝑒𝑓have been determined
through structural construction tests.
3.3.2.4 Propulsive Model
The equations that describe the propulsive model are Equation 3.30 and Equation 3.31:
𝑇𝑎𝑣𝑎𝑖𝑙𝑎𝑏𝑙𝑒 = −0.57𝑉∞ + 22 (Equation 3.30)
𝑇𝑎𝑣𝑎𝑖𝑙𝑎𝑏𝑙𝑒 = (−0.57𝑉∞ + 22 )𝐼/45 × 0.95 (Equation 3.31)
where 𝑉∞ is the airspeed, 𝐼 is the current of the battery and 45 is the minimum battery
discharge current rating of 45 A as described in requirement 14 of Section 3.2. These models
described the linear reduction in T with airspeed and provide a correction for the battery
voltage.
3.3.2.5 Stability and Control Modelling
Aircraft must have a certain amount of inherent stability and controllability to be flyable. It is
therefore important to consider these characteristics when designing a new aircraft. Accurate
evaluation of the stability characteristics of any given aircraft is a complicated process, and is
not well suited for preliminary or intermediate design. Fortunately, an alternative criteria that
gives reasonable estimates and is vastly simpler to apply can be used. Such estimate is based
on static margin, which is given by:
S. M. =xnp − xcg
c (Equation 3.32)
𝑥𝑛𝑝
𝑐≈
1
4+
1 +2
𝐴𝑅
1 +2
𝐴𝑅ℎ
(1 −4
𝐴𝑅 + 2) 𝑉ℎ (Equation 3.33)
Where 𝑥𝑛𝑝 is the location of the neutral point, 𝑥𝑐𝑔 is the cg position and c is the MAC, 𝐴𝑅ℎ the
horizontal stabilizer aspect ratio and 𝑉ℎ the tail volume coefficient. Recommended values for
the static margin vary between +0.05 and +0.15.
3.3.2.6 Performance Estimation
3.3.2.6.1 Available and required power versus airspeed

48
A rather complete analysis of performance can be obtained once one has the available and
required level flight power curves (see Figure 4.20). The available power was measured in the
wind tunnel tests of the propulsive set (Section Propulsion 3.1.1). The levelled flight required
power curve was obtained from the flight mechanics model described in Section 3.3.2.1 with
16kg maximum take-off weight at 0m altitude. It is seen that an ample margin was left for
achieving good climb performance and execute high load factor g’s turns in the speed flight
task.
Rate of climb is given by:
𝑅𝐶 =𝑃𝑎 − PR
𝑊 (Equation 3.34)
Where 𝑃𝑎 is the available propulsive power and PR is the required propulsive power.
Then, the terrain climb angle is given by;
𝛾 = 𝑎𝑟𝑐𝑠𝑒𝑛𝑅𝐶
𝑉∞ − 𝑉𝑤𝑖𝑛𝑑
(Equation 3.35)
3.3.2.6.2 Flight Task Points Estimation
This following model considers a flight task flown in a straight line with semi-circle turns. The
length of a turn is given by:
𝐿 = 𝜋𝑟 + 100 (Equation 3.36)
The flight task points (FTP) is estimated by:
𝐹𝑇𝑃 = 2𝑚𝑝𝑎𝑦𝑙𝑜𝑎𝑑 (100
𝐿(0.67𝑉∞ + 0.33𝑉max)) (Equation 3.37)
where the payload mass (𝑚𝑝𝑎𝑦𝑙𝑜𝑎𝑑) is the total mass of the aircraft (𝑚𝑡𝑜𝑡𝑎𝑙) minus the mass of
batteries (𝑚𝑏𝑎𝑡𝑡𝑒𝑟𝑖𝑒𝑠) minus the empty weight of the aircraft (𝑚𝐸𝑀𝑃𝑇𝑌).
𝑚𝑝𝑎𝑦𝑙𝑜𝑎𝑑 = 𝑚𝑡𝑜𝑡𝑎𝑙 − 𝑚𝑏𝑎𝑡𝑡𝑒𝑟𝑖𝑒𝑠 − 𝑚𝐸𝑀𝑃𝑇𝑌 (Equation 3.38)

49
3.3.2.7 Parametric Studies
Multiple airplanes (or design points) are calculated having different spans, chords and lift
coefficients using the described formulation (Section 3.3.2). In this way, a parametric study is
performed; producing the results presented in Section 4.3 .
3.3.2.7.1 Design Point
Table 3.2 shows the aircraft design point with the most important dimensions.
3.3.2.8 Weight and Balance
Weight budget and the weight and balance results are shown in
Table 3.3. The total mass is expected to be about 16kg and the maximum payload at sea level,
12.75 kg.

50
Table 3.2 - Design Point
Variables Value Variables Value
𝒉𝑪𝑮 30% MAC 𝑺𝑽 0.06 m2
𝒉𝑯 1.2 m 𝑺𝑯 0.12 m2
𝒉𝑽 1.5 m 𝒃𝑾𝒊𝒏𝒈 4.2 m
𝑪𝑳𝒎𝒂𝒙 2.7 𝒃𝑽 0.65 m
𝑴𝑻𝑶𝑾 160 N 𝒃𝑯 0.72 m
𝑴𝑨𝑪𝑾𝒊𝒏𝒈 0.26 m 𝑨𝑹𝑾𝒊𝒏𝒈 17.6
𝑴𝑨𝑪𝑬𝑽 0.17 m 𝑨𝑹𝑽 3.28
𝑴𝑨𝑪𝑬𝑯 0.17 m 𝑨𝑹𝑯 4
𝑺𝑾𝒊𝒏𝒈 1.00 m2 𝝀𝑾𝒊𝒏𝒈 4.8
Table 3.3 - Airplane weight and balance
Nº Components Weight [g] Quantities Total Weight [g] dXcg* [mm] W*dXcg [gfmm]
1 Wing Root Panel 450 2 900 -139 -125100
2 Tip Wing Panels 350 2 700 -127 -88900
3 Winglets 200 2 400 -99 -39600
4 Tail Horizontal Surface 80 1 80 1199 95920
5 Tail Vertical Surface 70 1 70 1438 100660
6 Motor Boom 35 1 35 -404 -14140
7 Cargo Bay Body 250 1 250 -149 -37250
8 Cargo Bay 35 1 35 -189 -6615
9 Tail Boom 100 1 100 685 68500
10 Motor 181 1 181 -517 -93577
11 Propeller 10 1 10 -559 -5590
12 Prop Hub/Spinner 10 1 10 -559 -5590
13 Battery 220 1 220 -365 -80300
14 Electric Speed Controller 50 1 50 -460 -23000
15 Receptor Rx 15 1 15 -249 -3735
16 Receptor battery 60 1 60 -420 -25200
17 Landing Gear 129 1 129 -189 -24381
18 Wing Servos 9 not defined 50 -70 -3500
19 Tail Servos 9 2 18 1320 11880
21 Servo Wires and Servo Plugs 35 1 35 0 0
22 Battery/ESC/Motor Connectors 10 4 40 -460 -18400
23 Payload 12750 1 12750 -205 -2613750
Structure Weight [g] 2699 Total Dw -2931668
Systems Weight [g] 689 CG -181.6624117
Total Empty Weight [g] 3388 %mac 30.1
Take Off Weight [g] 16138
* Datum Line is the Wing Root Trailing Edge. Positive direction of X is from trailing edge to the tail.

51
Detailed Design
3.4.1 Wing Design
The wing chord, sweep, dihedral, incidence and sweep distributions along the span were
studied using an iterative study using XFLR5. Tiny changes to the overall shape of the wing were
systematically made, having the maximum lift to drag ratio and the drag versus airspeed results
as the optimization drivers. To reduce the induced drag, it was decided to use winglets. With
a trial and error approach, where the relative span, dihedral angle, sweep back and chord
distribution were iteratively changed until the results were not getting better, the final wing
was designed.
3.4.2 Propulsion
3.4.2.1 Motor controller – ESC
The team decided to use a speed controller with data logging to make the aircraft’s flight tests
an easier task. Besides that, a lightweight ESC with very low internal resistance are the
concepts that guided the search for the ideal hardware. The selected ESC is the Castle Creations
Phoenix Lite 100 that was purchased by UBI for the ACC 2011 edition because of the data
collection of the motor rotational speed, current and voltage that it allows.
3.4.2.2 Battery
As shown in Section 4.1, from the set of purchased batteries, the Basher 2800 mAh 3S is the
correct choice for us.
3.4.3 Detailed Wing design
Through XFLR5, with the chosen airfoils and wingspan, an iterative process was used to set the
final shape of the wing. Taper, dihedral and sweep were systematically changed to obtain the
maximum possible efficiency (L/D) over the speed range and in particular: push the lower level
flight drag to the highest possible airspeed, such that the maximum level flight airspeed is
maximized to perform the flight task legs in minimum time.
One big concern is the flight characteristics when the airplane stalls. The wing must have
washout at the wingtip to prevent a wingtip stall, a linear washout distribution along the entire
wingspan was tested against washout only at the wing tip panels, this last option can provide
the flight characteristics that are needed without a significant penalization in the wing
efficiency.

52
3.4.3.1 Fowler flap mechanism
To design the Fowler Flap mechanism, the software SolidWorks was used to aid with the design.
Figure 4.15 shows the work environment Sketch of the Dassault Systems SolidWorks software.
The motion and dimensions of the bars was iterated so that the motion was perfect and the
bars did not interfere with each other. The bars are the components represented by dashed
lines and the circumferences are hinges. The circumferences with a circle inside are fixed
position hinges. The circumferences with a cross are hinges that connect the bars and are free
to move according to the bars motion. It was essential to guarantee that for both the extended
and retracted positions, none of the mechanism´s bars interfered with each other. After the
design was ready on SolidWorks, a 3D printer was used to “build” all the components. A total
of 9 different components were printed for each single flap mechanism set.
The flap was first designed on SolidWorks. An STL file is then created and exported to a software
in order to validate the scale and orientation of the part. Finally, a G-code is produced to print
the parts on the 3D printer. After printing, the components will be assembled. The time of
assembly is quite long due to the size of the components and the material that is used. The
material used in the 3D printing, polylactic acid (PLA) is quite resistant, but with pieces
measuring about 1 cm, these can be easily bent or broken when doing the perforations for the
assembly (a hole diameter study was performed to allow a reliable assembly with an
appropriate hole diameter. However, when the mechanisms were printed for the different
stations of the wing, the hole diameter that should have been kept constant was changed due
to scaling effects. This meant that the smaller mechanisms near the wing tips had small holes
that required perforations to be enlarged, and the mechanisms near the roots had holes that
were too large). Pins were used to keep the connections in place.
Figure 3.17 - Design of mechanism in Dassault Systems SolidWorks software.

53
Airplane Construction
3.5.1 Wings
For the manufacturing of the wing moulds, first it was decided to manufacture a wing mould
plug (also called wing master). Foam cores were cut in the hot wire cutting 4-axis CNC machine,
sanded with 80 grit sandpaper, the pores and dents were filled with hollow glass microballoons-
epoxy, (Resin Biresin CR92 and Biresin CH92 of Hardener mix ratio 100:28) and two layers of
bidirectional glass fibre 120g/m2 ±45º were wet layed up and allowed to cure. A thick layer of
hollow glass microballoons-epoxy was then applied and sanded after cure. After sanding with
increasing higher sanding paper grit (up to 600 grit), a coat of paint two component
polyurethane paint was applied; this coat was carefully sanded. This was done to ensure the
surface was smooth to guarantee that the final aircraft has minimal skin friction drag. Figure
3.18 shows the process. Figure 3.19 shows the resulting upper surface on one of the wing mould
plug. The reflection shows the smoothness of the surface.
The Epoxy, Biresin CR92 and Hardener Biresin CH92 will be used in all constructions.
The next step was to build the mould using the wing plug. As seen on Figure 3.20 a), wooden
planks were placed to create the parting line and small pieces of wax were applied as alignment
dowels (red dots on the mould). Then, on a dust clean environment (see Figure 3.20 b)), a layer
of PVA is applied and allowed to dry for demoulding the master from the future mould. The
mould structure started by a layer of tooling epoxy gel coat (a mix Biresin S15 A:B = 100:7) and
then left to cure. The gel coating is used to give the mould a hard and smooth finished surface.
Before drying, a layer of fibreglass (chopped strand mat 450 g/m2 ) and epoxy resin was applied
and allowed to cure, see Figure 3.20 d). To provide rigidity to the to the mould structure, a
plank of MDF (medium density fibreboard) was attached to the mould back side with
polyurethane foam. In a previous attempt, a mixture of sand and polyester resin was used to
reinforce the moulds but it proved unsuccessful as the polyester resign delaminated from GFRP,
allowing for the remaining GFRP mould structure to warp beyond repair. For this reason, the
moulds construction took place twice, delaying the airplane construction in a crucial manner.
For the other half of the wing mould, the same process was repeated, but with a small
difference. Since a gel coat layer is applied on top of the male mould, to demould it is necessary
to apply PVA (Figure 3.20 c) to the existing half of the mould too. This layer must have as few
imperfections as possible and as few air bubbles and dust particles as possible, otherwise the
mould replicates all those imperfections to the produced parts. The technique used was to
apply the PVA with a paint air gun inside an improvised clean room. Nevertheless, applying the
PVA proved to be extremely difficult because it was very prone to run off the mould surface
making the PVA film uneven.

54
Once both halves of the mould were done, demoulding is easy with the use of PVA, both the
lower and upper surface sandwich skins of the wings could be built. The advantage of using
moulds is that it is possible to build the whole wing in a single procedure, with precisely the
desired geometry and size.
Figure 3.18 – Male mould fabrication process. The figure shows the application of hollow microballoons a),
glass fibre layers b) another layer of hollow microballoons c), and coat of paint d).
a) b)
c) d)

55
Figure 3.19 -– Wing mould plug fabrication process.
Figure 3.20 – Wing mould manufacturing.
d) c)
b) a)

56
Figure 3.16, in Section 3.2.1, shows the conceptual design of the wing shell; this is how the
wing was built using the moulds. To build the wing skins shells, each wing surface outer contour
and important characteristics like fibre reinforcements limits were drawn on a clear flexible
plastic sheet with a permanent marker first, see in Figure 3.21 a). Then, 1mm medium density
balsa wood pieces were cut for the sandwich skin cores as well as the bi-axial fibre ± 45 degree
80 𝑔/𝑚2 carbon cloth pieces that made up the sandwich skins. The carbon cloth was
impregnated with epoxy resin using a roller and laid up between two sheets of the clear plastic
sheets before it was laid on the mould surface; the amount of resin was kept to a minimum to
keep the weight in check. One of the advantages of producing laminates by hand is that the
person doing the job can judge the necessary amount of resin while the job is performed.
Putting the carbon fibres cloth between two clear plastic sheets made spreading the resin
easier, thus helping to control the weight. Nevertheless, the biaxial carbon cloth may well
absorb more resin than the spread tow bidirectional carbon fabric because the first seems to
build a thinner skin for the same cloth weight per square meter. The impregnated carbon Cloth
was trimmed cut to the limits of the clear plastic sheets to make it easier to place it in the
mould without dealing with excess fabric, see in Figure 3.21. The whole process must be
performed within the epoxy resin working time; otherwise, the resin will harden, making it
impossible to use the material. In this manner, the mould that was previously coated with PVA,
a sandwich wing consisting in faces of one layer of bi-axial CFRP and 1mm balsa wood core is
built. Hollow microballoons were used to fill the voids. At the same time, great care is taken
to leave sufficient space between two balsa core sheets in the correct position for the spar
caps (see Section 3.5.1.1.). After placing the spar caps that were also hand laid up from
unidirectional carbon roving, the outer layer of wet bi-axial carbon cloth is applied.

57
Figure 3.21 – Wing shell manufacturing a) drawing the wing skins structure on clear flexible plastic sheet
and cutting the balsa wood core sheets to size; b) laying up the bi-axial carbon fibre cloth with epoxy
resin; c) cutting the carbon fibre to measure according to the clear plastic sheets markings; d) applying
balsa wood on the carbon fibre (note the gap for the unidirectional carbon fibres spar cap on the lower
right).
3.5.1.1 Spar
This part of the work had to be performed at the same time as the wing shells/skins. The spar
resists most of the most demanding loads imposed on the wing. If this step is not performed
properly, the wing’s structure may be compromised leading to serious structural failure and
the loss of the airplane. Unidirectional carbon fibre roving were cut (Figure 3.22 a)), carefully
impregnated with epoxy resin and placed in the gaps between the 1mm core balsa sheets
reserved for the wing (Figure 3.22 b)). In Figure 3.22 c), the wing spar cap is carefully placed.
The spar cap thickness is constant at 1mm to conform with the wing shell balsa core but the
width is substantially increased near the root, starting from 5mm near the wing tip increasing
linearly to 50 mm at the wing root. In Figure 3.22 d), the result can be seen; it is also possible
to see the mixture of epoxy and hollow microballons filling any region prone to voids or to
starve the impregnated fibres cloths by capillary resin absorption in the wing shell structure,
c) d)
b) a)
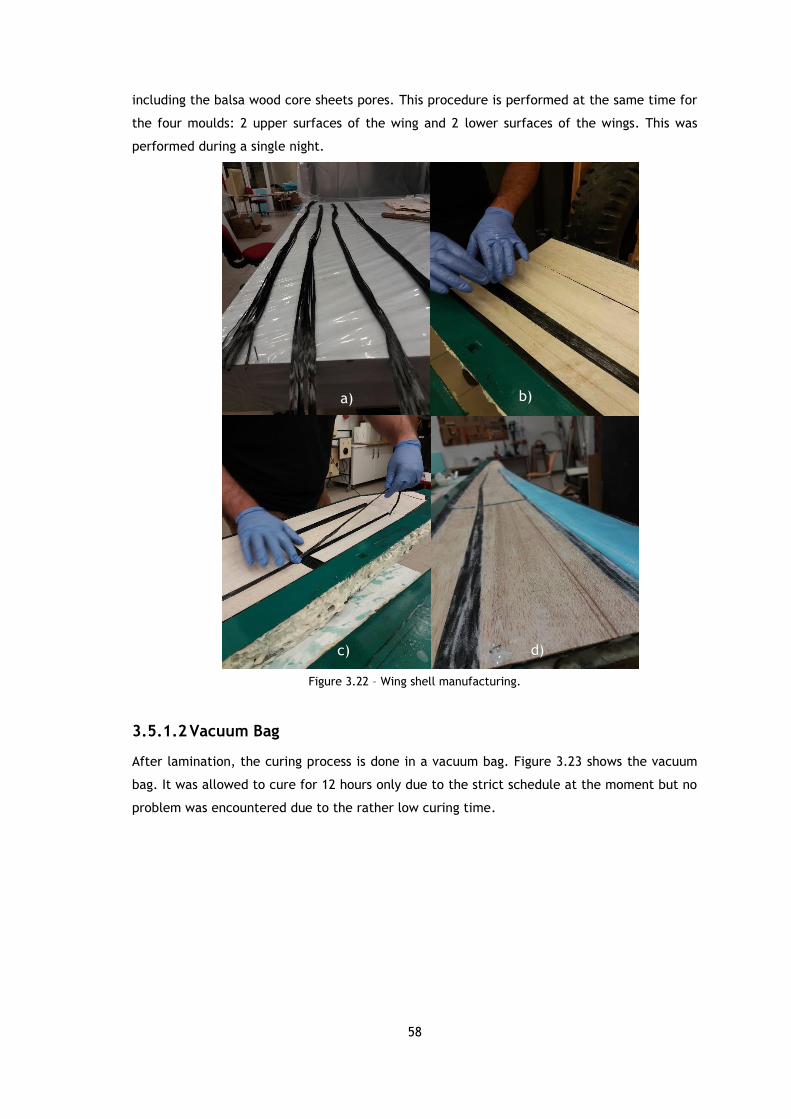
58
including the balsa wood core sheets pores. This procedure is performed at the same time for
the four moulds: 2 upper surfaces of the wing and 2 lower surfaces of the wings. This was
performed during a single night.
3.5.1.2 Vacuum Bag
After lamination, the curing process is done in a vacuum bag. Figure 3.23 shows the vacuum
bag. It was allowed to cure for 12 hours only due to the strict schedule at the moment but no
problem was encountered due to the rather low curing time.
Figure 3.22 – Wing shell manufacturing.
b)
d) c)
a)

59
The next step was to join the wing halves. The limits of the Fowler Flap were delimited with a
barrier wall of plasticine so that both the leading edge and trailing edge of the wing could be
filled with polyurethane foam as seen on Figure 3.24 b) without the foam invading the Fowler
flap region. At the same time, the 6mm medium density balsa wood spar web was placed with
a bidirectional 200𝑔/𝑚2 carbon cloth impregnated with epoxy at ±45 degree orientation.
Figure 3.24 c) shows how the panels were joined while still in their respective mould half. The
alignment dowels initially defined by wax pins during the mould construction of Figure 3.20 a)
were now used since they guarantee that the panels fit in the right place for the perfect match
between the wing lower and upper surfaces.
Figure 3.23 – Improvised vacuum bag.

60
3.5.1.3 Wing Panels Attachment Interfaces
The four interfaces that joined the wing panels together were made from segments of
rectangular solid pultruded CFRP with attachment pins on the extremities tied with ultra-high-
molecular-weight polyethylene (UHMWPE, UHMW) Dyneema® strings and cyanoacrylate glue.
The reinforcement of the pin for the interfaces was thoroughly tested. First, unidirectional
carbon fibres were used, but these proved inadequate. Then, with UHMWPE; the number of
reinforcement turns was estimated and tested successively to determine the necessary amount.
These interfaces in Figure 3.25 were built in series and were all lookalike such that if any single
one would fail during the competition, it could be replaced readily (see Figure 3.26).
Clamps were used to join the moulds halves but they were overtightened in the region of the
root of the left wing producing a significant dent in the upper surface of the root panel of the
left wing.
Figure 3.24 – Wing manufacturing, joining the upper and lower surfaces
a) b)
d) c)

61
Figure 3.25 -2D drawing of an interface. The black bands correspond to the Dyneema®
Figure 3.26 – a) The connection between wing panels showing the interface part: a); and the hard-points
in greater detail: b).
a)
b)

62
3.5.2 Tails
A tail boom supporting cone made of solid 30 kg/m3 Expanded Polystyrene (EPS) foam was used
just after the cargo bay compartment. The tail surfaces will be built with conventional ribs and
heat shrink film covering using balsa wood cap spars and EPS cores. Figure 3.27 a) final tail and
b) tails on CATIA V5.
Figure 3.27 – Tail surfaces.
3.5.3 Cargo Bay
CATIA V5 image of the cargo bay is shown in Figure 3.28. The three connection links were made
of rectangular solid pultruded with balsa wood cores and the extremities had pins covered with
Dyneema®.
3.5.4 Fuselage
Fishing rods CFRP tubes were used to support the motor and the tail surfaces. These are off-
the-shelf light-weight structural components that offer a great compromise of price-weight-
strength-rigidity. The fuselage will be a CFRP tube (fishing rod) with a support for the motor
on one of the ends and the connections to the tail surfaces on the other end.
a) b)

63
Figure 3.28 – Cargo bay image on CATIA V5.
Foam
Sandwich of balsa wood
and hollow microballoons
Foam

64
4 Results
Propulsion
After collecting the experimental data from the batteries with the test rig described in Section
3.1.1.2, the results confirm that significant supply voltage difference occur in the final of the
flight (about 200 seconds) that according to the battery pack in use, thus confirming the
importance of battery choice in the performance of the propulsion system, see Figure 4.3. The
higher the voltage supplied by the battery, the higher will be the motor speed, that is
proportional to the supply voltage for the same load, and the higher will be the current to the
motor (note that motor torque is proportional to the current) thus, an even higher useful power
will be available, giving more performance to the airplane.
Figure 4.1 shows the instantaneous voltage of the worst and the best batteries. The worst is
Tattu 1300 mAh and the best one is Basher 2800 mAh 3S HV.
Figure 4.1 - Instantaneous voltage of the worst and the best batteries.
The experiments show that heated batteries at 40º Celsius to have higher voltage under load
and during the flight than the ones that room temperature. Thus, heated batteries give more
performance. (See Figure Figure 4.2)
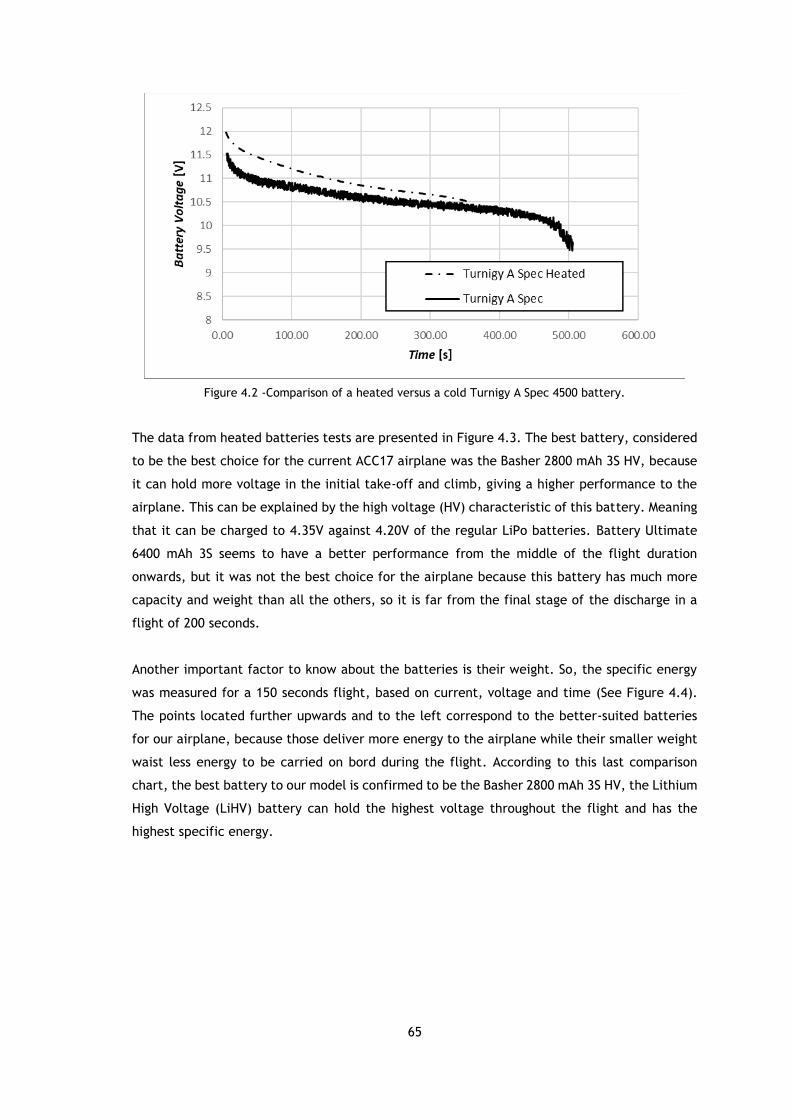
65
Figure 4.2 -Comparison of a heated versus a cold Turnigy A Spec 4500 battery.
The data from heated batteries tests are presented in Figure 4.3. The best battery, considered
to be the best choice for the current ACC17 airplane was the Basher 2800 mAh 3S HV, because
it can hold more voltage in the initial take-off and climb, giving a higher performance to the
airplane. This can be explained by the high voltage (HV) characteristic of this battery. Meaning
that it can be charged to 4.35V against 4.20V of the regular LiPo batteries. Battery Ultimate
6400 mAh 3S seems to have a better performance from the middle of the flight duration
onwards, but it was not the best choice for the airplane because this battery has much more
capacity and weight than all the others, so it is far from the final stage of the discharge in a
flight of 200 seconds.
Another important factor to know about the batteries is their weight. So, the specific energy
was measured for a 150 seconds flight, based on current, voltage and time (See Figure 4.4).
The points located further upwards and to the left correspond to the better-suited batteries
for our airplane, because those deliver more energy to the airplane while their smaller weight
waist less energy to be carried on bord during the flight. According to this last comparison
chart, the best battery to our model is confirmed to be the Basher 2800 mAh 3S HV, the Lithium
High Voltage (LiHV) battery can hold the highest voltage throughout the flight and has the
highest specific energy.

66
Figure 4.3 - Batteries performance data.
Figure 4.4 - Comparison of the specific energy of all batteries with the time of flight of 150s.
0
5
10
15
20
25
0 100 200 300 400 500
Ener
gy [
Wh
]
m [g]
Turnigy A Spec 4500 @ 7.8C (758)(COLD)Turnigy Bolt 1300 mAh @ 18.5C
Tattu 1300 mAh @ 17.6C
Multistar 1400 mAh @ 16.98C
Turnigy A Spec 4500 @ 10.22C
Turnigy 3300 @ 14.03C
Ultimate 6400 mAh 3S @ 7.26C
Basher 2800 mAh 3S HV @ 16.87C

67
Aerodynamics
4.2.1 Designed Airfoils
Figure 4.5 shows the final airplane main wing airfoil used in the competition (full line). The
airfoil with the dashed line is the initial airfoil MS115_437, used in the Fowler flap design. Note
that the final airfoil has a larger trailing edge angle. This allows an easier installation of the
Fowler flap and respective mechanism. Figure 4.6 shows the Wing tip airfoil.
Figure 4.5 – Airfoils: MS115_437 initial airfoil; MS101_383 final airfoil used in the UBI ACC17.
Figure 4.6 -MS113_310, wing tip airfoil
The flight task speed legs, according to the calculations using the theoretical models described
in Section 3.3.2.1 for the airplane design (Table 3.2) is performed at a Cl value of 0.4. Iterative
changes to the airfoil geometry through the inverse design tool allowed the design of an initial
airplane airfoil later improved to a main final wing airfoil and a tip airfoil. The airfoil
nomenclature follows a designer-thickness-camber reasoning. The airfoil designed for the
airplane is the MS 115_437, thus meaning Miguel Silvestre (designer), 11.49% relative thickness
and 4.37% camber. MS101_383 is the final airfoil design for the UBI ACC17 airplane and has
10.10% relative thickness and 3.83% camber. While designing these airfoils, the objective was
to maximize the aerodynamic efficiency (𝐶𝑙/𝐶𝑑) around that lift coefficient. This is the reason
why, according to Figure 4.7, the final airfoil is expected to have a maximum 𝐶𝑙/𝐶𝑑 that is not
impressive at a value of near 80 at 𝑅𝑒√𝐶𝑙=200,000, against 85 of the initial airfoil, and near 60
at 𝑅𝑒√𝐶𝑙=100,000, but, on the hand, has a remarkable 𝐶𝑙/𝐶𝑑 value at the 0.4 lift coefficient of
about 65 at 𝑅𝑒√𝐶𝑙=200,000, compared to just below 50 of the initial airfoil, and 40 at
𝑅𝑒√𝐶𝑙=100,000. The tip airfoil, MS113_310, was developed to behave similarly as the main

68
Figure x B-spline representation of the
airfoil.
airfoil, but it was important that the 𝐶𝑙/𝐶𝑑 would not deteriorate for lift coefficients because
the tip effectively works at lower lift coefficients and, also, to not stall before the main airfoil.
In Figure 4.7, the tip airfoil data performance prediction is presented only at 𝑅𝑒√𝐶𝑙=100,000
and is seen to have a slightly even higher 𝐶𝑙/𝐶𝑑 value of 42 against the final main wing airfoil
at the 0.4 lift coefficient and increasingly smaller 𝐶𝑑 value as the lift coefficient drops way
from 0.4 (clearer in Figure 4.8).
It is seen that the aerodynamic efficiency in the Figure 4.7 for the initial airfoil. MS115_437
peaks at 85 for a lift coefficient of 1 and holds a value above 50 from 0.5 to 1.5 Cl. The pitching
moment coefficient is quite low at -0.16 and the maximum lift coefficient is expected to reach
1.6.
Figure 4.8 also shows that MS 101_383 has a lower drag coefficient at lower lift coefficients.
For the flight task lift coefficient, has a lower drag at a Cl below 0.4., this is ideal since the
wingtip is operating at a lower lift coefficient. The 𝐶𝑙/𝐶𝑑 of MS101_383 is also higher. Despite
having an overall slightly lower maximum 𝐶𝑙/𝐶𝑑, at lower lift coefficients, the 𝐶𝑙/𝐶𝑑 is also
slightly higher for the MS 101_383 and better distributed over the whole Cl range.
Figure 4.7 - Airfoil lift to drag ratio comparison. MS115_437 is the airfoil initially developed; MS101_383
is the final airplane airfoil; MS113_310 is the wingtip airfoil.

69
Figure 4.8 – Airfoils drag polars.
Figure 4.9 shows MS101_383 has a slightly lower maximum lift coefficient occurring at
approximately the same angle of attack of the other airfoils.
Figure 4.9 – Airfoils lift curves.
Figure 4.10 and Figure 4.11 show the transition point on the airfoil from laminar to turbulent
flow. On the underside of the airfoil, Figure 4.10 shows that the airflow remains attached for
a 𝐶𝑙 = 0.4 (laminar) throughout the entirety of the airfoil chord.
0
0.2
0.4
0.6
0.8
1
1.2
1.4
1.6
1.8
0 0.01 0.02 0.03 0.04 0.05 0.06 0.07 0.08
Cl
Cd
MS101_383(ReSqrt(Cl)=200000)
MS115_437(ReSqrt(Cl)=200000)
MS101_383(ReSqrt(Cl)=100000)
MS113_310(ReSqrt(Cl)=100000)

70
Figure 4.10 – Lower surface transition curves.
On the upper side of the airfoil, Figure 4.11, it is shown that the airflow remains laminar until
90 % of the chord at a lift coefficient of 0.4. After this, the airflow transitions from laminar to
turbulent. It is desirable to delay the airflow separation as much as possible since laminar flows
have less overall drag. Sometimes, in a low Re number a reattachment bubble may form, that
is, the airflow will separate from the surface and then become reattached further downstream.
Figure 4.11 – Upper surface transition curves.
MS115_437 has a higher Pitching moment in Figure 4.12 than MS101_383.

71
Figure 4.12 – Airfoil pitching moment comparison.
4.2.2 Fowler Flap
With the preliminary version of the airfoil designed for the current ACC airplane, Figure 4.13
shows the geometry of the 0.3𝑐 Fowler Flap to use with a maximum lift coefficient flap design
condition of -0,025 gap, 0,02𝑐 overlap, 30º deflection. Figure 4.14 shows the results obtained
according to the methodology described in reference [16]. It is seen in the top left graph the
lift curve showing a maximum lift coefficient of about 3. In the top right, the drag polar shows
a reasonable profile drag in the lift coefficient interval of 2 to 3. In the lower left, the
aerodynamic efficiency versus lift coefficient shows values of about 30 for the same lift
coefficient interval (although the simulations seem to over predict the drag coefficient because
they do not predict the transition position correctly). In the lower right, the pitching moment
coefficient versus lift coefficient shows a mean pitching moment coefficient of about -0.6
demanding for a high value of horizontal tail volume coefficient.
-0.18
-0.16
-0.14
-0.12
-0.1
-0.08
-0.06
-0.04
-0.02
0
-7 -2 3 8 13 18
Cm
α
MS101_383(ReSqrt(Cl)=200000)
MS115_437(ReSqrt(Cl)=200000)
MS101_383(ReSqrt(Cl)=100000)
MS113_310(ReSqrt(Cl)=100000)

72
Figure 4.13 - MS115_437 with the 0.3c Fowler Flap.
Figure 4.14 - MARS_UBI_ACC2017 Airfoil and 0.3C Fowler Flap geometry with -0,025 gap, 0.02C overlap,
30º deflection angle. Top left: lift curve. Top right: drag polar. Lower left: aerodynamic efficiency
versus lift coefficient. Lower Right: pitching moment coefficient versus lift coefficient.
Figure 4.15 and Figure 4.16 show the final mechanism design. Figure 4.15 shows the design of
the mechanism in the Dassault Systems SolidWorks software for one reference position along
the wing span, with the dimensions of the bars. Figure 4.16 shows the Fowler flap motion from
the retracted position up to the designed flap extension: initial retracted position a),
intermediate position b) and final extended position c).
0 5 10 15
0.0
1.0
2.0
3.0
4.0
α [º]
Cl
0 0.05 0.1 0.15 0.2
0.00.51.01.52.02.53.03.5
Cd
Cl
0.0 1.0 2.0 3.0 4.0
0
10
20
30
40
Cl
L/D
0.0 1.0 2.0 3.0 4.0
-0.8
-0.6
-0.4
-0.2
0
Cl
Cm

73
Figure 4.15 - Design of mechanism in Dassault Systems SolidWorks software.
The finished Fowler flap mechanism has a weight between 20 to 24gr, once assembled,
depending on the wing span position. The lighter (around 20 gr) corresponds to those placed
towards the tips of the wing while the heaviest one (24 gr) is placed at the root of the wing.
Elastic bands ensure that the Fowler flap returns to the retracted position. (See Figure 3.14).
The actuation of full the Fowler flap mechanisms set was meant to be performed by a high
torque servo placed in the wing root region pulling Dyneema® strings, one for each span position
flap mechanism. One of the difficulties to implement the actuation system was the difference
of the extension length according to the span position of each flap mechanism. This was
overcome by pulling each string by a dedicated pulley with the correct diameter for the
corresponding extension mechanism span position.
Figure 4.16 – Final design of the Fowler flap extension actuation mechanism. a) initial position, b)
intermediate position and c) final extended position.

74
Figure 4.17 -Built 3D print Fowler flap actuation mechanism.
Parametric Studies
Figure 4.19 shows the study of the chord influence on the flight task points. It is seen that there
is an optimal chord at 0.22m, but this is too small from a structural standpoint. So, as in most
engineering problems, since the formulation is not perfect, there is never a perfect
multidisciplinary optimization and a good compromise must be chosen as a design point.
Figure 4.18 - Parametric study results regarding the chord influence on the flight task points. (b=4.26m)
considering a constant TOW.
Figure 4.19 shows the parametric study results regarding the chord influence on the flight task
points for different spans considering the TOW is limited by the 60m TO run. Greater chords for
the same wingspan will naturally result in both higher takeoff weight as well as more flight task
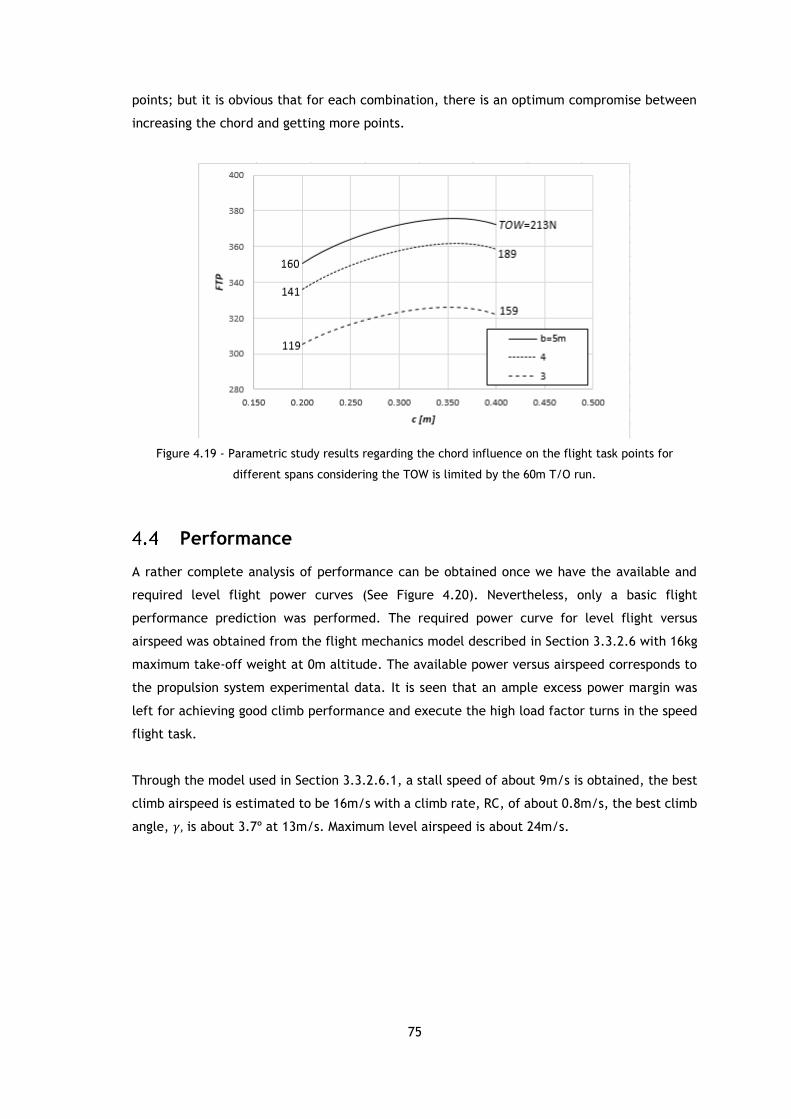
75
points; but it is obvious that for each combination, there is an optimum compromise between
increasing the chord and getting more points.
Figure 4.19 - Parametric study results regarding the chord influence on the flight task points for
different spans considering the TOW is limited by the 60m T/O run.
Performance
A rather complete analysis of performance can be obtained once we have the available and
required level flight power curves (See Figure 4.20). Nevertheless, only a basic flight
performance prediction was performed. The required power curve for level flight versus
airspeed was obtained from the flight mechanics model described in Section 3.3.2.6 with 16kg
maximum take-off weight at 0m altitude. The available power versus airspeed corresponds to
the propulsion system experimental data. It is seen that an ample excess power margin was
left for achieving good climb performance and execute the high load factor turns in the speed
flight task.
Through the model used in Section 3.3.2.6.1, a stall speed of about 9m/s is obtained, the best
climb airspeed is estimated to be 16m/s with a climb rate, RC, of about 0.8m/s, the best climb
angle, 𝛾, is about 3.7º at 13m/s. Maximum level airspeed is about 24m/s.

76
Figure 4.20 - Available and required power versus airspeed.
4.4.1 Estimated Payload Versus Altitude
The ACC17 regulations require that a payload versus density altitude prediction chart is
presented for the aircraft. The variation of the payload that the aircraft can carry as a function
of altitude is shown in Figure 4.21. To obtain these results, the calculation method presented
in Section 3.3 was used; the altitude changed while the payload was the value adjusted such
that the take-off 60m distance requirement was met. These results are optimistic prediction
because the propulsive model was not corrected for the altitude change.
Figure 4.21 – Payload versus altitude prediction.
y = -0.0006x + 13.103
11.6
11.8
12.0
12.2
12.4
12.6
12.8
13.0
13.2
0 500 1000 1500 2000
mp
ay[k
g]
h [m]
Vstall Vclimb Vmax

77
4.4.2 XFLR5 Final Design Wing Performance
The final wing design point is 4.2m for the span and the mean aerodynamic chord is 0.26m,
with one central panel, and two panels on the tips. Small wingtip panels are used do
accommodate the wingtips dihedral.
Figure 4.22 shows the initial design and the final design wings drag polars. The final wing design
is seen in Figure 4.23. It is clear that the final wing drag polar has been shifted to the right and
down corresponding to a faster and aerodynamically cleaner final wing design. This means that
there will be a higher excess thrust and that the maximum airspeed will also be higher since
the available thrust curve will intercept the graph at a higher airspeed
Figure 4.22 -Wing Drag polar comparison.
2
3
4
5
6
7
8
10 15 20 25 30 35
Dra
g[N]
V [m/s]
Final Wing
Initial Wing
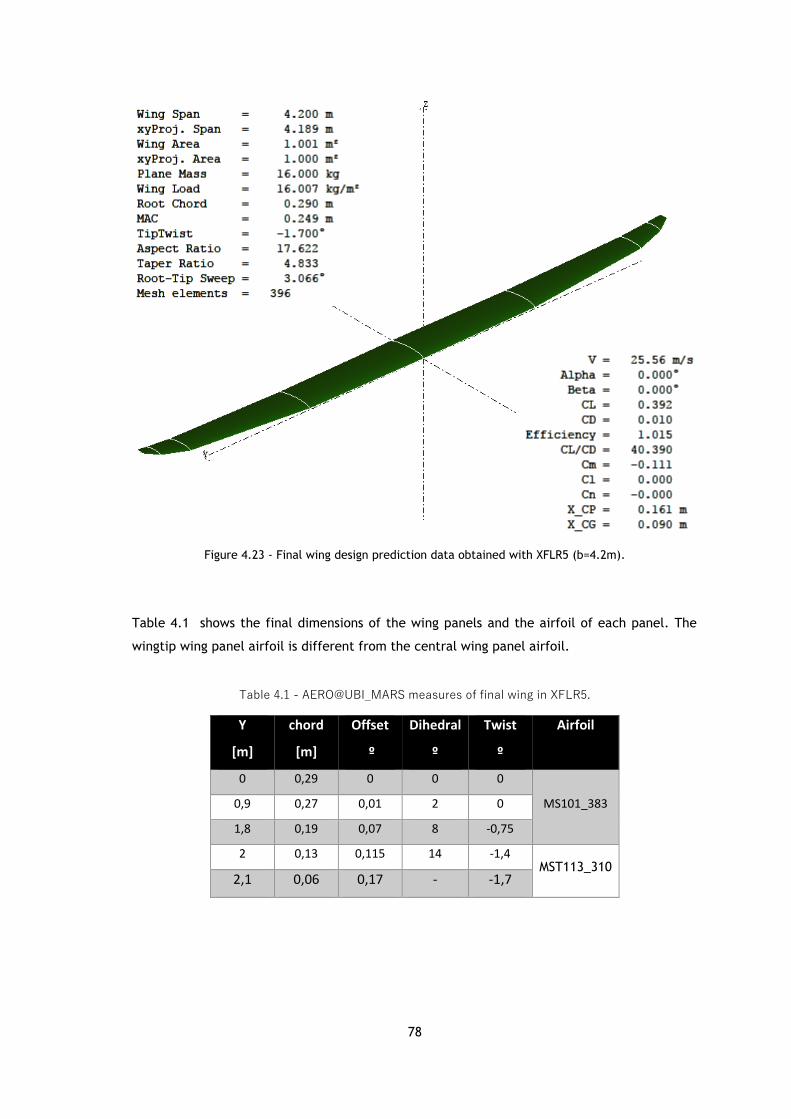
78
Figure 4.23 - Final wing design prediction data obtained with XFLR5 (b=4.2m).
Table 4.1 shows the final dimensions of the wing panels and the airfoil of each panel. The
wingtip wing panel airfoil is different from the central wing panel airfoil.
Table 4.1 - AERO@UBI_MARS measures of final wing in XFLR5.
Y
[m]
chord
[m]
Offset
º
Dihedral
º
Twist
º
Airfoil
0 0,29 0 0 0
MS101_383 0,9 0,27 0,01 2 0
1,8 0,19 0,07 8 -0,75
2 0,13 0,115 14 -1,4 MST113_310
2,1 0,06 0,17 - -1,7

79
Stability and Control
Using the model described in Section 3.3.2.5, the ACC17 aircraft has a static margin above
+0.15, thus guaranteeing adequate level of static longitudinal stability. The actual airplane
proved stable in all axes during the final test flights before the competition but the Fowler
flaps were never deployed.
Final Airplane
4.6.1 Final Airplane 3D CAD
The final aircraft was drawn on DS CATIA V5, see Figure 4.24.
Figure 4.24 – Final aircraft, designed in CATIA V5.
Once the design was finished in CATIA V5, we obtained the 3 view drawings of Figure 4.25.

80
Figure 4.25 – 3 View drawings of the ACC 2017 plane.
To draw the fixed wing aircraft in CATIA V5, the dimensions of Table 4.2 were used. This table
shows additional and detailed information regarding the wing and tail panels.
Table 4.2 - AERO@UBI_MARS airplane dimensions.
Vertical Tail Horizontal Tail Wing
b [m] 0.4 0.72 4.2
cRoot [m] 0.24 0.2 0.29
cTip [m] 0.14 0.12 0.06
Area [m2] 0.04 0.1152 1
Airfoil NACA0009 NACA0009 MS101_383 and MST113_310
4.6.2 Flight Test Aircraft
Figure 4.26 shows the aircraft before one of the flight tests. The major problem that was faced
was the lack of time, which prevented the team from being able to implement the Fowler flap
actuation system and to complete the flight intended testing program and pilot training
required for the ACC competition. The initial test flight was a slope soar in the mountain with
tail surfaces that belonged to the ACC15 UBI’s airplane. Only one take-off was performed with
3.5 kg payload (the <60m distance was met) and the actual airplane tail surfaces but vertical

81
tail flutter was encountered because the hinge was placed behind the one quarter position of
the mean vertical tail chord and the actuation servo was attached to the rear of the rudder in
a special actuation mechanism. This problem was corrected for the competition.
Figure 4.26 – The finished aircraft.
4.6.3 Wing Structure Testing
A structural test was performed to simulate the 160N (equivalent to two lead-acid batteries
used as load). Figure 4.27 shows two people lifting the wings by their tips as defined in the
ACC17 regulations. Only after this wing bending structural test that validated spars, the
separation of the panels was performed such that the airplane could fit inside the
transportation box. The wing panels interfaces hard points should have been placed when the
two wing halves were joined. Unfortunately, despite being ready to be used, they were
forgotten outside in the pressure of the delayed construction. This proved impossible to
overcome before the competition deadline preventing the airplane from flying in ACC2017.
Figure 4.27 – Wing structural test.

82
The final wings weight was about 2.3kg (a value that exceeded the prediction) but test flights
proved that the sandwich construction employed was perhaps too resistant (thus too heavy)
since the aircraft crashed several times but the wing remained intact, except for one flight, in
which the wing struck directly a rock and damaged the leading edge of one of the panels on
the left wing. The repairs with carbon and resin were quick and easy to perform.
ACC17 Participation
During the first day of the contest, the oral presentations were performed, as well as the
technical inspections. Since AERO@UBI_MARS was team number one, they performed the oral
presentation first (as well as showing the flight test video). In this part of the contest, the team
got 85.5 points.
During the second day, the team worked to finish the wing panel interfaces, which had not
been placed in the wing at the right time. The team tried to glue the interfaces hardpoints
with 15-minute epoxy but without success because the access to the inside of the wing to place
the glue was almost impossible.
On the third day, the team glued the interfaces and passed the technical inspection. The team
tried to perform a flight with 5 kilograms payload. Since we were unable to install the Fowler
flap mechanism, maximum lift coefficient was severely reduced and thus takeoff performance
was hampered. Although the team passed the structural test, the aircraft was unable to take-
off in 60 meters and the flight was declared invalid. The attention of UBI for the last flight
round turned exclusively to the second UBI airplane because it had flown 3 times but none valid
and was in a better position to obtain a valid flight.
The team AERO@UBI_MARS in Figure 4.28 finished in 23rd place with only 85.50 points. The
second UBI ACC17 airplane, Team AERO@UBI_PVG Figure 4.29 got the 20th place, with the valid
flight in the 5th flight (and last) round of the competition. This was the worst result UBI got in
an ACC edition so far, but the lessons learned will surely strike home and help to succeed in
the future.
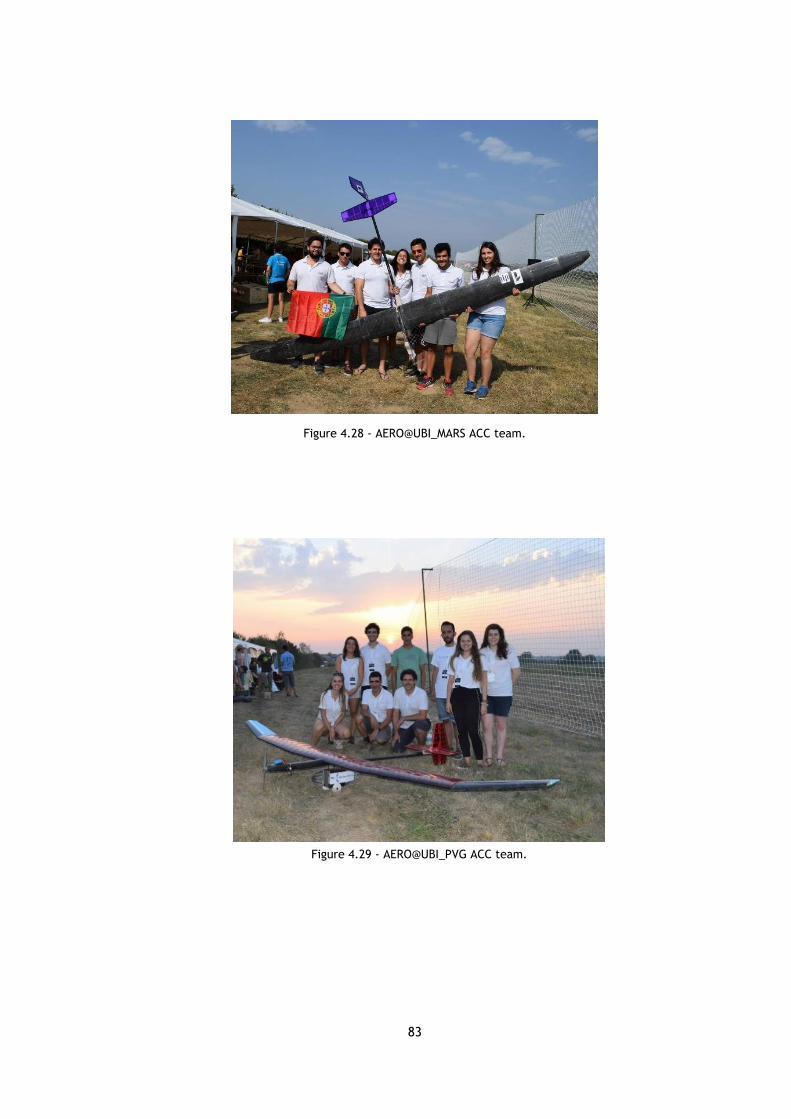
83
Figure 4.28 - AERO@UBI_MARS ACC team.
Figure 4.29 - AERO@UBI_PVG ACC team.

84

85
5 Conclusion
This Dissertation documented the development and participation of UBI’s AERO@UBI_MARS
team in the Air Cargo Challenge competition thus archiving the accumulated know-how over
many participations in ACC editions. An analysis of previous competitors allowed the
identification of technologies that increase the competitiveness of the aircraft.
Using a combination of low fidelity models (Excel), medium fidelity models (XFOIL/XFLR5) and
high-fidelity models (OpenFOAM®), new low Reynolds number airfoils have been developed, as
well as a Fowler flap. The flap that was developed has an innovative extension mechanism that
should prove useful for UAV applications. Propulsion system tests have shown that heated LiPo
batteries and a carefull choice of the battery model can have a significant impact for higher
performance.
Flight tests with purpose built gliders have proved the effectiveness of roll spoilers for roll
control as well as the actual effectiveness of a low Reynolds number Fowler flap.
3D printing technologies and moulds have been used to build the wing shells and flap. The
construction of the wings with moulds has proven to be a challenge. The setbacks arising from
the lack of experience with this technology are part of the reason why the participation of UBI
in the ACC 2017 was not as successful as intended.
As future work, further research and experience with the mould construction technology should
be accumulated to ensure that UBI teams remain competitive in the ACC competition.

86

87
Bibliography
[1] Wikipedia, “Air Cargo Challenge,” 2017. [Online]. Available:
https://en.wikipedia.org/wiki/Air_Cargo_Challenge. [Accessed: 06-Sep-2017].
[2] Euroavia Stuttgart, “Regulations for the Air Cargo Challenge 2015,” no. October 2014,
2014.
[3] A. C. Challenge, “Requirements , Rules and Evaluation for the Air Cargo Challenge
2017,” 2016.
[4] S. GUDMUNDSSON, General Aviation Aircraft Design : Applied Methods, 2014th ed. UK,
2014.
[5] M. Sadraey, CHAPTER 5 WING DESIGN. .
[6] M. Drela, “Low-Reynolds-number airfoil design for the M.I.T. Daedalus prototype- A case
study,” J. Aircr., vol. 25, no. 8, pp. 724–732, 1988.
[7] M. S. Selig, “Low Reynolds Number Airfoil Design Lecture Notes - Various Approaches to
Airfoil Design,” Low Reynolds Number Airfoil Des. Lect. Notes - Var. Approaches to
Airfoil Des., no. November, pp. 24–28, 2003.
[8] A. Deperrois, “XFLR5: a tool for the design of airfoils, wings and planes operating at low
Reynolds numbers,” Softw. Packag., 2010.
[9] J. McArthur, “AERODYNAMICS OF WINGS AT LOWREYNOLDS NUMBERS: BOUNDARY LAYER
SEPARATION AND REATTACHMENT,” no. May, 2008.
[10] A. Stuttgart, “Air Cargo Challenge 2013 Project Report,” no. 27, 2013.
[11] J. Andrašec, M. Balaško, J. Čulina, and I. Knezović, “Projekt letjelice HUSZ Tern,” 2016.
[12] “AkaModell München e.V.,” 2015. [Online]. Available:
https://www.facebook.com/akamodell/photos/ms.c.eJxFjskNAwEMAjuKbHz331gUe8N
~_RzCgWaGWwFhXQj76AD2gBEgJR9cfmKEg40Ygm6hhpS~;RTPgBEORV6HDZWWHCbROZB
HdMeMz9B2K44nWV1zE7C14P20rzaZyj~_wXriCA4aVCachV8AS~;4QW0~-
.bps.a.1673960789505164.1073741830.1473247536243158/167. [Accessed: 11-Sep-
2017].
[13] “EUROLIFTER Team,” 2015. [Online]. Available: https://www.facebook.com/Eurolifter-
316214115167287/. [Accessed: 11-Sep-2017].
[14] M. A. R. Silvestre, J. P. Morgado, P. J. Alves, P. M. Santos, P. M. Gamboa, and J. C.
Páscoa, “Propeller Performance Data at Low Reynolds Numbers,” Int. J. Mech., vol. 9,
no. January, pp. 1–18, 2015.
[15] P. V Gamboa and M. A. R. Silvestre, “Airfoil Optimization With Transition Curve As
Objective Function,” VI Int. Conf. Adapt. Model. Simul. ADMOS 2013, no. June 2013,
pp. 1–12, 2013.
[16] A. Oliveira, “Low Reynolds Number Fowler Flap Design,” 2017.
[17] H. H. Wentz, W; C. Seetharam, “Development of a Fowler Flap System for a High-
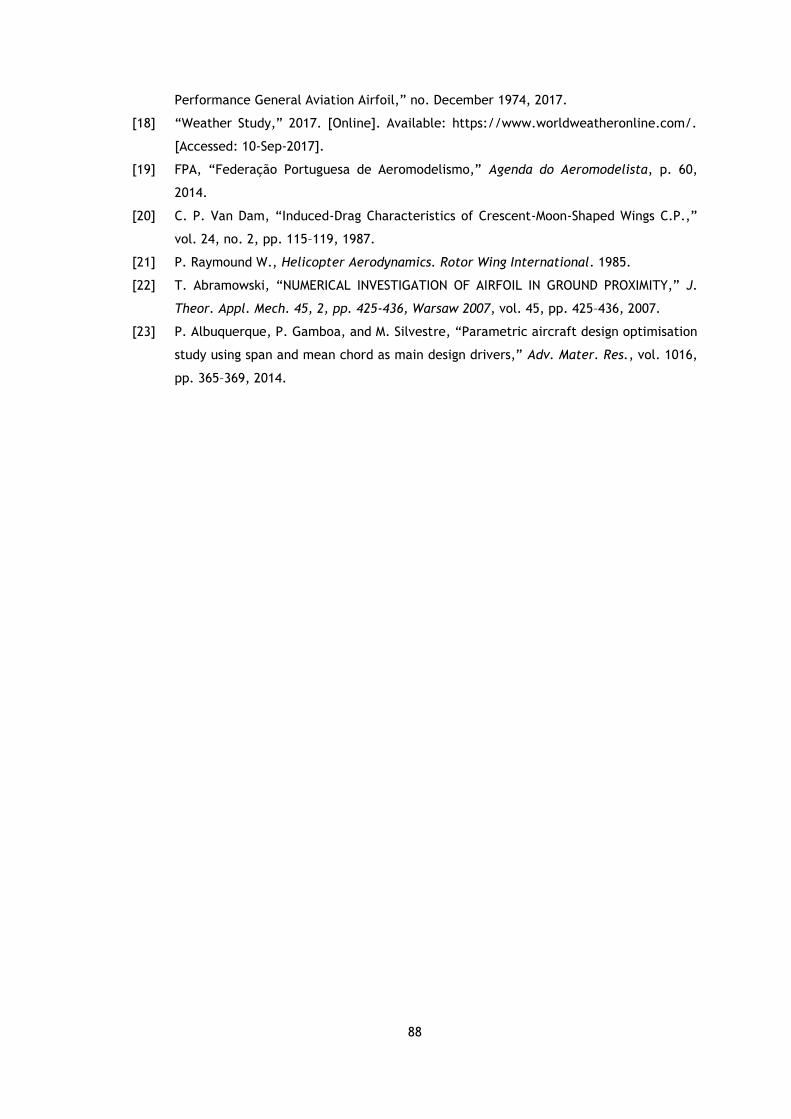
88
Performance General Aviation Airfoil,” no. December 1974, 2017.
[18] “Weather Study,” 2017. [Online]. Available: https://www.worldweatheronline.com/.
[Accessed: 10-Sep-2017].
[19] FPA, “Federação Portuguesa de Aeromodelismo,” Agenda do Aeromodelista, p. 60,
2014.
[20] C. P. Van Dam, “Induced-Drag Characteristics of Crescent-Moon-Shaped Wings C.P.,”
vol. 24, no. 2, pp. 115–119, 1987.
[21] P. Raymound W., Helicopter Aerodynamics. Rotor Wing International. 1985.
[22] T. Abramowski, “NUMERICAL INVESTIGATION OF AIRFOIL IN GROUND PROXIMITY,” J.
Theor. Appl. Mech. 45, 2, pp. 425-436, Warsaw 2007, vol. 45, pp. 425–436, 2007.
[23] P. Albuquerque, P. Gamboa, and M. Silvestre, “Parametric aircraft design optimisation
study using span and mean chord as main design drivers,” Adv. Mater. Res., vol. 1016,
pp. 365–369, 2014.