development of an integrated forest management a …
TRANSCRIPT

DEVELOPMENT OF AN INTEGRATED FOREST MANAGEMENT
DECISION SUPPORT SYSTEM: INTEGRATING THE LANDIS
MODEL AND ARCGIS
A Thesis presented to the Faculty of the Graduate School
at the University of Missouri-Columbia
In Partial Fulfillment
of the Requirements for the Degree
Master of Arts
by
ZHENQIAN LU
Dr. C. Mark Cowell, Thesis Supervisor
MAY 2007

The undersigned, appointed by the Dean of the Graduate School, have examined the thesis entitled:
DEVELOPMENT OF AN INTEGRATED FOREST MANAGEMENT
DECISION SUPPORT SYSTEM: INTEGRATING THE LANDIS
MODEL AND ARCGIS
Presented by Zhenqian Lu
a candidate for the degree of Master of Arts
and hereby certify that, in their opinion, it is worthy of acceptance.
Professor C. Mark Cowell
Professor Hong S. He
Professor Cuizhen Wang

ii
ACKNOWLEDGEMENTS
First I would like to express my deep and sincere gratitude to my advisor
Dr. Mark Cowell for giving me the guidance and the input on my thesis as well as
his extensive editing support. His understanding, encouraging and support have
provided a good basis for this present thesis. A special thanks to Dr. Hong S. He,
my project supervisor and my outside committee member, for providing me such
an excellent opportunity to study science and to improve my skills. His wide
knowledge and his logical way of thinking have been of great value for me.
Thank you also to Dr. Cuizhen Wang, who helped me complete my thesis with
her constructive and detailed comments.
I also want to thank the Department of Geography at the University of
Missouri - Columbia giving me the great opportunity to obtain my Master of Arts
Degree. Studying there has been an experience I will remember forever.
I would like to acknowledge my friends and colleagues who have helped
me through the master’s process. Jian Yang spent lots of his time for discussing
the thesis and providing unlimited assistance for the LANDIS model, thank you
for your effort! Also all the GIS labmates, Yangjian Zhang, Trent Holmes, Hojung
Kim, Jackie Schneiderman, thanks for your help and support.
Most of all I would like to thank my family. I owe my loving thanks to my
wife, Miaoer Lu, for always being there when I need her help and encouragement.
I would like to give my special thanks to my family members in China, thank them
for their love, hope and prayers.

iii
TABLE OF CONTENTS
ACKNOWLEDGEMENTS..................................................................... ii
LIST OF FIGURES ...............................................................................v
LIST OF TABLES ...............................................................................vii
ABSTRACT........................................................................................ viii
CHAPTER I: INTRODUCTION TO FOREST DECISION SUPPPORT
SYSTEMS............................................................................................ 1
1. What is a DSS?..........................................................................................1 2. Integration of DSS and GIS........................................................................4 3. DSS Support of Forest Management .........................................................5
3.1. Why should DSS be Applied in Forest Management? ........................5 3.2. Previous Use of DSS in Forest Management......................................6 3.3. Current Forest DSS Inadequacies ....................................................14 3.4. Limitations of Current LANDIS Interfaces .........................................15
4. The Purpose of this Research..................................................................17
CHAPTER II: INTRODUCTION TO THE LANDIS MODEL .............. 18
1. General Introduction to LANDIS 4.0.........................................................18 2. LANDIS Inputs .........................................................................................20 3. LANDIS Output ........................................................................................22 4. LANDIS 4.0 Interfaces..............................................................................22 5. LANDIS GIS Extension ............................................................................24
CHAPTER III: DEVELOPMENT OF THE FOREST MANAGEMENT
DECISION SUPPORT SYSTEM (FMDSS)....................................... 25
1. Objectives of the FMDSS.........................................................................25 2. Design Principles of the FMDSS..............................................................26 3. Implementation of the FMDSS .................................................................27
3.1 Development Environment................................................................27 3.2 Database Design ..............................................................................30 3.3 Decision Support Flow ......................................................................31

iv
3.4 FMDSS System Overview.................................................................34 3.5 Samples of Graphic User Interface ...................................................36
CHAPTER IV: APPLICATION OF FMDSS TO MARK TWAIN
NATIONAL FOREST ......................................................................... 41
1. Study Area ...............................................................................................41 2. Research Question ..................................................................................43 3. Data Preparation ......................................................................................45 4. FMDSS Application ..................................................................................49 5. Result.......................................................................................................52 6. Discussion................................................................................................56
CHAPTER V: DEVELOPMENT DISCUSSION AND THE FUTURE
DEVELOPMENT OF FMDSS............................................................ 61
1. System Structure......................................................................................61 2. GIS Component .......................................................................................62 3. Database Component ..............................................................................63 4. LANDIS Model Improvement....................................................................63 5. Future Development.................................................................................65
REFERENCES .................................................................................. 67
APPENDIX......................................................................................... 74
v
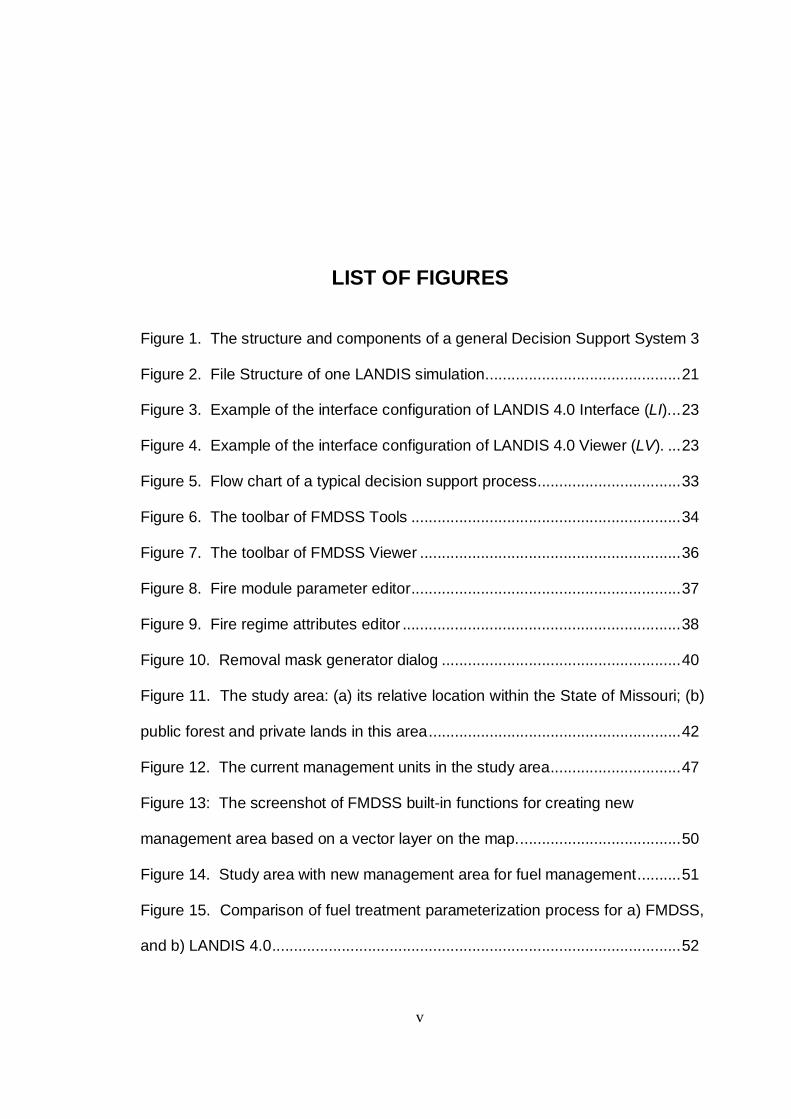
LIST OF FIGURES Figure 1. The structure and components of a general Decision Support System 3
Figure 2. File Structure of one LANDIS simulation.............................................21
Figure 3. Example of the interface configuration of LANDIS 4.0 Interface (LI)...23
Figure 4. Example of the interface configuration of LANDIS 4.0 Viewer (LV). ...23
Figure 5. Flow chart of a typical decision support process.................................33
Figure 6. The toolbar of FMDSS Tools ..............................................................34
Figure 7. The toolbar of FMDSS Viewer ............................................................36
Figure 8. Fire module parameter editor..............................................................37
Figure 9. Fire regime attributes editor ................................................................38
Figure 10. Removal mask generator dialog .......................................................40
Figure 11. The study area: (a) its relative location within the State of Missouri; (b)
public forest and private lands in this area..........................................................42
Figure 12. The current management units in the study area..............................47
Figure 13: The screenshot of FMDSS built-in functions for creating new
management area based on a vector layer on the map......................................50
Figure 14. Study area with new management area for fuel management..........51
Figure 15. Comparison of fuel treatment parameterization process for a) FMDSS,
and b) LANDIS 4.0..............................................................................................52

vi
Figure 16. The average fire size of the largest fire for 20 replicates in MTNF.....53
Figure 17. Variance for fire size between the new and current management
plans ...................................................................................................................55
Figure 18 An example of fire occurrence near the interface of public forest and
private lands........................................................................................................58
Figure 19. The present of dominate species at the simulation Year 20 in MTNF:
(a) Current proposed management plan and (b) New management plan ...........59

vii
LIST OF TABLES Table 1. Comparison of the Technical Characteristics of Eleven Major Forest
Management Decision Support Systems ..............................................................7
Table 2. LANDIS 4.0 Module Functions (Source: LANDIS 4.0 user’s guide,
2004)...................................................................................................................19
Table 3. Relationship between database tables and LANDIS parameters..........32
Table 4. Example of removal mask in LANDIS 4.0 harvest module. Each line is
for one species; the name between the pound signs each line is the Latin name
of the species......................................................................................................39
Table 5. The proposed fuel treatments for the study area (based on Shang et al.
2004)...................................................................................................................48
Table 6. Average number of different fire Classes in a) Public Forest, and b)
Private Lands......................................................................................................54
Table 7. Total burned area under the two management plans...........................55
Table 8. The number of cells dominated by each species in the simulation at year
20........................................................................................................................59

viii
DEVELOPMENT OF AN INTEGRATED FOREST MANAGEMENT
DECISION SUPPORT SYSTEM: INTEGRATING THE LANDIS
MODEL AND ARCGIS
Zhenqian Lu
Dr. C. Mark Cowell, Thesis Supervisor
ABSTRACT
From the advent of Decision Support Systems (DSS) in the mid-1960s,
researchers and information technologists have developed interactive information
systems that use data and models to help managers analyze semi-structured
problems and make optimal decisions. With the accelerating development of GIS
since the 1970s, the integration of DSS and GIS is a next step to extend the
range of decision support applications by incorporating more spatial components
into the decision-making process.
Forest management is an important field for DSS application, but most of
the current DSSs for forest management are not fully successful because: 1) the
user interface is not friendly, or 2) GIS functions are not fully integrated into the
system. These limitations unnecessarily reduce the use of DSS planning tools by
forest managers, and decrease practical feedback from managers that could aid
in further development of the landscape models.

ix
This research presents a universal method to develop a Forest
Management Decision Support System (FMDSS) by integrating the LANDIS 4.0
model with the ESRI ArcGIS platform. FMDSS was developed with Visual Basic,
ESRI ArcObjects libraries and Microsoft Access database. Not only does
FMDSS make the preparation of simulation parameters easy for forest managers
with friendly graphic interfaces, it also makes available the powerful GIS
functions and spatial data processing capabilities of the ESRI ArcGIS platform.
FMDSS eliminates the time-consuming parameter editing work necessary for the
LANDIS model, simplifies the technical operations of running the model, and
allows managers to focus on evaluating their management plans, rather than on
the LANDIS program. A case study is presented, applying FMDSS to data from
the Mark Twain National Forest. This demonstration illustrates how the analysis
process is both simplified and made more powerful with FMDSS. The example
modifies the spatial units employed in forest fuel management, producing
significantly different fire behavior outcomes than were modeled in LANDIS
without the spatial capabilities of FMDSS.

1
CHAPTER I: INTRODUCTION TO FOREST DECISION SUPPPORT SYSTEMS
1. What is a DSS?
A decision support system (DSS) is generally defined as “a computer-
based system that aids the processing of decision making” (Finlay, 1994). On
the other hand, the Encyclopedia of Library and Information Science states that
the concept of a DSS is extremely broad and its definitions vary depending upon
the author's point of view (Druzdzel and Flynn 1999). Many information scientists
and technologists have built their own definitions based on their research and
understanding (Keen and Morton, 1978; Keen, 1980; Sprague and Carlson, 1982;
Finlay, 1994; Turban, 1995). This thesis adopts Turban’s (1995) definition: “a
DSS is an interactive, flexible, and adaptable computer-based information
system especially developed for supporting the solution of a non-structured
management problem for improved decision making. It utilizes data, provides an
easy-to-use interface, and allows for the decision maker's own insights."
Although the definitions of DSS are strongly dependent on the DSS
application context, some common features of a DSS include:
1. Computer-based/Computer-assisted: The powerful calculation capabilities
of computers provide the possibilities of immediate decision-making, because

2
sometimes decisions are required to be made rapidly, such as forest fire
monitoring or stock exchange analysis. Extending the application of DSS
partially depends on further development of computer science, which is why
the theoretical studies of organizational decision making done at The
Carnegie Institute of Technology during the late 1950s and early 1960s did
not emerge as DSS until the late 1970s. Because powerful computers are
needed for processing large volumes of spatial data, the idea of a spatial DSS
(SDSS) did not evolve until the mid-1980s (Armstrong et al., 1986).
2. Interactive: DSS is a flexible system. It can take many possible inputs to
simulate results to a research problem. Only through a well-designed user
interface will the DSS effectively integrate the research effort and possible
outcomes and translate the result into a reasonable management strategy.
Thus, a user-friendly interface is a key point of a successful DSS and the
prerequisite for sustained acceptance of a DSS by users.
3. Compound: DSS is widely used in many fields today from conventional
financial management to strategic decision-making, but different researchers
identify different components in a DSS, just as they give different definitions
for a DSS. Generally, all of the descriptions include four main components
(Hättenschwiler, 1999; Marakas, 1999; Haag et al., 2000; Power, 2002; see
Figure 1):
• Database Management System (DBMS), which is a complex set of
software programs that organize, store and retrieve data from a database.

3
Data preserved in the database serves as the parameters for running the
DSS.
• Model Component (MC), which includes the scientific models in the
application domain. The model component indicates and controls how DSS
interacts with the input parameters. The quality of the model directly affects
the accuracy and effectiveness of the DSS.
• User interface, which is the aggregate means by which the users interact
with DSS. It is the software system linking the user with DBMS and the MC
(Sprague, 1980). The design of user interface is not only time-consuming, but
it is also critical for effective system performance. A deficient interface may
eventually result in poor performance, system failure and user complaints.
• Users are the stakeholders or policy makers, who run the DSS.
Figure 1. The structure and components of a general Decision Support System
User Interface
DBMS MC
User

4
2. Integration of DSS and GIS
It is acknowledged that DSS originated from the Management Information
System (MIS; Davis, 1974) and it was applied in large companies to support
managers conducting interactive financial planning. From the advent of DSS in
the mid-1960s (Power, 2003), a number of researchers and information
technologists have developed interactive information systems that use data and
models to help managers analyze semi-structured problems. After the 1990s,
DSS had evolved out of its business and industrial data processing tradition and
entered into other fields, such as agriculture and forestry.
Geographic Information Systems (GIS) were first used in the early 1960s
in Canada, largely for automatic mapping purposes. Many of the basic concepts
in GIS were introduced later, and their widespread implementation and
application awaited further developments of computer technology. As computer
systems became more powerful and the GIS technology relatively mature, some
DSS type applications began to involve GIS to display maps or employ spatial
information in the decision process (Power, 2003).
In the 1970s, while both theory and practice issues related to DSS were
developing in the industrial and academic community, a separate trend of
development took place in the GIS field, with developments largely concentrated
on geographic data processing applications (Nagy and Wagle, 1979). The
development of GIS provides an important source of tools and techniques which
can usefully be incorporated in a DSS system to make use of geographic or
spatial data.

5
There is a need for approaches that combine available quantitative data,
spatial data and modeling capabilities. As two largely distinctive areas of
research until recently, DSS and GIS can benefit from each other. The
integration of DSS and GIS extends the range of decision support applications
and has become a growth area in the application of GIS technology (Muller,
1993). This integration has been determined not as much by the innovative use
of technology, but by how well they support the need for a spatial component to
decision-making (Keenan, 1997).
3. DSS Support of Forest Management
3.1. Why should DSS be Applied in Forest Management?
Forest management is an important application field for Decision Support
Systems, and DSS is a practical and effective way to integrate knowledge and
models to improve forest management decision-making. Because forest
management is a long process, real-world outcomes can not be examined until
after several decades or even a few hundred years. DSS provides an efficient
tool to project long-term forest dynamics. Forest DSS are based on formalized
knowledge and models including ecophysiology, statistical interference and
biomathematics, which predict future forest states and changes (Blake et al.
1990, Sharpe 1990, Stage, 2003). The DSS should contain a user-friendly
interactive interface enabling the decision maker to change the preferences and
assess the impacts of possible solutions. If all the settings and simulation results
are reproducible and easily to document, it is possible for the decision maker to

6
compare and select the optimal management plan. Thus, through the use of DSS,
the decision maker can arrive at a decision that is as rational as possible.
3.2. Previous Use of DSS in Forest Management
In 2005, the National Council for Science and the Environment (NCSE)
launched a research project (NCSSF Project A10, 2004) to evaluate the current
systems and future needs on decision support systems for forest biodiversity.
This project compiled and reviewed over 100 available DSSs and compared
about 30 of those most applicable to forest biodiversity issues. Of those
reviewed systems, eleven DSSs (Table 1) focus on forest management practices,
the focus of this thesis, so parts of the following review draw on their findings.
While the NCSE (2005) review focuses on forest biodiversity, the following
review highlights the technical characteristics of these forest DSSs: including
input data requirements, user-friendliness, integration with GIS (spatial analysis
capabilities), functionalities for analysis of results, and flexibilities to extend
model evaluations.
The Rocky Mountain Research Station developed a spatially explicit,
landscape level modeling system, SIMPPLLE (SIMulating Patterns and
Processes at Landscape scales), to serve as a decision support system for forest
managers that would project temporal changes in the spatial distribution of
vegetation and its interaction with insects, disease, and wildland fire (Chew et al.,
2004). The system is created in Java and can be run under any environment that
has Java Virtual Machine installed. SIMPPLLE provides a user friendly GUI,

7
enabling the user to view and edit the parameters easily before a simulation is
executed. The input files for this system are existing inventory data in polygon or
Table 1. Comparison of the Technical Characteristics of Eleven Major Forest
Management Decision Support Systems
Name
Graphic
User
Interface
Input Data
Format
(ASCII/DB)
GIS Data
Input
GIS
Extensiton
System
Expansibility
SIMPPLLE Yes ASCII Yes Yes Yes
FVS Yes ASCII No No No
LANDSUM No ASCII Yes No No
LMS Yes ASCII No No Yes
RELMdss Yes ASCII Yes Yes Yes
Spectrum Yes ASCII Yes Yes No
VDDT Yes ASCII No No No
EMDS Yes ASCII Yes Yes Yes
MAGIS Yes ASCII Yes Yes Yes
NED Yes DB Yes Yes Yes
LANDIS Yes ASCII Yes Yes Yes
grid format from an Arc/Info GIS system. An AML is provided to process the plant
Criteria

8
community data represented in GIS format. Additionally, ArcView and ArcGIS
extensions have been developed for spatial output display. An Excel spreadsheet
with statistical macros is provided to test for differences between levels of
disturbance processes or vegetative attributes with different management
alternatives. The system also can be used with other modeling systems such as
the optimization/scheduling model MAGIS (Zuuring et al., 1995, SIMPPLLE
website).
Forest Vegetation Simulator (FVS) is a model developed by the USDA
Forest Service to predict forest dynamics. FVS can simulate a wide range of
silvicultural treatments for tree species, forest type and stand conditions based
on the local tree growth rates in the study area. This system is a Windows
program with a graphical user interface which can read inventory data from
various sources. It has no GIS spatial analysis function and needs no GIS
environment to support its simulations. Some extensions have been developed to
address the effects of disturbances like insects and fire, as well as to take the
FVS output file and render images of how the stand might look on the ground
(Hawkes et al. 2006, Beukema et al., 1999, NCSFF, 2005).
LANDSUM is the acronym for LANDscape SUccession Model. The
system was developed as a research tool to model landscape processes such as
succession, fire, disease and harvest by the USFS – Missoula Fire Sciences Lab.
The program is run in the MS-DOS environment without GUI or GIS analysis
capabilities. LANDSUM inputs include ASCII files and GIS themes (polygon or
raster). Although LANDSUM is a spatial model, pixels or polygons may not be

9
influenced by spatial context, that is, the current state of the pixels or polygons
around them (Barrett, 2001).
The Landscape Management System (LMS) was developed by the
University of Washington, Yale University, The Cradle of Forestry in America and
the USDA Forest Service to facilitate the analysis and communication of
landscape-scale forest management decisions. From its website, the system
coordinates several existing applications: Oregon growth model (ORGANON, an
individual tree growth model developed for Southwest Oregon, Northwest
Oregon) to estimate tree growth in the Pacific Northwest; FVS to estimate tree
growth throughout the United States; Stand Visualization System for stand level
visualization; EnVision for landscape level visualization and Python programming
language for the implementation of some analysis and tabular output (LMS
website, 2006). It is implemented as a Windows application with graphic user
interface but the data it processes are ASCII data or tabular data, hence it lacks
spatial data processing capabilities. Since LMS is comprised of many separate
programs, it can be considered an expandable system with great flexibilities: any
changes or upgrades in its components will not cause major expense or changes
to equipment or the software environment and adding new functions does not
change the implementation of the existing ones.
Regional Ecosystems and Land Management Decision Support System
(RELMdss), developed by the USDA Forest Service Inventory and Monitoring
Institute, is a Linear Programming (LP) based optimization program which
proportions forest-wide, strategic planning solutions to tactical sub-units of the

10
forest (RELM website, 2006). This model proposes a method for generating
alternatives within a location-allocation module and to spatially direct searches
for alternatives. The program provides a graphical user interface to present the
results. The model also can be integrated into a commercial GIS system. Dippon
et al. (1999) introduced an approach that inserts RELMdss into ArcView GIS
format to allow field staff to develop and evaluate alternative forest plan
implementation strategies.
Spectrum is user-friendly software designed and maintained by the USDA
Forest Service. It was programmed to explore alternative resource management
scenarnios applied to landscapes through time, aiding decision makers in
strategic and tactical planning (Spectrum website, 2005). The model formulation
is flexible and data are in xBase format with online help support, and much of the
model data can be easily imported. Spectrum needs the license of C-WHIZ from
Ketron Management Science to support the model. No GIS functionalities are
provided with this program although an extension to ArcView GIS, SpectraVision,
was created to allow the model to be linked to the full analytical and display
functions of ArcView (Spectrum website). The model is not upgraded frequently.
The Vegetation Dynamic Development Tool (VDDT) is a user-friendly,
Windows-based program that allows users to easily create and test descriptions
of vegetation dynamics, examine the role of various disturbance agents and
management actions in vegetation change over a landscape level. It is designed
by ESSA Technologies Company in Canada. VDDT is not a spatial model, so
has no spatial data processing or spatial analysis funcitonalities and no

11
extensible capabilites (VDDT website, 2006). The input files are in ASCII txt
format and the results produced are graphs and text.
The Ecosystem Management Decision Support (EMDS) system is an
application framework for knowledge-based decision support of ecological
assessments at any geographic scale. The system provides decision support for
landscape-level analyses through logic and decision engines integrated with
ArcGIS 8.1. It integrates GIS with knowledge-based reasoning and decision
modeling technologies in the Microsoft Windows environment. The system is a
product of the USDA Forest Service and available free of charge to the public. It
is practical to extend the EMDS functions, but there are two commercial
application systems requires in conjunction with EMDS in order to create or edit
logic models - NetWeaver Developer (for landscape evaluation) and Criterium
DecisionPlus (for decision planning). EMDS is an ArcMap extension, so ArcGIS
8.0 or later is required to support and run it. Furthermore, it includes other
components, like Priority Analyst and Data Acquistion Manager (EMDS website).
EMDS can be regarded as a successful DSS-GIS system for the evaluation of
ecosystem managements decisions.
MAGIS is the acronym for Multi-resource Analysis and Geographic
Information System. It is developed by USDS Forest Service Rocky Moutain
Research Statiion and University of Montana. MAGIS is a spatial decision
support system for integrating vegetation managements and road-related
activities including construction, reconstruction and obliteration (MAGIS website,
2006). From its name, it is clear that one of this DSS’ components is a GIS
12
system with spatial data display and processing capabilities. ArcGIS 8.1 or
above is necessary to run MAGIS. GIS coverages or shapefiles attributed with
vegetation data and any additional nonspatial attributes for user-defined
relationships are input. If road-related activities are analyzed, the road network
coverage data should be provided. MAGIS output is alternatives for land
management plans, which include maps of treatment schedules, map of road
“schedules” and map displays of road effects. The primary role of MAGIS is to
schedule suitable treament plans which meet resource and management
objectives, and as a tool for alternative optimization studies. The combination of
MAGIS and SIMPPLLE model provides a powerful analystical mothodology for
anlyzing, developing and evaluating spatial and temporal treament alternatives
(Jones et al., 2003).
NED is another decision making tool widely used throughout the East
Coast to help prepare forest management plans. The system is a series of
natural resource-related software developed collectively under the name NED,
which includes Forest Stewardship Planning Guide, NED/SIPS, NEWILD and
NED-1 (Twery et al., 2000). Due to the comprehensive and flexible design of the
program, the NED input data requirements are extensive and some parameters
are set by the managers at a summary level, for example, forest inventory data,
and will undoubtedly reduce the model’s reliability (Twery, published online).
Although the first version of NED has no GIS functions, Nute et al. (2005) present
a flexible and extensible method to update and expand the NED system into
NED-2. NED-2 is designed with C++ object-oriented technology and integrated

13
with ArcGIS. The new NED-2 system incorporates a number of models and
decision making tools, like growth-and-yield models, wildlife models, fire risk
models, goal satisfaction analysis, and report generation (Nute et al., 2005). The
design idea of its open architecture software and the flexible expandibility is an
important aspect to be considered in the DSS developed in this thesis.
Finally, LANDIS is a spatially explicit landscape simulation model
designed to simulate forest landscape change over large spatial and temporal
scales (Mladenoff et al., 1996, Mlandenoff and He, 1999). It models natural
processes, such as wind, fire, biological disturbance agents, fuel, harvest,
succession and forest management treatments. LANDIS is a raster system and
the input data are in ASCII format or older ERDAS IMAGINE GIS files. It has no
spatial data processing or analysis capabilities. It does provide an extension
(LDAVI, LANDIS ArcView Interface) to ESRI Arcview 3.x, that allows the users to
view the simulation results of LANDIS output. However, ESRI will no longer
support or upgrade ArcView 3.x, and as LANDIS also evolved to version 4.0, the
file infrastructure has changed from the older 3.x version, so that LDAVI no
longer works properly. From version 4.0, LANDIS provides another two
Windows-based programs to edit the parameters (LANDIS Input) and view the
simulation output (LANDIS View).
From this review of DSS systems, it is clear that the construction of DSSs
has been evolving rapidly in recent years. All the approaches attempt to provide
user-friendly interfaces, good expandibility potential, and reliable models. A
common trait of many of these systems is an extention or external program

14
linking to GIS software, like ArcView GIS 3.x or ArcMap, which furnishes a
convenient and mature method to check the input spatial data or represent the
simulation results. Most of the systems use ACSII files for data input, which can
be viewed or edited in any text editor, such as Windows notepad. This is
acceptable for prototype versions of these models, because more parameters
may be added or the data structure may need changes, but once the models are
mature and fixed, database management systems should be introduced into the
decision support system.
3.3. Current Forest DSS Inadequacies
In some ways, the achievements of decision support systems in natural
resource management have been rather unsatisfactory (Marco et al., 2005, Uran
and Janssen, 2003, Walker, 2002). One reason is that parameters for a forest
DSS simulation often become too complex for a user, and the user can easily
feel overwhelmed by the simulation process. A friendly graphic user interface
and ease of use are two important and basic characteristics for a successful DSS.
Another limitation is that forest management should not only consider forest
inventory information, but also geographical parameters such as location,
distance, proximity, and topography. Although some forest DSS have
geographic information processing capabilities, those without are less likely to be
entirely useful. Presentation of simulation output also affects users’ satisfaction
with the DSS system; while the systems described above generate output in the
form of tables, graphs or maps, many require external programs to process this
output, such as Microsof Excel and ESRI ArcView/ArcGIS.

15
3.4. Limitations of Current LANDIS Interfaces
The LANDIS model, as a forest decision support system, is a successful
one whose capabilities stand out in several important categories (Gordan et al.,
2004). However, this program is not designed for widespread adoption by users
and requires a substantial investment in learning the details of the software. That
is not an exclusive problem for LANDIS, as many forest models have the same
issue. Yet for this reason, few DSS models have gone beyond academic
prototypes to make them more widely accessible and even fewer have been
involved in realistic forestry planning and management. There are two ways to
change the situation: one is to simplify the models without sacrificing their
reliabilities; the other is to make easy-to-use, error-tolerated and robust software.
The second road is followed for this project.
Although the current LANDIS version includes LANDIS Interface (LI) for
easy editing of parameters, this program indeed is only an enhanced text editor,
which simply links the parameter files together and enables the user to open
them in one Multiple Document Interface (MDI). The text editor environment
causes several problems. First, there is no error-proof function for the text editor.
The text file may accept any input characters even if they are meaningless for the
model, and thus the user may, for example, input a text string for the longevity of
a species by mistake. Moreover, some of the LANDIS parameters are error-
prone, such as the “removal masks” parameter in the treatment plan, which
consists a series number of “1”s and “0”s whose length are exactly the same as
the species’ longevity. Any error in the parameter files will halt the LANDIS

16
simulation. Because LI is essentially a text editor, it is not a real graphic user
interface with menus or buttons. The complexity of parameters and unfriendly
interfaces lengthens the users’ learning process.
LANDIS View (LV) is a program to display the LANDIS simulation output.
All the “maps” (not really maps because no scale, annotations, coordinates, or
projection information are available) are shown only with predefined color
schemes. Because it is a simple raster display tool, the display and refresh
speed of LV is rapid. However, LV has no map navigation, creation or statistical
analysis functions; all these tasks must be done with external software.
Appropriate planning decision analysis includes three steps: (1) setup the
decision problem, (2) run the simulations, assess the impacts of each alternative
and (3) determine the final decision which meets the preferences of the decision
maker. Changing parameters is an important and frequent step during the
decision making process. As a successful decision support model, the user can
change LANDIS text parameters easily because they are stored as ASCII in the
text files. But as spatial data, stored in ERDAS 7.6 GIS format, modifications are
difficult. As an example, if the management area unit is set, it is not easy to edit
it even in professional GIS software, because (1) the commercial GIS software
does not support .gis files well and (2) editing of the management area map
should follow one rule - the forest stand can not cross two or more management
areas - which is difficult to accomplish with GIS software. Due to the lack of
spatial data editing capability in LANDIS, all the raster data related operations
must be prepared out of the model, which can be a troublesome process if the

17
user wants to interactively create a new management area and define this area’s
management treatment plans.
4. The Purpose of this Research
Because of the somewhat difficult requirements for learning and operating
LANDIS software, users’ willingness to adopt this scientifically valuable forest
management tool has been lessened, reducing its widespread application. After
examining the limitations of the current LANDIS interface and based on
identifying useful characteristics found in a vareity of other forestry DSSs, my
research intends to develop a Forest Management Decision Support System
(FMDSS) that incorporates the capabilities necessary for a successful system:
friendly user interfaces, spatial data processing capabilites, and convenient
envirioment for output checking and extensible flexibilities. FMDSS is an
interactive, user-friendly forest management decision support system based on
the LANDIS 4.0 model. The spatial data processing capabilities integrated into
this system will be supported by ESRI ArcGIS libraries. FMDSS is also intended
to provide a flexible and effortless environment for presenting the results of
model simulation alternatives.
By developing an integrated Forestry Management Decision Support
System (FMDSS) to bridge the gap between research and application by using
and extending the LANDIS model, forest managers may directly and easily apply
LANDIS 4.0 in their management planning processes. As a test of its utility, this
thesis applies FMDSS to an evaluation of forest management planning in the
Mark Twain National Forest of Missouri.

18
CHAPTER II: INTRODUCTION TO THE LANDIS MODEL
1. General Introduction to LANDIS 4.0
LANDIS is a spatially explicit landscape model designed to simulate forest
landscape change over large spatial and temporal scales (Mlandenoff et al. 1996,
Mlandenoff and He 1999). It models the dynamic changes of forests in response
to succession, windthrow, biological disturbance (insects and diseases), fire, fuel
and harvest management. LANDIS is a raster system and the cell resolution is
flexible from 10 – 500m. The spatial range that LANDIS can simulate varies from
500 – 1,000,000 ha within 10 – 2000 years scale. As of 2007, the current
configuration of LANDIS is identified as version 4.0.
The LANDIS model is composed of five specific modules and each
module has a standard interface to simulate a distinct process, such as wind, fire,
and fuel accumulation. Except the succession module, the other five modules
are optional: the user may either open or close them when the simulation is run.
These five functions of LANDIS are summarized in table 2.

19
Table 2. LANDIS 4.0 Module Functions (Source: LANDIS 4.0 user’s guide, 2004).
Module Functions
Succession 1. To simulate how disturbance and successional dynamics
interact to change forest patterns and find the expected
recovery paths of the tree species after disturbance;
2. To investigate the influence of seed dispersal on landscape
changes
Fire 1. If large fires occur, to simulate the long-term effects on
forest ecosystems;
2. To examine locations of high fire risk on forest landscapes
and how this risk changes over time; identify the best fuel
reduction plans to lower fire risk
Fuel To test how fuel treatments effects fire frequency, size and
intensity in order to maintain a low fire risk landscape
Harvest To check the influence of harvest activities on species
composition and spatial pattern
BDA To inspect insect disturbance effects on forest pattern and
long-term fire risk

20
2. LANDIS Inputs
The LANDIS 4.0 input files include two kinds of file formats: ASCII files
and GIS files. The ASCII files are date files (*.dat), land type class files (*.rcs),
age class files (*.age) and color palettes files (*.plt). The GIS files are ERDAS
IMAGINE 7.6 GIS files (*.gis). All the text parameters of LANDIS simulation are
stored in the ASCII files and each file has 1- 20 parameters, which are the
description of species information, land type information, disturbance information
or treatment information. One simulation consists of a main parameter file,
several first-level files which are associated with the main parameter file and
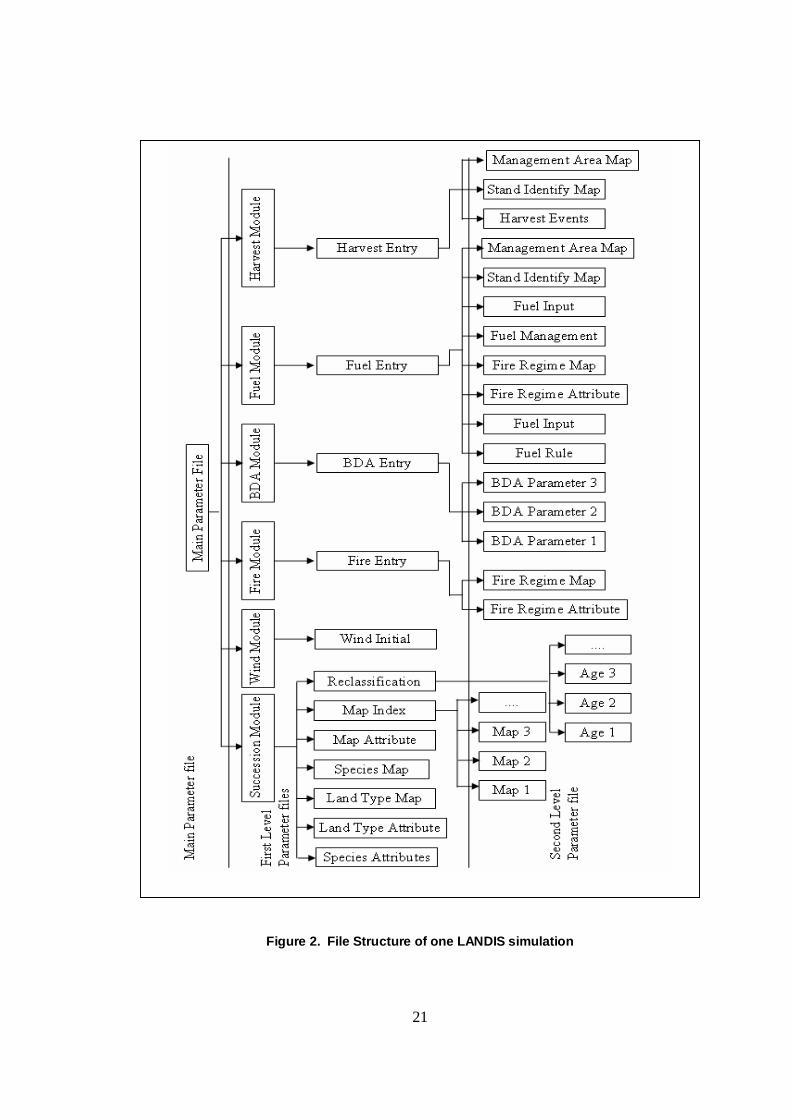
some second-level files associated with the first-level files. Figure 2 illustrates
the complexity of this input structure. Even without opening the optional modules,
one simulation still requires at least 10 input ASCII files containing more than 50
attributes and 2 GIS files. That is a heavy workload for LANDIS novices that are
just learning the meaning of these parameters. It is also time-consuming and
error-prone even for experienced LANDIS users.
21
Figure 2. File Structure of one LANDIS simulation

22
3. LANDIS Output
LANDIS simulation results are in the format of ERDAS IMAGINE 7.6 GIS
files as well as some accompanying trailer (*.TRL) files and log files. The GIS
files show the ages of the oldest cohort on each cell and the trailer files preserve
the class information representing the meaning of the output cell’s value.
Additional files will be created for wind, fire, fuel, BDA or harvest simulation if the
corresponding modules are turned on before the model is executed. The results
will be saved into WIND, FIRE, FUEL, BDA and HARVEST sub-folders
respectively under the output directory. The naming convention for the GIS and
trailer files is the reclassification name followed by the year number simulated.
4. LANDIS 4.0 Interfaces
Due to the complexities of LANDIS 4.0 input parameter files, two
Windows-based graphic user interfaces were developed and included in the
LANDIS 4.0 distribution package. LANDIS Interface (LI) is a program that can
open the main LANDIS configuration file and other first-level files by simply
clicking buttons on the toolbar. The user also may open any LANDIS input file by
specifying its location manually. Figure 3 is a sample of the current LI program
interface.
LANDIS Viewer (LV) is the other program provided by LANDIS 4.0. It is a
lightweight program to view the GIS raster files. The user may navigate the
simulation results easily with predefined color schemes in LV (Figure 4).

23
Figure 3. Example of the interface configuration of LANDIS 4.0 Interface (LI).
Figure 4. Example of the interface configuration of LANDIS 4.0 Viewer (LV).
24
5. LANDIS GIS Extension
Since LANDIS version 2.x, an extension has been available for ESRI
ArcView GIS 3.x named LDAVI (LANDIS ArcView Interface), developed using
Avenue code. LDAVI allows for convenient display of LANDIS output GIS files.
New menus are added to ArcView to display various types of LANDIS output GIS
data including species, age, disturbance and harvest distributions. Additionally,
several new buttons added to the ArcView toolbar allow the user to quickly
prepare maps, tables and charts for LANDIS output data (Jason et al., 1996).
As the LANDIS model evolved, more parameters and modules were
introduced into LANDIS 4.0. The structure of the main configuration file of
LANDIS 4.0 changes from the other older versions, thus LDAVI can no longer
read the main parameters in LANDIS 4.0. In addition, although ESRI may still
provide technical support for ArcView 3.x, no upgrade will be serviced, and the
retirement of ArcView 3.x is just a matter of time. All the desktop GIS
functionalities will be migrated into ArcView 9.x, which is a part of the ArcGIS
suite of software. Thus any new GIS extension for LANDIS should be designed
to interface with this new ESRI platform.

25
CHAPTER III: DEVELOPMENT OF THE FOREST MANAGEMENT DECISION SUPPORT SYSTEM (FMDSS)
1. Objectives of the FMDSS
The purpose of developing the FMDSS is to allow forest managers to
directly and easily apply the LANDIS 4.0 model to explore the optimal
alternatives in their management planning. The system will eventually serve as a
decision support tool, eliminate the most time-consuming parameter editing work
in the simulation process, simplify the technical operations of running the
LANDIS model, and allow managers to focus on their management plans, rather
than on the software.
As a spatial forest management decision system, one FMDSS decision
alternative should define at least two initial elements: location (where will the
decision be taken?) and action (what management activity will be taken at the
delineated location?; Malczewski, 2006). Functionally the DSS application should
not only offer dynamic plan management functions (add/delete/edit management
plans) but powerful and effective spatial analysis capabilities (create/edit
management area) for the simulation run.
Technically FMDSS is designed as a layer of software applications
installed on top of the LANDIS 4.0 model and some commercial GIS software.
The database technology is used to manage the LANDIS parameters, and GIS

26
software provides the spatial data processing capabilities as well as the display
environment for the simulation result and further mapping functions. A user-
friendly interface prepares the input parameters for a LANDIS simulation and
then executes that program. Another function of the interface integrates the
LANDIS model and GIS software into one seamless system.
The processing of incoming data and the synthesis of pertinent
information are two basic questions to be answered before the development of
the decision support system (Wybo, 1998). When defining the FMDSS, the
primary task is to establish the kinds of data that will be used in the system. In
order to fully apply the LANDIS model in the decision making process, FMDSS
incorporates all the LANDIS parameters files, both ASCII (text information) files
and ERDAS 7.6 GIS (spatial information) files. A database management system
(Microsoft Access) is integrated to manage the text information, while a
commercial geographical information system (ESRI ArcGIS) is used for spatial
data management.
2. Design Principles of the FMDSS
FMDSS was designed and implemented with six key principles in mind:
1. The major user group of this system is forest managers, with no technical
staff required to operate or support the system on a daily basis. That implies
the applications should be easy to use with good input dialogs and logical
screen design. Every field and box should be manifest with labels or hints.

27
2. The system should be robust and tolerant of users’ mistakes, preventing
them from inputting any invalid or illogical parameters when possible. If an
error happens, useful error hints should be provided instead of system crash
information.
3. The software developer should be as independent as possible from the
forest managers or planners. The system should enable the users to add,
delete, edit the input parameters and maximize the system flexibilities.
4. The system should allow for spatial analysis capabilities using existing
GIS modules. This means incorporating the system into a mature commercial
GIS platform, such as ArcGIS, to utilize the powerful existing functions. This
not only lightens the development workload, but also shortens the
development cycle.
5. The system should be expandable without major expense or changes to
equipment or software. The basis of Microsoft COM technology makes it
possible that adding new functions does not change the functions and
implementation of the existing ones.
6. Different scenarios and treatment applications can be simulated,
evaluated and compared without having to make changes to other parameter
preferences.
3. Implementation of the FMDSS
3.1 Development Environment
There are three main concerns when implementing the FMDSS: (1) Easy

28
and fast development, (2) Without major platform and software cost, and (3)
Flexibility to extend. Based on these considerations, we selected Microsoft
Visual Basic as the development tools, ESRI ArcObjects libraries as the GIS
functionalities provider and Microsoft Access as the database management
system.
From the view of GIS functionalities, there are three main development
approaches. The first approach is to develop the application from scratch. All the
functions (loading data, map navigation, map creation, queries, etc.) should be
implemented by the programmer. The advantages of this approach are saving
budget, and it is domain specific and independent of other GIS software, but it
often requires a much longer development cycle and experienced programming
skills. The second approach is to develop applications using the macro
languages provided by GIS software vendors, such as AML for ArcInfo or
MapBasic for MapInfo. This approach can call the existing GIS functions
implemented by the GIS software, which saves times and energy, but the
developer needs to learn another specific language and usually this kind of
macro language has relatively low efficiency and needs the support of another
GIS platform. The third approach is the most common method – component
development approach. GIS vendors encapsulate their major basic GIS
functions into some small components/libraries, so developers can employ their
functionality or extend their functionality with their own components. MapX of
MapInfo and ArcObjects of ESRI are the most popular such GIS components in
the current markets.

29
ESRI ArcObjects is the development platform for the ArcGIS family of
applications, such as ArcMap, ArcCatalog or ArcScene (Zeiler, 2001). It has
data management and map presentation functions. With ArcObjects, the
developers can build domain-specific GIS applications. ArcObjects is built using
Microsoft COM technology and the functionality of ArcObjects can be assessed
using four APIs (Application Program Interface): COM, .Net, Java and C++. It is
possible to extend ArcObjects by writing COM components with any COM-
compliant language; Microsoft Visual Basic is one of such kind of language.
Microsoft Visual Basic (VB) is an event-driven programming language and
suitable for rapid application development (RAD) of graphic user interface (GUI)
applications. Also VB can access the database using ActiveX Data Objects (ADO)
or Open Database Connection (ODBC) easily. VB was selected as the
development tool to create the user interfaces, extend the ArcObjects functions
and link the LANDIS model, database and ArcObjects components.
The database management system is introduced to the FMDSS system to
regulate LANDIS input parameters. The original ASCII LANDIS input files can
take any format of characters, even though they are illegal or invalid for the
LANDIS model, while the fields in the database tables are formatted and fixed, so
any incompetent data will be rejected to ensure the validness and integrity of the
LANDIS parameters. In this system, Microsoft Access is a simple and light-
weight desktop relational database used as the data repository and connected
with VB using ADO.
With ArcObjects as the platform, there are still two development

30
approaches available: a program using ArcGIS Engine, or customization of
ArcMap to embed applications. Because ArcMap fulfils most of the
functionalities for a spatial decision support system, such as spatial data
management and display, spatial analysis, thematic mapping, and provides
flexible extension capabilities, we chose this development approach. For linking
the ArcMap application with the decision support system, two interfaces should
be implemented (ArcGIS Developer Help, ESRI, 2001):
1. IMenuDef, this interface is used to define the properties of a custom
menu which can be embedded into ArcMap environment.
2. ICommand, this interface is used to create custom commands.
All the menus and commands are COM based and distributed in the form of
ActiveX DLLs.
3.2 Database Design
With the database management system determined, the next step is to
design an efficient database schema, including tables, uniqueness and keys.
The relationship between the database elements and the LANDIS input
files (ASCII) is: One database is one simulation; one table corresponds to one
parameter file and the fields in the table represent the attributes in one parameter
file. Explicitly, all the data in text formatting for one simulation, including species
information, land type information, reclassification information, etc., will be saved
in one database; the tables are named by their meanings in the LANDIS model,
like species, mapindex, and ageindex; the attributes of the fields depend on the
actual meanings: cellsize is numeric, mapindex name is alphabetic. There are

31
some rules or constrains defined in the database to avoid saving invalid
parameters in the database. For example, the iteration number should be an
integer greater than 0; the mature age of a species should less than its longevity.
For the decision support system, 33 tables were created for storing the
LANDIS parameters. All the tables are linked by the primary keys and foreign
keys. Table 3 shows the detailed structure of the tables.
3.3 Decision Support Flow
The overall decision support process is shown in Figure 5. When the system
is executed, the user needs to import the initial parameters files into the
predefined database: if the data are loaded successfully, the user may display,
check or change each parameter through window-style interfaces; if the data can
not be loaded successfully, as when one or more initial LANDIS input files are
defined incorrectly, the user needs to correct the errors before he can use the
system. The user runs the simulation based on parameters in the database.
When the simulation is finished, all the output maps can be brought into ArcMap
to check the results or conduct further analyses. If this result meets his
requirements, he is able to create reports or graphs in ArcMap. Or he may
change the parameters to do another simulation until he arrives at the optimal
decision.

32
Table 3. Relationship between database tables and LANDIS parameters
Table Name LANDIS Module Meaning Project Succession Main simulation file Species Succession Species Vital Attributes
LandTypeAtt Succession Land Type Attribute MapAtt Succession Species and age classes attributes
MapIndex Succession output species/class map index AgeIndex Succession output species age map index Dispersal Succession Instances of seed dispersal routine WindInit Wind Initial setting of wind module FireInit Fire Initial setting of fire module
FireRegimeAtt Fire/Fuel attributes for each fire regime BDAInit BDA Initial setting of BDA module
BDASpecies BDA BDA module species parameters BDALandType BDA BDA module Land type modifiers
BDADstb BDA BDA module Disturbance Modifiers BDAPara BDA BDA module other parameters
(including Temporal) FuelInit Fuel Initial setting of fuel module
FuelInputSpecies Fuel Fuel modifiers – Species section FuelInputLandType Fuel Fuel modifiers – Land type section
FuelInputWind Fuel Fuel modifiers – Wind section FuelInputBDA Fuel Fuel modifiers – BDA section FuelInputFire Fuel Fuel modifiers – Fire section
FuelInputHarvest Fuel Fuel modifiers – Harvest section FuelMan Fuel Fuel Management Event FuelRule Fuel Fuel rule input setting
HarvestInit Harvest Initial setting of harvest module HarvestRegime1 Harvest Harvest regime 1 setting HarvestRegime2 Harvest Harvest regime 2 setting HarvestRegime3 Harvest Harvest regime 3 setting HarvestRegime4 Harvest Harvest regime 4 setting HarvestRegime5 Harvest Harvest regime 5 setting HarvestRegime6 Harvest Harvest regime 6 setting HarvestRegime7 Harvest Harvest regime 7 setting HarvestRegime8 Harvest Harvest regime 8 setting

33
Figure 5. Flow chart of a typical decision support process
Check Parameters
Edit the criteria? Add new? Update? Delete? Create Layer?
Run the model
Load parameterized files
Change criteria?
Final decision
Output? Maps, Graphs Reports
Start
End
Yes
No
Yes
No
No No
Database: MS Access
Simulation Model: LANDIS GIS Library: ArcObjects
Display Environment: ArcMap
34
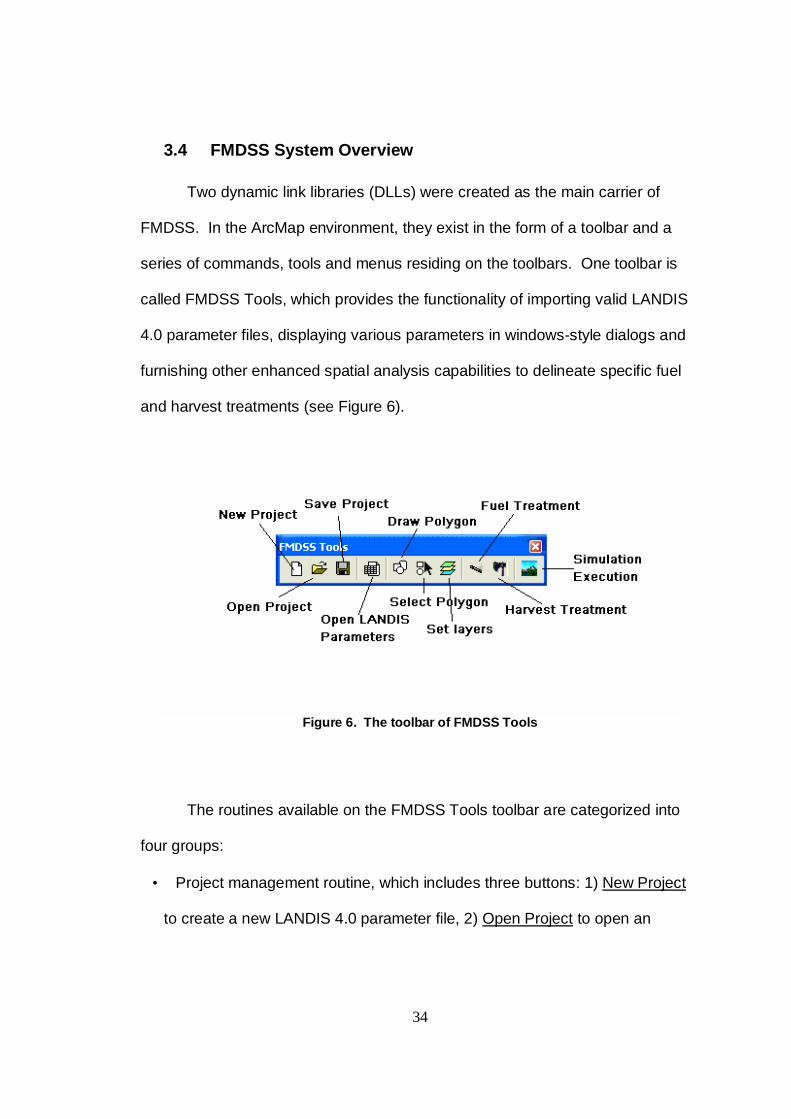
3.4 FMDSS System Overview
Two dynamic link libraries (DLLs) were created as the main carrier of
FMDSS. In the ArcMap environment, they exist in the form of a toolbar and a
series of commands, tools and menus residing on the toolbars. One toolbar is
called FMDSS Tools, which provides the functionality of importing valid LANDIS
4.0 parameter files, displaying various parameters in windows-style dialogs and
furnishing other enhanced spatial analysis capabilities to delineate specific fuel
and harvest treatments (see Figure 6).
Figure 6. The toolbar of FMDSS Tools
The routines available on the FMDSS Tools toolbar are categorized into
four groups:
• Project management routine, which includes three buttons: 1) New Project
to create a new LANDIS 4.0 parameter file, 2) Open Project to open an

35
existing LANDIS 4.0 parameter file and 3) Save Project to export the current
opening project into text format files and prepare to execute the simulation.
• Parameter management routine includes one button: Open LANDIS
parameters to open the imported LANDIS project file. The button is disabled
when there is no open project file; once a project is imported into the FMDSS,
the button is enabled.
• Fuel/Harvest Definition routine includes two groups of buttons. One group is
to delineate the management area and contains three buttons: 1)
create/select management areas by an interactive graphic tool and 2) set
geographic layer as the management areas. 3) The other group contains two
buttons: one for Fuel treatment and one for Harvest treatment. Both are to
define the treatment methods for the newly created management areas.
• Simulation execution routine contains only one button, which calls the
LANDIS 4.0 program to simulate the imported or saved projects.
The other toolbar is called FMDSS Viewer, which provides some
convenient menus and buttons to view the simulation results with predefined
color schemes (Figure 7). The routines of FMDSS Viewer toolbar can be
categorized into two groups: projects routine and map browse routine.
• The projects routine contains one button to open a valid LANDIS 4.0
parameter file and several menus as well as their submenus to add the
related simulation output maps to the ArcMap data window.

36
• The map browse routine includes three buttons to help the user to navigate
the desired output maps by three means: to next step, to forward step and to
specified step.
Figure 7. The toolbar of FMDSS Viewer
3.5 Samples of Graphic User Interface
Figures 8-10 illustrate the FMDSS graphic environment for LANDIS 4.0
parameters display and editing. These dialog boxes insist that only valid and
meaningful can be saved into the database running underneath. Figure 8 is the
dialog lets the user to view and edit the parameters for the fire module. This
dialog can be opened only when the fire module is turned on. From this dialog,
the user can open the Fire Regime Attribute Editor (Figure 9) to view and
redefine the fire regime attributes.

37
Figure 8. Fire module parameter editor

38
Figure 9. Fire regime attributes editor
Removal masks are a basic component of analyses by the LANDIS
Harvest module. Removal masks specify for each species which age cohorts (if
present on the site) should be removed by the harvest activities. In LANDIS 4.0,
the removal mask is composed of a series “0” (removed) and “1” (kept) and each
digit represents one age cohort, as 1 – 10, 11 – 20, etc. (see Table 4). The
removal mask must always match the species attribute file in terms of number,
order and each species’ longevities. Although the definition of removal masks in
this format gives users the unlimited flexibility to tailor the masks to the

39
Table 4. Example of removal mask in LANDIS 4.0 harvest module. Each line is for one species; the name between the pound signs each line is the
Latin name of the species.
# removal mask #
000000000000 #abiebals#
000011111110000000000000000000 #acersacc#
0000000000000 #betupapy#
000000000000000 #fraxnigr#
000000000000000000 #larilari#
00000000000000000000 #piceglau#
00000000000000000000 #picemari#
0000000 #pinubank#
0001111100000000000000000 #pinuresi#
0000111111000000000000000000000000000000 #pinustro#
000000000000000 #popubals#
000000000 #poputrem#
0000000000000000000000000 #querrubr#
00000000000000000000000000000000000 #thujocci#
00001111111000000000 #tiliamer#
000000000000000 #acerrubr#
000011111110000000000000000000 #betualle#
treatments to be simulated (He, 2004), it is very easy to make mistakes during
their creation. In the FMDSS, an intuitive dialog (Figure 10) is created to make
this process easy and less error-prone. The species names and longevities are
automatically generated from the species attribute file and listed in the tree view
window, the user only needs to select the age cohorts that he wants removed in

40
the harvest treatment and FMDSS will save his definition in the format of “0” and
‘1” for the LANDIS program to simulate.
Figure 10. Removal mask generator dialog
Further details of other FMDSS functionalities are discussed in the
FMDSS User’s Guide, located in the appendix of this thesis.
41
CHAPTER IV: APPLICATION OF FMDSS TO MARK
TWAIN NATIONAL FOREST
The Forest Management Decision Support System (FMDSS) is designed
for easy application of the LANDIS model by forest managers. The development
of FMDSS not only makes the preparation of simulation parameters easy but
also makes available the powerful functions and spatial data processing
capabilities of GIS. To demonstrate and verify the effectiveness and the
accessibility of this forest management decision support system, an application
to data from the Mark Twain National Forest (MTNF) is presented here that tests
alternatives for a new fire management plan.
1. Study Area
The study area, the Central Hardwood forest within Mark Twain National
Forest (MTNF), is located in the southern portion of the Missouri Ozarks. The
specific area is 33.8 kilometers wide (from east to west) and 34.3 kilometers long
(from north to south), an area of about 1162 km2. The study area crosses four
counties: Shannon, Carter, Oregon and Ripley (see Figure 11a). The study area
primarily consists of federal public forest lands but is surrounded by private lands
(Figure 11b).

42
(a)
(b)
Figure 11. The study area: (a) its relative location within the State of Missouri; (b) public
forest and private lands in this area

43
2. Research Question
Large wildfires can have detrimental impacts not only on forest resources
and ecosystems but also lives, properties and millions of dollars of fire
suppression (Raymond and Peterson, 2005). Fuel reduction treatments are one
strategy that has been well explored and advocated to reduce fire hazards (Scott
and Reinhardt 2001; Graham et al. 2004; Peterson et al. 2005). The key
question for this effort is where and how the forest fuel should be treated to
effectively reduce the hazardous fires. Shang et al. (2004) simulated and
compared three scenarios for wildfire management planning in MTNF: 1) wildfire
suppression only, 2) prescribed fire with wildfire suppression, and 3) prescribed
fire and coarse fuel reduction with wildfire suppression. Their results showed
that fuels and potential fire risk gradually build up in scenario 1. Prescribed fires
in scenario 2 reduced the potential wildfire risk at the beginning phase of the 200-
year simulation run, but became less effective in later years. Scenario 3
produced the optimal control of fuel loading and potential fire risk. These
scenarios suggest the most effective fuel treatment method in the designated
management area, but whether the selected treatment areas is the most effective
place to treat is still not studied and remains questionable and unclear. An
effective fire management planning is also a dynamic and complicated task,
which should be based on realistic information about current and future wildfire
situations, such as fire risk, probability of fire incidence, and fire severity
(Kaloudis, 2005). With the assistance of the FMDSS, this question could be
addressed easily since the decision makers have flexibility to create new

44
management areas, define how they want this area to be treated and compare
the output results for different fuel management plans to reach an optimal
strategy.
On the basis of the Land and Resource Management Plan of 1986, the
USDA Forest Service developed the 2004 Plan alternatives to guide all natural
resource management activities on the Mark Twain National Forest and have
begun to use prescribed burning to reduce the fire risk in the Mark Twain
National Forest area (Shang et al., 2004). These researchers also
parameterized the LANDIS model for the new management plan to simulate
forest development and the effects of fuel management on wildfire suppression
(Shang et al., in press).
Much research has been conducted on wildfire suppression and forest fuel
management within MTNF public federal forests. The research from Yang et al.
(2007) shows that significantly more fires occurred in Mark Twain National Forest
than in the surrounding private lands over the last 30 years and fires occurring on
private lands tended to be much larger in size than fires occurred within MTNF.
But wildfire is a dynamic diffusion process, and may cross over the boundary
between public forest and private lands. So it is likely that some fires occurring in
the public forest will spread to the private lands and vice versa. Fuel reduction at
the interface between the public forest and private lands can reduce the fire
movement before wildfire crosses the ownership boundary.
Wildlife-Urban Interface (WUI) areas, defined as the areas where
structures and other human development meet or intermingle with undeveloped
45
wildland, have significant implications for wildfire management and impact
(USDA and USDI, 2001). The treatment within the WUI area can remove
vegetation or other fuels to stop or impede the horizontal movement of an
advancing fire. The analysis conducted here asks: 1) if the same acreage of
forest fuel is reduced along the interface of the public forest with private land
(WUI) to create a fuel break instead of within public areas only, will it change
wildfire behavior and decrease the extent of the burned area? 2) Is this a more
effective way to reduce the fire hazards? If so, how effective is the treatment?
The focus of this application is to simulate and compare two scenarios (the
current plan and the new plan) to check which fuel load treatment plan is more
effective in terms of fire occurrence and extent.
3. Data Preparation
Detailed descriptions of LANDIS model parameterization for the study
area can be found in several papers (Shifley et al., 1999, 2000; He et al., 2004;
Shang et al., 2004). Shang oriented his study around the assessment of fire risk
and the best practice for fuel treatment to avoid and mitigate severe wildfires.
This research is based on the LANDIS parameters that Shang used for the Mark
Twain National Forest proposed management plans (defined as the current plan;
USDA Forest Service, 2005).
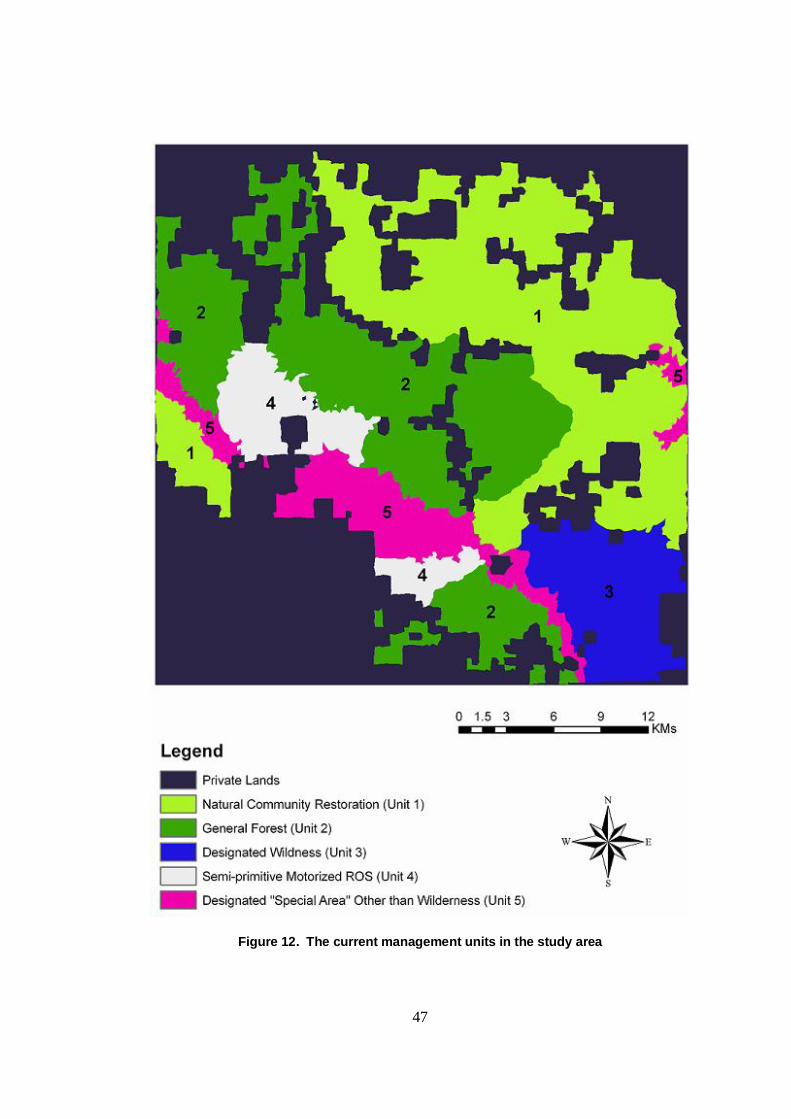
In the Mark Twain National Forest proposed management plans, the study
area was divided into five management units for the federal forest plus the
private lands (Figure 12). Ten percent of management Unit 1, “Natural

46
Community Restoration,” and “General Forest” (Unit 2) where potential fire risk
class was high (class 4) or very high (class 5) was treated per decade
(approximating 1% of the total landscape area per year). The fuel management
in LANDIS format is shown in Table 5.
47
Figure 12. The current management units in the study area

48
Table 5. The proposed fuel treatments for the study area (based on Shang et al. 2004)
PrescribedBurning # Event label #
1 # Management area identifier#
1 # Rank algorithm (1=potential fire risk) #
1 # Entry decade #
20 # Final decade #
1 # Reentry interval #
0.2 # Proportion of management area to burn #
1 # Min potential fire risk for management #
#Fuel reduction intensity #
# 0 1 2 3 4 5 # # Fine fuel load before management #
0 0 0 0 1 1 # Fine fuel loads after management #
# 0 1 2 3 4 5 # # Coarse fuel load before management #
0 0 0 1 2 3 # Coarse fuel loads after management #
PrescribedBurning # Event label #
2 # Management area identifier#
1 # Rank algorithm (1=potential fire risk) #
1 # Entry decade #
20 # Final decade #
1 # Reentry interval #
0.1 # Proportion of management area to burn #
1 # Min potential fire risk for management #
#Fuel reduction intensity #
# 0 1 2 3 4 5 # # Fine fuel load before management #
0 0 0 0 1 1 # Fine fuel loads after management #
# 0 1 2 3 4 5 # # Coarse fuel load before management #
0 0 0 1 2 3 # Coarse fuel loads after management #

49
4. FMDSS Application
The architecture chosen for the FMDSS has been designed to simplify the
parameterization of the LANDIS model by offering user friendly graphical
interfaces and easy access to all the data and functions. In order to answer the
research questions 1 and 2 stated in the second part, FMDSS provides a
convenient way to create and simulate new treatment plans.
To manage forests effectively, accurate and appropriate spatial data for
LANDIS modeling information is needed. The spatial data must be easily
updated to match the management practice plans. In order to answer the
research question, the first step is to create a new management unit along the
federal forest and private lands interface with the built-in functions that the
FMDSS system provides. Creating a new management area is a complicated
spatial data processing step, which requires some GIS background and GIS
software operation skills. The current LANDIS does not offer this capability. The
FMDSS makes this step simple and easy: create a 250 meters inner buffer, and
generate a new management area automatically based on this buffer area with
FMDSS built-in functions (Figure 13). The result is shown in Figure 14.
The user may define one or more treatment scenarios for the new
management unit through the FMDSS dialog to specify the fuel management
plans. The FMDSS incorporates this dialog to allow the user to review and edit
the specifications for the defined treatments (Figure 15a). This dialog is the main
interface for users to define the new fuel treatment prescription. The parameters
are saved into a database ready for LANDIS simulation. The parameters for this

50
Figure 13: The screenshot of FMDSS built-in functions for creating new
management area based on a vector layer on the map.
fuel treatment are: fuel management starts from year 10 and ends at year 20; the
same acreage is treated for fuels as the current proposed management plan. In
this case, 34% of the stands with the highest potential fire risks (class >= 1) will
be selected each decade for management to match the existing plan. The level
of fine fuels and coarse fuels is reduced in the selected stands. For example, fine
fuel loads are reduced from class 1 (very low) to class 0 (none), from class 2 (low)
to class 0 (none), from class 3 (medium) to class 0 (none),

51
Figure 14. Study area with new management area for fuel management
(The purple area is the new management area FMDSS created for new fuel treatments.)

52
Figure 15. Comparison of fuel treatment parameterization process for a) FMDSS, and b) LANDIS 4.0
from class 4 (high) to class 1 (very low), from class 5 (very high) to class 1 (very
low) respectively. Coarse fuel loads are reduced in a similar way. If the same
treatment defined in the LANDIS text format, it would be prepared as shown in
Figure 15b.
After the fuel treatments are parameterized for the LANDIS model, the
new plan was run 20 times as well as the current proposed plan to capture the
stochastic variations of the LANDIS model simulations.
5. Result
Fuel treatments are intended to reduce the fire risk of the treated area and
mitigate fire intensity once fire occurs. Since both of the plans are treating the
a b

53
same fuel loads in different management areas, the treatment location will affect
the fire risk in federal forest and private lands.
5.1. Fire Size
The basic analysis of wildfire occurrence is wildfire size distribution.
Catastrophic fires are usually large in size and have a greater risk of damaging
the public and private facilities as well as the ecological environment and are
much more resistant to control. So the reduction of the wildfire size is an
important indicator of the effectiveness of forest management. In our case study,
the maximum fire size for both public forest and private lands is reduced from the
current proposed management plan and the average size of the largest fire in the
20 replicates also decreases (Figure 16). Also the difference of large fires in the
two plans is considered statistically significant through t test (P = 0.0174).
Figure 16. The average fire size of the largest fire for 20 replicates in MTNF
119.0025138.1365
177.813
105.381
0
50
100
150
200
250
300
350
Public Forest Private Lands
Owership
Area
(Ha)
New Management PlanCurrent Management Plan

54
Besides the maximum fire size, the new management plan also decreases
the number of large fires in public forest (Table 6a) and increases the number
somewhat in private lands (Table 6b). Because the new management plan
decreases the number of large fires, the variance of the fire size also drops
accordingly (Figure 17). However, an unpaired t test conducted on the two
groups of fire sizes indicates that the difference in fire size is not statistically
Table 6. Average number of different fire Classes in a) Public Forest, and b) Private Lands
(a)
Current Proposed Plan New Plan
> 400 ha 0.05 0
[40, 400) ha 2.75 2.25
[4, 40) ha 32.55 35.7
[0.1, 4) ha 189.4 134.3
< 0.1 ha 71.8 68.5
All 296.55 240.75
(b)
Current Proposed Plan New Plan
> 400 ha 0.1 0
[40, 400) ha 1.95 2.65
[4, 40) ha 16.85 17.2
[0.1, 4) ha 45 43.35
< 0.1 ha 16.95 18.4
All 80.85 81.6

55
Significant (P = 0.9626), because most of the fires (more than 90%) occurring in
this area are moderate or small in size and they overwhelm the fire sizes in both
management plans.
Variance of Fire Size
0
500
1000
1500
2000
2500
3000
3500
4000
Public Forest Private LandsNew M anagement PlanCurrent M anagement Plan
Figure 17. Variance for fire size between the new and current management plans
5.2. Burned Area
Burned Area is another important index and descriptor for characterizing a
fire regime, which measures how much of the whole area is burned (Li, 2004).
For this case, the burned area has no significant differences between these two
scenarios for both federal forest and private lands (Table 7).
Table 7. Total burned area under the two management plans
Current Proposed Plan New Plan
Public Forest (ha) 14804.55 14739.48
Private Lands (ha) 15129.27 15919.29
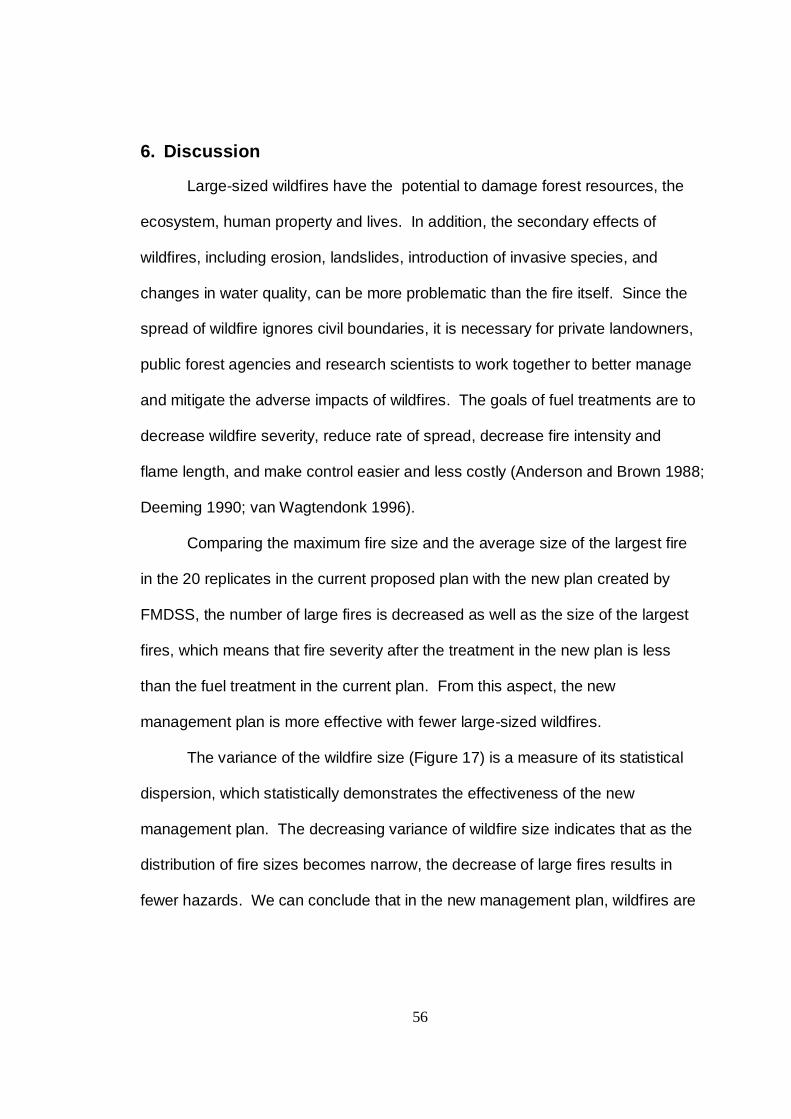
56
6. Discussion
Large-sized wildfires have the potential to damage forest resources, the
ecosystem, human property and lives. In addition, the secondary effects of
wildfires, including erosion, landslides, introduction of invasive species, and
changes in water quality, can be more problematic than the fire itself. Since the
spread of wildfire ignores civil boundaries, it is necessary for private landowners,
public forest agencies and research scientists to work together to better manage
and mitigate the adverse impacts of wildfires. The goals of fuel treatments are to
decrease wildfire severity, reduce rate of spread, decrease fire intensity and
flame length, and make control easier and less costly (Anderson and Brown 1988;
Deeming 1990; van Wagtendonk 1996).
Comparing the maximum fire size and the average size of the largest fire
in the 20 replicates in the current proposed plan with the new plan created by
FMDSS, the number of large fires is decreased as well as the size of the largest
fires, which means that fire severity after the treatment in the new plan is less
than the fuel treatment in the current plan. From this aspect, the new
management plan is more effective with fewer large-sized wildfires.
The variance of the wildfire size (Figure 17) is a measure of its statistical
dispersion, which statistically demonstrates the effectiveness of the new
management plan. The decreasing variance of wildfire size indicates that as the
distribution of fire sizes becomes narrow, the decrease of large fires results in
fewer hazards. We can conclude that in the new management plan, wildfires are

57
controlled at a relatively smaller size so that they do not have enough fuels (or
other conditions contributing fire expanding) to grow to large size.
Although the large wildfires decrease in terms of number and size, the
burned area in this landscape remains unchanged under the two management
plans (Table 7). Since the number of large-sized fire in the new plan is fewer
than that in the current proposed plan, fires in moderate to small size are more
abundant in the new plan. Medium or small fires are beneficial for wildfire
management because they reduce the fuel accumulation. Excessive fuel build-
up has negative impacts on forest health and results in more intense fires when
they eventually start to burn. The reduction of fuel then decreases the possibility
of catastrophic fires. In this respect, the new management plan may be
considered more successful than the current plan.
The underlying mechanism of the altered fire behaviors under the new
management plan lies with the different location selected for fuel treatment.
Environmental factors favoring catastrophic fires include topography, climate, fuel
loads and their connectivity. In this research, the reason the large fires decrease
in number and size stems from the new management area created with FMDSS
which serves as a fuel break, separating wildfires from additional fuel and
preventing them from advancing. Figure 18 shows an example of this effect.
Under the current fuel management plan, there is a large-sized fire near the
interface area, however, with the new fuel management plan, the wildfire does
not grow to a large size because of the lack of fuel near the interface area, and
instead evolves into three small-sized fire patches.

58
Figure 18 An example of fire occurrence near the interface of public forest and private lands: (a) the current proposed management plan and (b) the new management plan with FMDSS fuel treatment. The red polygons are the fires simulated. The white area is private
land and the shaded area is the MTNF.
The forest in this study area is predominantly a mixture of four species:
white oak, black oak, shortleaf pine and sugar maple (Shifley et al., 2000a). In
the 20-year simulation runs of both management plans, no species combination
changes are detected in patterns (Figure 19) or numbers (Table 8). The reason
for this limited ecological impact is the short term (20 year) simulations; changes
may be discovered for longer simulation runs.

59
Figure 19. The present of dominate species at the simulation Year 20 in MTNF: (a) Current proposed management plan and (b) New management plan
Table 8. The number of cells dominated by each species in the simulation at year 20
White Oak Black Oak Shortleaf Pine Sugar Maple
Current Plan 303224 296422 114825 53795
New Plan 302207 295354 114550 53671
The effectiveness of fuel treatments depends on the treatment intensity
(how much fuel load is reduced), the proportion of the landscape treated, and
frequency of treatment (Shang et al., 2004). From this study, we can see that the
treatment location also affects the effectiveness of fuel treatment then changes
the impacts on fire behaviors. Although the other variables are unchanged,
location of the treatment produces different effects.
a b

60
It is possible that the new plan presented in this case study is not optimal
or practical; the main purpose is to demonstrate the impact of the varied spatial
configurations of management area, made easily modeled with FMDSS. Forest
managers may do more simulation tests with FMDSS based on their knowledge
and understanding of the characteristics of fuel distribution in this area to find the
best solutions for the particular questions they are exploring.
FMDSS incorporates new utilities and simplifies the application of the
LANDIS model to forest management. With the assistance of FMDSS, forest
managers have the flexibility to create and define different management
strategies in an interactive environment, and readily compare their simulation
results until reaching an optimal solution. As demonstrated by the simple case
study presented here, the new spatial capabilities added by FMDSS allows
construction of more complex models, leading to more effective solutions and
management plans.

61
CHAPTER V: DEVELOPMENT DISCUSSION AND THE
FUTURE DEVELOPMENT OF FMDSS
A major challenge in developing a forest management decision support
system is the complexity of bringing together a variety of information (e.g.,
biophysical, topological and management practical variables) and evaluating this
information at a specific geographic location (Ellis, 2005). The main goal of this
research is to present a universal approach for forest management planners by
integrating the LANDIS model with ESRI ArcGIS into a single DSS. The design
of the decision support system emphasizes ease of use, enhancement of
program stability, and freedom of parameter inputs by means of graphical
interfaces, database technology and GIS spatial data processing capabilities.
This architecture is generic and can be used in other domains in which managers
have to deal with spatial data in the decision support process.
1. System Structure
The FMDSS is an embedded system instead of a stand-alone program. It
exists in the format of Dynamic Link Libraries (DLLS) and cannot be executed
without the support of the ESRI ArcMap software platform, which is required to
provide the functional GIS libraries. Loading FMDSS is through ArcMap

62
customization and can not be executed without the ArcMap environment.
Compared with a stand-alone program, the development of this of application is
much quicker: it reduces the workload and shortens the development life cycle
greatly. Because all the mapping functions (map navigation, symbology, etc.)
and most of the GIS spatial analysis functions (geoprocessing, spatial selection)
are implemented already in ArcMap, it is not necessary to develop them from
scratch.
From the users’ view, this structure is not as good as the stand-alone
approach. The stand-alone application for this case should be using ArcGIS
Engine Developer Kit. The execution of this kind of application needs ArcGIS
Engine Runtime, which costs much less than ArcInfo licenses. Also the stand-
alone application is easier to deploy and setup than the ArcMap customization.
2. GIS Component
Within the DSS field there is increasing interest in the use of GIS
technology to provide decision support. FMDSS has done this by introducing
GIS functionalities into the decision making procedures. The method we adopted
fully utilizes the GIS functions provided by ArcMap or ArcObjects package.
Microsoft COM is a mature technology, offers good performance and is
supported by most of today’s development tools. The COM-based development
method brings not only much flexibility but excellent capabilities to expand the
system. FMDSS has an open architecture that allows additional components to
be added to the system without extensive revision of the current FMDSS code.

63
Therefore, FMDSS can be easily and fully upgraded with new functionalities
without changing the existing functional modules.
3. Database Component
Another important model in the FMDSS is the database component.
Database tables as a repository for LANDIS parameters are the information
exchange media between different modules. The advantage of introducing
database management system can be summarized in two aspects:
1) The rule of database fields can regulate the data validity: only the data
matching the rules we set can be saved into the database, e.g., the age of
species should be an integer and its value is larger than 0.
2) Centralized data are easy to manage and more available to the distributed
population of users.
FMDSS does not take full advantage of database management system
because at this phase, database is only an interim media for the LANDIS
parameters: all the data are loaded into the database before any edits and the
data are required to export to plain text file for LANDIS simulation. Later, when
the LANDIS program can read data directly from database system, the FMDSS
would fully integrate the database technology.
4. LANDIS Model Improvement
FMDSS expands the spatial information processing capabilities of LANDIS.
The current LANDIS program can not process *.gis files and the data need to be

64
processed with other external GIS applications, limiting the forest manager’s
flexibility to delineate new management areas. At the current stage, FMDSS can
create new management areas based on graphics the user draws on the map
and any features in other layers. More GIS functions may be added to FMDSS
according to the user’s further requirements.
In the domain of forest management decision support, the FMDSS allows
a user to gather, store and update the different kinds of data for decision making,
from forest species attributes to spatial information, from descriptive data to
management definitions. This approach automates repetitive tasks, giving more
time and energy to the decision makers for management plans instead of the
complicated model parameters. The FMDSS system eases the procedure of
viewing and editing parameters: All the parameters are displayed in the well-
labeled or explicitly-hinted Windows-style dialogs. The built-in error-checking
functions examine the data validity and reject any invalid or illogical inputs to
reduce error possibilities, which make the application more reliable and robust.
The case study in Chapter 4 demonstrates the possibility of integrating an
ecological model into ESRI ArcGIS, providing a professional mapping and
analysis environment for the simulation results.
FMDSS expands LANDIS’ flexibility for creating new specific management
units and defining more realistic management plans according to the decision
maker’s study area. FMDSS also provides a new convenient toolset to view the
simulation results with predefined color schemes in the time sequence. The
main results of this research can be summarized into two classes: one is

65
improvements in the data preparation and editing environment for LANDIS
parameters, and the other is allowing new fuel or harvest treatment creation
capabilities by supporting spatial data processing functionalities.
5. Future Development
A fully integrated decision support system for forest management is too
large and complex to be achieved in a single development cycle (Reynolds,
2005). For the current version of FMDSS, there are at least three places that
need to be improved:
1. FMDSS is not a dynamic decision support system. In fact, very little
empirical research has been undertaken to appreciate the dynamics of the
decision making process (Jankowski and Nyergers, 2001). Now the
FMDSS can only provide the user the capability to control the spatial
domain, i.e., the geographical location that the management practice will be
taken. During the long time simulation run, the specific site of the
prescription is fixed and can not be altered. That is obviously not true in the
real world. How to add a flexible temporal factor into the decision making
process so that the user may check the previous simulation results and
change the management plans if applicable during the simulation needs
more research.

66
2. LANDIS and GIS are not fully integrated. Malczewski (2006) classified
the spatial decision support systems into four categories according to the
extent of integration: 1) no integration, 2) loose coupling, 3) tight coupling,
and 4) full integration (Goodchild et al, 1992, Nyerges 1992, Jankowski
1995, Malczewski 1999, Jun 2000). In FMDSS, LANDIS and GIS are
relatively independent components, i.e., loosely coupled although they
share the same user interface and exchange files. This architecture will
reduce efficiency and stability of the program.
3. FMDSS adds no further analysis tool for simulation results. It only
provides a map browser and some simple analysis tools those are available
in ArcMap. For complex statistical tasks, the user needs to use other GIS
utilities or statistical packages. This is still a challenge for non-technical
decision makers. In future development, the analysis functionalities should
be developed and integrated into FMDSS, so that the simulation results can
be easily and automatically analyzed by the decision makers.
With the continued expansion of the FMDSS, more and more new GIS
functions should be added, allowing additional decision making factors that could
be considered in the decision making process. If this occurs, FMDSS will evolve
from its beginning as a simple enhanced LANDIS graphical interface to a very
flexible decision support system.

67
REFERENCES
Anderson, H. E., Brown, J. K. 1988. Fuel characteristics and fire behavior considerations in the wildlands. Protecting people and homes from wildfire in the interior west: proceedings of the symposium and workshop :124-130
ArcGIS developer Help, 2001. ESRI. Redlands, CA.
Armstrong, M.P., Densham, P.J. and Rushton, G. 1986. Architecture for a micro-computer based decision support system. Proceedings. The second International Symposium on Spatial Data Handling:120-131.
Barrett, T. M. 2001. Models of vegetation change for landscape planning: a comparison of FETM, LANDSUM, SIMPPLLE, and VDDT. General Technical Report RMRS-GTR-76-WWW. Ogden, UT: USDA Forest Service, Rocky Mountain Forest and Range Experiment Station.
Beukema, S. J. Reinhardt, E. D., Kurz, W. A. and Crookston, N. L. 1999. An overview of the fire and fuels extension to the Forest Vegetation Simulator. Unpublished paper presented at the Joint Fire Sciences Workshop, Boise, ID.
Blake, J. I. Somers, G. L. and Ruark, G. A. 1990. Perspectives on process modeling of forest growth responses to environmental stress. Modeling of forest growth responses to environmental stress. Edited by Dixon, R.K., Meldahl, R.S., Ruark, G.A. and Warren, W.G. Timber Press, Portland, Oregon: 9–17.
Deeming, J. E. 1990. Effects of prescribed fire on wildfire occurrence and severity. Natural and prescribed fire in Pacific Northwest forests. Corvallis, OR: Oregon State University Press: 95-104
Dippon D., Barber K., Merzenich J. 1999. ArcView GIS/RELMdss: Integration of a Mathematical Programming Model Within ArcView GIS for a Spatial/Temporal Decision Support System. ESRI 1999 User Conference.
Donald N., Walter D. P., Cheng Z., Dass M., Glende A., Maierv F., Routh C., Uchiyama H., Wang J., Witzig S., Twery M., Knopp P., Thomasma S., Rauscher H. M. 2005. A method for integrating multiple components in a decision support system. Computers and Electronics in Agriculture 49: 44–59.
Druzdzel, M. J. and Flynn. R. R.1999. Decision Support Systems. Encyclopedia of Library and Information Science. Kent, A. Marcel Dekker, Inc.

68
Ellis A. E., Nair P. K. R. and Jeswani D. S. 2005. Development of a web-based application for agroforestry planning and tree selection. Computers and Electronics in Agriculture 49: 129 -141.
EMDS website, http://www.institute.redlands.edu/emds/index.htm.
Finlay, P. N. 1994. Introducing decision support systems. Oxford, UK Cambridge, Mass., NCC Blackwell. Blackwell Publishers.
Goodchild, M. F., Haining, R. and Wise, S., 1992, Integrating GIS and spatial data analysis: problems and possibilities. International Journal of Geographical Information Systems 6: 407-423.
Gordon, D. B. 1974. Management Information Systems: Conceptual Foundations, Structure, and Development. New York: McGraw-Hill.
Gordon, S. N., Johnson, N. K., Reynolds, K. M., Crist, P. and Brown, N. Decision support systems for forest biodiversity: evaluation of current systems and future needs. 2004. Final report – project A10. National commission on science and sustainable forestry.
Graham, R. T., Jain, T. B., and McCaffrey, S. 2004. Science basis for changing fuel structure to modify wildfire behavior and severity. USDA For. Serv. Gen. Tech. Rep. RMRS-GTR-120.
Haag, S., Cummings, M., McCubbrey D. J., Pinsonneault, A., Donovan, R. 2000. Management information systems for the information age. McGraw-Hill Ryerson Limited: 136-140.
Haettenschwiler, P. 1999. Neues anwenderfreundliches Konzept der Entscheidungsunterstützung. Gutes Entscheiden in Wirtschaft, Politik und Gesellschaft. Zurich, vdf Hochschulverlag AG: 189-208.
Hawkes, B. C., Taylor, S. W., Stockdale, C., Shore, T. L., Beukema, S. J., Robinson. D. C. E. 2005. Predicting mountain pine beetle impacts on lodgepole pine stands and woody debris characteristics in a mixed severity fire regime using PrognosisBC and the Fire and Fuels Extension. Natural Resources Canada, Canadian Forest Service, Pacific Forestry Centre, Victoria, BC. Mountain Pine Beetle Initiative Working Paper.
He, H. S., Li, W., Sturtevant, B. R., Yang, J., Shang, Z. B., Gustafson, E. J., and Mladenoff, D. J. 2005. LANDIS, a spatially explicit model of forest landscape disturbance, management, and succession—LANDIS 4.0 User’s guide. USDA Forest Service North Central Research Station General Technical Report. NC-263, 93 p.

69
Jankowski, P. 1995, Integrating geographical information systems and multiple criteria decision making methods. International Journal of Geographical Information Systems 9: 251-273.
Jankowski, P. and Nyergers, T., 2001, Geographic Information Systems for
Group Decision Making: Towards a Participatory, Geographic Information Science (New York: Taylor & Francis)
Janssen M. A., Goosen, H. and Omtzigt, N. 2006. A simple mediation and
negotiation support tool for water management in the Netherlands. Landscape and urban planning 78: 71–84.
Jimmie, D. C., Stalling C. and Moeller, K. 2004. Integrating knowledge for
simulating vegetation change at landscape scales. Western Journal of Applied Forestry 19. 102–108.
Jones, G., Sullivan, J., Krueger, K., Troutwine, J. 2003. A decision support
system for spatial analysis of fuel treatment options and effects at landscape. http://www.fs.fed.us/rm/missoula/4802/dssmagis.html.
Jun, C., 2000, Design of an intelligent geographic information system for multi-
criteria site analysis. URISA Journal 12: 5-17.
Kaloudis, S., Tocatlidou, A., Lorentzos, N. A., Sideridis, A. B., Karteris, M. 2005. Assessing wildfire destruction danger: a decision support system incorporating uncertainty. Ecological Modelling 181: 25–28.
Keenan, P. 1997. Using a GIS as a DSS Generator. http://mis.ucd.ie/staff/pkeenan/gis_as_a_dss.html
Keenan, P. and Morton, S. 1978. Decision support systems: an organizational
perspective. Reading, Mass., Addison-Wesley Publish Company.
Li, C., 2000. Reconstruction of natural fire regimes through ecological modelling. Ecological Modelling 134: 129–144.
LMS Website, http://lms.cfr.washington.edu/lms.html MAGIS website, http://www.fs.fed.us/rm/econ/magis/ Malczewski, J., 1999, GIS and Multicriteria Decision Analysis (New York: Wiley). Malczewski J. 2006. GIS-based multicriteria decision analysis: a survey of the
literature. International Journal of Geographical Information Science 20: 703-726.

70
Marakas, G. M. 1999. Decision support systems in the twenty-first century. Upper Saddle River, N.J., Prentice Hall.
Mark Twain National Forest - Forest Plan. USDA Forest Service, 2005.
McKeefry, J. F., He H. S., and Mladenoff, D. J. 1996. LANDIS/ArcView Interface (LDAVI V.2.x/3.x) User’s Guide. 21p.
Mladenoff, D. J., and He, H. S. 1999. Design and behavior of LANDIS, an object-oriented model of forest landscape disturbance and succession. Advances in spatial modeling of forest landscape change: approaches and applications. Cambridge University Press, Cambridge, UK.
Mladenoff, J. D., He, H. S. Beoder, J., and Crow, T. R. 1996. LANDIS : a spatial
model of forest landscape disturbance succession, and management in GIS and Environmental Modeling. Progress and Research Issues. Goodchild M. F. et al., Ed. GIS World Inc.
Muller, J-C. 1993. Latest developments in GIS/LIS. International Journal of
Geographical Information Systems 7: 293-303. Nagy, G. and Wagle, S. 1979. Geographic data processing, Computing Surveys
11: 139–181. Nyergers, T.L., 1992, Coupling GIS and spatial analytical models. In Proceedings
of 5th International Symposium on Spatial Data Handling, edited by P. Breshanan, E. Corwin, and D. Cowen (Eds). Charleston, SC. Humanities and Social Sciences Computing Laboratory, University of South Carolina: 534-543.
Peterson, D. L., Johnson, M. C., Jr., Agee, J. K., Jain, T. B., McKenzie, D., and Reinhardt, E. D. 2005. Forest structure and fire hazard in the western United States. USDA For. Serv. Gen. Tech. Rep. PNW-GTR-628.
Power, D. J. 2003. A Brief History of Decision Support System. DSSResource.com, World Wide Web, http://www.dssresources.com/history/dsshistory.html, Ver. 2.8.
Raymond, L. C. and Peterson, D. 2005. Fuel treatments alter the effects of wildfire in a mixed-evergreen forest, Oregon, USA. National Research Council Canada 2005: 2981–2994
RELM Website. 2006. http://www.fs.fed.us/institute/planning_center/plan_relm.html.

71
Reynolds M. K. 2005. Integrated decision support for sustainable forest management in the United States: Fact or fiction? Computers and Electronics in Agriculture 49: 6–23.
Scott, J. H., and Reinhardt, E. D. 2001. Assessing crown fire potential by linking models of surface and crown fire behavior. USDA For. Serv. Res. Pap. RMRS-RP-29.
Shang Z. B., He, H. S., Crow, T. R., Shifley, R. S. 2004. Fuel load reductions and fire risk in central hardwood forests of the United States: a spatial simulation study. Ecological Modelling 180: 89-102.
Shang Z. B., He, H. S., Lytle, D. E., Shifley, R. S, Crow, T. C. (in press). Long-term effects of fire suppression on Central Hardwood Forests in Missouri Ozarks, USA. Forest Ecology and Management.
Sharpe, P.J. H. 1990. Forest modeling approaches: compromises between generality and precision. Modeling of forest growth responses to environmental stress. Edited by Dixon, R.K. , Meldahl, R.S., Ruark, G.A. and Warren, W.G. Timber Press, Portland, Oregon. 180–190.
Shifley, S. R., Brookshire, B. L. 2000. Missouri Ozark Forest Ecosystem Project
Site History, Soils, Landforms, Woody and Herbaceous Vegetation, Down Wood, and Inventory Methods for the Landscape Experiment. Gen. Tech. Re NC-208. US Department of Agriculture, Forest Service, North Central Research Station, St. Paul, MN. 19–40.
Shifley S. R., Thompson III, F. R., Larsen, D. R., Mladenoff, D. J., Gustafson, E.
J., 2000a. Utilizing inventory information to calibrate a landscape simulation model. In: Proceedings of Integrated Tools for Natural Resources Inventories in the 21st Century, 1998. Gen. Tech. Rep. NC-212. St. Paul, MN: U.S. Department of Agriculture, Forest Service, North Central Research Station.
SIMPPLLE Website. 2006:
http://www.fs.fed.us/rm/missoula/4151/SIMPPLLE/Index.html Spectrum website. 2006
http://www.fs.fed.us/institute/planning_center/spec_update.html Sprague, R, H. 1980. A framework for the development of decision support
systems. Management Information Systems Quarterly 4: 1-26 Sprague, R. H. and Carlson, E. D. 1982. Building effective decision support
systems. Englewood Cliffs. N.J., Prentice Hall Business Publishing.

72
Stage, A. R. 2003. How forest models are connected to reality: evaluation criteria for their use in decision support. Canada Journal of Forest Resource 33: 410-421.
Turban, E. 1995. Decision support and expert systems: management support systems. Englewood Cliffs, N.J., Prentice Hall Business Publishing.
Twery, M. J. 2006. NED: A Set of Tools for Managing Nonindustrial Private
Forests in the East. http://www.fs.fed.us/ne/burlington/ned/pub1.htm. Twery, M. J., Rauscher, H. M., Bennett, D. J., Thomasma, S. A., Stout, S. L.,
Palmer, J. F., Hoffman, R. E., DeCalesta, D. S., Gustafson, E., Cleveland, H., Grove, J. M., Nute, D., Kim, G., Kollasch, R. P., 2000. NED-1: integrated analyses of forest stewardship decisions. Computers Electronics Agriculture 27: 167–193.
Uran, O., Janssen, R. 2002. Why are spatial decision support systems not used?
Some experiences from the Netherlands. Computers, Environment and Urban Systems 27: 511–526.
USDA and USDI. 2001. Urban wildland interface communities within vicinity of Federal lands that are at high risk from wildfire. Federal Register 66: 751–777.
Van Wagtendonk, J. W. 1996. “Use of a deterministic fire growth model to test fuel treatments.” Pp. 1155-1165 in: Status of the Sierra Nevada: Sierra Nevada Ecosystem Project Final Report to Congress Volume II. Wildland Resources Center Report No. 37. University of California, Davis: Center for Water and Wildland Resources.
VDDT website. http://www.essa.com/downloads/vddt/index.htm
Walker, D. H., 2002. Decision support, learning and rural resource management. Agriculture Systems 73: 113–127.
Wybo, J. 1998. FMIS: A Decision Support System for Forest Fire Prevention and Fighting. IEEE Transactions on Engineering Management 45: 127-131.
Yang, J. He, H. S.; Shifley, S. R. and Gustafson, E. J. 2007. Spatial Patterns of Modern Period Human-Caused Fire Occurrence in the Missouri Ozark Highlands. Forest Science 53: 1–15.
Zeiler, M. 2001. Exploiting ArcObjects. ESRI Press. Redlands, CA.

73
Zelnik, S. C. and Hughes, B. 2004. Mixed Severity Fire Regimes: Ecology and Management. Spokane, Washington. Washington State University Coop Extension Service/the Association for Fire Ecology, Pullman, Washington, Vol. AFE MISC03.
Zuuring, H. R., Wood, W. L. and Jones, J. G. 1995. Overview of MAGIS: A multi-
resource analysis and geographic information system. USDA Forest Service Resource Note INT-RN-427. 6p.

74
APPENDIX
Forestry Management Decision Support System (FMDSS)
User’s Guide
1 Introduction This User’s Guide has been written to aid users in the implementation of forestry management decision support system (FMDSS) with the LANDIS 4.0 model. It is intended as a manual with full explanations of each function as well as advice, tips and guidelines when using FMDSS. Readers interested in additional details are referred to other documents and LANDIS 4.0 user’s guide, which is available from the official LANDIS website (http://www.snr.missouri.edu/LANDIS/landis.html). 1.1 What is FMDSS? FMDSS (Forestry Management Decision Support System) is derived from the LANDIS 4.0 model, which is a spatially explicit model of forest landscape disturbance, management and succession. It is an effort to import the pre-parameterized LANDIS files into the system, display the parameters in the intuitive dialogs and provide a direct editing environment with strong error proof capabilities. Also, FMDSS is incorporated into ArcMap platform, which offers the extensive mapping and powerful GIS spatial analysis functionality. FMDSS also includes a toolset know as FMDSS Viewer, which eases the arrangement and display the output simulation results. FMDSS also can be called Enhanced Version of LANDIS 4.0. The system was designed from 2005 and completely finished in 2006 with Visual Basic 6 and ESRI ArcObjects libraries. 1.2 Why FMDSS? Landscape-scale models are of increasing interest in forest management, but most available models require complicated input parameters and numerous data sources. This limits forest managers’ willingness to use them, and therefore reduces the application of research designed to ensure more scientific environmental planning. The lack of feedback from managers then also hinders the further development of successful and useful landscape models. The development of FMDSS will bridge the gap between research and application. As the result, FMDSS will eventually eliminate the most time consuming parameter edit work in the simulation process when using the LANDIS model and furnish

75
some interactive tools allowing users to define their own prescriptions, as provides the capability to create more realistic scenarios. 1.3 Who should read this guide? This user’s guide is intended for the researchers or forest managers who already have the background and work experience on LANDIS model and LANDIS 4.0 program. It presents an overview of the FMDSS functionalities and the detailed descriptions of the usages that you can perform with FMDSS. For others who want to get familiar with the simulation of the forest landscape succession, disturbance and management with LANDIS model should refer to the LANDIS 4.0 User’s Guide first before getting into this guide. 1.4 What is the FMDSS input? As stated before, FMDSS is an enhanced version of LANDIS 4.0, so it doesn’t have its own input file format. It takes in any valid LANDIS 4.0 parameter files and the missing of any associated parameters or files will cause an unexpected error. Once the parameter files loaded successfully, the parameters will be shown in dialog formatted windows, which allows users to easily access the desired information. 1.5 How this User’s Guide is organized The main content is this User’s Guide is to explain the usage of each function provided in the two FMDSS toolbars and address some important issues, e.g., tips or warnings. To better understand the functionality, it is highly recommended that the LANDIS 4.0 User’s Guide be read first, which can be found at the LANDIS website. We hope that all the capabilities are covered in this document; if you have any questions or suggestions please contact Dr. He at [email protected].
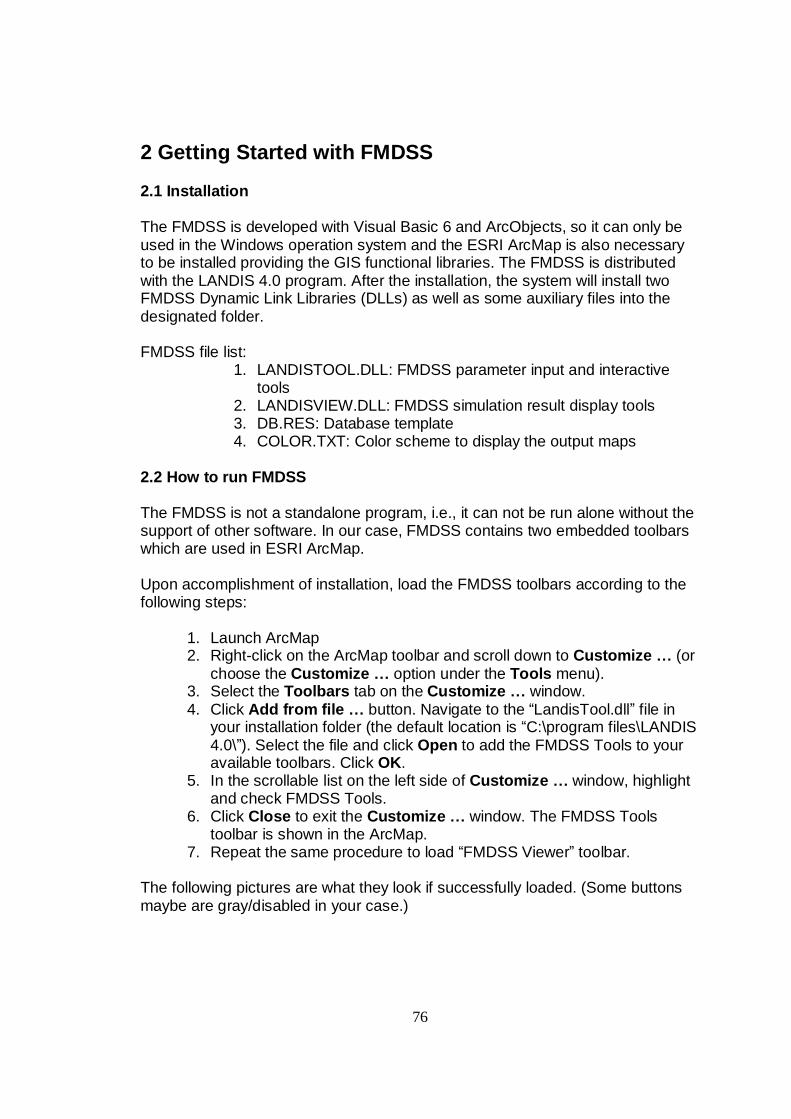
76
2 Getting Started with FMDSS 2.1 Installation The FMDSS is developed with Visual Basic 6 and ArcObjects, so it can only be used in the Windows operation system and the ESRI ArcMap is also necessary to be installed providing the GIS functional libraries. The FMDSS is distributed with the LANDIS 4.0 program. After the installation, the system will install two FMDSS Dynamic Link Libraries (DLLs) as well as some auxiliary files into the designated folder. FMDSS file list:
1. LANDISTOOL.DLL: FMDSS parameter input and interactive tools
2. LANDISVIEW.DLL: FMDSS simulation result display tools 3. DB.RES: Database template 4. COLOR.TXT: Color scheme to display the output maps
2.2 How to run FMDSS The FMDSS is not a standalone program, i.e., it can not be run alone without the support of other software. In our case, FMDSS contains two embedded toolbars which are used in ESRI ArcMap. Upon accomplishment of installation, load the FMDSS toolbars according to the following steps:
1. Launch ArcMap 2. Right-click on the ArcMap toolbar and scroll down to Customize … (or
choose the Customize … option under the Tools menu). 3. Select the Toolbars tab on the Customize … window. 4. Click Add from file … button. Navigate to the “LandisTool.dll” file in
your installation folder (the default location is “C:\program files\LANDIS 4.0\”). Select the file and click Open to add the FMDSS Tools to your available toolbars. Click OK.
5. In the scrollable list on the left side of Customize … window, highlight and check FMDSS Tools.
6. Click Close to exit the Customize … window. The FMDSS Tools toolbar is shown in the ArcMap.
7. Repeat the same procedure to load “FMDSS Viewer” toolbar.
The following pictures are what they look if successfully loaded. (Some buttons maybe are gray/disabled in your case.)

77
Figure 1. FMDSS Tools
Figure 2. FMDSS Viewer You are now ready to use the FMDSS tools! 2.3 Removing the FMDSS toolbars To remove the FMDSS toolbars from your ArcMap environment, open the Customize … window and uncheck the FMDSS tools and FMDSS viewer. 3 Contents of FMDSS As stated in the first chapter, the FMDSS program composes two parts: 1. FMDSS tools, which provides the functionality of importing valid LANDIS 4.0 parameter file, displaying various parameters in windows-style dialogs and furnish other enhanced spatial analysis capabilities to delineate specific fuel and harvest treatments. 2. FMDSS viewer, which provides some convenient menus and buttons to view the simulation results with predefined color schema in the time sequence. 3.1 Summary of FMDSS functions The routines of FMDSS Tools toolbar are categorized into four groups:
• Project management routine, includes three buttons: New Project to create a new LANDIS 4.0 parameter files, Open Project to open an existing LANDIS 4.0 parameter files and Save Project to export the current opening project into text format files and get ready to execute the simulation.
• Parameter management routine includes one button: Open LANDIS parameters to open the imported LANDIS project file. The button is disabled when there is no opening project file; once some project is imported into the FMDSS, the button is enabled.
• Fuel/Harvest Definition routine includes two groups of buttons. One group is to delineate the management area contains three buttons: create/select management areas by an interactive graphic tool and

78
set geographic layer as the management areas. The other group, containing two buttons: one for fuel treatment and one for harvest treatment are to define the treatment methods for the new created management areas.
• Simulation execution routine contains only one button to call the LANDIS 4.0 program to simulate the imported or saved projects.
The routines of FMDSS Viewer toolbar can be categorized into two groups: projects routine and map browse routine.
• The projects routine contains one button to open a valid LANDIS 4.0 parameter file and several menus as well as their submenus to add the related simulation output maps to the ArcMap data window.
• The map browse routine includes three buttons to help the user to navigate the desired output maps by three means: to next step, to forward step and to specified step.
3.2 Specifications of FMDSS Tools GUI (Graphical User Interface) The following of this chapter describes how to use the graphical user interface offers by FMDSS. The system provides the user a variety of methods for creating, importing, editing and running LANDIS 4.0 scenarios in conjunction with the LANDIS 4.0 program. The main controls of the application are available as toolbar format. The toolbars consists of graphical representations (icons) and drop-down menus. Note: For better understanding the meaning of the parameters shown in the dialogs, please refer to the LANDIS 4.0 User’s Guide. 3.2.1 Create a project (New project) This command will pop up a New Project Wizard letting the user to create a new LANDIS 4.0 project file based on the existing species, land type, land type map etc configuration files. Any invalid input (non-existing file or improper number) is not acceptable and the wizard can not go to the next step until the input is corrected. Note: Put the mouse on the input textbox or the browser button and hover for a few seconds, the tip will show the function of the current control. The user can quit the creation process by click Cancel at any time.

79
Figure 3. New Project Wizard 1 Figure 3 is an instance of the first step of the wizard. Upon the completeness of the mandatory parameters, click “Next” to enter the 2nd step (Shown as Figure 4). This dialog lets the user to define the optional LANDIS 4.0 modules: Wind, Fire, BDA, Fuel, and Harvest. The modules can be left blank as default “N/A” or can be setup by Browser the file …. The user may modify his/her configuration before the project file is saved into the hard disk.

80
Figure 4. New Project Wizard 2
3.2.2 Open an existing project This command provides the function to let user to import an existing LANDIS 4.0 parameterized project file. Once the file is loaded successfully, the Open table button will be valid and the user may open the parameter dialog to view and edit the parameters through the graphical interfaces. Note: It is a process to import the parameters into a predefined-structure MS Access database. Also the related maps will also be added into ArcMap. If the management area map is loaded, its transparency will be set 30% to show the stand map under it. 3.2.3 Save project This button lets the user to export the current opening project. All the associated files will be rewritten. Note: By far the LANDIS 4.0 program can only intake text format files as the input. So in fact, saving the project is a process exporting all the data in the MS Access to text files. All the editing does not takes effect until this command is executed. 3.2.4 Open parameters

81
If the project file is imported successfully, this tool is ready to use to open and edit the parameters. Figure 5 is an example of the parameter editor window of a project. The title of the dialog shows the current name and path of the project.
Figure 5. Parameter Editor Window
Note: All the editing is saved in the MS Access database temporarily, which means, it will not take effect until the data is saved/exported. Please refer to 3.2.3 Save project. From this main project editor window, the user can open other associated parameter windows, such as species, land type, map attribute, map index, age index and other optional modules. The following part will describe these editor windows.
• Species Editor (Figure 6): This dialog provides the user the functionalities to edit the species attribute. The species can be selected from the drop down menu.

82
Figure 6. Species Attribute Editor
• Land type Editor (Figure 7): This dialog is supposed to provide an environment to edit the land type attribute. From the drop down list, the user may pick up the land type he/she is interested in and show its properties. Select the species name in the species list box, the corresponding coefficient value is also highlighted. To change the value, double click the species name, the system will pop up a dialog asking the user to input a new valid number to update the selected coefficient.

83
Figure 7. Land Type Attribute Editor
• Map Attribute Editor (Figure 8): This editor window lets the user to view and edit the map attributes: select the class to be edited from the drop down list, then highlight the species and in the right panel the presented age cohorts will be checked. The user can edit the age spans and propagation flag.

84
Figure 8. Map Attribute Editor
• Map Index Editor (Figure 9): The user can display and edit the reclassification information of the output maps in this dialog. Select the Map Index from the drop down list and the cover type; change the positive or negative species for the corresponding cover type.

85
Figure 9. Map Index Editor
• Age Index Editor (Figure 10): This dialog offers the functionality to edit, add, remove and rename the map output phrases for each simulation iteration. Age index traces the dynamic of one or more species through the simulation run. All the available age indices name will be shown in the left list box when the editor window is loaded, select the age index you are interested in, the corresponding species will be highlighted in the right list box. You can also select the species to check its corresponding age index. If you select one species which has no age index match, the system will ask you whether you need to create an age index for that species. If you click “Yes”, the Add new age index will be active and the selected species and other available will be added into Species name combo box, name your new age index and click Insert, the age index list box will be updated and the new index will be added. Also you can Rename and Delete any age index shown in the age index list.

86
Figure 10. Age Index Editor
• Wind Module Parameter Editor (Figure 11): This dialog enables the user to view and edit the wind module parameters. It is only valid when the wind module is turned on.

87
Figure 11. Wind Module Parameter Editor
• Fire Module Parameter Editor (Figure 12): This dialog lets the user to view and edit the parameters in the fire module. It is valid only when the fire module is turned on. From this dialog, the user can open the Fire Regime Attribute Editor (Figure 13) to edit the values inside.

88
Figure 12. Fire Module Parameter Editor
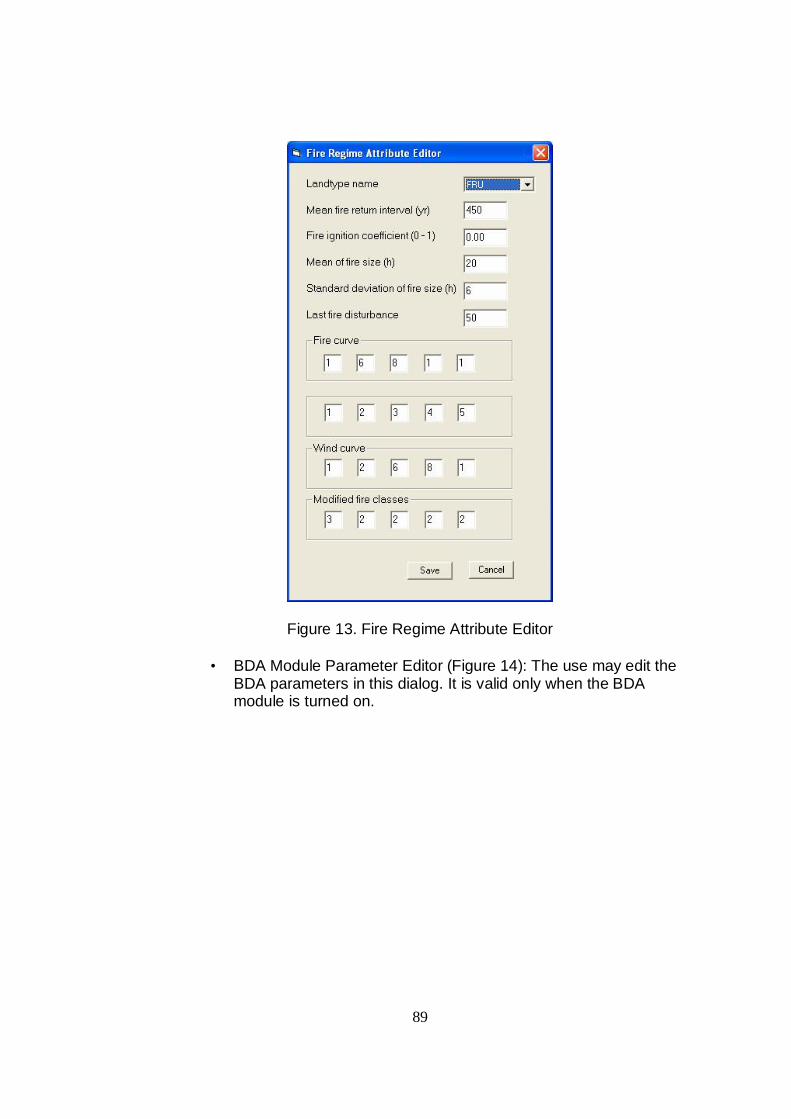
89
Figure 13. Fire Regime Attribute Editor
• BDA Module Parameter Editor (Figure 14): The use may edit the BDA parameters in this dialog. It is valid only when the BDA module is turned on.

90
Figure 14. BDA Module Parameter Editor
• Fuel Module Parameter Editor (Figure 15): The user may view the fuel module parameters through this window and the edit function is not provided. It is a bridge between the project file to the detailed fuel definitions. So from this window, the user can open other associated fuel dialogs, such as fuel module input parameters editor, fuel rules parameters editor, fire regime attribute editor and fuel management parameters editor, to edit fuel-related parameters.

91
Figure 15. Fuel Module Parameter Editor
• Harvest Module Parameter Editor (Figure 16): This window enables the user to edit the parameters of the initial harvest module definition. It is valid only when the harvest module is turned on. From this dialog, the user may open the harvest event definition dialog (Figure 17) to modify, add and delete harvest events. Here the Build Removal Mask function is elaborated. This button lets the user to define the removal mask for the harvest events. Click the button, the system will pop up the editor window, like Figure 18. The first level nodes of the tree represent all the species in this project. Double click the species node and expand to the second level: the number of the nodes shows the longevity of the species and each node denotes 10 years age span. Check the age cohorts if you want to remove them in your harvest events. The first level check box is the indicator of planting, check it if the species is planted. This dialog gives the user unlimited flexibility in tailoring the masks to the treatments to be simulated.

92
Figure 16 Harvest Module Parameter Editor
Figure 17 Harvest Events Editor

93
Figure 18. Removal Mask Generator
3.2.5 Draw polygons (New Polygon) This command is created for providing the user with the interactive functionality to define his/her own fuel or harvest treatments. With this tool, the user is furnished the unlimited capabilities to create more realistic scenarios according to the forest management situation. It also enhances the LANDIS 4.0 model with effective spatial analysis function. When the tool is activated, the mouse cursor is shown like , and then the user may define the management area in the map window. Double click to end the drawing of your current polygon. Note: Because the operation is conducted on the Management Area map, which is a raster layer, the tool will not be enabled unless some raster layer is added into the ArcMap window.

94
3.2.6 Select polygons Once the user creates one or more polygons on the map, he/she can activate this tool to select the polygon(s) where the new management area is supposed to be generated. Holding the Shift Key if you want to select more than one polygon at the same time. Note: This tool is not ready to use until one or more polygons created by the New Polygon tool. 3.2.7 Layer tool (Select a masking layer) This tool expands the capabilities of defining new management area. Rather than creating management area by an interactive graphic tool, it enables the user to create new area based on any valid feature classes (Vector Data, either in shape or coverage file format). It is a useful tool when new management area should be created according to some criteria. For example, the use may want to fuel the forest within 1000 ft of some residential area. He may create this new management area by the following steps:
1. Create the buffer zone based on the residential area and the buffer width
2. Export the buffer zone to a shape file 3. Bring the shape file back into ArcMap as the masking layer 4. Activate the Layer Selection Dialog to select this layer 5. Use New Harvest Definition Tool to define the treatment, which will
be covered in the next paragraph.
3.2.8 Fuel definition tool The system is required to meet both of the following conditions to define the new fuel treatment:
1. The fuel module is turned on 2. Either the user has created and selected the new management or chose
the masking layer
Click the button to pop up the fuel treatment definition dialog (Figure 19) and input the parameters to setup the new fuel treatment. The management area ID is generated automatically by the system, which is the maximum management area ID before processing plus 1. That process to ensure the new management ID is unique.

95
Figure 19. Fuel Treatment Definition Dialog
3.2.9 Harvest definition tool The usage of this tool is similar with the Fuel definition tool: it is used to define new harvest event. In the same way, the system is also need to meet two conditions before the user can use that tool:
1. The harvest module is turned on. 2. Either the user has created and selected the new management or chose
the masking layer
Click the icon on the toolbar to pop up the harvest event treatment definition dialog (Figure 20) and select the appropriate harvest regime tab then input the right parameters in the corresponding fields. Also management area ID is
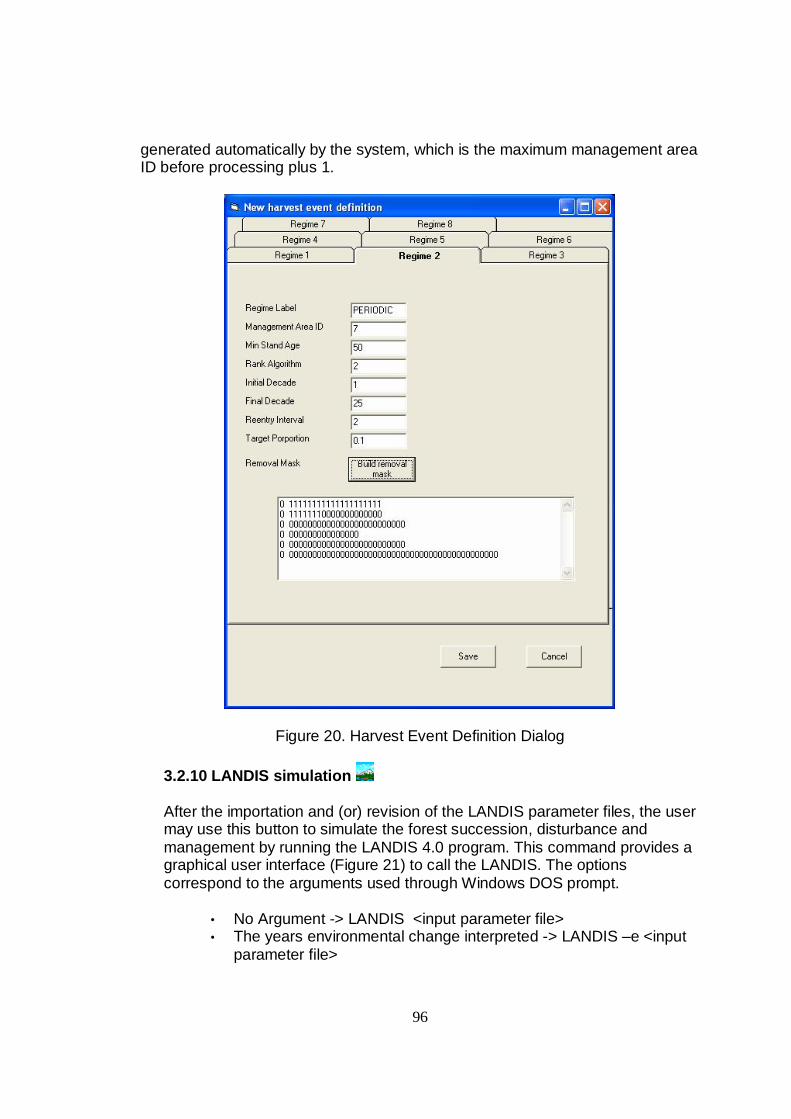
96
generated automatically by the system, which is the maximum management area ID before processing plus 1.
Figure 20. Harvest Event Definition Dialog
3.2.10 LANDIS simulation After the importation and (or) revision of the LANDIS parameter files, the user may use this button to simulate the forest succession, disturbance and management by running the LANDIS 4.0 program. This command provides a graphical user interface (Figure 21) to call the LANDIS. The options correspond to the arguments used through Windows DOS prompt.
• No Argument -> LANDIS <input parameter file> • The years environmental change interpreted -> LANDIS –e <input
parameter file>

97
• Help menu -> LANDIS –h <input parameter file> • Input file help -> LANDIS –p <input parameter file>
Figure 21 LANDIS Simulation Window
3.3 Specifications of FMDSS Viewer GUI (Graphical User Interface) This following part of user’s guide will cover the second toolbar of FMDSS: FMDSS Viewer, which is a toolset designed to view the LANDIS simulation output maps. It is composed by a series of menu and several navigation buttons and can be categorized into three groups:
• Project routine, includes one Open project button to load the output maps’ name list into FMDSS;
• Map routine, contains three menus and their submenus, which are dynamic according to the project imported. It is also the interface from where the user may add the output maps into ArcMap window;
• Navigation routine consists of three buttons to control the navigation of the maps in the time sequence. The user may browse the previous step map, the next step map and any valid step map by using the corresponding buttons.
3.3.1 Open Project Before the user can browse the simulation result, he/she needs to load the LANDIS 4.0 main parameter file into the FMDSS with this tool. Click the icon and select the parameter file in your hard drive. Note: Be sure the selected parameter file is already run by LANDIS program, i.e., the simulation results do exist before you can view them.

98
3.3.2 Map Menus Map menus contain three drop-down menus: Species, Age and disturbance. All the menus are dynamically link with the main parameter file the user imports (Figure 22). The system scans the file and loads the output map items under the corresponding menus. Species and Age menus always contain items while the content of the Disturbance menu depends on whether any of Wind, Fire, Fuel, BDA or Harvest modules is turned on. Note: The harvest output is also integrated into Disturbance menu for the easy managing purpose.
Figure 22 an Example of FMDSS View Menu
After the main parameter file is imported successfully, the user may choose any output map from the menus and load it into ArcMap. The loaded map is always the first iteration simulation result, such as bo0.gis, age0.gis or ywo0.gis. The maps are displayed in the predefined color schema. The same species or age cohorts will be represented by the same color in the ArcMap.
Note: The color schema is stored in Colors.txt file, which is usually located in the LANDIS 4.0 installation folder. Experienced users may customize the color schema according to their demands. There are 256 lines color configuration in RGB format in this file representing the raster value from 0 – 255. For the same line, the first number is the Red value, the 2nd number is the Green value and the 3rd number is the Blue value. The three numbers are separated by comma “,”. For example, if you want to change the color for the raster value 6, locate the 7th line of the file and change the values into your own RGB combination.
3.3.3 Navigation Buttons
These three buttons provide users an easy and effective way to browse the simulation result. The user may load maps in a continuous way by using the Next

99
Step icon or the Previous Step icon or in a discrete way by using Specify a Step to jump to a specified year directly. Note: For using the Next Step and Previous Step icons, a valid output map is required to be selected in the layer list in ArcMap Table of Content. Because the FMDSS needs to judge which step the navigation is based on, i.e., FMDSS needs to know the current step map before it loads next or previous step map into ArcMap.
This User’s Guide is supposed to cover every aspect of FMDSS operation. If you have any opinion or suggestion, please contact Dr. Hong S. Hong at [email protected]. We highly appreciate your concern with LANDIS 4.0 and FMDSS!