development of an emission reduction term for near-source
TRANSCRIPT

Development of an Emission Development of an Emission Reduction Term for NearReduction Term for Near--Source Source
DepletionDepletionChattenChatten Cowherd Cowherd
Mary Ann GrelingerMary Ann GrelingerMidwest Research InstituteMidwest Research Institute
Dick L. GebhartDick L. GebhartERDCERDC--CERLCERL
May 17 2006May 17 2006

Background
Air Quality Models for Fugitive Dust Consistently Overpredict Ambient PM-10 Concentrations by up to Factor of 4
Overprediction Places Unnecessary Restrictions on Military Training Activities

Military Training Activities
Unpaved RoadsTank TrailsVehicle ManeuveringConstruction ActivitiesSmoke Releases

Special Characteristics of Fugitive Dust
Ground Level Release with Electrostatic TribochargingWide Variety of Particle Sizes, from Sub-Micron to > 100 Micron DiametersAt Point of Release, Most Dust Mass Confined to Height of Vehicle or Other Source of Energy Input

Elevated Particle Capture Surfaces
TreesOther VegetationBuilding StructuresRough Terrain

Fugitive PM Emissions
Total PMMeasured at 5 m from source
Depleted PMCaptured within 100 m from source through variety of depletion mechanisms
Transportable PMLofted for transport beyond 100 mUnaffected by non-gravitational forces

Roadway Plume Profiling
Concentration Wind speed Mass flux Deposition Chemical constituents
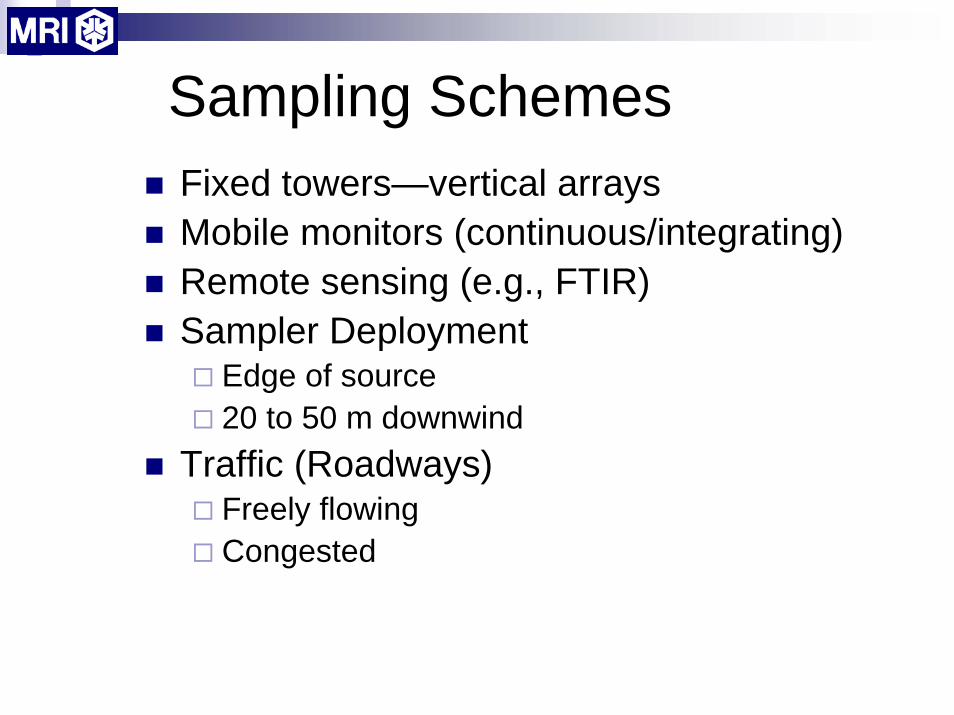
Sampling SchemesFixed towers—vertical arraysMobile monitors (continuous/integrating) Remote sensing (e.g., FTIR)Sampler Deployment
Edge of source 20 to 50 m downwind
Traffic (Roadways)Freely flowingCongested
Open Source Characterization
Measurement of plume concentration, wind speed and mass flux profiles at the edge of the source and at points downwindMeasurement of particle deposition (plume depletion) vs. distance from sourceDetermination of plume losses on vegetation and other types of groundcover

Collocated Plume Profilers

On-board Mobile Monitor

MRI Recirculating Wind Tunnel
Uniform Wind Velocity (< 10% variation over working cross section )Uniform Dust Concentrations (< 10% variation)Steady State Conditions (~ 2 hr) PM-10 Concentrations (up to 10 mg/m3
using 20 l/min injection air flow)


Exposure Chamber
withSampler
Inlets
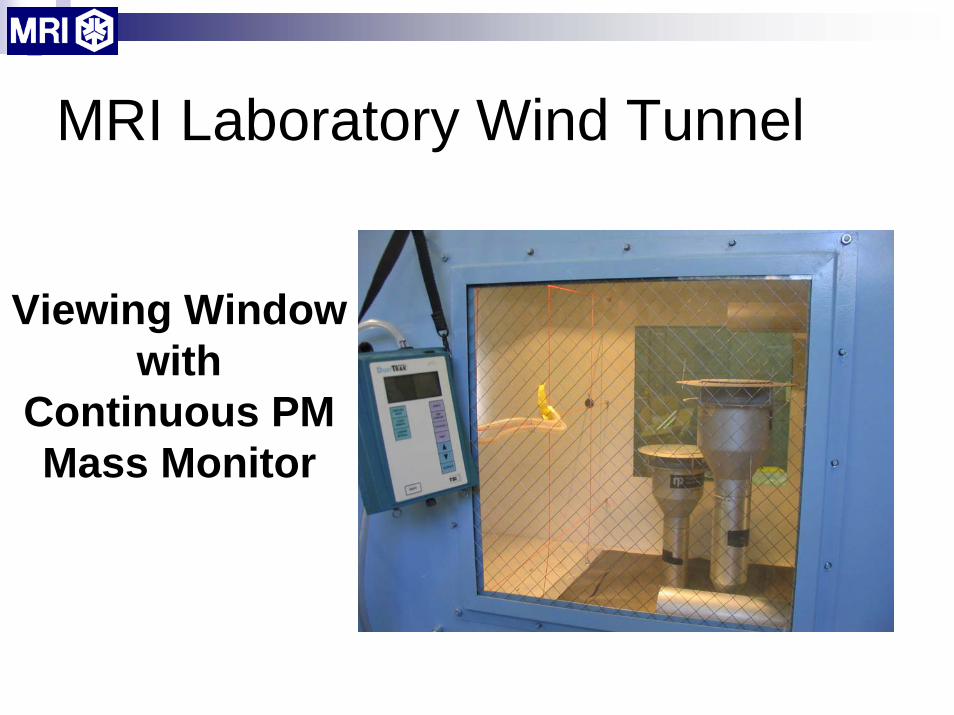
MRI Laboratory Wind Tunnel
Viewing Window with
Continuous PM Mass Monitor

Ref. Method Sampling Equipment

Vegetative Porosity: Wind Speed Reduction in Forests

Vegetative Capture of ParticlesTwo Series of Tests at Ft. Leonard Wood, MO, 2003-2004Two Series of Tests at Ft. Riley, KS, 2005

MRIStreamlined Profiling Tower in Trees

Collocated HVS-3 Cyclones

Deposition on Tall Grass at Ft. Riley KS

Example Plume Profiles

Type of Vegetation PM-10 Plume Loss*
Short Grass < 10%
Tall Grass 35-45%
Tall Cedar Trees 45-67%
Short Cedar Trees 29%
Tall Oak Trees (light winds)
41-50%
*20-30 m travel distance
PM-10 Deposition

Capture Efficency vs Wind Speed (h=3m)y = 5.8604x + 17.042
R2 = 0.8914
0
10
20
30
40
50
60
70
0 2 4 6 8 10
Wind Speed (mph)
Cap
ture
Effi
cenc
y
DFS Short GrassDFS Cedar TreesFLW Oak TreesFLW Cedar Trees
PM-10 Capture Efficiency on Oak and Cedar Trees
PM-10 Capture Efficiency on Tall Grass
Capture Efficency vs Travel Time
0
5
10
15
20
25
30
35
40
45
50
0 2 4 6 8 10 12
Trave Time to Tower B (s)
Cap
ture
Effi
cenc
y (%
)
Site 1 - 0.3 m Prarie GrassSite 2 - 1.2 m Prarie Grass
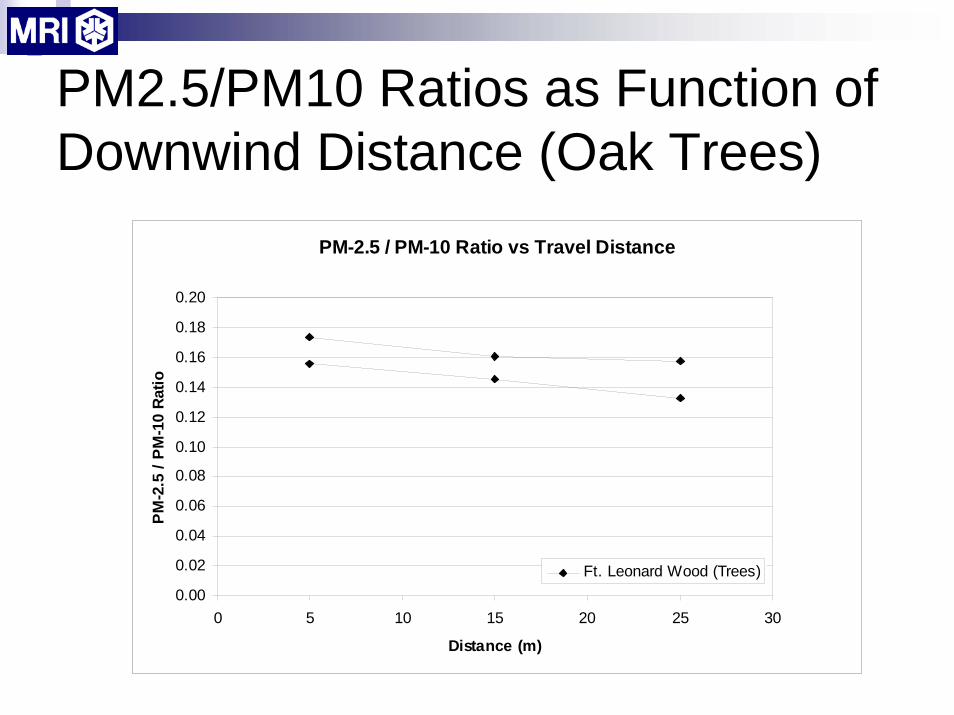
PM2.5/PM10 Ratios as Function of Downwind Distance (Oak Trees)
PM-2.5 / PM-10 Ratio vs Travel Distance
0.00
0.02
0.04
0.06
0.08
0.10
0.12
0.14
0.16
0.18
0.20
0 5 10 15 20 25 30
Distance (m)
PM
-2.5
/ PM
-10
Ratio
Ft. Leonard Wood (Trees)

Options for Modeling Representation of Near-Source DepletionMitigation Term on Emission Factor
Similar to any other natural mitigation effectUncontrolled emission factor remains in tact
Improved Deposition Algorithm within Dispersion Model
Builds on past approach to treatment of deposition

Mitigation Term--Advantages
Does not require changes to EPA modelsNear-source deposition zone (< 50-100 m) not normally associated with reliable predictionsVegetation (groundcover) is placed in same category as other dust control measures

Mitigation Term--Disadvantages
Near-source concentrations will be grossly underpredictedFor local effects, term must be direction specific, unless groundcover is uniformMay cause confusion over permitted emissions

Improved Algorithm--Advantages
Correctly represents actual emissions at the sourceHas the potential to correctly represent near-source plume impactsIs consistent with current algorithms that represent plume loss phenomena

Improved Algorithm--Disadvantages
Near source depletion phenomena will require complex mathematical representationWill also require detailed near-source groundcover inputsEPA model changes will require lengthy review period

Basis for Deposition Algorithm
Change in mass flux with distance is proportional to the remaining mass fluxProportionality constant, k, does not vary with heightk varies with vegetative density and wind speedNo further reduction in mass flux downwind of barrier

Dust Transport Across Vegetative Barrier
∫∞
=0
dhx)(h,ME(x)
E(x) = E0 exp (-kx)

Reduction of Plume Mass
0102030405060708090
100
0 20 40 60 80 100Distance (m)
Nea
r-So
urce
Per
cent
Red
uction
k = 0.035 m-1k = 0.0175 m-1k = 0.0035 m-1
Summary
Near-source dust depletion results from Electrostatic agglomeration Deposition on groundcover
Higher winds promote groundcover contactCapture efficiency is similar for PM-10 and PM-2.5Up to 50% plume loss occurs within 20-30 m from the source for tall vegetation
SummaryMitigation Term Offers Decided Advantages for Treatment of Plume Loss
Simpler approachRequires only basic knowledge of groundcover adjacent to sourceConservatism can be added to representation
Effective Method for Dealing with Current Over-Prediction of Dust Impacts
Will provide a source mitigation of at least a factor of 2 over a 50-100 m travel distance