development of an efficient protein extraction method ... extraction. phenol (p) method the powder...
TRANSCRIPT

ORIGINAL RESEARCHpublished: 15 August 2017
doi: 10.3389/fpls.2017.01416
Frontiers in Plant Science | www.frontiersin.org 1 August 2017 | Volume 8 | Article 1416
Edited by:
Karl-Josef Dietz,
Bielefeld University, Germany
Reviewed by:
Sudisha Jogaiah,
Karnatak University, India
Silvia Mazzuca,
University of Calabria, Italy
*Correspondence:
Manoj Kumar
†These authors have contributed
equally to this work.
Specialty section:
This article was submitted to
Plant Abiotic Stress,
a section of the journal
Frontiers in Plant Science
Received: 12 April 2017
Accepted: 31 July 2017
Published: 15 August 2017
Citation:
Jiang Z, Kumar M, Padula MP,
Pernice M, Kahlke T, Kim M and
Ralph PJ (2017) Development of an
Efficient Protein Extraction Method
Compatible with LC-MS/MS for
Proteome Mapping in Two Australian
Seagrasses Zostera muelleri and
Posidonia australis.
Front. Plant Sci. 8:1416.
doi: 10.3389/fpls.2017.01416
Development of an Efficient ProteinExtraction Method Compatible withLC-MS/MS for Proteome Mapping inTwo Australian Seagrasses Zosteramuelleri and Posidonia australis
Zhijian Jiang 1, 2†, Manoj Kumar 2*†, Matthew P. Padula 3, Mathieu Pernice 2, Tim Kahlke 2,
Mikael Kim 2 and Peter J. Ralph 2
1 Key Laboratory of Tropical Marine Bio-resources and Ecology, South China Sea Institute of Oceanology, Chinese Academy
of Sciences, Guangzhou, China, 2Climate Change Cluster (C3), Faculty of Science, University of Technology Sydney (UTS),
Sydney, NSW, Australia, 3 Proteomics Core Facility, University of Technology Sydney (UTS), Sydney, NSW, Australia
The availability of the first complete genome sequence of the marine flowering plant
Zostera marina (commonly known as seagrass) in early 2016, is expected to significantly
raise the impact of seagrass proteomics. Seagrasses are marine ecosystem engineers
that are currently declining worldwide at an alarming rate due to both natural and
anthropogenic disturbances. Seagrasses (especially species of the genus Zostera)
are compromised for proteomic studies primarily due to the lack of efficient protein
extraction methods because of their recalcitrant cell wall which is rich in complex
polysaccharides and a high abundance of secondary metabolites in their cells. In
the present study, three protein extraction methods that are commonly used in
plant proteomics i.e., phenol (P); trichloroacetic acid/acetone/SDS/phenol (TASP); and
borax/polyvinyl-polypyrrolidone/phenol (BPP) extraction, were evaluated quantitatively
and qualitatively based on two dimensional isoelectric focusing (2D-IEF) maps and LC-
MS/MS analysis using the two most abundant Australian seagrass species, namely
Zostera muelleri and Posidonia australis. All three tested methods produced high quality
protein extracts with excellent 2D-IEF maps in P. australis. However, the BPP method
produces better results in Z. muelleri compared to TASP and P. Therefore, we further
modified the BPP method (M-BPP) by homogenizing the tissue in a modified protein
extraction buffer containing both ionic and non-ionic detergents (0.5% SDS; 1.5% Triton
X-100), 2% PVPP and protease inhibitors. Further, the extracted proteins were solubilized
in 0.5% of zwitterionic detergent (C7BzO) instead of 4% CHAPS. This slight modification
to the BPP method resulted in a higher protein yield, and good quality 2-DE maps
with a higher number of protein spots in both the tested seagrasses. Further, the M-
BPP method was successfully utilized in western-blot analysis of phosphoenolpyruvate
carboxylase (PEPC—a key enzyme for carbon metabolism). This optimized protein
extraction method will be a significant stride toward seagrass proteome mining and
identifying the protein biomarkers to stress response of seagrasses under the scenario
of global climate change and anthropogenic perturbations.
Keywords: seagrass, proteomics, 2D-IEF, Zostera muelleri, Posidonia australis, LC-MS/MS

Jiang et al. Seagrass Proteomics-2D-IEF Compatible with LC-MS/MS
INTRODUCTION
Seagrasses (marine flowering plants), are marine ecologicalengineers delivering a range of ecologically and economicallyvaluable biological services to marine aquatic ecosystems(Larkum et al., 2006). They are rated the third most valuableecosystem globally with the average global value for theirecological services estimated at US $28,916 ha−1 yr−1 (Costanzaet al., 2014). However, seagrasses are currently facing a globalcrisis and are declining at an alarming rate (by >7% yr−1) dueto both natural and anthropogenic disturbances (Waycott et al.,2009).
Understanding of acclimation and/or tolerance mechanismof seagrasses to external perturbations is highly critical fordeveloping strategies to prevent the loss of seagrass meadow(Davey et al., 2016; Kumar et al., 2016). Toward this,identification of biomarkers such as protein markers has beensuggested as a possible solution that can provide early warningsignals to prevent the seagrass meadow’s demise before theypass the point of no return (Macreadie et al., 2014). Since,proteins respond dynamically to environmental fluctuations, theproteomics can provide novel insights into cellular pathwaysand biochemistry. To understand the change in state of theproteins, it is now common to perform a differential display ofthe proteome under contrasting conditions. Proteomics usingadvanced mass-spectrometry based approaches have had anincreasing impact on the study of terrestrial plant responsesto (a) biotic stresses (see references in Kumar et al., 2017).However, proteomics in seagrasses is still in its incipient stage fortwo primary reasons—(1) the lack of efficient protein extractionmethods, and (2) limited availability of genomic sequenceinformation. However, the recently published genome sequenceof Zostera marina (Olsen et al., 2016) enables seagrass researchersto integrate additional—omics data types such as genomicsand transcriptomics into their analysis of the physiologicaland molecular responses to environmental stress. Therefore,investigations into the seagrass proteome are important sinceproteins, unlike mRNA, are the direct effectors of the plant stressresponse.
Two-dimensional polyacrylamide gel electrophoresis (2-DE),established by O’Farrell, coupled with mass spectrometry (MS),is a cost effective and widely used proteomic technique.However, relatively expensive, alternative gel-free proteomicapproaches such as isotopic labeling (iTRAQ and TMT) andDataIndependent Acquisition (DIA/SWATH) are rapidly emerging(Hu et al., 2015). Irrespective of the technique used for proteomicstudies, effective protein extraction and solubilization areunquestionably the critical factors in obtaining comprehensiveproteome analysis. The comprehensive, unbiased extraction ofprotein from marine plants is particularly challenging due totheir recalcitrant cell wall and low protein content. Moreover,their cell wall and vacuoles that make majority of the cellmass are associated with several secondary metabolites thatstrongly interfere with 2-DE, resulting in horizontal and verticalstreaking, smearing, and reduced numbers of distinctly resolvedprotein spots (Wu et al., 2014a). The most common interferingsubstances in seagrasses are phenolic compounds, proteolytic
and oxidative enzymes, terpenes, pigments, organic acids, andcomplex cell wall polysaccharides such as lignin (Papenbrock,2012).
For recalcitrant plant tissues, protein extraction methods aretypically based on trichloroacetic acid (TCA)/acetone washingor precipitation steps followed by phenol extraction. Recently,Wu et al. (2014b) formulated a “universal protein extractionprotocol” for plant tissue by integrating TCA/acetone andphenol based methods with SDS extraction buffer to providean improved 2-DE based proteomic analysis for most of theterrestrial plant tissues. However, TCA/acetone- and phenol-based methods are lengthy and involve multiple washing steps,resulting in unavoidable loss of protein. A protein extractionprotocol designed for halophytes includes chemicals such asborax, polyvinyl-polypyrrolidone, phenol (BPP) and triton X-100 in the extraction buffer, has been shown to be effective inremoving interfering compounds and salts in a relatively shortertime without protein loss since it does not involve multiplewashing steps (Wang et al., 2007). To date, no common andsimple protocol exists for protein extraction that can be used ona large scale for marine plant proteomics, however few attemptshave been undertaken previously to obtain well-resolved 1-DEand 2-DE images in seagrasses (Spadafora et al., 2008; Serra andMazzuca, 2011 and references therein). There is a critical needfor such a rapid and efficient protocol, especially for projectswherein comparative proteomic analysis is required for seagrasssamples exposed naturally or in laboratory conditions to diversea(biotic) stresses. Such protocols should also be effective forprotein extraction for a range of marine plant species and alsofor different tissues.
In view of this and considering the fact that there are noreports on optimized protein extraction protocols for speciesof the genus Zostera, we compare three commonly used plantprotein extraction methods (P, TASP, and BPP) for 2-DEseparation. For this, the whole leaf tissue of two dominantseagrasses of Australia named Zostera muelleri and Posidoniaaustralis were used as an experimental model.
MATERIALS AND METHODS
Plant MaterialSamples of Z. muelleri were harvested from Narrabeen Lagoon(New South Wales, Australia) while samples of P. australis werecollected from Ports Stephens (New South Wales, Australia).Turfs of seagrass with 10–15 cm of intact sediment were carefullyremoved from the meadow using a hand spade and placed inplastic tubs. Wet paper towels were placed over the plants toprevent desiccation during transport. Plants were transportedback to the laboratory where they were cleaned of epiphytes andgrazers. Additionally, any intact sediment was washed from rootsand rhizome using natural filtered seawater of salinity 27 psu.The whole plant leaves were then separated at the horizontalcreeping rhizome, and freezed at −80◦C for later use for totalphenolics estimation and protein extraction. All the reagents usedin this study (otherwise stated) were purchased from Sigma-Aldrich.
Frontiers in Plant Science | www.frontiersin.org 2 August 2017 | Volume 8 | Article 1416

Jiang et al. Seagrass Proteomics-2D-IEF Compatible with LC-MS/MS
Total Phenolic Compound EstimationTotal content of phenolic compounds was determinedspectrophotometrically using Folin-Ciocalteu reagent followingKumar et al. (2011). In brief, methanolic extract (0.4 mL)obtained from 1 g fresh tissue was mixed with 0.15 mL ofFolin-Ciocalteu’s reagent. After 10 min incubation, 0.45 mL of20% sodium carbonate solution was added, and the mixture wasmixed thoroughly and allowed to stand at room temperaturein the dark for 1 h. Absorbance was measured at 725 nm, andtotal content of phenolic compounds was calculated based on astandard curve of phloroglucinol.
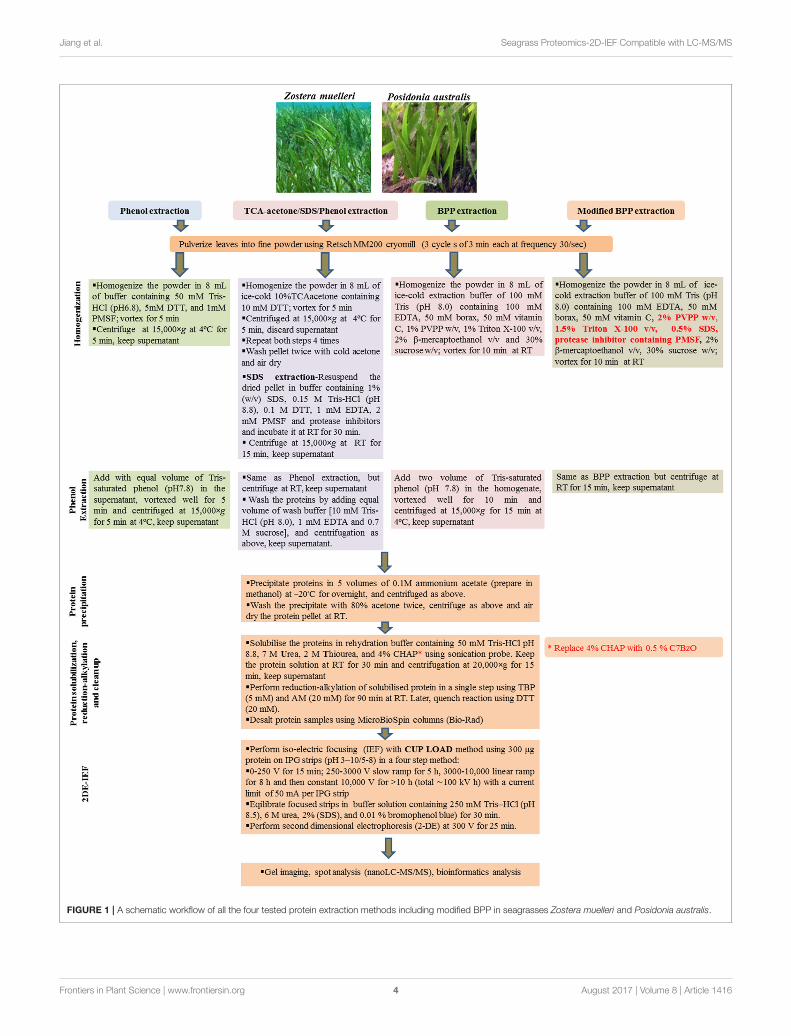
Protein ExtractionThree commonly used protein extraction methods, phenolextraction, TCA/acetone/SDS-phenol extraction andborax/polyvinyl-polypyrrolidone/phenol extraction wereevaluated using seagrass leaves (Figure 1). For each method,whole leaves of both Z. muelleri and P. australis (2 g FW) werepulverized using Retsch MM200 cryomill with a 1 cm stainlesssteel ball for 9 min in three cycles of 3 min each at a frequencyof 30/s. Later, the obtained fine talcum-like powder was used forprotein extraction.
Phenol (P) MethodThe powder was homogenized in 8 mL of buffer containing50 mM Tris-HCl (pH6.8), 5 mM DTT, and 1 mM PMSF, andvortexed for 5 min. The homogenate was transferred into 2mL eppendorf tubes and centrifuged at 15,000×g and 4◦C for5 min. The supernatant (crude extract) was transferred to newtubes. Equal volumes of Tris-saturated phenol (pH 8.0) wereadded to the tubes and phenol extraction was performed using amethodology adapted fromWu et al. (2014a). The mixtures werethoroughly vortexed for 5 min and centrifuged as above for phaseseparation. The organic phase was transferred in new eppendorftubes and precipitated using 5 volumes of 0.1M ammoniumacetate in methanol at −20◦C overnight, and centrifuged asabove. The precipitate was washed twice with 80% cold acetone.For each wash, 3 ml of 80% cold acetone was added, andthe precipitate was resuspended thoroughly by vortexing andcentrifuged as above.
Trichloroacetic Acid/Acetone/SDS/Phenol(TASP) MethodThis methodology was adapted from Wu et al. (2014b). Thepowder was resuspended in 8 mL of ice-cold 10%TCA/acetonecontaining 10mMDTT and vortexed for 5min. The homogenatewas then transferred to 2 mL Eppendorf tubes and centrifugedat 15,000×g at 4◦C for 5 min. This step was repeated for fourtimes, while re-suspending the pellet in cold TCA/acetone bypipetting and vortexing or drawing in and out of pellet with a1.0 mL pipette. Finally, the precipitate was washed twice withcold acetone as described above in the phenol extraction. Thepellet was collected and dried in fume hood to ensure that allof the acetone has evaporated. The dried pellet was resuspend insodium dodecyl sulfate (SDS) extraction buffer [containing 1%(w/v) SDS, 0.15M Tris-HCl (pH 8.8), 0.1 MDTT, 1 mM EDTA, 2mM PMSF and protease inhibitors cocktail (Roche, Germany)]and incubated at room temperature (RT) for 30 min followed
by centrifugation at 15,000 × g at RT for 15 min. The resultantsupernatant was transferred into new 2 mL Eppendorf tubes andan equal volume of Tris-saturated phenol (pH7.8) was added,vortexed well for 5 min and centrifuged at 15,000× g for 5 min atRT. The phenol phase (lower phase) containing the proteins wascollected in new eppendorf tubes and mixed well after adding anequal volume of wash buffer [10 mM Tris-HCl (pH 8.0), 1 mMEDTA and 0.7 M sucrose], followed by centrifugation as above.Later, the organic phase was collected in new 2 mL Eppendorftubes and proteins were precipitated using 5 volumes of 0.1Mammonium acetate in methanol and washed as described abovein “phenol extraction.”
Borax/Polyvinyl-Polypyrrolidone/Phenol(BPP) MethodThis methodology was adapted from Wang et al. (2007). Thepowder was resuspended in 8 mL ice-cold extraction bufferconsisting of 100 mM Tris (pH 8.0), 100 mM EDTA, 50 mMborax, 50 mM ascorbic acid, 1% PVPP w/v, 1% Triton X-100v/v, 2% β-mercaptoethanol v/v, and 30% sucrose w/v. Afterthe sample was vortexed for 10 min at room temperature, twovolumes of Tris-saturated Phenol (pH 8.0) were added and themixture further vortexed for 10 min. After centrifugation at15,000 × g for 15 min at 4◦C, the upper phase was transferredto a new centrifuge tube. An equal volume of extraction bufferwas added into the new tube, the mixture was then vortexed for10 min, followed by centrifugation as above. The upper phasewas then transferred to a new centrifuge tube and proteins wereprecipitated using 5 volumes of 0.1M ammonium acetate inmethanol and washed as described above in “phenol extraction.”
ModifiedBorax/Polyvinyl-Polypyrrolidone/Phenol(M-BPP) MethodThis methodology was adapted from Wang et al. (2007). Thepowder (obtained by pulverizing the tissue in cryomill) wasresuspended in 8 mL of ice-cold BPP extraction buffer asmentioned in the BPP method. However, the extraction bufferwas slightly modified by additional incorporation of the ionicdetergent-SDS (0.5% w/v) together with the non-ionic detergent1.5% triton X-100 (v/v), 2% PVPP (w/v), and protease inhibitorcocktail (Roche, Germany). The reagents SDS and PVPP wereadded in the extraction buffer from their stock solutions −
SDS (20% w/v) and PVPP (10% w/v) respectively. Proteaseinhibitor cocktail available commercially in the tablet form wasdissolved in the extraction buffer (1 tablet/50 mL extractionbuffer) using sonicator water bath. After the sample was vortexedfor 10 min at room temperature, two volumes of Tris-saturatedPhenol (pH 8.0) were added and then the mixture was furthervortexed for 10 min. After centrifugation at 15,000×g for 15min at 4◦C, the upper phase was transferred to a new centrifugetube. Equal volume of extraction buffer was added into the newtube, the mixture was then vortexed for 10 min, followed bycentrifugation as above. The upper phase was then transferredto a new centrifuge tube and proteins were precipitated using 5volumes of 0.1M ammonium acetate in methanol and washed asdescribed above in “phenol extraction.”
Frontiers in Plant Science | www.frontiersin.org 3 August 2017 | Volume 8 | Article 1416
Jiang et al. Seagrass Proteomics-2D-IEF Compatible with LC-MS/MS
FIGURE 1 | A schematic workflow of all the four tested protein extraction methods including modified BPP in seagrasses Zostera muelleri and Posidonia australis.
Frontiers in Plant Science | www.frontiersin.org 4 August 2017 | Volume 8 | Article 1416

Jiang et al. Seagrass Proteomics-2D-IEF Compatible with LC-MS/MS
Protein Solubilization,Alkylation-Reduction, and QuantificationThe precipitated proteins were solubilized in rehydration buffercontaining 50 mM Tris-HCl pH 8.8, 7 M Urea, 2 M Thioureaand 4% CHAPS. However, for the M-BPP method we replacedCHAPS with 0.5% C7BzO (UTC7). Solubilization was followedby the reduction and alkylation of disulfide bonds in a single stepusing tributylphosphine (reducing agent, 5 mM) and acrylamidemonomers (alkylating agent, 20 mM) for 90 min at RT. Thereaction was quenched using dithiothreitol (DTT, 20 mM).Protein samples were desalted using MicroBioSpin columns(Bio-Rad) equilibrated with UTC7 according to manufacturer’sinstructions, followed by centrifugation at 15,000× g for 10 min.The supernatant was collected for protein quantification andsubsequent 2-DE analysis. Protein concentration was determinedby SDS-PAGE and densitometry using bovine serum albumin asa standard.
Two-Dimensional Electrophoresis (2-DE),Gel Scanning, and Image AnalysisProtein (300 µg) was separated by isoelectric focusing (IEF)using a cup-loading method according to Kumar et al. (2017).Immobilized pH gradient (IPG) strips (Bio-Rad, pH 3–10 or 5–8,11 cm) were passively rehydrated in UTC7 rehydration solutionfor a minimum of 6 h at room temperature. Isoelectric focusingwas conducted in four steps as follows in a Protean IEF device(Bio-Rad): 250 V rapid ramp for 15 min, 4,000 V slow ramp for8 h, 10,000 V linear ramp for 5 h and then constant 10,000 V for>10 h (total ∼100 kV h) with a current limit of 50 mA per IPGstrip. The focused strips were then equilibrated in equilibrationsolution (containing 250 mM Tris–HCl (pH 8.5), 6 M urea,2% (SDS), and 0.01 % bromophenol blue) for 30 min. Uponequilibration, the strips were directly applied onto a precast 4–20% polyacrylamide gel (CriterionTM IEF Precast Gels, Bio-Rad)for second dimension electrophoresis at constant voltage of 300V, for 25min. Gels were then fixedwith 40%methanol, 10% aceticacid for 30 min before being stained with Coomassie Stain G-250 and scanned at 600 dots per inch with fluorescence scanner(Typhoon FLA-3500), then analyzed using PDQuest 2-D analysissoftware, version 8.0 (Bio-Rad, USA). Molecular masses wereestimated using a broad-range standard (Precision Plus, Bio-Rad)co-migrating in the SDS-PAGE.
Protein Identification and BioinformaticsAnalysisRandomly selected protein spots were excised from gels, trypsindigested, and analyzed by LC/MS/MS according to Kumar et al.(2017). Using an autosampler, connected to a nanoLC system(Tempo Eksigent, USA), 10 µL of the sample was loaded at20 µL/min with MS loading solvent (2% Acetonitrile + 0.2%Trifluoroacetic Acid) onto a C8 trap column (CapTrap. MichromBiosciences, USA). After washing the trap for 3 min, the peptideswere washed off the trap at 300 nL/min onto a PicoFrit column(75 µm × 100 mm) packed with Magic C18AQ resin (MichromBiosciences, USA). Peptides were eluted from the column and
into the source of a QSTAR Elite hybrid Quadrupole-Time-of-Flight mass spectrometer (Applied Biosystems/MDS Sciex) usingthe following program: 5–50% MS solvent B (98% Acetonitrile+ 0.2% Formic Acid) over 8 min, 50–80% MS buffer B over5 min, 80% MS buffer B for 2 min, 80–5% for 3 min. MSsolvent A consisted of 2% Acetonitrile + 0.2% Formic Acid. Theeluting peptides were ionized with a 75 µm ID emitter tip thattapered to 15 µm (New Objective) at 2,300 V. An IntelligentData Acquisition (IDA) experiment was performed, with a massrange of 375–1,500 Da continuously scanned for peptides ofcharge state 2+ to 5+ with an intensity of more than 30 counts/s.Selected peptides were fragmented and the product ion fragmentmasses measured over a mass range of 100–1,500 Da. The massof the precursor peptide was then excluded for 15 s.
Peptides were identified and protein identity inferred usingboth Mascot (Daemon, v2.4) and PEAKS Studio software(Peaks Studio 8.1, Bioinformatics Solutions Inc., Waterloo, ON,Canada). The settings used were as follows—FixedModifications:none; Variable Modifications: deamidation, propionamide,oxidized methionine; Enzyme: semi-trypsin; Number of AllowedMissed Cleavages: 3; Peptide Mass Tolerance: 100 ppm; MS/MSMass Tolerance: 0.2 Da; Charge State: 2+, 3+, and 4+ (Kumaret al., 2017).
The results of the search were then filtered by including onlyprotein hits with at least one unique peptide and excludingpeptide hits with a p > 0.05. Peptides were further validatedby manual inspection of the MS/MS spectra for the peptide toensure the b- and y-ion series were sufficiently extensive foran accurate identification. For further protein identification, theUniprot database of Z. marina and the customized databasegenerated by converting ESTs of different seagrasses into proteinsequences, were searched using PEAKS Studio v8.1 using thesame parameters as Mascot. Later, the PEAKS studio searchresults were exported into a mzXML file and normalized andquantified using Scaffold Version 4.0 software. The thresholdselection for the protein sequences was a PEAKS protein score>20 (the sum of the supporting peptide scores for each distinctsequence that are a representation of the p-value in PEAKSas a proxy of the LDF score, which measures the quality ofthe peptide-spectrum match; Kumar et al., 2017). Only proteinsshowing at least one peptide with an individual score confidence>20 in PEAKS, when the scaffold parameter was set at a proteinthreshold of 90% and peptide threshold of 95%, were consideredas valid candidates. For these proteins, MS/MS spectra were alsomanually validated by the presence of a series of at least foury-ions.
After PEAKS identification, protein sequences were analyzedusing BLAST-P to determine similarity with known proteinsin the NCBI database. The threshold was set to a minimalsignificance of 1e−3 and an identity percentage of >25%. Thetheoretical pI andmolecular weight of the blast hit was calculatedusing the ExPASy tool (http://web.expasy.org/compute_pi/). Theidentified proteins were further annotated using InterproScan(Finn et al., 2017). The Gene Ontology terms were inferred usingInterpro2GO (Gene Ontology Consortium, 2015). Subcellularlocalization of the proteins was assigned using Plant-mLoc(http://www.csbio.sjtu.edu.cn/bioinf/plant-multi/) and manually
Frontiers in Plant Science | www.frontiersin.org 5 August 2017 | Volume 8 | Article 1416

Jiang et al. Seagrass Proteomics-2D-IEF Compatible with LC-MS/MS
translated to Gene Ontology terms. GO terms were summarizedusing the GOSlimViewer tool included in AgBase based on thePlant GOSlim set (McCarthy et al., 2006).
Western Blot AnalysisAbout 2.5 to 25 µg of the isolated proteins were separatedvia SDS-PAGE and then transferred onto a polyvinylidenedifluoride (PVDF) membrane (GE Healthcare) for Westernblotting analysis. Western blot analysis was carried out usinga 1:500 polyclonal antibody raised against the evolutionarilyconserved sequence of Arabidopsis thaliana PEPC purchasedfrom Agrisera, Sweden (1:2,000 dilution) as primary antibodyand a goat anti-rabbit IgG-labeled with horseradish peroxidase(HRP) as the secondary antibody. The detection of the immuno-complexes was performed by the Clarity ECL Substrate (Bio-Rad,Australia).
Statistical AnalysisThe statistical results were presented as means ± SD (standarddeviation) of three biological replicates. Statistical analysis, one-way ANOVA, tests was performed with 5% level of significantusing the SPSS software (version 12.0).
RESULTS
Among the four tested protein extraction methods (P, TASP,BPP, and M-BPP), a modified BPP method (M-BPP) with theincorporation of 0.5% SDS, 1.5% Triton X-100, 2% PVPP, anda protease inhibitor cocktail for protein extraction and 0.5%of the zwitterionic surfactant C7BzO for protein solubilization,was found to produce most reproducible gels and highestprotein yield (0.79 mg/g fresh weight, FW) for Z. muelleri(Table 1). The protein extraction and 2D-IEF work flow for allthe tested methods is outlined in Figure 1. M-BPP resulted in adramatically higher number of protein spots (503, using pH 3-10 strip and 814 protein spots using pH 5-8 strip), which wassignificantly higher when compared to other methods (Table 1).The protein yield and number of protein spots obtained in all thetested methods followed the order: M-BPP>BPP>TASP>P forZ. muelleri. In contrast, all the tested methods were equally goodin obtaining a high protein yield with high protein spot numbersfor P. australis. In general, M-BPP resulted in 40% and 15%higher protein spots in Z. muelleri and P. australis, respectivelywhen compared to original BPP method.
Distinct qualitative and quantitative differences were noticedin the protein separation pattern between the methods examinedin the present study. For example, in both P and TASPmethods applied to Z. muelleri, the resolved proteins wererestricted to a pI range between 5 and 7 and molecularweight of 10–60 KDa with 183 ± 22 and 255 ± 25protein spots, respectively (Table 1, Supplementary Figure 1).Interestingly, in the TASP method, Rubisco proteins (largesubunit) were less abundant when compared to the Pmethod (Supplementary Figures 1A,B) showing an inefficientextraction. Further, proteins within the molecular weight (Mw)ranging from 12 to 20 kDa and pI 4.0–5.25 were moreabundant in TASP and BPP extractions than in the P andM-BPP extractions (Supplementary Figure 1B, see the proteinspots in red box). Protein identification of these protein spotsselected from acidic region of the 2D gels of Z. muelleri isprovided in Supplementary Table 1. In contrast, for P. australisproteins extracted by the P, TASP and BPP methods, mostof the proteins were resolved within the Mw 10–100 KDaand pI range 5–8 (Supplementary Figures 2A–C). Interestingly,the M-BPP method extracted a range of proteins that areacidic in nature, pI range between 4 and 5 and Mw 10–80KDa (Supplementary Figure 2D, see the protein spots markedin red). Protein identification of these protein spots selectedfrom acidic region of the 2D gels of P. australis is providedin Supplementary Table 1. Further, in the present study, thequantitative analysis of total polyphenolic compounds in leafexhibited a significantly higher level (>2-fold) in Z. muelleri incontrast to P. australis (Figure 2).
Examination of the 2D-PAGE results for proteins extractedfrom whole leaves, the modified BPP protocol generated fromseveral hundred (for Z. muelleri) to nearly thousand (for P.australis) protein spots with a broad distribution in both thehorizontal and vertical separation dimensions, within the pIrange between 3 and 10 (Supplementary Figures 1, 2), and pI5–8 (Figures 3B, 4B) and the molecular weight range from10 to >100 KDa. The spots showed superior resolution withclear background and minimal streaking while the spot shapeappeared round or elliptical, even at both cathode and anodeextremes (or around high abundant protein regions pI 5–7).To further evaluate the compatibility of this method with MS,protein spots were randomly excised from width and breadthof 2D-IEF gels for nano-LC-MS/MS analysis from both Z.muelleri and P. australis. All the selected protein spots indicatedby circles and marked with numbers (Figures 3B, 4B) were
TABLE 1 | Protein yield, protein spot numbers on 2DE and extraction process time in the four tested protein extraction methods.
Method Protein yield (mg/g fw) Spot number (pI 3–10) Time (h)
Z. muelleri P. australis Z. muelleri P. australis
P 0.30 ± 0.05 0.93 ± 0.09 183 ± 22 641 ± 33 1
TASP 0.41 ± 0.07 0.80 ± 0.11 255 ± 25 684 ± 23 3
BPP 0.58 ± 0.04 0.90 ± 0.10 360 ± 19 777 ± 28 1.5
M-BPP 0.79 ± 0.08 1.02 ± 0.08 503 ± 18 (814 ± 30) 898 ± 39 (1082 ± 36) 1.5
Values in () represent protein spots number on pI 5–8.
Frontiers in Plant Science | www.frontiersin.org 6 August 2017 | Volume 8 | Article 1416

Jiang et al. Seagrass Proteomics-2D-IEF Compatible with LC-MS/MS
FIGURE 2 | Total phenolics content in the leaves of seagrasses Zostera
muelleri and Posidonia australis. Different lower case letters represent the
statistical different at p < 0.05.
successfully analyzed by nano-LCMS/MS, identified, and listedin Tables 2, 3. Among the analyzed proteins, spot 6 for Z.muelleri (Figure 3B) and spot 2 for P. australis (Figure 4B) wererandomly chosen to demonstrate their identification in detail.The peptide sequences translated from the cDNA sequences(Figures 3, 4A), annotated peptide mass spectrum (Figures 3,4C), ion match summary (Figures 3, 4D), annotated top 10peptide match description (Figures 3, 4E) were demonstrated forselected spots in both seagrasses. The functional classificationof these selected proteins belonging to diverse biological,metabolic and cellular processes from both the seagrasses ispresented in Figure 5. Finally, we successfully immunoblottedthe phosphoenolpyruvate carboxylase (PEPC—a key enzyme incarbon metabolism) in the whole protein of Z. muelleri extractedusing M-BPP method. We could detect this protein efficientlywhile using a minimum of 5 µg of total protein (Figure 6).
FIGURE 3 | Demonstrative example for the identification of proteins extracted from leaves of seagrass Zostera muelleri. The protein spot (spot 6) was excised, trypsin
digested and analyzed using nanoLC-MS/MS. The peptide sequences translated from the cDNA sequences (A), 2D-IEF of proteins resolved on pI range 5–8 (B),
annotated peptide mass spectrum (C), ion match summary (D), top 10 annotated peptide with high −10logP score (E) are demonstrated for selected spots.
Randomly excised protein spots are encircled red and marked with their corresponding numbers. The protein sequences marked with dark letters represent the
matched peptides. The matched peptides marked with red under-line was identified and analyzed by nanoLC-MS/MS. The blue and red marked values in ion match
summary (D) represent the identified and matched amino acids from N- and C-terminal of a peptide sequence.
Frontiers in Plant Science | www.frontiersin.org 7 August 2017 | Volume 8 | Article 1416

Jiang et al. Seagrass Proteomics-2D-IEF Compatible with LC-MS/MS
FIGURE 4 | Demonstrative example for the identification of proteins extracted from leaves of seagrass Posidonia australis. The protein spot (spot 2) was excised,
trypsin digested and analyzed using nanoLC-MS/MS. The peptide sequences translated from the cDNA sequences (A), 2D-IEF of proteins resolved on pI range 5–8
(B), annotated peptide mass spectrum (C), ion match summary (D), top 10 annotated peptide with high −10logP score (E) are demonstrated for selected spots.
Randomly excised protein spots are encircled red and marked with their corresponding numbers. The protein sequences marked with dark letters represent the
matched peptides. The matched peptides marked with red under-line was identified and analyzed by nanoLC-MS/MS. The blue and red marked values in ion match
summary (D) represent the identified and matched amino acids from N- and C-terminal of a peptide sequence.
DISCUSSION
In marine macrophytes, proteomics-based approaches are still
in the incipient stage for use in understanding the acclimationand/or tolerance mechanisms to environmental cues. Marine
macrophyte protein extraction is particularly difficult due to low
protein concentrations and contaminant co-extraction. Due tothis, a specific protein extraction protocol needs to be optimized
and established for extracting the maximum amount and rangeof proteoform species in an unbiased manner, not favoring
particular proteins while leaving others behind and insoluble.
Toward this, protein extraction protocols have been refined toproduce well-resolved 1-D and/or 2-D PAGE images in seagrassPosidonia oceanica (Migliore et al., 2007; Spadafora et al., 2008;Mazzuca et al., 2009; Dattolo et al., 2013) and Cymodoceanodosa (Piro et al., 2015). These studies utilized the universal
protein extraction protocol wherein protein is precipitated inTCA and 2-ME in cold acetone, followed by several rinsing stepswith 2-ME in cold acetone and finally, resuspension of the drypellet in a buffer optimized for IPG strips. Considering theirpositive results, we tested phenol (Wu et al., 2014a) and theuniversal method (which is based on TCA-acetone-SDS-Phenolextraction; Wu et al., 2014b) for protein extraction in Z. muelleri.This method provided poor results on 2D-IEF when appliedto Z. muelleri leaves (Supplementary Figures 1A,B), howeverworked well with P. australis, suggested that the protocol forprotein extraction is plant and species-specific. Subsequently,we explored the BPP method of protein extraction which hasbeen successfully employed in the halophytes Salicornia europaea(Wang et al., 2007), Thellungiella halophile (Wang et al., 2013),and Sesuvium portulacastrum (Yi et al., 2014). The BPP methodwas comparatively better in terms of higher protein yield and
Frontiers in Plant Science | www.frontiersin.org 8 August 2017 | Volume 8 | Article 1416
Jiang et al. Seagrass Proteomics-2D-IEF Compatible with LC-MS/MS
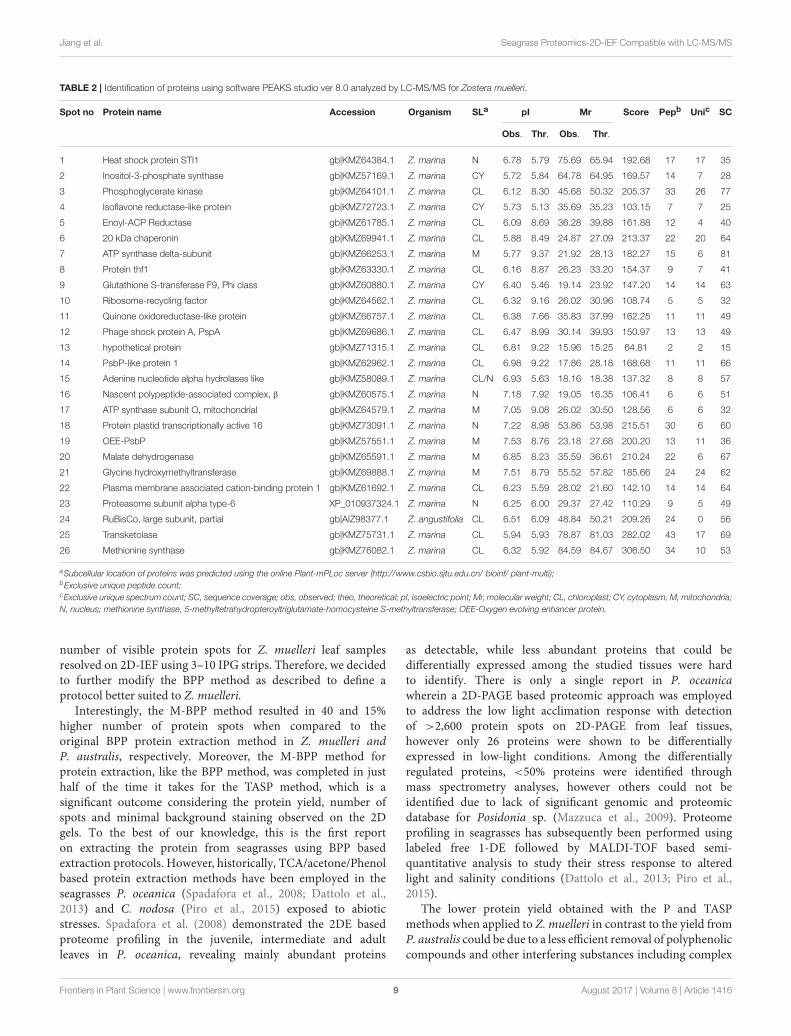
TABLE 2 | Identification of proteins using software PEAKS studio ver 8.0 analyzed by LC-MS/MS for Zostera muelleri.
Spot no Protein name Accession Organism SLa pI Mr Score Pepb Unic SC
Obs. Thr. Obs. Thr.
1 Heat shock protein STI1 gb|KMZ64384.1 Z. marina N 6.78 5.79 75.69 65.94 192.68 17 17 35
2 Inositol-3-phosphate synthase gb|KMZ57169.1 Z. marina CY 5.72 5.84 64.78 64.95 169.57 14 7 28
3 Phosphoglycerate kinase gb|KMZ64101.1 Z. marina CL 6.12 8.30 45.68 50.32 205.37 33 26 77
4 Isoflavone reductase-like protein gb|KMZ72723.1 Z. marina CY 5.73 5.13 35.69 35.23 103.15 7 7 25
5 Enoyl-ACP Reductase gb|KMZ61785.1 Z. marina CL 6.09 8.69 36.28 39.88 161.88 12 4 40
6 20 kDa chaperonin gb|KMZ69941.1 Z. marina CL 5.88 8.49 24.87 27.09 213.37 22 20 64
7 ATP synthase delta-subunit gb|KMZ66253.1 Z. marina M 5.77 9.37 21.92 28.13 182.27 15 6 81
8 Protein thf1 gb|KMZ63330.1 Z. marina CL 6.16 8.87 26.23 33.20 154.37 9 7 41
9 Glutathione S-transferase F9, Phi class gb|KMZ60880.1 Z. marina CY 6.40 5.46 19.14 23.92 147.20 14 14 63
10 Ribosome-recycling factor gb|KMZ64562.1 Z. marina CL 6.32 9.16 26.02 30.96 108.74 5 5 32
11 Quinone oxidoreductase-like protein gb|KMZ66757.1 Z. marina CL 6.38 7.66 35.83 37.99 162.25 11 11 49
12 Phage shock protein A, PspA gb|KMZ69686.1 Z. marina CL 6.47 8.99 30.14 39.93 150.97 13 13 49
13 hypothetical protein gb|KMZ71315.1 Z. marina CL 6.81 9.22 15.96 15.25 64.81 2 2 15
14 PsbP-like protein 1 gb|KMZ62962.1 Z. marina CL 6.98 9.22 17.86 28.18 168.68 11 11 66
15 Adenine nucleotide alpha hydrolases like gb|KMZ58089.1 Z. marina CL/N 6.93 5.63 18.16 18.38 137.32 8 8 57
16 Nascent polypeptide-associated complex, β gb|KMZ60575.1 Z. marina N 7.18 7.92 19.05 16.35 106.41 6 6 51
17 ATP synthase subunit O, mitochondrial gb|KMZ64579.1 Z. marina M 7.05 9.08 26.02 30.50 128.56 6 6 32
18 Protein plastid transcriptionally active 16 gb|KMZ73091.1 Z. marina N 7.22 8.98 53.86 53.98 215.51 30 6 60
19 OEE-PsbP gb|KMZ57551.1 Z. marina M 7.53 8.76 23.18 27.68 200.20 13 11 36
20 Malate dehydrogenase gb|KMZ65591.1 Z. marina M 6.85 8.23 35.59 36.61 210.24 22 6 67
21 Glycine hydroxymethyltransferase gb|KMZ69888.1 Z. marina M 7.51 8.79 55.52 57.82 185.66 24 24 62
22 Plasma membrane associated cation-binding protein 1 gb|KMZ61692.1 Z. marina CL 6.23 5.59 28.02 21.60 142.10 14 14 64
23 Proteasome subunit alpha type-6 XP_010937324.1 Z. marina N 6.25 6.00 29.37 27.42 110.29 9 5 49
24 RuBisCo, large subunit, partial gb|AIZ98377.1 Z. angustifolia CL 6.51 6.09 48.84 50.21 209.26 24 0 56
25 Transketolase gb|KMZ75731.1 Z. marina CL 5.94 5.93 78.87 81.03 282.02 43 17 69
26 Methionine synthase gb|KMZ76082.1 Z. marina CL 6.32 5.92 84.59 84.67 306.50 34 10 53
aSubcellular location of proteins was predicted using the online Plant-mPLoc server (http://www.csbio.sjtu.edu.cn/ bioinf/ plant-multi);bExclusive unique peptide count;cExclusive unique spectrum count; SC, sequence coverage; obs, observed; theo, theoretical; pI, isoelectric point; Mr, molecular weight; CL, chloroplast; CY, cytoplasm, M, mitochondria;
N, nucleus; methionine synthase, 5-methyltetrahydropteroyltriglutamate-homocysteine S-methyltransferase; OEE-Oxygen evolving enhancer protein.
number of visible protein spots for Z. muelleri leaf samplesresolved on 2D-IEF using 3–10 IPG strips. Therefore, we decidedto further modify the BPP method as described to define aprotocol better suited to Z. muelleri.
Interestingly, the M-BPP method resulted in 40 and 15%higher number of protein spots when compared to theoriginal BPP protein extraction method in Z. muelleri andP. australis, respectively. Moreover, the M-BPP method forprotein extraction, like the BPP method, was completed in justhalf of the time it takes for the TASP method, which is asignificant outcome considering the protein yield, number ofspots and minimal background staining observed on the 2Dgels. To the best of our knowledge, this is the first reporton extracting the protein from seagrasses using BPP basedextraction protocols. However, historically, TCA/acetone/Phenolbased protein extraction methods have been employed in theseagrasses P. oceanica (Spadafora et al., 2008; Dattolo et al.,2013) and C. nodosa (Piro et al., 2015) exposed to abioticstresses. Spadafora et al. (2008) demonstrated the 2DE basedproteome profiling in the juvenile, intermediate and adultleaves in P. oceanica, revealing mainly abundant proteins
as detectable, while less abundant proteins that could bedifferentially expressed among the studied tissues were hardto identify. There is only a single report in P. oceanicawherein a 2D-PAGE based proteomic approach was employedto address the low light acclimation response with detectionof >2,600 protein spots on 2D-PAGE from leaf tissues,however only 26 proteins were shown to be differentiallyexpressed in low-light conditions. Among the differentiallyregulated proteins, <50% proteins were identified throughmass spectrometry analyses, however others could not beidentified due to lack of significant genomic and proteomicdatabase for Posidonia sp. (Mazzuca et al., 2009). Proteomeprofiling in seagrasses has subsequently been performed usinglabeled free 1-DE followed by MALDI-TOF based semi-quantitative analysis to study their stress response to alteredlight and salinity conditions (Dattolo et al., 2013; Piro et al.,2015).
The lower protein yield obtained with the P and TASPmethods when applied to Z. muelleri in contrast to the yield fromP. australis could be due to a less efficient removal of polyphenoliccompounds and other interfering substances including complex
Frontiers in Plant Science | www.frontiersin.org 9 August 2017 | Volume 8 | Article 1416

Jiang et al. Seagrass Proteomics-2D-IEF Compatible with LC-MS/MS
TABLE 3 | Identification of proteins using software PEAKS studio ver 8.0 analyzed by LC-MS/MS for Posidonia australis.
Spot
no
Protein name Accession Organism SLa pI Mr Score Pepb Unic SC
Obs. Thr. Obs. Thr.
1 Aconitate hydratase gb|KMZ63807.1 Z. marina CY/M 6.53 6.48 98.62 108.15 140.5 11 1 12
2 Methionine synthase gb|KMZ76082.1 Z. marina CL 6.95 5.92 85.86 84.67 185.22 20 1 32
3 Transketolase gb|KMZ75731.1 Z. marina CL 6.23 5.93 74.17 81.02 115.73 5 1 9
4 Adenosylhomocysteinase gb|KMZ66813.1 Z. marina PX 6.14 5.60 49.83 53.56 128.50 15 7 21
5 Phosphoglycerate kinase gb|KMZ58914.1 Z. marina CL 6.09 6.21 41.22 42.66 268.72 33 8 71
6 Ferredoxin–NADP reductase gb|KMZ70342.1 Z. marina CL 6.26 8.68 34.15 40.56 182.21 20 15 52
7 GDP-mannose 3,5-epimerase 1 gb|KMZ73857.1 Z. marina GB 6.48 5.57 44.73 42.80 209.27 18 1 45
8 Isocitrate dehydrogenase (NADP(+)) gb|KMZ71727.1 Z. marina CL/CY/M/PX 6.77 5.81 48.32 50.21 149.10 13 4 29
9 Probable ATP synthase 24 kDa subunit, ref|XP_008791367.1 P. dactylifera M 6.21 7.74 27.82 28.02 68.78 2 2 24
10 Rhodanese-like domain-containing protein 14 ref|XP_002274646.1 V. vinifera CL 6.26 9.00 18.55 25.92 117.24 6 6 33
11 Glutathione S-transferase F7, Phi class gb|KMZ61632.1 Z. marina CY 6.55 5.44 23.78 24.38 97.74 6 5 25
12 Glutathione Peroxidase gb|KMZ63257.1 Z. marina CL/M 6.71 6.59 19.20 18.3 114.4 7 4 45
13 Ascorbate peroxidase 4 gb|KMZ62361.1 Z. marina CL 6.91 8.87 27.36 35.10 88.02 3 2 25
14 ATP sulfurylase 1 ref|NP_188929.1 A. thaliana CY 7.18 6.34 44.68 51.45 152.81 11 8 55
15 NADP-dependent G3PDH ref|XP_002279374.1 V. vinifera CY 7.47 6.67 56.82 53.17 113.39 5 2 60
16 G3PDH gb|KMZ64911.1 Z. marina CY 7.72 6.97 41.55 36.47 119.45 7 2 23
17 Nucleoside diphosphate kinase 3-like ref|XP_004244635.1 S. lycopersicum CY/CL/M/N 7.29 9.69 16.25 25.47 88.49 5 5 18
18 RuBisCO, large subunit gb|AIZ98377.1 Z. marina CL 6.61 6.09 120.18 50.21 109.89 7 0 34
aSubcellular location of proteins was predicted using the online Plant-mPLoc server (http://www.csbio.sjtu.edu.cn/bioinf/plant-multi);bExclusive unique peptide count;cExclusive unique spectrum count; SC, sequence coverage; obs, observed; theo, theoretical; pI, isoelectric point; Mr, molecular weight; CL, chloroplast; CY, cytoplasm, M, mitochondria;
GB, golgi body; N, nucleus; PX, peroxisome; G3PDH, glyceraldehyde-3-phosphate dehydrogenase; methionine synthase, 5-methyltetrahydropteroyltriglutamate-homocysteine
S-methyltransferase; A. thaliana, Arabidopsis thaliana; V. venifera, Vitis Vinifera; P. dactylifera, Phoenix dactylifera; Solanum lycopersicum, S. lycopersicum.
cell wall polysaccharides and pigments. The coextractionof non-protein cellular components such as phenolics andpolysaccharides adversely affects protein migration, resulting instreaking and smearing in 2D-PAGE with a reduction in thenumber of distinctly resolved protein spots (Wu et al., 2014a). Inthe present study, the quantitative analysis of total polyphenoliccompounds in leaves exhibited a significantly higher level in Z.muelleri in contrast to P. australis. The low cellular proteinscontent (due to the presence of large vacuoles) and presenceof high content of interfering compounds such as phenolicsor complex polysaccharides could be a possible reason for notobtaining high quality 2D gels in Z. muelleri with these methods.Z. muelleri leaf tissues have been shown to rich in phenoliccompounds like coumaric acid, cinnamic acid; flavanoids, aswell as lignins, and carbohydrates (Kuzhiumparambil et al.,in press). These compounds are known to form not only thehydrogen bonds with proteins but they also form irreversiblecomplexes with proteins by oxidation and covalent condensationwhich leads to charge heterogeneity resulting in streaking ofgels (Wu et al., 2014a). Further, co-extraction of carbohydratesblocks the gel pores causing precipitation and prolonged focusingtime, which may also result in loss of protein spots and streaksin the gels (Carpentier et al., 2005). Ferrat et al. (2012) alsodemonstrated a significantly higher level of phenolics in theleaves of Z. marina in contrast to P. oceanica. Altogether,this suggest that M-BPP method was efficient in removingthe polysaccharides and phenolics compared to P and TASP,thus resulted in 2DE gels with clear background and minimalstreaking for Z. muelleri.
Further, TASP involves the TCA/acetone based precipitationwhich typically requires extensive washing until the proteinpellet becomes colorless, which is time-consuming and resultsin the proteins having extended exposure to low pH. This maylead to protein degradation or modifications (Wang X. et al.,2016) as also observed in our present study with low numberof protein spots on 2DE gels for Z. muelleri. Further, in theTASP method, salt ions should be somewhat eliminated duringprotein precipitation with TCA, however, the sample produceddistinct horizontal streaks specifically for Z. muelleri proteins(Supplementary Figure 1B). Moreover, in the TASP methodfollowing protein precipitation, protein re-solubilization wasdifficult, necessitating solubilization using a sonication probe(3 times each with 5 s) while keeping the protein samplecold. Similar to our findings, dissolution of proteins followingprecipitation was also found to be quite difficult in TCA basedmethods which could lead to a lower protein yield in differenttissues of Cajanus cajan (Singh et al., 2015). However, incontrast to the TASP method in present study, the protein pelletsobtained in the BPP and M-BPP methodologies were easilydissolved in solubilization buffer (UTC− Urea+Thiourea+CHAPS/C7BzO) in the present study. C7BzO has previously beenshown to solubilize more proteins from plant samples at a lowerconcentration than CHAPS (Luche et al., 2003).
In present study, the incorporation of an ionic detergent (0.5%SDS) together with a non-ionic detergent (1.5% Triton X-100),2% PVPP and protease inhibitor cocktail into the extractionbuffer of the M-BPP method appeared not only to increasethe protein yield but also significantly reduced the interfering
Frontiers in Plant Science | www.frontiersin.org 10 August 2017 | Volume 8 | Article 1416

Jiang et al. Seagrass Proteomics-2D-IEF Compatible with LC-MS/MS
FIGURE 5 | Representation of functional classification of GO annotation distribution for the randomly chosen protein spots (red encircled spots shown in Figures 3, 4)
categorized to diverse biological process, molecular function, and cellular component in seagrasses Zostera muelleri (A) and Posidonia australis (B).
substances while inhibiting the protease activity and preventingthe protein degradation and phenolics oxidation. The presenceof both ionic and non-ionic detergents in the M-BPP proteinextraction buffer seemed efficient in breaking lipid-lipid andlipid-protein interactions, thereby isolating membrane proteinssuch as H+-transporting ATP synthase, plasma membraneintrinsic protein (PIP) aquaporins, and annexins (Vâlcu andSchlink, 2006). Incorporation of water-insoluble PVPP into theextraction buffer, which forms hydrogen bonds with phenoliccompounds (1–15%, depending on the content of polyphenolicsand pectin content), has been suggested as the most efficientpractice for the removal of phenolics from plant extracts(Isaacson et al., 2006). Incorporation of ascorbic acid, borax,PVPP, and β-mercaptoethanol into the protein extraction bufferhave been previously suggested to extract storage proteins fromthe recalcitrant tissues of olive leaf (Garcia et al., 2000), fromtropical trees (Tian et al., 2003) and halophytes (Wang et al., 2007,2013; Yi et al., 2014) possibly by preventing the oxidization ofpolyphenol to polyquinones and the activity of many oxidizing
enzymes under highly reduced conditions of the extractionbuffer. Historically, BPP based protein extraction methods hasbeen demonstrated as effective for the subcellular fractionation oflaticifer latex in Hevea brasiliensis (Wang et al., 2010) and in thestarch rich tuberous roots of Casava (Manihot esculenta; WangD. et al., 2016) producing protein extracts compatible with 2-DEand MS.
The protein spots that were randomly excised from widthand breadth of 2D-IEF gels obtained from M-BPP methodfor both Z. muelleri and P. australis, of protein solubilizedin UTC7 prior to IEF were successfully analyzed by nano-LC-MS/MS analysis. Progress in the area of proteomicsheavily relies on the development of analytical tools for thesensitive, selective, and high-throughput studies of proteinanalytes (Aebersold and Goodlett, 2001). MS has evolved intoa primary analytical tool for proteomics research, especiallywhen coupled with high resolution separation techniques, dueto the high information content that can be derived from thesecoupled techniques (Aebersold and Mann, 2003). Advances
Frontiers in Plant Science | www.frontiersin.org 11 August 2017 | Volume 8 | Article 1416

Jiang et al. Seagrass Proteomics-2D-IEF Compatible with LC-MS/MS
FIGURE 6 | Western blot detection of phosphoenol pyruvate carboxylase
(PEPC- a key protein of carbon fixation) protein from total protein extracted
using M-BPP method in Zostera muelleri. L-molecular weight ladder; lanes
1–6 represent the immunodetection of PEPC using total protein 25 µg (lane
1–2); 5 µg (lane 3–4); and 2.5 µg (lane 5–6) run in duplicates. Std- PEPC
standard marker protein. Since, PEPC was not detected in total protein
concentration ≤2.5 µg, the respective lanes have been deleted (black line)
from the original figure that were run before the Std-PEPC marker lane.
in MS have been substantially facilitated by two ionizationstechniques; electrospray ionization (ESI) and matrix-assistedlaser desorption/ionization (MALDI). ESI-MS produces highlycharged ions directly from liquids and is therefore useful forcoupling to liquid separations; however MALDI is fast andefficient and has a high tolerance to non-volatile buffers andimpurities (Aebersold and Goodlett, 2001). Mass spectrometryenables unambiguous identification of proteins by accuratemass measurements of gas-phase protein and peptide ions andpeptide fragment ions. ESI-MS linked to nanoliter-flow HPLCsystems are preferred proteomic analytical platform in providingseparation, mass determination, and amino acid sequencingin one analytical setup (LC-MS/MS; Aebersold and Mann,2003). Protein identification using LC-MS/MS is a concentrationsensitive technique and an extraction technique that results in ahigher intensity spot on 2D-PAGE will result in more peptides ofhigher abundance once trypsin digested. Thus, higher abundancepeptides will produce more comprehensive fragmentation andthus sequence data (Aebersold and Mann, 2003), providingmore confidence in the peptide identifications as observed inpresent study using the M-BPP method. In addition, as peptidesof different compositions do not ionize with equal efficiencies, ahigher concentration of protein and thus peptides obtained fromtrypsin digested protein spots in the present study increasedthe chances of detecting poorly ionizing peptides and lead togreater protein sequence coverage and more confidence inthe protein identification. For Z. muelleri, all the twenty six
excised protein spots were identified and classified into diversefunctionally categories wherein the majority of them belongto biological, cellular and metabolic processes with catalytic,binding and transferase activities. For most of the identifiedproteins the PEAKS score ranged between 103.15 and 306.5(except spot 13, score 64.81), with a high number of exclusiveunique spectrum count (2–26), high number of exclusive peptidecount (2–43), and high sequence coverage (15–81%). There werefew proteins wherein exclusive unique peptide count and/orexclusive unique spectrum count were low (spot 13, 16, 17, and24), however their PEAKS score and sequence coverage weresignificantly higher confirming their identity. Many of theseidentified proteins have recently been found to be differentiallyregulated in photo-acclimation responses (Kumar et al., 2017).Specifically, malate dehydrogenase, glycine hydroxymethyltransferase, transketolase, inositol-3-phoaphate sysnthase,glutathione S-transferase, and phosphoglycerate kinase havebeen suggested to play crucial role in acclimation by providingextra energy requirements and enhancing antioxidants levelsduring high light induced stress (Kumar et al., 2017). Recently,the functionality of many of the identified proteins in this studyhas been discussed in other seagrasses species such as P. oceanicaand C. nodosa for their involvement in acclimation/toleranceto low light, salinity and CO2 vents (Dattolo et al., 2013; Piroet al., 2015; Olivé et al., 2017; Procaccini et al., 2017). Similar toZ. muelleri, the identified proteins in P. australis were able to becategorized to diverse biological processes, localized to variouscellular components, showing considerably high scores, higherexclusive unique peptide and spectrum counts, and sequencecoverage.
Further, the proteins spots that were excised from theacidic region of 2D gel for Z. muelleri were successfullyanalyzed using LCMS/MS and identified as actin, huntingtin-interacting protein K, putative RNA binding protein, 60Sacidic ribosomal protein, however others were identified ashypothetical proteins, which is a common occurrence in allorganisms and not restricted to plants. However, the proteinsthat were excised from the acidic region of 2D gel of P. australiswere identified as profilin-1, ferrodoxin, rubisco activase, 60Sacidic ribosome protein, peroxiredoxin, RNA binding protein,ankyrin repeat containing protein, stromal heat shock protein,fructose bi-phosphatase, thiamine thiazole synthase, NADH-ubiquinone oxidoreductase, and ATPase-subunit. Many of theseidentified proteins specifically ferrodoxin, rubisco activase, actin,NADH-ubiquinone have recently been found to be differentiallyregulated in photo-acclimation responses (Kumar et al., 2017).
PEAKS analysis results revealed that the proteins spot selectedfor demonstration purpose in Z. muelleri (spot 6, Figure 3)was a 20 kDa chaperonin and in P. australis (spot 2, Figure 4)was 5-methyltetrahydropteroyltriglutamate-homocysteineS-methyltransferase (commonly known as methionine synthase-cobalamin independent) respectively. Recently, the crucial roleof chaperonin and methionine synthase in providing toleranceto elevated light exposure in Z. muelleri has been evidenced(Kumar et al., 2017). A high quality peptide sequence match,annotated peptide mass spectrum and ion match summaryobtained for both these and other randomly selected proteinspots using LC/MS/MS suggested that the modified BPP
Frontiers in Plant Science | www.frontiersin.org 12 August 2017 | Volume 8 | Article 1416

Jiang et al. Seagrass Proteomics-2D-IEF Compatible with LC-MS/MS
method is compatible with MS and can be used for furtherproteome mapping of Z. muelleri and P. australis leaf tissues.BPP based protein extraction, 2D-IEF and subsequent analysis ofdifferentially regulated proteins usingMALDI-TOF-MS has beensuccessfully employed in the halophytes S. europaea (Wang et al.,2007), T. halophile (Wang et al., 2013), and S. portulacastrum (Yiet al., 2014).
Finally, we successfully performed western blot analysis usingthe proteins extracted from M-BPP method for the detectionof phosphoenolpyruvate carboxylase (PEPC—a key enzyme incarbonmetabolism). Immunoreactive bands detected by the anti-PEPC antibody were reported. As expected, a band at an apparentmolecular mass of 110 kDa was recognized. This band lies in themolecular mass range of A. thaliana PEPC (105–110 KDa). Wecould detect this protein efficiently while using a minimum of 5µg of total protein. Recently, a significant down regulation of thePEPC transcript was observed in C. nodosa collected from CO2
vent site indicating an overall reduction of metabolic processesrelated with photosynthesis (Olivé et al., 2017).
CONCLUSION
By optimizing and modifying the BPP (M-BPP) method asdescribed in this study, we succeed in obtaining a higher yieldof proteins from seagrass (Z. muelleri and P. australis) leaves.The obtained proteins from both the seagrasses are resolved intoseveral hundreds to thousands of protein spots on 2D-PAGE. Theimproved method results in high quality 2D-PAGE spot patternsand immunoblots free from background smearing and streaking,without detrimentally affecting protein identification by LC-MS/MS analysis. This method is rapid and requires only 1.5 hcompared to the universal TASP method (3 h), and can be usedfor routine protein extraction from marine angiosperm plantsfor proteome mapping. To the best of our knowledge, this is thefirst time that the BPP method has been examined and modifiedfor its successful implementation for the proteome analysis ofmarine macrophytes. Further, it is highly likely that the resultsof proteomic studies when integrated with allied omic platforms,such as transcriptomics or metabolomics, will provide betterinsights on the acclimation/tolerance mechanisms of seagrassesin response to natural and anthropogenic pressure. This willfurther deepen our understanding of systems biology and willallow identification of the metabolic pathways that are crucial forthe survival of marine macrophytes under future climate changescenarios.
AUTHOR CONTRIBUTIONS
ZJ, MaK, MP, and PR conceived and designed research. ZJ,MaK, and MPP performed 2D-IEF and protein identificationusing LC-MS/MS and analyzed the data. PD and MiKperformed Western Blot analysis while kindly providingthe primary and secondary antibodies, and standard forPEPC enzyme. MaK, ZJ, and MPP, wrote manuscript.TK assisted in bioinformatics analysis. PR revised andedit the manuscript. All authors read and approved themanuscript.
ACKNOWLEDGMENTS
Author MaK is grateful to the Australian Research Council forawarding him Discovery Early Career Research Award (DECRAFellowship, DE150100461-2015). Author ZJ is grateful to theNational Basic Research Program of China (2015CB452905)and the Natural Science Fund of Guangdong (nos. 2014A030313734).
SUPPLEMENTARY MATERIAL
The Supplementary Material for this article can be foundonline at: http://journal.frontiersin.org/article/10.3389/fpls.2017.01416/full#supplementary-material
Supplementary Figure 1 | 2D-IEF analysis of extracted proteins from the leaf
tissue of seagrass Zostera muelleri among the four protein extraction methods–
phenol, P (A); TCA/acetone/SDA/Phenol, TASP (B); borax/polyvinyl
pyrrolidone/phenol, BPP (C); and modified BPP, M-BPP (D) extraction,
respectively, on linear gel strip pH 3–10. Randomly excised protein spots are
encircled and marked with their corresponding numbers. The red boxes indicated
the regions wherein few acidic protein spots were randomly excised and analyzed
by nanoLC-MS-MS. The green circle represent the RuBisCO large subunit protein
identified and reported by Kumar et al. (2017).
Supplementary Figure 2 | 2D-IEF analysis of extracted proteins from the leaf
tissue of seagrass Posidonia australis among the four protein extraction methods–
phenol, P (A); TCA/acetone/SDA/Phenol, TASP (B); borax/polyvinyl
pyrrolidone/phenol, BPP (C); and modified BPP, M-BPP (D) extraction,
respectively, on linear gel strip pH 3–10. Randomly excised protein spots are
encircled and marked with their corresponding numbers. The red boxes indicated
the regions wherein few acidic protein spots were randomly excised and analyzed
by nanoLC-MS-MS.
Supplementary Table 1 | Identification of proteins using software PEAKS studio
ver 8.0 from the excised spots resolved on 2DE (Listed in Tables 1, 2; and red
encircled spots shown in Supplementary Figures 1, 2), analyzed by LC-MS/MS
for seagrasses Zostera muelleri and Posidonia australis.
REFERENCES
Aebersold, R., and Goodlett, D. R. (2001). Mass spectrometry in proteomics.Chem.
Rev. 101, 269–295. doi: 10.1021/cr990076h
Aebersold, R., and Mann, M. (2003). Mass spectrometry based proteomics. Nature
422, 198–207. doi: 10.1038/nature01511
Carpentier, S. C., Witters, E., Laukens, K., Deckers, P., Swennen, R., and Panis,
B. (2005). Preparation of protein extracts from recalcitrant plant tissues:
an evaluation of different methods for two-dimensional gel electrophoresis
analysis. Proteomics 5, 2497–2507. doi: 10.1002/pmic.200401222
Gene Ontology Consortium (2015). Gene Ontology Consortium: going forward.
Nucleic Acids Res. 43:D1049. doi: 10.1093/nar/gku1179
Costanza, R., De Groot, R., Sutton, P., Van Der Ploeg, S., Anderson, S. J.,
Kubiszewski, I., et al. (2014). Changes in the global value of ecosystem
services. Glob. Environ. Change 26, 152–158. doi: 10.1016/j.gloenvcha.2014.
04.002
Dattolo, E., Gu, J., Bayer, P. E., Mazzuca, S., Serra, I. A., Spadafora, A., et al.
(2013). Acclimation to different depths by the marine angiosperm Posidonia
oceanica: transcriptomic and proteomic profiles. Front. Plant Sci. 4:195.
doi: 10.3389/fpls.2013.00195
Davey, P. A., Pernice, M., Sablok, G., Larkum, A., Lee, H. T., Golicz, A., et al.
(2016). The emergence of molecular profiling and omics techniques in seagrass
biology; furthering our understanding of seagrasses. Funct. Integr. Genomics 16,
465–480. doi: 10.1007/s10142-016-0501-4
Frontiers in Plant Science | www.frontiersin.org 13 August 2017 | Volume 8 | Article 1416
Jiang et al. Seagrass Proteomics-2D-IEF Compatible with LC-MS/MS
Ferrat, L., Willie-Echevarria, S., Cates, R. G., Pergent-Martini, C., Pergent, G.,
Zou, J., et al., (2012). “Posidonia oceanica and Zostera marina as potential
biomarkers of heavy metal contamination in coastal systems,” in Ecological
Water Quality —Water Treatment and Reuse, eds K. Voudouris and D. Voutsa
(Intech Open access), 325–342.
Finn, R. D., Attwood, T. K., Babbitt, P. C., Bateman, A., Bork, P., Bridge, A. J.,
et al. (2017). InterPro in 2017—beyond protein family and domain annotations.
Nucleic Acids Res. 45, D190–D199. doi: 10.1093/nar/gkw1107
Garcia, J. L., Avidan, N., Troncoso, A., Sarmiento, R., and Lavee, S. (2000).
Possible juvenile-related proteins in olive tree tissues. Sci. Hortic. 85, 271–284.
doi: 10.1016/S0304-4238(00)00123-0
Hu, J., Rampitsch, C., and Bykova, N. V. (2015). Advances in plant proteomics
toward improvement of crop productivity and stress resistancex. Front. Plant
Sci. 6:209. doi: 10.3389/fpls.2015.00209
Isaacson, T., Damasceno, C. M., Saravanan, R. S., He, Y., Catalá, C., Saladié, M.,
et al. (2006). Sample extraction techniques for enhanced proteomic analysis of
plant tissues. Nat. Protoc. 1, 769–774. doi: 10.1038/nprot.2006.102
Kumar, M., Kumari, P., Trivedi, N., Shukla, M. K., Gupta, V., Reddy, C.
R. K., et al. (2011). Minerals, PUFAs and antioxidant properties of some
tropical seaweeds from Saurashtra coast of India. J. Appl. Phycol. 23, 797–810.
doi: 10.1007/s10811-010-9578-7
Kumar, M., Kuzhiumparambil, U., Pernice, M., Jiang, Z., and Ralph, P. J. (2016).
Metabolomics: an emerging frontier of systems biology in marine macrophytes.
Algal Res. 16, 76–92. doi: 10.1016/j.algal.2016.02.033
Kumar, M., Padula, M. P., Davey, P., Pernice, M., Jiang, Z., Sablok, G., et al. (2017).
Proteome analysis reveals extensive light stress-response reprogramming in the
seagrass Zostera muelleri (Alismatales, Zosteraceae) metabolism. Front. Plant
Sci. 7:2023. doi: 10.3389/fpls.2016.02023
Kuzhiumparambil, U., Kumar, M., and Ralph, P. (in press). “Gas and liquid
chromatography-mass spectrometry-based metabolic profiling of marine
angiosperm Zostera muelleri (Alismatales, Zosteraceae),” in Systems Biology of
Marine Ecosystems: Molecular Ecology, eds M. Kumar and P. Ralph (Springer
International Publishing).
Larkum, A., Orth, R. J., and Duarte, C. (2006). Seagrass: Biology, Ecology and
Conservation. Dordrecht: Springer.
Luche, S., Santoni, V., and Rabilloud, T. (2003). Evaluation of nonionic and
zwitterionic detergents as membrane protein solubilizers in two-dimensional
electrophoresis. Proteomics 3, 249–253. doi: 10.1002/pmic.200390037
Macreadie, P., Schliep, M., Rasheed, M., Chartrand, K., and Ralph, P.
(2014). Molecular indicators of chronic seagrass stress: a new era in
the management of seagrass ecosystems? Ecol. Indic. 38, 279–281.
doi: 10.1016/j.ecolind.2013.11.017
Mazzuca, S., Spadafora, A., Filadoro, D., Vannini, C., Marsoni, M., Cozza, R., et al.
(2009). Seagrass light acclimation: 2-DE protein analysis in Posidonia leaves
grown in chronic low light conditions. J. Exp. Mar. Biol. Ecol. 374, 113–122.
doi: 10.1016/j.jembe.2009.04.010
McCarthy, F. M., Wang, N., Magee, G. B., Nanduri, B., Lawrence, M. L., Camon, E.
B., et al. (2006). AgBase: a functional genomics resource for agriculture. BMC
Genomics 7:229. doi: 10.1186/1471-2164-7-229
Migliore, L., Rotini, A., Randazzo, D., Albanese, N. N., and Giallongo,
A. (2007). Phenols content and 2-D electrophoresis protein pattern: a
promising tool to monitor Posidonia meadows health state. BMC Ecol. 7:6.
doi: 10.1186/1472-6785-7-6
Olivé, I., Silva, J., Lauritano, C., Costa, M. M., Ruocco, M., Procaccini, G., et al.
(2017). Linking gene expression to productivity to unravel long-and short-term
responses of seagrasses exposed to CO2 in volcanic vents. Sci. Rep. 7:42278.
doi: 10.1038/srep42278
Olsen, J. L., Rouzé, P., Verhelst, B., Lin, Y.-C., Bayer, T., Collen, J., et al. (2016).
The genome of the seagrass Zostera marina reveals angiosperm adaptation to
the sea. Nature 530, 331–335. doi: 10.1038/nature16548
Papenbrock, J. (2012). Highlights in Seagrasses’ Phylogeny, Physiology,
and Metabolism: what makes them special? ISRN Bot. 2012:103892.
doi: 10.5402/2012/103892
Piro, A., Marín-Guirao, L., Serra, I. A., Spadafora, A., Sandoval-Gil, J. M.,
Bernardeau-Esteller, J., et al. (2015). The modulation of leaf metabolism plays
a role in salt tolerance of Cymodocea nodosa exposed to hypersaline stress in
mesocosms. Front. Plant Sci. 6:464. doi: 10.3389/fpls.2015.00464
Procaccini, G., Ruocco, M., Marínguirao, L., Dattolo, E., Brunet, C., D’esposito,
D., et al. (2017). Depth-specific fluctuations of gene expression and protein
abundance modulate the photophysiology in the seagrass Posidonia oceanica.
Sci. Rep. 7:42890. doi: 10.1038/srep42890
Serra, I. A., and Mazzuca, S. (2011). “Posidonia oceanica: from ecological status to
genetic and proteomic resources,” in Seagrass: Ecology, Uses and Threats, ed R.
S. Pirog (New York, NY: Nova Science Publishers), 71–116.
Singh, N., Jain, N., Kumar, R., Jain, A., Singh, N. K., and Rai, V. (2015). A
comparative method for protein extraction and 2-D gel electrophoresis
from different tissues of Cajanus cajan. Front. Plant Sci. 6:606.
doi: 10.3389/fpls.2015.00606
Spadafora, A., Filadoro, D., Mazzuca, S., Bracale, M., Marsoni, M., Cardilio,
M., et al. (2008). 2-DE polypeptide mapping of Posidonia oceanica leaves, a
molecular tool for marine environment studies. Plant Biosys. 142, 213–218.
doi: 10.1080/11263500802150316
Tian,W.M.,Wu, J. L., Hao, B. Z., andHu, Z. H. (2003). Vegetative storage proteins
in the tropical tree Swietenia macrophylla: seasonal fluctuation in relation to a
fundamental role in the regulation of tree growth. Can. J. Bot. 81, 492–500.
doi: 10.1139/b03-045
Vâlcu, C., and Schlink, K. (2006). Efficient extraction of proteins from woody
plant samples for two-dimensional electrophoresis. Proteomics 6, 4166–4175.
doi: 10.1002/pmic.200500660
Wang, D., Sun, Y., Tong, Z., Yang, Q., Chang, L., Meng, X., et al. (2016). A
protein extraction method for low protein concentration solutions compatible
with the proteomic analysis of rubber particles. Electrophoresis 37, 2930–2939.
doi: 10.1002/elps.201600172
Wang, X., Chang, L., Tong, Z., Wang, D., Yin, Q., Wang, D., et al. (2016).
Proteomics profiling reveals carbohydrate metabolic enzymes and 14-3-3
proteins play important roles for starch accumulation during Cassava root
tuberization. Sci. Rep. 6:19643. doi: 10.1038/srep19643
Wang, X., Chang, L., Wang, B., Wang, D., Li, P., Wang, L., et al. (2013).
Comparative proteomics of Thellungiella halophila leaves from plants subjected
to salinity reveals the importance of chloroplastic starch and soluble
sugars in halophyte salt tolerance. Mol. Cell. Proteomics 12, 2174–2195.
doi: 10.1074/mcp.M112.022475
Wang, X., Li, X., Deng, X., Han, H., Shi, W., and Li, Y. (2007). A protein
extraction method compatible with proteomic analysis for the euhalophyte
Salicornia europaea. Electrophoresis 28, 3976–3987. doi: 10.1002/elps.2006
00805
Wang, X., Shi, M., Lu, X., Ma, R., Wu, C., Guo, A., et al. (2010). A method
for protein extraction from different subcellular fractions of laticifer latex
in Hevea brasiliensis compatible with 2-DE and MS. Proteome Sci. 8, 1–10.
doi: 10.1186/1477-5956-8-35
Waycott, M., Duarte, C. M., Carruthers, T. J., Orth, R. J., Dennison, W. C.,
Olyarnik, S., et al. (2009). Accelerating loss of seagrasses across the globe
threatens coastal ecosystems. Proc. Natl. Acad. Sci. U.S.A. 106, 12377–12381.
doi: 10.1073/pnas.0905620106
Wu, X., Gong, F., and Wang, W. (2014a). Protein extraction from plant tissues
for 2DE and its application in proteomic analysis. Proteomics 14, 645–658.
doi: 10.1002/pmic.201300239
Wu, X., Xiong, E., Wang, W., Scali, M., and Cresti, M. (2014b). Universal sample
preparation method integrating trichloroacetic acid/acetone precipitation with
phenol extraction for crop proteomic analysis. Nat. Protoc. 9, 362–374.
doi: 10.1038/nprot.2014.022
Yi, X., Sun, Y., Yang, Q., Guo, A., Chang, L., Wang, D., et al. (2014).
Quantitative proteomics of Sesuvium portulacastrum leaves revealed that
ion transportation by V-ATPase and sugar accumulation in chloroplast
played crucial roles in halophyte salt tolerance. J. Proteomics 99, 84–100.
doi: 10.1016/j.jprot.2014.01.017
Conflict of Interest Statement: The authors declare that the research was
conducted in the absence of any commercial or financial relationships that could
be construed as a potential conflict of interest.
Copyright © 2017 Jiang, Kumar, Padula, Pernice, Kahlke, Kim and Ralph. This
is an open-access article distributed under the terms of the Creative Commons
Attribution License (CC BY). The use, distribution or reproduction in other forums
is permitted, provided the original author(s) or licensor are credited and that the
original publication in this journal is cited, in accordance with accepted academic
practice. No use, distribution or reproduction is permitted which does not comply
with these terms.
Frontiers in Plant Science | www.frontiersin.org 14 August 2017 | Volume 8 | Article 1416