development of agri-pellet production cost and optimum size · (2006) estimated the economics of...
TRANSCRIPT
Bioresource Technology 101 (2010) 5609–5621
Contents lists available at ScienceDirect
Bioresource Technology
journal homepage: www.elsevier .com/locate /bior tech
Development of agri-pellet production cost and optimum size
Arifa Sultana a, Amit Kumar a,*, Don Harfield b
a Department of Mechanical Engineering, University of Alberta, Edmonton, Alberta, Canada T6G2G8b Alberta Innovates – Technology Futures, Vegreville, Alberta, Canada T9C1T4
a r t i c l e i n f o a b s t r a c t
Article history:Received 13 November 2009Received in revised form 29 January 2010Accepted 4 February 2010Available online 1 March 2010
Keywords:BiomassPelletsAgricultural residueOptimum sizeCost of production
0960-8524/$ - see front matter � 2010 Elsevier Ltd. Adoi:10.1016/j.biortech.2010.02.011
* Corresponding author. Tel.: +1 780 492 7797; faxE-mail address: [email protected] (A. Kuma
Minimum production cost and optimum plant size were determined for pellet plants using agriculturalbiomass residue from wheat, barley and oats. Three scenarios involving minimum, average and maxi-mum yields of straw were considered for developing a techno-economic model. The life cycle cost of pro-ducing pellets in Western Canada was estimated. The economically optimum size of production plant forthe three yield scenarios in tonne year�1 were 70,000, 150,000 and 150,000, respectively. The corre-sponding costs of production per tonne are $170.89, $129.42 and $122.17, respectively. However, the costof pellets does not change much for capacities over 70,000 tonne year�1 for both the average and max-imum yields. The optimum size is same for both average and maximum yield cases. Sensitivity analyseshave showed that the total cost of pellet production is most sensitive to field cost followed by transpor-tation cost. Currently, the cost of energy from agri-pellets is higher than that of energy from natural gas.
� 2010 Elsevier Ltd. All rights reserved.
1. Introduction
Energy security, global warming and utilization of local re-sources are the driving factors for using biomass as an alternativeenergy source. Biomass is nearly carbon neutral, hence its utiliza-tion for fuel helps mitigate greenhouse gas emissions. Studies haveestimated the amount of agricultural residue (e.g. wheat and bar-ley straw) available in Western Canada (Sokhansanj et al., 2006).Currently large amounts of these agricultural residues are left inthe field to rot, ultimately releasing carbon dioxide to the atmo-sphere. This biomass could be used to produce pellets which is aform of fuel. Biomass, including agricultural residue, is not compet-itive with fossil fuel (e.g. coal) for large scale power production inWestern Canada (Kumar et al., 2003). It can compete only if sup-ported by carbon credits (Kumar et al., 2003). The value of carboncredits required to make biomass competitive as fuel productiondepends on the type of biomass and the technology for its conver-sion to fuel (Kumar et al., 2003).
Biomass has low energy density (MJ m�3) and low yield per unitarea (dry tonnes ha�1) (Kumar et al., 2003). These two key factorsresult in a high cost of biomass delivery, which increases the totalbiomass-processing cost. Densified biomass, especially pellets hasdrawn attention due to its superiority over raw biomass in termsof its physical and combustion characteristics (Obernberger andThek, 2004). Like other biomass feedstocks, pellets are carbon neu-tral, i.e., the carbon emitted during their combustion is taken up in
ll rights reserved.
: +1 780 492 2200.r).
the re-growth of the biomass used to produce them. Moreover, pel-lets have other value-added advantages over raw biomass. Pelleti-zation reduces moisture content, increases energy content (MJkg�1), enhances combustion efficiency, and produces greaterhomogeneity of composition as compared to raw biomass (Obern-berger and Thek, 2004). The bulk density of biomass pellet is 4–10times that of ‘as received biomass’ (Karwandy, 2007). This makesfor easier handling and transport. All these factors make pelletsone of the more attractive forms of biomass-based energy.
Wood-based pellets are produced commercially around theworld (e.g. USDA, 2009) but there is limited production of agricul-tural biomass-based pellets. Few studies have reported results onthe economics of pellet production. Mani et al. (2006a) estimatedthe cost of producing pellets from sawdust, reporting that thesepellets could be economically produced at a cost of $51 tonne�1
for a plant with a capacity of 45,000 tonne year�1. The productioncost could be further reduced by using larger plants to gain bene-fits of economy of scale. Thek and Obernberger (2004) did a de-tailed study of sawdust pellet production in a European setting.Urbonowski (2005) derived the capital cost estimate from thisstudy and used in designing a Canadian pellet plant. Hoque et al.(2006) estimated the economics of wood pellet production for ex-port market. Other studies such as NEOS (1995) and Williams andLynch (1995) have worked on the cost of wood pellet production.Samson and Duxbury (2000) estimated the cost of switchgrass pel-lets for commercial purposes. Pastre (2002) analyzed the econom-ics of straw and wood pellets from a European perspective andoverviewed some technical problems related to the productionand utilization of pellets made from agricultural residue. Campbell(2007) estimated the cost of straw pellets at different capacities.

5610 A. Sultana et al. / Bioresource Technology 101 (2010) 5609–5621
Fasina et al. (2006) estimated the cost of pelleting switchgrass,peanut hull and poultry litter for heating greenhouses. There is lit-tle data, however, on the details of producing agricultural biomass-based pellets and how the cost of these varies according to thescale of the production plants.
The economics of biomass-processing facilities is different fromthat of fossil-fuel-based energy facilities. For the latter, largerplants are more cost effective, whereas, in the case of biomass-pro-cessing facilities, there is a trade-off between the cost of transport-ing biomass to the facility and the capital cost of the facility. Thecost of transportation of biomass increases as the size of theprocessing facility increases, because the area for collecting field-sourced biomass increases. The capital cost per unit of outputdecreases as the size of the facility increases, because there econo-mies of scale benefits. As a result of the trade-off between thetwo costs, there is a size of facility at which the cost of processingbiomass is minimal. This is the economically optimum size of thebiomass utilization facility. The development of pellet productionplants of this size reduces the total cost of producing of pellets.This concept has been applied to the production of fuels and elec-tricity from biomass (Larson and Marrison, 1997; Dornburg andFaaij, 2001; McIIveen-Wright et al., 2001). Kumar et al. (2003) esti-mated the optimal size for power plants using three biomasssources: straw, whole forest and forest residue. Jenkin (1997) esti-mated the optimal size for biomass utilization facilities under con-stant and variable costs. Nguyen and Prince (1996) determined theoptimal size for bio-ethanol plants processing sugarcane and sweetsorghum. Walla and Schneeberger (2008) estimated the optimalsize of a biogas plant. Other studies have assessed biomass eco-nomics from a general perspective (Overend, 1982; Larson andMarrison, 1997; Dornburg and Faaij, 2001; McIIveen-Wrightet al., 2001). However, none of these studies estimated the optimalsize for an agricultural biomass-based pellet production plant.There is very little information available on the economically opti-mum size for facilities producing agricultural biomass-basedpellets.
The key objective of this research is to develop a data intensivetechno-economic model for assessing the economic viability ofusing agricultural residue for pellet production. Specific objectivesinclude:
� Estimation of pellet production cost ($ per tonne of pellets) fromagricultural biomass (e.g. wheat, barley and oat straw) in Wes-tern Canada.
� Determination of the optimum size of the pellet productionplant based on agricultural biomass.
� Development of cost curves to study the variation in pellet pro-duction cost as the size of the pellet production plant varies.
The scope of this research is to conduct a techno-economicassessment for developing a straw pellet plant operating for30 years using wheat, barley and oat straw. This includes estimat-ing the cost of all operations including harvesting and collection,handling, storage, transportation, and pellet production.
2. Current technology for pellet production
Pellet production is a combination of sequential steps includingpreprocessing, drying, grinding, pelleting, cooling, screening, andbagging. These processes play an important role in the techno-eco-nomic analysis. A detailed review is provided elsewhere in the lit-erature (e.g. NEOS, 1995; Williams and Lynch, 1995; Samson andDuxbury, 2000; Pastre, 2002; Thek and Obernberger, 2004; Hoqueet al., 2006; Mani et al., 2006a; Wolf et al., 2006; Campbell, 2007;Karwandy, 2007).
Usually straw for processing into pellets comes in the form ofround or rectangular bales. Chopping of straw to reduce itslength is the first step. The length of the straw is reduced to2.5–10 cm (Jannasch et al., 2001) using a tub grinder or shredder.If straw has a high moisture content, drying is used to reduce thefeedstock moisture to a level suitable for pelleting. The averagereceived moisture content of straw before the drying process is15%; after drying it is 8–10% (Campbell, 2007). Dryer size shouldbe appropriate; over-sizing can increase capital and operatingcosts significantly. If straw is delivered to the pellet plant withmoisture content lower than 12% drying may be bypassed(Campbell, 2007). The rotary drum dryer is the one most com-monly used in pellet production plants (Campbell, 2007; Karw-andy, 2007). There is an additional cost for the associatedhopper, bin, and handling system if the biomass fuel requiresdrying.
The output of the dryer and tub grinder or shredder is thenground in a hammer mill to a small uniform size of 3.2 mm or less(Mani et al., 2006b). In other words, particle size reduction for pel-letization is a two-step process: chopping by tub grinder or shred-der and then grinding by a hammer mill. The particle size iscontrolled through the hammer mill’s changeable screen. Smallparticles increase the density and hardness of the pellets but veryfinely ground feedstock loses its fibrous characteristic (NEOS,1995). Grinding straw requires more energy than grinding woodybiomass, and therefore costs more.
The lignin content of wood is high and generally sufficient tobind wood pellets properly, but straw requires conditioning toachieve enough strength to provide durable pellets and minimizefines (Karwandy, 2007). Conditioning, which can be done withsteam or hot water to soften the fibrous material in straw, andmay require the inclusion of binder material. Usually the condi-tioning system is an integral part of pellet mill. The requirementof steam for conditioning purpose is approximately 4% of totalamount of biomass feedstock used (Thek and Obernberger,2004). At times binders such as starch, molasses, paraffin, or lig-nin sulphate are added to increase the pellet durability. Condi-tioned feedstock is fed into a pellet mill where rollers extrudeit, forcing it to pass through die holes which effectively compressit into pellets. Adjustable knives attached to the pellet mill cutthe pellets into desired length. A pellet mill has different feedrates over its die life. For example, a new pellet mill may run ata rate of 4.5 tonnes h�1, but, when half worn, it may need torun at 3.5 tonnes h�1, to maintain the required pellet quality(Wright, 2008). Straw has a higher mineral content and is there-fore more abrasive than wood. The pellet mill configurationincluding the effective die length, feed rate and rotating speedis set up differently for straw than for wood pellets. Operatingparameter including die temperature, pressure, and die/rollerconfiguration determine pelleting efficiency (Campbell, 2007).Pellets leaving the pellet mill at a high temperature and with ex-cess moisture are then cooled and dried using forced air over ascreen to gently cool the hot fragile pellets from 95–100 to25 �C. This results in increased hardness and durability of the pel-lets, and removes fines. The final moisture content is typically inthe range of 5–8%.
Screening is required to separate residual fines from the fin-ished pellets before bagging. Fines and fragments collected fromscreening are returned to the dryer or pelletizer. If fines exceed3% of the product issuing from the screening process there is aproblem with feedstock or the pelleting process which needs tobe corrected (Campbell, 2007). The last step of the pelleting pro-cess is to fill the appropriate (typically 18 kg) amount of pelletsinto bags and seal them. The bagging system may be manual,semi-automatic or fully automatic depending on the size of theplant.

A. Sultana et al. / Bioresource Technology 101 (2010) 5609–5621 5611
3. Methodology of techno-economic analysis and optimization
Detailed data collection was carried out for the development ofa data intensive techno-economic model of agricultural biomasspellet production. Various parameters were developed for the pel-let production plants and also taken from the existing literature.The determination of cost was based on data taken from the liter-ature, on personal communication with pellet plant manufactur-ers, equipment suppliers, and experts, and author developed data.
The techno-economic model was developed for a straw pelletplant operating for 30 years. All life cycle costs of the pellets wereconsidered, including the cost of obtaining the straw, transportingto pellet plant, and producing pellets. Costs incurred by the plantfor the production of pellets include capital cost, energy cost, em-ployee cost, and consumable cost. To develop the model, yields ofwheat, barley and oats were considered. The biomass procurementarea was determined to estimate the transportation cost. The scalefactors for all the equipment related to pellet production weredetermined based on the data of previous studies. All costs associ-ated with pellet production were added to the field and transpor-tation costs to obtain the total cost of pellet production. Iterationswere carried out to obtain the minimum cost of producing pellets.The capacity corresponding to the minimum cost of pellet produc-tion is the optimal size of the processing plant. The optimum sizeof the plant was determined for average, maximum and minimumbiomass yields. The following sections demonstrate the applicationof this methodology of techno-economic assessment and optimiza-tion to agricultural pellet production in Western Canada.
4. Assessment of availability of straw
Considering the variability of production and crop supply, theannual volume of straw that potentially could be procured in a par-ticular region can be assessed. The actual amount depends onmany factors which include biomass species, biomass yield, loca-tion, climate, time of harvest, and the technology used for the har-vesting and collection of the biomass. The yield of residue is animportant parameter for determining the capacity and location ofa bioenergy facility. It eventually affects the production cost.
The year-to-year supply availability of net crop residue (straw)is an important consideration for the development and operationof any bioenergy facility. The lifespan of a typical bioenergy facilityis 25–30 years which requires continuous and constant supply offeedstock. This is particularly true for facilities which depend onannual crop production.
In Western Canada (Alberta), the total average production ofwheat, barley and oats over the last 12 years (1997–2008) has been6.8, 6.3 and 0.72 million tonnes year�1, respectively. Since strawyield is not measured by farmers, the available straw productionvolumes are typically determined by measuring and applyingstraw to grain mass ratios. The average yields of wheat, barleyand oats are 2.66, 3.03 and 2.49 green tonnes ha�1, respectively.Different levels of straw to grain mass ratios were recommendedin different studies (Stumborg et al., 1996; Klass, 1998; Leveltonet al., 2000; PAMI, 2001; PFRA, 2003; Sokhansanj et al., 2006; Sok-hansanj and Fenton, 2006; Liu, 2008). After an extensive analysis ofall the values, the ratios adopted in this study for estimating cropresidue for wheat, barley and oats are 1.1, 0.8 and 1.1, respectively.To determine the net yield of straw, additional factors have beentaken into consideration. Some residue is retained for soil conser-vations, some is left on the field in accordance with the removalefficiency of the harvesting machine, and some is needed for live-stock feeding, bedding and mulching. There is a small amount ofstraw lost through handling, transport and storage. The quantityof straw is further reduced in accordance with its moisture content.
A portion of available straw must remain on the field to preventsoil erosion and maintain soil health and fertility. Previous studiesestimated different amounts of straw for soil conservation (Lind-storm et al., 1979; Stumborg et al., 1996; Campbell and Coxworth,1999; Kline, 2000; Sokhansanj et al., 2006; Liu, 2008). Consideringall the estimated values from the literature, an amount of0.75 tonne ha�1 was allocated to soil conservation in this study.Some of the residues are used for livestock feeding, bedding andmulching. Based on Sokhansanj et al. (2006), Alberta’s annualstraw requirement for livestock is considered to be 3.2 Mt for4.85 ha of land. In this study, the amount for livestock feedingand bedding was 0.66 tonne ha�1. The total yield was further re-duced by a number of factors, such as the portion of straw that aharvesting machine is capable of removing. Several earlier studieshave reported the harvest losses (e.g. Sheehan et al., 2003; Perlacket al., 2005; Sokhansanj and Fenton, 2006; Liu, 2008). Based on allthe available data a conservative estimate of 30% was used for har-vest loss in this study. Based on previous studies (Perlack and Tur-hollow, 2002; Hamelinck et al., 2005; Liu, 2008), the storage andtransportation loss was assumed to be 15%. Of this, field loss was3%, handling loss was 5% (Liu, 2008) and storage loss was 7%(3.5% for each storage) (Hamelinck et al., 2005). All these lossesare shown in Table 1.
In this study, the assumed moisture content of the straw was14%, wet basis. After considering all the factors mentioned above,the average net yields of wheat, barley and oat straw over twelveyears (1997–2008), are shown in Fig. 1. Gross yields refer to the to-tal yield of residue without any reduction in yield due to the vari-ous factors mentioned. The net yields take into account all thefactors which affects the yields. A wide variability was observedin the net yields of straw over the years. To develop our techno-economic model, we have considered three cases: the averageyield, the maximum yield, and minimum yield. Fuel and residueproperties of the three kinds of straws are shown in Table 2.
5. Input data and assumptions for development of costestimates
The production of pellets from agricultural residue involves har-vesting and collection, handling, storage, transportation and pelletproduction. Cost factors are developed for each element and arediscussed in detail in subsequent sections. Total cost incurred fromstraw harvesting to pellet production can be divided into threemain components:
(1) Field cost, all costs incurred in the field.(2) Cost of transportation from field to pellet plant.(3) Pellet production cost.
All cost figures are given in $US, base year 2008. The inflationrate is assumed to be 2.0%.
5.1. Field cost
The estimated price of biomass can vary from producer to pro-ducer and from plant to plant (Brechbill and Tyner, 2008). The fieldcost of agricultural residue consists of the cost of: harvesting andcollection, on-farm storage, nutrient replacement, and farmer’spremium. It is assumed that fuel consumption in collecting strawinvolves single pass, i.e. grain harvesting and stalk collection aredone at the same time. All costs were estimated based on the appli-cation of existing technologies and practice, therefore the cost ofharvesting biomass was based on current farming practice. As a re-sult, no tillage management practice was considered for estimatingthe straw recovery, and round bales were considered because they

Table 1Calculation of net yield for wheat, barley and oat straw.
Crop Averageyield grain(greentonne ha�1)
Strawtograinratio
Gross yield(greentonne ha�1)
Level of strawretained for soilconservation(green tonne ha�1)
Fraction ofstraw harvestmachine canremove (%)
Fraction removedfor animal feedingand bedding (greentonne ha�1)
Fraction of strawloss from harvestarea to pelletplant (%)
Net yield(greentonne ha�1)
Moisturein straw(%)
Net yield(drytonne ha�1)
Wheat straw 2.66 1.1 2.93 0.75 70 0.66 15 0.73 14 0.63Barley straw 3.03 0.8 2.42 0.75 70 0.66 15 0.48 14 0.38Oat straw 2.49 1.1 2.74 0.75 70 0.66 15 0.78 14 0.54
0.0
0.5
1.0
1.5
2.0
2.5
3.0
3.5
4.0
1996 1998 2000 2002 2004 2006 2008 2010
Year
Yiel
d (g
reen
tonn
e ha
-1)
Gross Yield Barley Straw Net yield Barley StrawGross Yield Wheat Straw Net Yield Wheat StrawGross Yield Oat straw Net Yield Oat Straw
Fig. 1. Gross and net yield of wheat, barley and oat straw.
Table 2Residue properties.
Characteristic Wheat straw Barley straw Oat straw Source
Moisture content (%) 15.9 13.6 17.2 Verhegyi et al. (2009)Heating value (GJ/odt) 17.8 19.20 18.10 Bailey-Stamler et al. (2007) and Chico_Santamarta et al. (2009)Bulk density (kg/m3) 79.0 82.0 85.0 Bailey-Stamler et al. (2007)
Nutrient content (%)Nitrogen 0.66 0.64 0.64 Kumar et al. (2003) and Bailey-Stamler et al. (2007)Phosphorus 0.09 0.05 0.10Potassium 1.60 2.5 2.4Sulfur 0.17 0.19 0.16Ash 8 8 7 Bailey-Stamler et al. (2007)
5612 A. Sultana et al. / Bioresource Technology 101 (2010) 5609–5621
are more prevalent. Bale weights vary in the range of 360–500 kg(Liu, 2008). It was assumed that all farmers are willing to sell theirstraw to a bioenergy facility.
5.1.1. Harvesting and collection cost of strawThe capital costs for harvesting equipment are not estimated in
this paper. It was determined that the pellet plant operators con-tract out the straw harvesting. It was therefore assumed that farm-ers harvest the straw and deliver it to the roadside in the form oflarge bales which they cover with tarp to limit the ingress of mois-ture. The pellet plant operator is responsible for arrangement ofbales pick-up. Another option could be assigning all activity to anintermediary party (a custom harvester) who harvests, collectsand delivers the straw to the biofacility as needed. This type ofintermediary party is called a third party logistic (3PL) provider.
This type of concept is now becoming popular. After farmers finishtheir harvest, custom harvesters harvest and bale the straw, putt-ing the bales near the edge of the field for collection and deliveryto the pellet plant. The hauling of the bales from the farmer’s fieldto the pellet plant can be done by the custom harvester or a com-mercial trucking company. Custom harvesters’ rates are based onthe equipment they use in harvesting but a typical rate is about$10.50 bale�1 ($21.00 tonne�1 for 500 kg bales) and $3.25 bale�1
($6.5 tonne�1 for road siding) (Campbell, 2007).Where straw is stored depends on the type of procurement sys-
tem used to collect it. There are three storage options available,including at the end-of-field, intermediate (central depot), andplant storage. In winter if the roads are impassible, end-of-fieldstorage might not be useful. However, from an economic perspec-tive end-of-field storage is a good option because it provides acces-

A. Sultana et al. / Bioresource Technology 101 (2010) 5609–5621 5613
sibility to both the farmer and the transporter. Intermediate (cen-tral depot) storage is feasible if the market matures for agriculturalpellets and other biomass products, creating many buyer and sup-pliers (Campbell, 2007). In most situations, storage at the plant willbe the most expensive option. Some companies needing high qual-ity feedstock, may choose plant storage in order to have better con-trol over the quality of their input feedstock and avoid spoilage andshrinkage (Liu, 2008).
5.1.2. Bale wrapping costThe type of wrap for the bales depends on the length of time of
its storage. The loss of dry matter during storage depends on howlong bale are stored and what type of wrapping is used. Sometimesit also depends on the type of the baler. Three types of bale wrap-ping are available – twine, net wrap, and plastic wrap. If the balesare stored for a short time, twine is useful, though losses will behigh. If bales have to be stored for a long time, extra protectionis required in order to reduce dry matter loss. In this situation,plastic wrapping is useful because it is the most protective of thethree options. Over 6 months storage time the dry matter loss fortwine is 18.8%, for net wrap it is 8.4% and for plastic wrap it is6.15% (Brechbill and Tyner, 2008). In this study, it is assumed thatbales are wrapped with twine.
5.1.3. Storage costThe quality of biomass and its cost depend on the type of stor-
age. In an enclosed storage structure, quality remains good due toless dry matter loss, but this is the most expensive option. Thecosts for various storage facilities include: on-field storage at$0.9–$1.8 tonnes�1, outside on a crushed rock base at $2.0–$2.7 tonne�1, open structure (under a roof) on a crushed rock baseat $5.4–$7.2 tonne�1, and enclosed structure with a crushed rockbase at $9–$13.5 tonne�1. The associated losses are 10–20%, 5%and 2%, respectively (Liu, 2008; Craig, 2008). In this study, balesare stored in the field in open condition.
5.1.4. Nutrient replacement costIn Western Canada the soil’s carbon level remains high in spite
of repetitive straw recovery because plant roots and the residue re-tained in the field, decompose in the soil (Kumar et al., 2003). Al-berta soil has an abundance of calcium and some minerals
Table 3Production and delivery cost of biomass.
Factor Value ($ tonne�1) Source/comments
Harvesting cost– Shredding 3.67 Brechbill and Tyne– Raking 2.31 Brechbill and Tyne– Baling 3.65 Brechbill and Tyne
Bale wrap– Twine 0.49 Brechbill and Tyne– Net wrap 1.77 Brechbill and Tyne– Plastic wrap 2.48 Brechbill and TyneBale collection– Bale picker 0.67 Liu (2008)– Tractor 3.58 Liu (2008)
Bale on-field storage cost– On-field storage 1.80 Campbell (2007)– Storage premium 0.10 Brechbill and Tyne
Farmer premium cost 5.50 Kumar et al. (2003
Nutrient replacement cost 22.62 Kumar et al. (2003– Nitrogen cost 1260 Four years (2005–2
multiplying by thephosphorous Pauly
– P2O5 cost 1240– K2O cost 440– Sulfur cost 520
(Kumar et al., 2003; AARD; 2009). Nitrogen, phosphorous, potas-sium and sulfur are the only fertilizers that need to be applied tothe soil (Kumar et al., 2003). Fertilizers containing these nutrientsare spread over the crop for replacement of the nutrients removedwhen straw is removed. The cost associated with these fertilizers isconsidered a nutrient replacement cost. Farmers usually apply fer-tilizer to their crops, so the nutrient payment is for incrementalfertilizer only and does not include the cost of application. The costof nutrient replacement is shown in Table 3.
5.1.5. Premium to the farmerTo ensure a constant supply of biomass throughout the year, a
premium should be paid to the farmer to encourage participationin biomass collection and selling. This cost is also shown in Table 3.
5.1.6. Storage premium costThis is the payment for the opportunity cost for the land on
which the bales are stored. If the bales are kept on the edge ofthe field for a long time, the land is not available for planting acrop. Table 3 shows the storage premium cost.
5.2. Transportation cost
It is assumed in this analysis that the area from which feedstockis drawn is circular. The center of the circular area can be a pelletplant or an intermediate storage area from which biomass is trans-ported to a pellet plant. It is assumed that biomass distribution isuniform within the circular area. Straw transport is done overexisting publicly maintained roads. Pellet plants are located nearexisting consumers adjacent to the transmission lines and biomassis transported from field to pellet plant by trucks.
The average radius of a circular area is rav ¼ 23 r, where r is the
length of the radius of the circular area. As all the transportationis not necessarily in straight line, a tortuosity factor of 1.27 is con-sidered in this study (Overend, 1982; Sarkar and Kumar, 2009).Perlack and Turhollow (2002) considered a tortuosity factor of 1.3.
For the Province of Alberta, the fraction of the total harvest areaused to grow wheat, barley and oats to total harvest area is 30%(Statistics Canada, 2008). This land is located mainly in southernAlberta which is a highly agriculturally intensive area. This studyassumes that the storage of big round bales is at the roadside
r (2008)r (2008)r (2008)
r (2008)r (2008)r (2008)
r (2008)
)
)008) average data has been taken. The nutrient replacement is determined byamount of nutrient per unit of fertilizer. K2O is 83% potassium. P2O2 is 44%(2008) and Jensen (2008)

Table 4Input data and assumptions for techno-economic model.
Factors Value
Plant life (years) 30a
Inflation 2.0%b
Internal rate of return 10%c
Material loss during pelleting process 5%d
Plant operating factore
Year 1 0.70Year 2 0.80Year 3 and onward 0.85
Spread of capital cost during constructionf
Year 1 20%Year 2 35%Year 3 45%
Cost of additional equal sized pellet plant unit relative to the first 0.95g
Other costs such as tax, insurance etc. are assumed to be a percentageof capital cost
0.5%
Power requirement for different equipment for pellet productionh,i (KW)Primary grinder 112Dryer 120Hammer mill 75Boiler 75Pellet mill 300Cooling 5Bagging 40Other 40Lighting and heating 112
a Plant life for the pellet plant is assumed based on the other biomass-processingfacilities. There is large number of studies which assumes similar number Kumaret al. (2003) and Sarkar and Kumar (2009).
b This is the average inflation over 12 years Kumar et al. (2003) and Sarkar andKumar (2009).
c Assumed.d
5614 A. Sultana et al. / Bioresource Technology 101 (2010) 5609–5621
and the bales are covered with tarp, and also the pellet plant con-tracts the straw transportation to trucking firms. Trucks are con-tracted year round and have self-loading equipment. The strawbales are stored at field’s edge and transported on public roads.The road allowances are large in North America (Mahmudi andFlynn, 2006). If roads are impassible due to weather conditionsthen storing is done in the plant. We assume at least 3 monthsstorage at the plant for the season when the roads are impassible.Although, ‘just in time’ delivery reduces feedstock storage require-ments, operational disruptions resulting from unreliable deliverymay cost the pellet company more than was saved in the capitalbudget (Campbell, 2007).
Transportation cost has two components irrespective of itsmode, i.e. truck, rail or pipeline. The fixed component of the costof truck transportation is the cost of loading and unloading cost($ tonne�1). The variable component of the cost of truck transpor-tation includes cost of wages for the driver, fuel, and maintenance($ tonne�1 km�1). These variable costs are proportional to the dis-tance travelled and changes with transportation distance. The typ-ical loading and unloading cost for truck transportation in NorthAmerica is $5.45 green tonne�1 (Kumar et al., 2003; Campbell,2007; Searcy et al., 2007). The straw truck variable transportationcost is $0.22 green tonne�1 km�1 (Campbell, 2007; Liu, 2008).
The size of the pellet plant determines the biomass draw area,thus the total cost of transportation increases as pellet plant capac-ity increases. Fig. 2 shows the correlation between transportationcost and capacity. The transportation distance is proportional tothe square root of the capacity of the plant; and this is reflectedby the curve in Fig. 2. Considering all the unit operation costs,straw delivery at the plant gate costs $95.33 tonne�1 for a planthaving capacity of 150,000 dry tonnes year�1.
Derived from earlier studies on pellet production.e Solid handling plants have a start-up profile. These values are assumed based
on operating factors reported in earlier studies on biomass handling facilities.Kumar et al. (2003) and Sarkar and Kumar (2009).
f Taken from earlier studies and values reported on the investment profile.Kumar et al. (2003) and Sarkar and Kumar (2009).
g Kumar et al. (2003) and Sarkar and Kumar (2009).h Campbell (2007).i Pastre (2002).
5.3. Pellet production cost
A techno-economic assessment model was developed to assessthe cost of production of pellets including various cost compo-nents. These cost components include:
� Capital cost.� Employee cost.� Energy cost.� Consumable cost.
Employee, energy and consumable costs are considered as oper-ating costs. The input data and assumptions for the techno-eco-nomic model are summarized in Table 4.
0
10
20
30
40
50
60
70
80
90
0 100000 200000 300000 400000 500000 600000 700000
Capacity (tonne year-1)
Tran
spor
tatio
n co
st ($
gre
en to
nne-1
)
Fig. 2. Delivered cost of straw as a function of pellet plant size.
5.3.1. Capital costCapital cost includes the cost of process equipment and utility
and its installation. It also includes capital cost of land, storage,buildings, and other infrastructure. The capital cost of differentequipment has been collected from equipment suppliers, pelletmanufacturer and the literature. The maintenance cost of theequipment in this study is 2.5% of the equipment capital cost ex-cept for the hammer mill and pellet mill (Thek and Obernberger,2004). These mills cost more to maintain than the other equip-ments. In this study, the annual maintenance cost of the hammermill and pellet mill are assumed to be 18% and 10% of the installedequipment capital cost, respectively (Thek and Obernberger, 2004).The mechanical and electrical installation of the equipment cost32% and 20% of the equipment’s capital cost, respectively. Freightand sales tax is 4% of the equipment’s capital cost (Campbell,2007). All equipment prices are adjusted to 2008 US dollar valueby using inflation factor.
5.3.2. Scale factorThe power function is an acceptable way of estimating capital
cost at various capacities within a typical range of up to 10 timesthe calculated costs. It can increase more or less proportionatelywith plant capacity depending on the parameters (Gallagheret al., 2005). This exponent for adjusting the cost of equipmentfrom one capacity to another is given in Eq. (1).
y = 39.08x0.846
R² = 0.249
0
50000
100000
150000
200000
250000
300000
350000
400000
450000
0 10000 20000 30000 40000 50000 60000
Thek et al.
Thek et al.
CampbellCampbell
y = 6827.6x0.3779
R2 = 0.5313
0
100000
200000
300000
400000
500000
600000
700000
800000
Cap
ital c
ost (
$)
Williams
Thek et. alThek et. al
Campbell
Samson et. alMani et. al
Campbell
Samson et. al
Campbell
Hoque et. al
Polagye et. al
NEOS NEOS
NEOSy = 9.0924x0.869
R2 = 0.6307
0
50000
100000
150000
200000
250000
300000
350000
400000
450000
Williams Campbell
Samson et.alGEC
Samson et.al
Campbell
NEOS
NEOS
y = 125.71x0.7207
R2 = 0.8437
0
100000
200000
300000
400000
500000
600000
700000C
apita
l cos
t ($)
Williams
Campbell
Thek et. al
Thek et. alGEC
Samson et. alCampbell
GEC
Mani et. al
Samson et. alCampbell
CampbellHoque et.al
Polayge et. al
NEOS NEOS
NEOSy = 3.0518x0.9909
R2 = 0.361
0
100000
200000
300000
400000
500000
600000
700000
0 20000 40000 60000 80000 100000 120000
0 20000 40000 60000 80000 100000 120000
0 20000 40000 60000 80000 100000 120000
0 20000 40000 60000 80000 100000 120000
0 20000 40000 60000 80000 100000 120000
0 20000 40000 60000 80000 100000 120000
0 20000 40000 60000 80000 100000 120000
Williams
llebpmaCllebpmaC
Samson et. al Samson et. alNEOS NEOSNEOS
y = 242.86x0.485
R2 = 0.5845
0
10000
20000
30000
40000
50000
60000
70000
80000
90000
100000
Cap
ital c
ost (
$)C
apita
l cos
t ($)
Williams
Thek et. al
Thek et. al
Campbell Mani et. al
GEC
GEC
Samson et. alCampbell
Samson et. al
Campbell
Campbell
Polagye et al
Hoque et al
NEOS
NEOS
y = 38.332x0.5671
R2 = 0.86
0
5000
10000
15000
20000
25000
30000
35000
40000
WilliamsSamson et. al
Samson et. al
Polagye et. al
(e)
(f)
(g)
(h)
(a)
(b)
(c)
(d)
Capacity (tonne year-1) Capacity (tonne year-1)
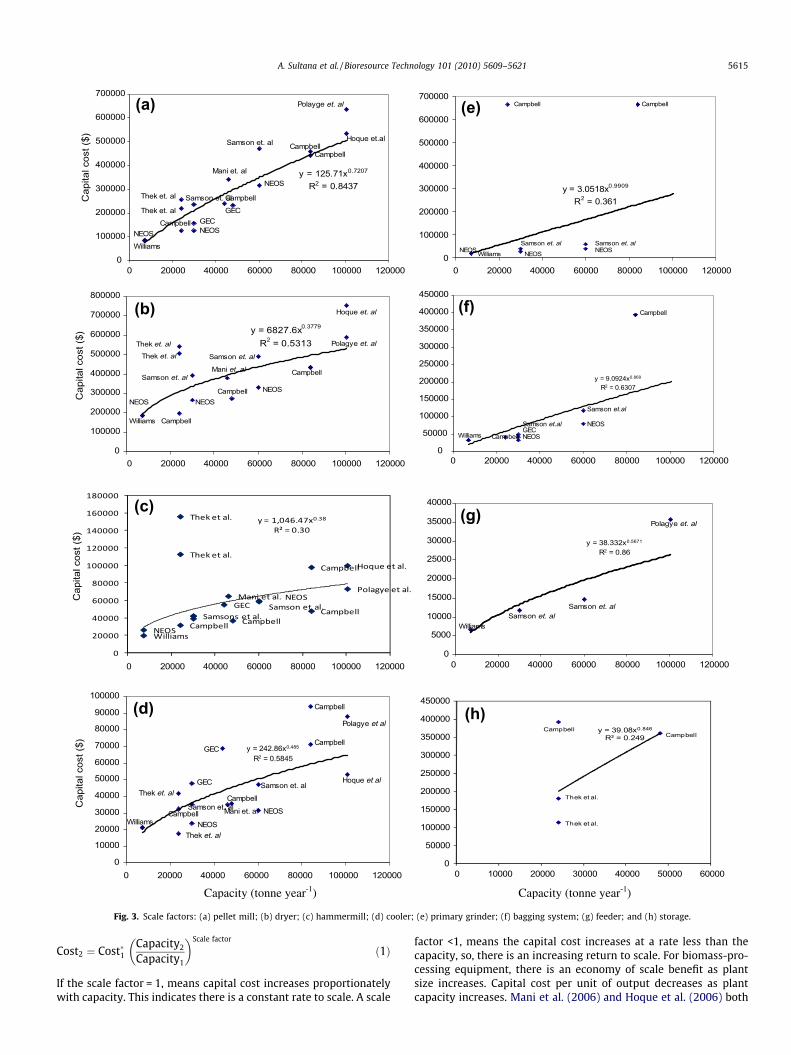
Fig. 3. Scale factors: (a) pellet mill; (b) dryer; (c) hammermill; (d) cooler; (e) primary grinder; (f) bagging system; (g) feeder; and (h) storage.
A. Sultana et al. / Bioresource Technology 101 (2010) 5609–5621 5615
Cost2 ¼ Cost�1Capacity2
Capacity1
� �Scale factor
ð1Þ
If the scale factor = 1, means capital cost increases proportionatelywith capacity. This indicates there is a constant rate to scale. A scale
factor <1, means the capital cost increases at a rate less than thecapacity, so, there is an increasing return to scale. For biomass-pro-cessing equipment, there is an economy of scale benefit as plantsize increases. Capital cost per unit of output decreases as plantcapacity increases. Mani et al. (2006) and Hoque et al. (2006) both

5616 A. Sultana et al. / Bioresource Technology 101 (2010) 5609–5621
considered a scale factor of 0.6 for estimating cost of wood pelletprocessing equipment. A scale factor of 0.6 means that one percentincrease in the plant size, increases capital cost by 0.6%. There is arange of scale factor for biomass-processing facilities. For dry millethanol plants it was reported to be 0.836 (Larson and Marrison,1997), which suggests that capital cost increases more rapidly withcapacity for these plants than for processing plants having a scalefactor of 0.6. Nguyen and Prince (1996) considered a scale factorof 0.7 for capital, administrative, and operating costs. Boerrigter(2006) reported different scale factors (0.5–0.7) for different scaleplants. Lower scale factors for small scale plants and higher scalefactors for larger plants. Other studies gave different scale factorsfor different biomass-processing equipment (Hamelinck and Faaij,2002; Spath et al., 2005). Remar et al. (1998) used three types ofindices (scale factor, location index and inflation index) in the samecalculation to adjust for size, geography and time (Remar et al.,1998; Remar and Mattos, 2003).
In this study the scale factors for the main equipment in a pelletproduction plant were derived from the values of capital cost re-ported in the literature for different equipment, such as pellet mill,dryer, hammer mill, cooler, pellet shaker, boiler, grinder, baggingsystem, and feeder; as well as storage bins and the building. Thescale factors for all these equipment and infrastructure were usedto estimate the overall scale factor for an agricultural pellet pro-duction plant. The scale factors are discussed below. Fig. 3(a)shows the capital cost of pellet mills at various capacities, as re-ported in the literature (NEOS, 1995; Williams and Lynch, 1995;Thek and Obernberger, 2004; GEC, 2006; Hoque et al., 2006; Maniet al., 2006; Campbell 2007; Polagye et al., 2007). Based on thesefigures, the derived scale factor for pellet mills is 0.84.
Fig. 3(b) shows the capital cost of dryers at different capacitiesreported in the literature (NEOS, 1995; Williams and Lynch, 1995;Thek and Obernberger, 2004; GEC, 2006; Hoque et al., 2006; Maniet al., 2006; Campbell 2007; Polagye et al., 2007). The scale factorfor dryer derived from Fig. 3(b) is 0.53. This estimate is lower thanthat found in different literature. Hamelinck and Faaij (2002) con-sidered it to be 0.8 and Spath et al. (2005) gave it a value of 0.75.
Table 5Capital cost of equipments and employee costs of pellet production plant (base case 6 ton
Plant equipment Scale factor Capital cost – base case($)
Maximu(tonne y
Capital costPrimary grinder 0.99 650,000 105,000Dryer 0.6 430,000 100,000
Hammer mill 0.6 150,000 108,000Feeder 0.57 44,700 50,000Boiler 0.7 51,000Pellet mill (with
conditioner)0.85 350,000 50,000
Pellet cooler 0.58 170,000 216,000Screener/shaker 0.6 18,300 100,800Bagging system 0.63 450,000 100,800Conveyor tanks etc. 0.75 1130,00 84,000
Hourly-wage employee Hourly rate Worker shift Annual h
Cost of hourly-wage employeeSupervisor 21.00 1 7200Maintenance worker 18.00 On-call 2080Machinery operator 16.00 2 7200Packaging 15.00 2 7200Forklift operator 15.00 1 7200
Salary labor Salary ($ year�1) Payroll t
Cost of permanent employeeGeneral manager 100,000 45%Financial manager 75,000 45%Supervisor 60,000 45%Secretary 40,000 45%
Fig. 3(c) shows the capital cost of hammer mills at differentcapacities (NEOS, 1995; Williams and Lynch, 1995; Thek andObernberger, 2004; GEC, 2006; Hoque et al., 2006; Mani et al.,2006; Campbell 2007; Polagye et al., 2007). Based on Fig. 3(c),the estimated scale factor for hammer mills is 0.38. The scale factorreported in other studies is 0.6 (Hamelinck and Faaij, 2002; Spathet al., 2005). The main reason for this large variation in values re-ported by different studies is that costs were estimated for differ-ent countries setting and at different times. The range of capitalcosts for coolers is shown in Fig. 3(d) (NEOS, 1995; Williams andLynch, 1995; Thek and Obernberger, 2004; GEC, 2006; Hoqueet al., 2006; Mani et al., 2006; Campbell 2007; Polagye et al.,2007). The scale factor derived from Fig. 3(d) is 0.49. The scale fac-tor derived for the primary grinders considered for this paper is99%. Fig. 3(e) shows the capital cost of grinders of different capac-ities (NEOS, 1995; Samson and Duxbury, 2000; Campbell, 2007).The scale factor derived for the bagging system is 0.87. This isbased on the capital cost data for bagging system given inFig. 3(f) (NEOS, 1995; Williams and Lynch, 1995; Samson and Dux-bury, 2000; Hoque et al., 2006). Based on the capital cost data inFig. 3(g) the scale factor for feeding systems is 0.57 (Williamsand Lynch, 1995; Samson and Duxbury, 2000; Polagye et al.,2007). This value is less than the value used in Hamelinck and Faaij(2002). The estimated scale factor for storage is 0.85. This is basedon capital cost values at various capacities as shown in Fig. 3(h)(Thek and Obernberger, 2004; Campbell, 2007). The scale factorfor conveyors considered in this study is 0.80, based on a previousstudy (Hamelinck and Faaij, 2002). Some of the scale factors de-rived in this study are not same as those considered in previousstudies because estimation of costs was done in different countriesand at different times.
In the base case, the pellet plant has a production capacity of6 tonnes h�1 with an annual production capacity of 44,000 tonnes.The plant operates for 7200 h annually, which is about 24 h day�1
and 300 days year�1 (capacity factor of 85%). The selection ofequipment size or capacity depends on the type of feedstock, par-ticle size and moisture level. It takes less energy to create 8 mm
ne h�1).
m size of equipmentear�1)
Source
Campbell (2007) and Polman (2008)Hamelinck and Faaij (2002) and Campbell(2007)Wright (2008) and Polman (2008)Campbell (2007) and Polman (2008)Campbell (2007) and Kumar et al. (2003)Wright (2008) and Polman (2008)
Wright (2008) and Polman (2008)Campbell (2007) and Polman (2008)Campbell (2007) and Polman (2008)Campbell (2007) and Polman (2008)
ours Source
Hoque et al. (2006)Hoque et al. (2006)Campbell (2007)Campbell (2007)Hoque et al. (2006)
ax benefit Source
Hoque et al. (2006)Hoque et al. (2006)Campbell (2007)Campbell (2007)
A. Sultana et al. / Bioresource Technology 101 (2010) 5609–5621 5617
pellets than it does to make 6 mm pellets. A 12 mm pellet requireseven less horsepower. The smaller the particle size, the larger thecapacity of the equipment and the horsepower required for pro-cessing (Wright, 2008). Softwood requires equipment with lowerhorsepower and capacity compared to hardwood (Wright, 2008).The capacity of coolers is based on the volume of air flow, ambienttemperature, and design particulars (Wright, 2008). Table 5 liststhe equipments, its capital cost and the maximum possible sizeavailable today.
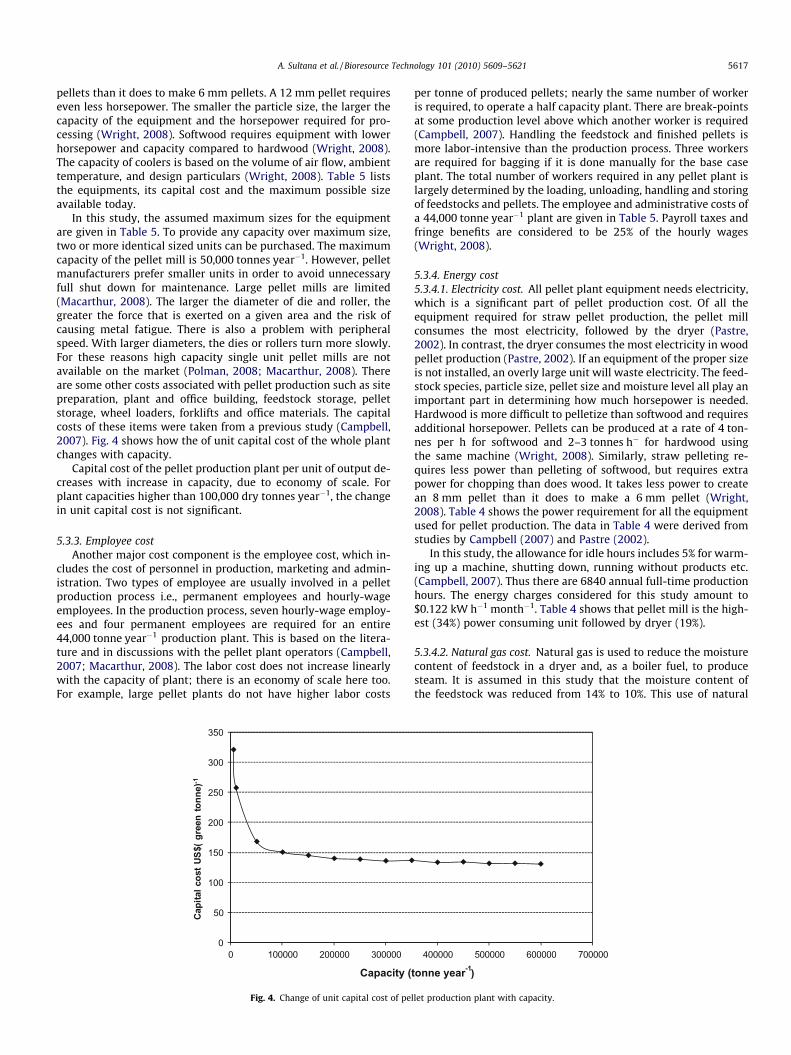
In this study, the assumed maximum sizes for the equipmentare given in Table 5. To provide any capacity over maximum size,two or more identical sized units can be purchased. The maximumcapacity of the pellet mill is 50,000 tonnes year�1. However, pelletmanufacturers prefer smaller units in order to avoid unnecessaryfull shut down for maintenance. Large pellet mills are limited(Macarthur, 2008). The larger the diameter of die and roller, thegreater the force that is exerted on a given area and the risk ofcausing metal fatigue. There is also a problem with peripheralspeed. With larger diameters, the dies or rollers turn more slowly.For these reasons high capacity single unit pellet mills are notavailable on the market (Polman, 2008; Macarthur, 2008). Thereare some other costs associated with pellet production such as sitepreparation, plant and office building, feedstock storage, pelletstorage, wheel loaders, forklifts and office materials. The capitalcosts of these items were taken from a previous study (Campbell,2007). Fig. 4 shows how the of unit capital cost of the whole plantchanges with capacity.
Capital cost of the pellet production plant per unit of output de-creases with increase in capacity, due to economy of scale. Forplant capacities higher than 100,000 dry tonnes year�1, the changein unit capital cost is not significant.
5.3.3. Employee costAnother major cost component is the employee cost, which in-
cludes the cost of personnel in production, marketing and admin-istration. Two types of employee are usually involved in a pelletproduction process i.e., permanent employees and hourly-wageemployees. In the production process, seven hourly-wage employ-ees and four permanent employees are required for an entire44,000 tonne year�1 production plant. This is based on the litera-ture and in discussions with the pellet plant operators (Campbell,2007; Macarthur, 2008). The labor cost does not increase linearlywith the capacity of plant; there is an economy of scale here too.For example, large pellet plants do not have higher labor costs
0
50
100
150
200
250
300
350
0 100000 200000 300000
Capi
tal c
ost U
S$( g
reen
tonn
e)-1
Capacity (
Fig. 4. Change of unit capital cost of pe
per tonne of produced pellets; nearly the same number of workeris required, to operate a half capacity plant. There are break-pointsat some production level above which another worker is required(Campbell, 2007). Handling the feedstock and finished pellets ismore labor-intensive than the production process. Three workersare required for bagging if it is done manually for the base caseplant. The total number of workers required in any pellet plant islargely determined by the loading, unloading, handling and storingof feedstocks and pellets. The employee and administrative costs ofa 44,000 tonne year�1 plant are given in Table 5. Payroll taxes andfringe benefits are considered to be 25% of the hourly wages(Wright, 2008).
5.3.4. Energy cost5.3.4.1. Electricity cost. All pellet plant equipment needs electricity,which is a significant part of pellet production cost. Of all theequipment required for straw pellet production, the pellet millconsumes the most electricity, followed by the dryer (Pastre,2002). In contrast, the dryer consumes the most electricity in woodpellet production (Pastre, 2002). If an equipment of the proper sizeis not installed, an overly large unit will waste electricity. The feed-stock species, particle size, pellet size and moisture level all play animportant part in determining how much horsepower is needed.Hardwood is more difficult to pelletize than softwood and requiresadditional horsepower. Pellets can be produced at a rate of 4 ton-nes per h for softwood and 2–3 tonnes h� for hardwood usingthe same machine (Wright, 2008). Similarly, straw pelleting re-quires less power than pelleting of softwood, but requires extrapower for chopping than does wood. It takes less power to createan 8 mm pellet than it does to make a 6 mm pellet (Wright,2008). Table 4 shows the power requirement for all the equipmentused for pellet production. The data in Table 4 were derived fromstudies by Campbell (2007) and Pastre (2002).
In this study, the allowance for idle hours includes 5% for warm-ing up a machine, shutting down, running without products etc.(Campbell, 2007). Thus there are 6840 annual full-time productionhours. The energy charges considered for this study amount to$0.122 kW h�1 month�1. Table 4 shows that pellet mill is the high-est (34%) power consuming unit followed by dryer (19%).
5.3.4.2. Natural gas cost. Natural gas is used to reduce the moisturecontent of feedstock in a dryer and, as a boiler fuel, to producesteam. It is assumed in this study that the moisture content ofthe feedstock was reduced from 14% to 10%. This use of natural
400000 500000 600000 700000
tonne year-1)
llet production plant with capacity.

5618 A. Sultana et al. / Bioresource Technology 101 (2010) 5609–5621
gas costs $1.00 tonne�1. The steam required to condition feedstockbefore it enters the pellet mill is 4% of the total weight of the feed-stock (Thek and Obernberger, 2004). The boiler efficiency consid-ered for steam production is 80% (Dias et al., 2004; Kristensenand Kristensen, 2004). Assuming a gas price of $5.94 GJ�1-basedon the 2008 price of natural gas (Energy shop, 2009; Direct Energy,2009), the gas for drying costs $1.27 tonne�1.
5.3.5. Consumables costIn pellet production dies and rollers are considered consumable
items. Their useful life depends on the physical characteristics ofthe feedstock. Straw is more abrasive than wood so dies wearout more easily (Pastre, 2002). Similarly, if pellets are made outof bark, dies need to be changed 3–4 times, due to abrasion(Wright, 2008). The cost of rollers, blades and screens is$2.75 tonne�1 (Campbell, 2007). Pellet bags are another consum-able item and costs $0.15 bag�1. Assuming the capacity of 50 bagsto be 1 tonne, the cost of bags is $7.50 tonne�1 (Campbell, 2007). A110 horsepower wheel loader uses 18.65 l of diesel per hour at fullload (Campbell, 2007). If the diesel costs $1.43 gal�1 (NRCan, 2009)the cost of fuel for the wheel loader is $1.27 tonne�1.
6. Results and discussion
The techno-economic model developed in this study estimatesthe cost of producing agricultural biomass-based pellets and theeconomically optimum plant capacity using the cost and technicalparameters provided in earlier sections. The costs and technicalparameters were considered for each unit operation from feed-
Table 6Economic optimum size of agriculture biomass-based pellet production plant.
Average yield
Straw yield (dry tonnes ha�1) 0.50Optimum size (tonnes year�1) 150,000Project area from which straw is drawn (km)2 1228,737Agri-pellet cost ($ tonne�1) 129.42– Capital recovery 7.61– Maintenance cost 2.41– Field cost 47.61– Transportation cost 47.72– Employee cost 8.23– Energy cost 5.92– Consumable item cost 9.86
30.00
80.00
130.00
180.00
230.00
280.00
0 50000 100000 150000 200000 2
Capacity
Pelle
t cos
t ($
tonn
e-1)
Average yieldMaximum yieldMinimum yield
Fig. 5. Pellet cost as a function of capa
stock harvesting to pellet storage. The model considered strawyield, field costs such as straw acquisition, nutrient replacementand farmer premium along with the cost of transportation andmaintenance, and operating costs such as labor, energy and con-sumable items.
The cost of producing pellets from biomass is highly dependenton the size of the plant. The optimum size for a pellet plant is atrade-off between the cost of transporting biomass, which in-creases as plant capacity increases and capital cost per unit of out-put that, due to economy of scale, decreases as plant capacityincreases. As a result of this trade-off, there is a particular capacityat which production cost is minimal; this is the optimum size forthe production plant. Table 6 shows the optimum sizes in the aver-age, maximum and minimum yield scenarios for agricultural bio-mass-based pellet production plant. It gives, as well, the areafrom which straw is drawn and the agri-pellet production cost.
The cost of biomass transportation increases in proportion tothe square root of capacity, whereas per unit capital cost decreaseswith capacity. Fig. 5 shows the variation in the production cost ofagri-pellets with the capacity of the plant. The pattern of the curveis similar for the average and maximum yield scenarios. For theminimum yield scenario, the pattern of the curve is different after70,000 tonnes year�1. Fig. 5 shows two regions. For the averageand maximum yield scenarios and plants with capacities less than70,000 dry tonnes year�1, the production cost rapidly increases asthe size of the agri-pellet production plant decreases. Above 70,000dry tonnes year�1, the cost of production is almost flat. The reasonis that the benefit in the plant’s capital cost per unit output due toeconomy of scale is offset by the increased cost of transporting the
Maximum yield Minimum yield
0.78 0.08150,000 70,000782,917 3492,837122.17 170.898.76 5.222.47 2.7147.61 47.6139.32 76.278.23 17.635.92 11.379.86 10.10
50000 300000 350000 400000 450000 500000
(tonne year-1)
Average yield - optimalMaximum yield - optimalMinimum yield - optimal
city for three cases of straw yield.

Moisture content Feed stock material loss
Inflation IRR
% area
95
105
115
125
135
145
155
-50% -40% -30% -20% -10% 0% 10% 20% 30% 40% 50%Tota
l cos
t of p
elle
t pr
oduc
tion(
US$
(tonn
e)-1
)
% change
capital cost employee cost
Energy cost Transportation cost
Field cost consumable cost
110
115
120
125
130
135
140
145
150
-50% -40% -30% -20% -10% 0% 10% 20% 30% 40% 50%
Tota
l cos
t of p
elle
t pr
oduc
tion(
US$
(tonn
e)-1
)
% change
Moisture content Feed stock material loss
Inflation IRR
% area
(a)
(b)
Fig. 6. Sensitivity analysis of (a) cost factors and (b) technical factors.
Table 7Impact of cost factors and technical factors on optimal size (in tonne year�1) for average yield (base case 150,000 tonne year�1).
% Change 50% Lower 40% Lower 30% Lower 20% Lower 10%Lower
10% Higher 20% Higher 30% Higher 40% Higher 50% Higher
Cost factorsField cost No change No change No change No change No
changeNo change No change No change No change No change
Transportationcost
Increase40,000
Increase40,000
Increase40,000
No change Nochange
Decrease20,000
Decrease20,000
Decrease60,000
Decrease60,000
Decrease60,000
Capital cost Decrease20,000
Decrease20,000
No change No change Nochange
No change No change No change No change No change
Employee cost Decrease60,000
Decrease60,000
Decrease20,000
Decrease20,000
Nochange
No change No change No change No change No change
Energy cost Decrease20,000
Decrease20,000
Decrease20,000
Decrease20,000
Nochange
No change No change No change No change No change
Consumableitem cost
No change No change No change No change Nochange
No change No change No change No change No change
Technical factorsMoisture content No change No change No change No change No
changeNo change No change Decrease
20,000Decrease20,000
Decrease20,000
Material loss No change No change No change No change Nochange
No change No change No change No change No change
Inflation Decrease20,000
Decrease20,000
No change No change Nochange
No change No change No change No change No change
IRR No change No change No change No change Nochange
No change No change No change No change No change
% Area forbiomass
Decrease60,000
Decrease20,000
Decrease20,000
Decrease20,000
Nochange
No change No change No change No change No change
A. Sultana et al. / Bioresource Technology 101 (2010) 5609–5621 5619
agricultural biomass. Thus, in this region agricultural biomass-based pellet plants can be built over a wide range of capacities
without significant cost penalties. For example, the economicallyoptimum size of plant for the average yield case is 150,000

5620 A. Sultana et al. / Bioresource Technology 101 (2010) 5609–5621
tonnes year�1, but agri-pellet production cost remains within 10%of the optimum value from 70,000 tonnes year�1 to more than500,000 tonnes year�1. While the calculated optimum size is150,000 tonnes year�1, it is more likely that the plant would bebuilt to handle 70,000 tonnes year�1 in order to minimize risk.For the minimum yield scenario, above 70,000 tonnes year�1, anyincrease in capacity will increase the cost of production consider-ably. In this case, an increase in transportation cost outweightsthe reduction of capital cost per unit of output. Above 70,000 ton-nes year�1, reduction in capital cost is 5% for the minimum yieldcase, but the biomass must be collected from a very widespreadarea. The minimum yield scenario is based on yields obtained inthe drought years which were observed 2 years out of the 12 yearsof data collection. The agri-pellet plant can be built at a capacity of70,000 tonnes year�1 which will result in pellet production cost of$130–$132 tonne�1. It is evident that agri-pellets (at $7.2 GJ�1) arestill not economical as a fuel today compared to fossil fuel (i.e. nat-ural gas at $6.5 GJ�1).
Table 6 shows the different cost components of producingstraw-based pellets. From Table 6 it can be seen that transporta-tion contributes the most to total cost, followed by field cost.Transportation alone contributes almost 40% of the total cost.The main reason for the cost of transportation being high is thatthe biomass feedstock is very dispersed due to low yield. Strawharvesting requires nutrient replacement, which is a significantfield cost in all cases.
Plant capacity and the agri-pellet production cost associatedwith it depend on crop yield and the distance between wherethe biomass is collected and the plant is built. In Alberta, one ofthe western Canadian provinces, the net yield of straw is0.50 tonne ha�1 whereas, in other prairie provinces, such as inManitoba, the net yield is 0.65 tonne ha�1. Economic optimum sizeare larger when yields are higher.
7. Sensitivity analysis
The sensitivity of the cost factors and technical factors werestudied for the average yield case. This sensitivity analysis was car-ried out by changing the values for different costs and technicalfactors from �50% to +50% in steps of 10% for each case. Cost fac-tors such as field, transportation, capital, employee, energy, andconsumable costs were included in the analysis. Technical factors,including moisture content, feedstock material loss, inflation,internal rate of return (IRR), and percentage of area used for wheat,barley and oat production were considered. Fig. 6 shows the resultsof the sensitivity analysis done on cost factors, and technicalfactors.
It can be seen from Fig. 6(a) that the cost of agri-pellet produc-tion is most sensitive to field cost, followed by transportation cost.A variation of about ±50% of field cost can change the pellet pricefrom $153.33 to $105.52 tonne�1. The agri-pellet production costchanges from $150.05 to $108.79 tonne�1 given a change of ±50%in transportation cost. Table 7 shows that variation in field costdoes not affect optimum plant size, however, variation in transpor-tation cost changes the optimum size from 190,000 to 90,000 ton-nes year�1. As transportation cost increases, the optimal size of theagricultural pellet production plant decreases. The opposite resultis observed when the cost increases. With a change from +50% to�50% in capital cost, the cost of production changes by$13.36 tonne�1. Other costs, such as employee cost, energy costand consumable cost, do not change the total cost of productionsignificantly.
It can be concluded from Fig. 6(b) that changes in moisture con-tent and IRR have nearly the same impact on the total productioncost. An increase in the moisture content, IRR, inflation and loss of
feedstock material in the plant contribute to increase in the pelletproduction cost. Higher inflation and increase of the productionarea for wheat, barley and oats reduces the cost of pellets. Pelletproduction cost is most sensitive to changes in moisture content.With a �50% to +50% change in moisture content, the cost in-creases by $21.92 tonne�1. An increase of moisture content ad-versely affects the heating value of fuel. The percentage of areaused for wheat, barley and oat production changes the total costsignificantly. A slightly nonlinear pattern is observed for the im-pact of the amount of area used for wheat, barley and oat produc-tion. This is due to the fact that the cost of producing pelletsdepends on the radius of the circle from which agricultural residueis collected. The variation in optimum size (Table 7) has to do morewith percentage of change in this area than with the moisture con-tent. The impact that values for cost and technical factors have onoptimal plant size are shown in Table. 7.
8. Conclusions
A techno-economic model was developed for estimating thecost of producing pellets and the optimum size of pellet plantsbased on agricultural biomass. Agricultural residue, includingwheat, barley and oat straw, were considered at average, maxi-mum and minimum yield cases. The total cost was calculated fromthe harvest of straw to pellet production. The techno-economicmodel was applied to Western Canada. For average and maximumyield cases, cost curves are quite flat for a wide range of plant sizesover 70,000 tonnes year�1. This implies that plants smaller thanthe economically optimum size can be built with only minor costpenalty. From the sensitivity analysis it can be concluded that totalcost of production of pellet is most sensitive to field cost followedby transportation cost.
Acknowledgements
The authors gratefully acknowledge the Alberta Innovates –Technology Futures, Vegreville, Alberta, Agriculture and FoodCouncil of Alberta and Alberta Agriculture and Rural Development,whose financial support has made this research possible.
References
AARD (Alberta Agriculture and Rural Development), 2009. Beneficial ManagementPractices: Environmental Manual for Crop Producers in Alberta – NutrientManagement. URL: <http://www/agric.gov.ab.ca/$department/deptdocs.nsf/all/agdex9349> (accessed 09.01.09).
Bailey-Stamler, S., Samson, R., Lem, C., 2007. Assessing the agri-fibre biomassresidue resources for creating bioheat in Alberta. Alberta Agriculture and Food,Lethbridge, AB.
Boerrigter, H., 2006. Economy of Biomass-to-Liquids (BTL) Plants. Report No. ECN-C-o6-019. Energy Research Centre of the Netherlands (ECN), The Netherlands.
Brechbill, S.C., Tyner, W.E., 2008. The economics of biomass collection,transportation and supply to Indiana cellulosic and electric utility facility.Working Paper #08-03. Department of Agricultural Economics, PurdueUniversity.
Campbell, K.A., 2007. Feasibility Study Guide for an Agricultural Biomass PelletCompany. Agricultural Utilization Research Institute, USA.
Campbell, CA., Coxworth, E., 1999. Feasibility of Sequestering Carbon through Use ofCrop Residue for Industrial Products. Agriculture and Agri-food Canada, Ottawa.
Chico_Santamarta, L., Humphries, A., White, D., Chaney, K., 2009. Effect of Pre- andPost-pelletisation Storage of Canola (Oil Seed Rape) Straw on the Quality andProperties of Pellets. Paper No. 096105. 2009 ASABE Annual InternationalMeeting, July 21–24, Reno, Nevada.
Craig, S., 2008. Big bale storage losses: how different option stack up. WisconsinTeam Forage. URL: <http://www.uwex.edu/ces/crops/uwforage/bigbalestorage-FOF.pdf> (accessed 09.09.09).
Dias, J., Costa, M., Azevecto, J.L.T., 2004. Test of a small domestic boiler usingdifferent pellets. Biomass and Bioenergy 27, 531–539.
Direct Energy, 2009. Natural Gas price. URL: <http://residential/directenergy.com>(accessed 12.12.09).
Dornburg, V., Faaij, A.P.C., 2001. Efficiency and economy of wood-fired biomassenergy systems in relation to scale regarding heat and power generation usingcombustion and gasification technology. Biomass and Bioenergy 21 (2), 91–108.

A. Sultana et al. / Bioresource Technology 101 (2010) 5609–5621 5621
Energy shop, 2009. Deregulated Natural Gas Prices. URL: <http://www.energyshop.com/es/prices/AB/gasAB.cfm?1dc.id=389> (accessed 12.12.09).
Fasina, O.O., Bransby, D., Sibley, J., Gillam, C., 2006. Heating of Green House withBiofuel Pellet. Paper No. 064183. ASAE Meeting Presentation, 9–12 July,Portland, Oregon.
Gallagher, P.W., Brubaker, H., Shapouri, H., 2005. Plant size: capital costrelationships in the dry mill ethanol industry. Biomass and Bioenergy 28,565–571.
GEC (Grass Energy Collaborative), 2006. A Scenario for Grass Energy. CombinedHeat and Power. Peacham, VT, USA.
Hamelinck, C.N., Faaij, A.P.C., 2002. Future prospect for production of methanol andhydrogen from biomass. Journal of Power Sources 111, 1–22.
Hamelinck, C.N., Roald, A., Suurs, A., Faaij, P.C., 2005. International bioenergytransport cost and energy balance. Biomass and Bioenergy 29, 114–134.
Hoque, M., Sokhansanj, S., Bi, T., Mani, S., Jafari, L., Lim, J., Zaini, P., Melin, S., Sowlati,T., Afzal, M., 2006. Economics of pellet production for export market (paper no.06-103). In: Proceedings of the Canadian Society for Bioengineering, 16–19 July.Edmonton, Alberta.
Jannasch, R., Quan, Y., Samson, R., 2001. A process and energy analysis of pelletizingswitchgrass. Natural Resource Canada, Alternative Energy Division. URL:<http://www.reap-canada.com/online_library/feedstock_biomass/11%20A%20Process.pdf>.
Jenkin, B.M., 1997. A comment on the optimal sizing of a biomass utilization facilityunder constant and variable cost scaling. Biomass and Bioenergy 13 (1/2), 1–9.
Jensen, T., 2008. Food production and economics of fertilizer; use tracking thereturns in a grain crop. Better Crops 92 (3), 26–27.
Karwandy, J., 2007. Pellet production from sawmill residue: a Saskatchewanperspective. Forintek Canada Corp Report No. 2006-29.
Klass, D.L., 1998. Biomass for Renewable Energy, Fuels and Chemicals. AcademicPress, San Diego, California.
Kline, R., 2000. Estimating Crop Residue Cover for Soil Erosion Control. Soil Fact Sheet641-220-1. <http://www.agf.gov.bc.ca/resmgmt/publist/600series/641220-1.pdf>.
Kristensen, E.F., Kristensen, J.K., 2004. Development and test of small-scale batchfired straw boiler in Denmark. Biomass and Bioenergy 26, 561–569.
Kumar, A., Cameron, J.B., Flynn, P.C., 2003. Biomass power cost and optimum plantsize in Western Canada. Biomass and Bioenergy 24 (6), 445–464.
Larson, E.D., Marrison, C.I., 1997. Economics scales for first-generation biomass-gasifier/gas turbine combined cycles fueled from energy plantations. Journal ofEngineering for Gas Turbine and Power 119, 285–290.
Levelton Engineering Ltd., (S&T)2 Consulting Inc. J.E. and Associates., 2000.Assessment of Net Emissions of Greenhouse Gases from Ethanol-blendedGasoline in Canada: Lignocellulosic Feedstocks. Report No. R-2000-2.Agriculture and Agri-food Canada.
Lindstorm, M., Skidmore, E., Gupta, S., Onstad, C., 1979. Soil conservation limitationson removal of crop residue for energy production. Journal of EnvironmentalQuality 8 (4), 533–537.
Liu. E., 2008. Straw Procurement Business Case. Manitoba Bioproducts WorkingGroup.
Macarthur, R., 2008. Personal Communication, Amandus Kahl.Mahmudi, H., Flynn, P.C., 2006. Rail and truck transport of biomass. Applied
Biochemistry and Biotechnology 129–132, 88–102.Mani, S., Sokhansanj, S., Bi, X., Turhollow, A., 2006a. Economics of producing fuel
pellets from biomass. Applied Engineering in Agriculture 22 (3), 421–426.Mani, S., Tabil, L.G., Sokhansanj, S., 2006b. Effects of compressive force, particle size
and moisture content on mechanical properties of biomass pellets from grasses.Biomass and Bioenergy 30, 648–654.
McIIveen-Wright, D.R., Williams, B.C., McMullan, J.T., 2001. A re-appraisal of wood-fired combustion. Bioresource Technology 21 (2), 91–108.
NEOS Corporation, 1995. Wood pelletization sourcebook: a simple business plan forthe potential pellet manufacturer. Great Lakes Regional Biomass EnergyProgram Report No. DE-FG05-83R21390(44).
Nguyen, M.H., Prince, R.G.H., 1996. A simple rule for bioenergy conversion plant sizeoptimization: bioethanol from sugarcane and sweet sorghum. Biomass andBioenergy 10 (5/6), 361–365.
NRCan (Natural Resource Canada), 2009. Energy Source: Fuel Focus: NationalOverview. URL: <http://www.nrcan-rncan.gc.ca/eneene/sources/pripri/reprap/2009-10-23/index-eng.php#oveape> (accessed 12.12.09).
Obernberger, I., Thek, G., 2004. Physical characteristic and chemical composition ofdensified biomass fuels with regard to their combustion behavior. Biomass andBioenergy 27, 653–669.
Overend, R.P., 1982. The average haul distance and transportation work factors forbiomass delivered to a central plant. Biomass 2, 75–79.
PAMI (Praire Agricultural Machinery Institute), 2001. Reliable Data on SustainableWheat Straw Availability-Straw Production. Report No. 500E. Humboldt, SK.
Pastre, O., 2002. Analysis of the Technical Obstacles Related to the Production andUtilization of Fuel Pellets Made from Agricultural Residue; European BiomassIndustry Association (EUBIA). Report No. ALTENER 2002-012-137-160.
Pauly, D., 2008. Fertilizer prices affect the value of hay and straw. Agri-News, July,3–4.
Perlack, R.D., Turhollow, A.F., 2002. Assessment of Option for the Collection,Handling and Transport of Corn Stover. Oak Ridge National Laboratory, OakRidge, TN.
Perlack, R.D., Wright, L.L., Turhollow, A.F., Graham, R.L., Stokes, B.J., Erbach, D.C.,2005. Biomass as Feedstock for a Bioenergy and Bioproduct Industry: TheTechnical Feasibility of a Billion-ton Annual Supply. US Department ofAgriculture Report No. DOE/GO-102005-2135.
PFRA, (Praire Farm Rehabilitation Administration), 2003. Tillage Practices thatReduce Soil Erosion. URL: <http://www.agr.gc.ca/pfra/soil/tillage-e.htm>.
Polagye, B.L., Hodgson, K.T., Malte, P.C., 2007. An economic analysis of bio-energyoptions using thinning from overstocked forest. Biomass and Bioenergy 31 (2–3), 105–125.
Polman, A., 2008. Personal Communication, Buhler Group.Remar, D.S., Mattos, F.B., 2003. Cost and scale-up factors, international inflation
indexes and location factors. International Journal of Production Economics 84(1), 1–26.
Remar, D.S., Huynh, L., Agarwal, K., Auchard, B.J., Heaps-Nelson, T., 1998. Acompilation of inflation and location indexes. International Journal ofProduction Economics 54 (1), 41–55.
Samson, R., Duxbury, P., 2000. Assessment of Pelletized Biofuel. Resource-EfficientAgricultural Production (REAP) – Canada Report No. ARFO7.
Sarkar, S., Kumar, A., 2009. Techno-economic assessment of biohydrogenproduction from forest biomass in Western Canada. Transaction of the ASABE52 (2), 1–2.
Searcy, E., Flynn, P., Ghafoori, E., Kumar, A., 2007. The relative cost of biomassenergy transport. Applied Biochemistry and Biotechnology (1–12), 137–140.
Sheehan, J., Aden, A., Paustian, K., Killian, K., Brenner, J., Walsh, M., Nelson, R., 2003.Energy and environmental aspects of using corn stover for fuel ethanol. Journalof Industrial Ecology 7 (3/4), 117–146.
Sokhansanj, S., Fenton, J., 2006. Cost Benefit of Biomass Supply and Pre-processing.BIOCAP Canada Foundation, Kingston, Ontario, Canada.
Sokhansanj, S., Mani, S., Stumborg, M., Samson, R., Fenton, J., 2006. Production anddistribution of cereal straw on the Canadian prairies. Canadian BiosystemEngineering 48, 339–346.
Spath, P., Aden, A., Eggeman, T., Ringer, M., Wallace, B., Jechura, J., 2005. Biomass toHydrogen Production Detailed Design and Economics Utilizing the BattelleColumbus Laboratory Indirectly-heated Gasifier. Report No. NREL/TP-510-37408. National Renewable Energy Laboratory, USA.
Statistics Canada and Alberta Agriculture and Food. Alberta Agricultural andStatistical Yearbook, 2006. URL: <http://www1.agric.gov.ab.ca/$department/deptdocs.nsf/all/sdd11870#tables> (accessed 12.03.08).
Stumborg, M.M., Townley, S., Coxworth, E., 1996. Sustainability and economics issuesfor cereal crop residue export. Canadian Journal of Plant Science 76, 669–673.
Thek, G., Obernberger, I., 2004. Wood pellet production costs under Austrian and incomparison to Swedish framework condition. Biomass and Bioenergy 27, 671–693.
Urbanowski, E., 2005. Strategic Analysis of a Pellet Fuel Opportunity in NorthwestBritish Columbia. MBA Thesis, Simon Fraser University, BC, Canada.
USDA (United States Department of Agriculture), 2009. North America’s WoodPellet Sector. Research paper FPL-RP-656, Madison, WI, USA.
Verhegyi, G., Chen, H., Godoy, S., 2009. Thermal decomposition of wheat, oat andbarley and Brassica carnita straw: a kinetic study. Energy and Fuel 23, 646–652.
Walla, C., Schneeberger, W., 2008. The optimal size of biogas plant. Biomass andBioenergy 32, 551–557.
Williams, N.K., Lynch, D.L., 1995. Wood Pellet Manufacturing Production Equipmentand Cost Study for Walden, Colorado. Department of Forest Science, ColoradoState University, USA.
Wolf, A., Vidlund, A., Anderson, E., 2006. Energy-efficient pellet production in theforest industry-a study of obstacles and success factors. Biomass and Bioenergy30, 38–45.
Wright, M., 2008. Personal Communication. Enligna Canada Inc., Nova Scotia,Canada.