development of a water sustainability index for west …vuir.vu.edu.au/19426/1/iwan_juwana.pdf ·...
TRANSCRIPT

Development of a Water Sustainability Index for West Java, Indonesia
Iwan Juwana
Thesis submitted in fulfilment of the requirements for the degree of Doctor of Philosophy
School of Engineering and Science Faculty of Health, Engineering and Science
Victoria University, Australia
March 2012

i
Abstract
Sustainability of water resources is essential to ensure that available water can be used by both
present and future generations. To ensure sustainability, a comprehensive knowledge of the current
conditions of water resources is necessary. Once this information is obtained, relevant programs can
be designed to improve the quality and use of water resources. A water sustainability index is a
useful tool to obtain information on the current conditions of water resources. It can also be used to
identify all factors contributing to these conditions, to assist decision makers prioritising water
issues, to design programs related to water resource improvement, and to communicate the current
status of existing water resources to the general community.
In the recent past, several indices related to water resource sustainability have been developed.
Even though there have been some successful experiences with the implementation of existing
sustainability indices, they are not fully applicable in other regions or countries, since most of these
indices have been developed for specific regions or countries. This study aims at developing a new
water sustainability index for West Java, Indonesia, which can be used as a tool to improve the
management of water resources in West Java. The development of the West Java Water
Sustainability Index (WJWSI) involved the design of the conceptual framework, the application of
Delphi technique to refine and finalise the conceptual framework, the application of WJWSI in three
West Java catchments, and finally the robustness analysis of WJWSI through uncertainty and
sensitivity analysis.
Results of WJWSI applications provided information on the current conditions of water resources, as
well as the priority of water issues, in these three catchments. This information can be used by
relevant water authorities in respective catchments to design appropriate programs to improve the
conditions of water resources. This index can be applied to all catchments in West Java and, with
some modifications, can also be applied in catchments in other provinces in Indonesia and
worldwide.

ii
Declaration
I, Iwan Juwana, declare that the PhD thesis entitled ‘Development of a Water Sustainability Index for
West Java, Indonesia’ is no more than 100,000 words in length including quotes and exclusive of
tables, figures, appendices, references and footnotes.
This thesis contains no material that has been submitted previously, in whole or in part, for the
award of any other academic degree or diploma. Except where otherwise indicated, this thesis is my
own work.
Iwan Juwana
March 2012

iii
Acknowledgments
First of all, praise be to Allah, Lord of the Worlds.
This thesis is the result of a long PhD study journey that would have not been completed without the
support from numerous outstanding people. I would like to express my deep appreciation to those
people for their support during the period of this study and thesis writing.
Professor Chris Perera has been the strongest academic support for the completion of this study.
Since the very early discussion on the topic of this study until the last day of the thesis completion,
he provided guidance, wisely and patiently, that allowed me to develop my scholarly skills. During
the discussions, he always maintained the balance of providing his valuable comments and
encouraging me to express my own thoughts and ideas. His comments on my papers during the
study have reflected not only his suggestions on the papers, but also his commitment, interest and
dedication to the academic world.
I would like to thank Dr. Nitin Muttil, my associate supervisor, for the efforts and time spent for
providing suggestions and comments on both the journal papers and the thesis report.
I would also like to express my gratitude to AusAid for the Australian Development Scholarship (ADS)
Program. The support provided by ADS prior to my departure to Australia and during my stay in
Australia has taken me to the completion this study.
I would like to thank Dr Diane Brown for copy editing my thesis according to the Australian
Standards for Editing Practice (Standards D and E).
Finally, to my wife, Astri, and my 17‐month‐old son, Ayeman. I am deeply grateful for their endless
support, encouragement and for always being there, comforting my ups and downs with their
sincere love and patience. This journey would have not been as adventurous and memorable
without both of them. To my family in Indonesia, I would like to thank them for all their du’a
(prayers). To all my friends in Melbourne who have made me feel very welcome, this could not have
been done without their support and friendship. Thank you.

iv
Table of Contents Abstract ..................................................................................................................................................... i Declaration ............................................................................................................................................... ii Acknowledgments ................................................................................................................................... iii Table of Contents .................................................................................................................................... iv List of Tables .......................................................................................................................................... vii List of Figures ........................................................................................................................................ viii Abbreviations .......................................................................................................................................... ix Published Manuscripts ............................................................................................................................. x CHAPTER 1: INTRODUCTION 1.1 BACKGROUND .......................................................................................................................................... 1‐1 1.2 AIMS OF THE RESEARCH ............................................................................................................................ 1‐3 1.3 SIGNIFICANCE OF THE RESEARCH .............................................................................................................. 1‐3 1.4 RESEARCH METHODOLOGY ....................................................................................................................... 1‐4 1.5 THESIS STRUCTURE ....................................................................................................................................... 1‐7 CHAPTER 2: INDICATOR‐BASED SUSTAINABILITY ASSESSMENT 2.1 INTRODUCTION ........................................................................................................................................ 2‐1 2.2 SUSTAINABLE DEVELOPMENT DEFINITIONS AND SUSTAINABILITY PRINCIPLES.......................................... 2‐3 2.3 SUSTAINABLE WATER RESOURCE MANAGEMENT: DEFINITIONS, CRITERIA AND GUIDELINES .................... 2‐6 2.4 ELEMENTS OF INDICATOR‐BASED SUSTAINABILITY ASSESSMENT .............................................................. 2‐9 2.4.1 Selection of components and indicators ...................................................................................... 2‐10 2.4.2 Obtaining sub‐index values .......................................................................................................... 2‐12 2.4.3 Weights ....................................................................................................................................... 2‐18 2.4.4 Aggregation ................................................................................................................................. 2‐19 2.4.5 Robustness analysis ..................................................................................................................... 2‐23 2.5 EXISTING WATER SUSTAINABILITY INDICES ............................................................................................. 2‐23 2.5.1 Water Poverty Index (WPI) .......................................................................................................... 2‐24
2.5.1.1 Selection of component and indicators .......................................................................... 2‐24 2.5.1.2 Obtaining sub‐index values ............................................................................................ 2‐25 2.5.1.3 Weighting ...................................................................................................................... 2‐25 2.5.1.4 Aggregation.................................................................................................................... 2‐26 2.5.1.5 Final index value interpretation ..................................................................................... 2‐26
2.5.2 Canadian Water Sustainability Index (CWSI) ................................................................................ 2‐27 2.5.2.1 Selection of components and indicators ........................................................................ 2‐27 2.5.2.2 Obtaining sub‐index values ............................................................................................ 2‐28 2.5.2.3 Weighting ...................................................................................................................... 2‐29 2.5.2.4 Aggregation.................................................................................................................... 2‐29 2.5.2.5 Final index value interpretation ..................................................................................... 2‐29
2.5.3 Watershed Sustainability Index (WSI) .......................................................................................... 2‐30 2.5.3.1 Selection of components and indicators ........................................................................ 2‐30 2.5.3.2 Obtaining sub‐index values ............................................................................................ 2‐32 2.5.3.3 Weighting ...................................................................................................................... 2‐32 2.5.3.4 Aggregation.................................................................................................................... 2‐32 2.5.3.5 Final index value interpretation ..................................................................................... 2‐33
2.5.4 Comparative analysis of water sustainability indices ................................................................... 2‐33 2.6 OTHER INDICES ....................................................................................................................................... 2‐35 2.6.1 Human Development Index ......................................................................................................... 2‐35
2.6.1.1 Selection of dimensions and indicators .......................................................................... 2‐35
v
2.6.1.2 Obtaining sub‐index values ............................................................................................ 2‐36 2.6.1.3 Weighting of dimensions and indicators ........................................................................ 2‐36 2.6.1.4 Aggregation of dimensions and indicators ..................................................................... 2‐37 2.6.1.5 Final index value interpretation ..................................................................................... 2‐37
2.6.2 Environmental Sustainability Index .............................................................................................. 2‐38 2.6.2.1 Selection of indicators and variables .............................................................................. 2‐38 2.6.2.2 Obtaining sub‐index values ............................................................................................ 2‐40 2.6.2.3 Weighting of variables and indicators ............................................................................ 2‐40 2.6.2.4 Aggregation of indicators and variables ......................................................................... 2‐41 2.6.2.5 Robustness analysis ....................................................................................................... 2‐41 2.6.2.6 Final index value interpretation ..................................................................................... 2‐42
2.7 SUMMARY .............................................................................................................................................. 2‐43 CHAPTER 3: DEVELOPMENT OF WEST JAVA WATER SUSTAINABILITY INDEX 3.1 INTRODUCTION ........................................................................................................................................ 3‐1 3.2 CONCEPTUAL FRAMEWORK ...................................................................................................................... 3‐3 3.2.1 Identification of Components, Indicators and Thresholds .............................................................. 3‐3 3.2.2 Justification for the Selection of Components, Indicators and Thresholds ..................................... 3‐8
3.2.2.1 Justification for the Component Water Resources and its Indicators and Thresholds ....... 3‐8 3.2.2.2 Justification for the Component Water Provision and its Indicators and Thresholds ...... 3‐11 3.2.2.3 Justification for the Component Capacity and its Indicators and Thresholds .................. 3‐13 3.2.2.4 Justification for the Component Human Health and its Indicators and Thresholds ......... 3‐14
3.3 FINAL FRAMEWORK ................................................................................................................................ 3‐16 3.3.1 The Delphi Technique .................................................................................................................. 3‐16 3.3.2 Identification of Water‐related Stakeholders ............................................................................... 3‐19 3.3.3 Design of the Questionnaires ....................................................................................................... 3‐20 3.3.4 Method to Analyse the Responses of the Respondents ............................................................... 3‐21 3.3.5 Distribution and Collection of Completed Questionnaires ........................................................... 3‐22
3.3.5.1 Round One of the Delphi Application ............................................................................. 3‐22 3.3.5.2 Round Two of the Delphi Application ............................................................................. 3‐29
3.3.6 In‐Depth Interview with Key stakeholders ................................................................................... 3‐33 3.4 WEIGHTING ............................................................................................................................................ 3‐36 3.4.1 Equal Weighting ........................................................................................................................... 3‐37 3.4.2 Non‐equal Weighting ................................................................................................................... 3‐37
3.4.2.1 The procedure ................................................................................................................ 3‐38 3.4.2.2 Results and Calculations ................................................................................................. 3‐38
3.4.3 Weights Given by Different Respondent Groups .......................................................................... 3‐41 3.5 INDEX INTERPRETATION ......................................................................................................................... 3‐44 3.6 SUMMARY .............................................................................................................................................. 3‐45 CHAPTER 4: APPLICATION OF WEST JAVA WATER SUSTAINABILITY INDEX 4.1 INTRODUCTION ........................................................................................................................................ 4‐1 4.2 METHODOLOGY USED FOR APPLICATIONS ................................................................................................ 4‐2 4.2.1 Obtaining Sub‐index Values ........................................................................................................... 4‐2 4.2.2 Final Index ..................................................................................................................................... 4‐5 4.2.3 Robustness Analysis ....................................................................................................................... 4‐6 4.3 WEST JAVA .............................................................................................................................................. 4‐12 4.3.1 Climatic Conditions ...................................................................................................................... 4‐13 4.3.2 Socio‐Economic Conditions .......................................................................................................... 4‐13 4.3.3 Water Management .................................................................................................................... 4‐14
4.3.3.1 Water Authorities ........................................................................................................... 4‐15 4.3.3.2 Policies and Regulations ................................................................................................. 4‐16 4.3.3.3 Current Water Management Programs .......................................................................... 4‐17
4.4 CITARUM CATCHMENT ........................................................................................................................... 4‐19 4.4.1 Description of the Catchment ...................................................................................................... 4‐19 4.4.2 Application of WJWSI for 2008 .................................................................................................... 4‐21

vi
4.4.2.1 Sub‐index Values and Final index .................................................................................... 4‐22 4.4.2.2 Robustness Analysis of WJWSI ........................................................................................ 4‐27
4.4.3 Application for Different Years ..................................................................................................... 4‐33 4.4.4 Recommendations for Water Authorities .................................................................................... 4‐37 4.5 CILIWUNG CATCHMENT .......................................................................................................................... 4‐40 4.5.1 Description of the Catchment ...................................................................................................... 4‐40 4.5.2 Application of WJWSI for 2006, 2007 and 2008 ........................................................................... 4‐42
4.5.2.1 Sub‐index Values and Final index .................................................................................... 4‐42 4.5.2.2 Robustness Analysis of WJWSI ........................................................................................ 4‐48 4.5.2.3 Recommendations for Water Authorities ....................................................................... 4‐52
4.6 CITANDUY CATCHMENT .......................................................................................................................... 4‐55 4.6.1 Description of the Catchment ...................................................................................................... 4‐55 4.6.2 Application of WJWSI for 2006, 2007 and 2008 ........................................................................... 4‐57
4.6.2.1 Sub‐index Values and Final index .................................................................................... 4‐57 4.6.2.2 Robustness Analysis of WJWSI ........................................................................................ 4‐60 4.6.2.3 Recommendations for Water Authorities ....................................................................... 4‐63
4.7 CORRELATION ANALYSIS OF INDICATORS AND SUB‐INDICATORS ............................................................ 4‐65 4.8 COMPARATIVE ANALYSIS OF RESULTS OF DIFFERENT CATCHMENTS ....................................................... 4‐68 4.9 SUMMARY .............................................................................................................................................. 4‐71 CHAPTER 5: CONCLUSIONS AND RECOMMENDATIONS 5.1 SUMMARY ................................................................................................................................................ 5‐1 5.2 CONCLUSIONS AND RECOMMENDATIONS TO WATER AUTHORITIES ......................................................... 5‐3 5.2.1 Conceptual Framework of WJWSI .................................................................................................. 5‐4 5.2.2 The Use of Delphi Technique ......................................................................................................... 5‐4 5.2.3 In‐depth Interview with Selected Key Stakeholders ....................................................................... 5‐4 5.2.4 Weights for Indicators and Sub‐indicators ..................................................................................... 5‐5 5.2.5 Uncertainty and Sensitivity of the Index ........................................................................................ 5‐5 5.2.6 Correlation of Indicators and sub‐indicators .................................................................................. 5‐6 5.3 RECOMMENDATIONS TO WATER AUTHORITIES ........................................................................................ 5‐7 5.3.1 The Citarum Catchment ................................................................................................................. 5‐8 5.3.2 The Ciliwung Catchment ................................................................................................................ 5‐9 5.3.3 The Citanduy Catchment .............................................................................................................. 5‐10 5.4 RECOMMENDATIONS FOR FURTHER RESEARCH ...................................................................................... 5‐11 REFERENCES ................................................................................................................................................... 6‐1 APPENDICES APPENDIX A: QUESTIONNAIRE OF ROUND ONE – DELPHI TECHNIQUE APPLICATION ...................... A‐1 APPENDIX B: QUESTIONNAIRE OF ROUND TWO – DELPHI TECHNIQUE APPLICATION ....................... B‐1 APPENDIX C: INTERVIEW GUIDE FOR IN‐DEPTH INTERVIEWS WITH KEY STAKEHOLDERS .................. C‐1 APPENDIX D: WEIGHTING SCHEME QUESTIONNAIRE....................................................................... D‐1

vii
List of Tables
Table 2.1 Indicators of Water Poverty Index ................................................................................................... 2‐25 Table 2.2 Correlation coefficients of WPI, Falkenmark Water Stress Indicator and HDI .................................. 2‐26 Table 2.3 Indicators of Canadian Water Sustainability Index ........................................................................... 2‐28 Table 2.4 Indicators of Watershed Sustainability Index ................................................................................... 2‐31 Table 2.5 Obtaining sub‐index values for EPI parameter of WSI ...................................................................... 2‐32 Table 2.6 Comparisons of CWSI, WPI and WSI ................................................................................................ 2‐34 Table 2.7 Interpretation of final HDI values ..................................................................................................... 2‐38 Table 2.8 Cluster analysis based on values of ESI themes ................................................................................ 2‐44 Table 3.1 Components and indicators of existing water sustainability indices .................................................. 3‐5 Table 3.2 Regrouping of indicators of existing water sustainability indices ....................................................... 3‐6 Table 3.3 Conceptual framework of the WJWSI ................................................................................................ 3‐7 Table 3.4 Thresholds suggested in Round One ................................................................................................ 3‐27 Table 3.5 Modified WJWSI framework after Round One of Delphi application................................................ 3‐28 Table 3.6 Framework of WJWSI as agreed after Delphi application Round Two .............................................. 3‐33 Table 3.7 Final framework of WJWSI after the in‐depth interview .................................................................. 3‐36 Table 3.8 Weight calculation for one respondent ............................................................................................ 3‐40 Table 3.9 Normalised weights for 13 indicators and sub‐indicators from all respondents ............................... 3‐42 Table 3.10 Interpretations of sub‐indices and aggregated Index ..................................................................... 3‐45
Table 4.1 Criteria for sub‐index values of Information Disclosure ...................................................................... 4‐4 Table 4.2 Criteria for sub‐index values of Governance Structure ....................................................................... 4‐5 Table 4.3 Criteria for sub‐index values of Law Enforcement .............................................................................. 4‐5 Table 4.4 Upper and lower values of thresholds of non‐categorical indicators and sub‐indicators ................... 4‐7 Table 4.5 Uncertainties of categorical indicators and sub‐indicators ................................................................. 4‐7 Table 4.6 Example of input for the triangle distribution function .................................................................... 4‐11 Table 4.7 Categories for industry in Proper Prokasih program ........................................................................ 4‐18 Table 4.8 Sub‐indices of Citarum catchment for 2008 ..................................................................................... 4‐26 Table 4.9 Results of uncertainty analysis for Citarum catchment .................................................................... 4‐28 Table 4.10 Correlation coefficients between final index and thresholds for Citarum catchment ..................... 4‐31 Table 4.11 Aggregation based on different weighting schemes and aggregation methods ............................. 4‐32 Table 4.12 Sub‐indices of Citarum catchment for 2006 and 2007 ................................................................... 4‐35 Table 4.13 Dams for irrigation along Ciliwung River ........................................................................................ 4‐41 Table 4.14 Sub‐indices of Ciliwung catchment for 2006, 2007 and 2008 ......................................................... 4‐43 Table 4.15 Percentage of Water Loss in Ciliwung catchment .......................................................................... 4‐44 Table 4.16 The rainfall and water used in Ciliwung catchment, 2006 to 2008 ................................................. 4‐48 Table 4.17 Results of uncertainty analysis for Ciliwung catchment ................................................................. 4‐50 Table 4.18 Correlation coefficients between final Index and thresholds ......................................................... 4‐51 Table 4.19 Aggregation results based on different weighting schemes and aggregation methods .................. 4‐52 Table 4.20 Coverage areas of sub‐catchments in Citanduy catchment ............................................................ 4‐56 Table 4.21 Sub‐indices of Citanduy catchment for 2006, 2007 and 2008 ........................................................ 4‐59 Table 4.22 Results of uncertainty analysis for Citanduy catchment ................................................................. 4‐61 Table 4.23 Correlation coefficients between final Index and thresholds ......................................................... 4‐62 Table 4.24 Aggregation results based on different weighting Schemes and aggregation methods.................. 4‐63 Table 4.25 Correlation coefficients of WJWSI indicators and sub‐indicators ................................................... 4‐66

viii
List of Figures
Figure 1.1 Thesis structure ............................................................................................................................... 1‐7 Figure 2.1 The prism of sustainability ................................................................................................................ 2‐5 Figure 2.2 Illustration of the continuous rescaling method ............................................................................. 2‐15 Figure 2.3 An example of use of the categorical scaling method ..................................................................... 2‐16 Figure 2.4 Stages of aggregation of an index ................................................................................................... 2‐20 Figure 2.5 Comparisons of arithmetic and geometric aggregation methods ................................................... 2‐22 Figure 2.6 The Pressure‐State‐Response (PSR) model ..................................................................................... 2‐31 Figure 2.7 The DPSIR model (Smeets et al., 1999) ........................................................................................... 2‐39 Figure 3.1 Flowchart for identification of potential components and indicators of WJWSI ............................... 3‐4 Figure 3.2 Percentage of responses agreed on components – Round One ...................................................... 3‐23 Figure 3.3 Percentage of responses agreed on indicators – Round One .......................................................... 3‐25 Figure 3.4 Percentage of responses agreed on thresholds – Round One ......................................................... 3‐26 Figure 3.5 Percentage of responses agreed on all components together – Round Two ................................... 3‐30 Figure 3.6 Percentage of responses agreed on indicators and sub‐indicators – Round Two ............................ 3‐31 Figure 3.7 Percentage of responses agreed on thresholds – Round Two ......................................................... 3‐32 Figure 3.8 Response of a respondent in the Revised Simos’ procedure ........................................................... 3‐39 Figure 3.9 Weights given by different groups of respondents ......................................................................... 3‐43 Figure 4.1 Uncertainty and sensitivity analysis scheme for WJWSI ................................................................... 410 Figure 4.2 Distribution function for Water Availability .................................................................................... 4‐11 Figure 4.3 West Java province ......................................................................................................................... 4‐13 Figure 4.4 Citarum catchment in West Java .................................................................................................... 4‐20 Figure 4.5 Sub‐index values of indicators and sub‐indicators for Citarum catchment ..................................... 4‐36 Figure 4.6 Ciliwung catchment in West Java .................................................................................................... 4‐41 Figure 4.7 Sub‐index values of indicators and sub‐indicators for Ciliwung catchment ..................................... 4‐47 Figure 4.8 The Citanduy catchment in West Java ............................................................................................ 4‐56 Figure 4.9 Sub‐index values of indicators and sub‐indicators for Citanduy catchment .................................... 4‐58 Figure 4.10 Scatter plot of data points of sub‐index values of Poverty and Sanitation .................................... 4‐68 Figure 4.11 Scatter plot of data points between sub‐index Values of Coverage and Health Impact ................ 4‐68 Figure 4.12 Sub‐index values of three West Java catchments for 2008 ........................................................... 4‐70

ix
Abbreviations
The following list of abbreviations is used frequently in the thesis. The other abbreviations, which
were used only in particular sections, are defined in those sections.
WJWSI West Java Water Sustainability Index
WPI Water Poverty Index
CWSI Canadian Water Sustainability Index
WSI Watershed Sustainability Index
HDI Human Development Index
ESI Environmental Sustainability Index
MC Monte Carlo
PSR Pressure State Response
DPSIR Driving force Pressure State Impact Response
WSP Water Service Provider

x
Published Manuscripts
The following manuscripts were published or under review on journals and conferences, which
materials were taken from this thesis:
Juwana, I., Muttil, N., & Perera, B. J. C. (2012). Application of West Java Water Sustainability Index (WJWSI) in Three Water Catchments. Paper in preparation for Science of the Total Environment: An International Journal for Scientific Research into the Environment and its Relationship with Humankind.
Juwana, I., Muttil, N., & Perera, B. J. C. (2012). Indicator‐based Water Sustainability Assessment – A Review. Paper under review in Science of the Total Environment: An International Journal for Scientific Research into the Environment and its Relationship with Humankind.
Juwana, I., Muttil, N., & Perera, B. J. C. (2012). Application and robustness analysis of West Java water sustainability index Citarum catchment. Paper under review in Water science and technology: a journal of the International Association on Water Pollution Research.
Juwana, I., Muttil, N., & Perera, B. J. C. (2011). Application of West Java water sustainability index in Citarum catchment. Paper presented at the 20th World IMACS/MODSIM Congress 12‐16 December 2011, Perth, Australia.
Juwana, I., Perera, B., & Muttil, N. (2010a). A water sustainability index for West Java ‐ Part 1:
developing the conceptual framework. Water science and technology: a journal of the International Association on Water Pollution Research, 62(7), 1629‐1640.
Juwana, I., Perera, B., & Muttil, N. (2010b). A water sustainability index for West Java ‐ Part 2:
refining the conceptual framework using Delphi technique. Water science and technology: a journal of the International Association on Water Pollution Research, 62(7), 1641‐1652.
Juwana, I., Perera, B. J. C., & Muttil, N. (2009). Application of Delphi Technique for Development of a Water Sustainability Index for West Java, Indonesia. Paper presented at the 32nd Hydrology and Water Symposium 30 November ‐ 3 December 2009, Newcastle, Australia.
Juwana, I., Perera, B. J. C., & Muttil, N. (2009). Conceptual framework for the development of West
Java water sustainability index. Paper presented at the 18th World IMACS/MODSIM Congress 13‐17 July 2009, Cairns, Australia.
Introduction 1-1
Chapter 1
Introduction
1.1 BACKGROUND
“In an age when man has forgotten his origins and is blind even to his
most essential needs for survival, water along with other resources has
become the victim of his indifference” (Carson, 1962, p. 50)
The importance of water to living creatures is all too evident. Human beings, for example,
cannot live without water, even for a few days. Therefore, it is of utmost importance to
maintain the sustainability of water resources, so that these resources can be utilised by
humans and others, now and in the future. To maintain and improve the quality of water
resources, an adequate understanding of current conditions of such water resources is
required.
In one of the most densely populated provinces of Indonesia, West Java, the conditions of
water resources are poor. The increase in population in the province has resulted in the
increased demand for clean water. To fulfill the demand, both surface and groundwater
resources in West Java are utilised. Both resources are dependent on rainfall. The availability
of these water resources is abundant, due to high rainfall in most areas of West Java. However,
this abundance of water is not properly managed, and has resulted in water shortages in some
areas of the province (Rahmat & Wangsaatmadja, 2007). In terms of their quality, most surface
and groundwater resources in West Java are polluted by domestic, agricultural and industrial
activities. Regular monitoring by the Environmental Protection Agency (EPA) of West Java
during the period 2004–2006 showed that water quality parameters of most rivers in West
Java did not meet the requirements of provincial and national regulations (Rahmat &
Wangsaatmadja, 2007).

Introduction 1-2
In the last decade, the provincial government of West Java has implemented various programs
to improve the performance of water resources. However, these programs have not been
successful. The quality of surface water is decreasing and the quantity of groundwater is
depleting. The main cause for the failure of these programs is lack of awareness of the people
of West Java on the importance of water resources. In general, people in West Java are not
aware that valuable water resources are deteriorating and need to be sustained (Rahmat &
Wangsaatmadja, 2007).
It is therefore important to obtain a comprehensive understanding on the current status of
water resource conditions in West Java. Once this information has been obtained, relevant
programs can be designed to improve the quality of the water resources. A water sustainability
index is a useful tool to address this situation. Such an index comprises indicators related to
the sustainability of water resources, and offers the following benefits:
(i) It can be used to identify all factors contributing to the improvement of water resources
(Chaves & Alipaz, 2007; Policy Research Initiative, 2007; Sullivan, 2002), so that the
resources can be used to fulfill present and future needs.
(ii) It can be used to assist decision makers to prioritise issues and programs related to
water resource management.
(iii) It can be used to communicate the current status of existing water resources to the
wider community (Policy Research Initiative, 2007).
In the recent past, several indices related to water resource sustainability have been
developed. They are the Water Poverty Index (WPI) by Sullivan (2002), the Canadian Water
Sustainability Index (CWSI) by the Policy Research Initiative (2007), and the Watershed
Sustainability Index (WSI) by Chaves and Alipaz (2007). Even though there have been some
successful experiences with the implementation of these sustainability indices, they are not
fully applicable in other regions or countries, since they have been developed for use in
specific regions or countries.
Therefore, a new water sustainability index, which is specifically developed with the
involvement of local water stakeholders and based on West Java natural and socio-economic
characteristics, is needed to help improve water resources management in West Java. The

Introduction 1-3
index will be able to not only obtain information on current conditions of water resources in
West Java, but also to prioritise water issues in water resource management in West Java. The
prioritization of water issues is especially important since such prioritization were not found in
existing documents related to water resources management in West Java. This study was
aimed at developing a water sustainability index for the West Java Province, called the West
Java Water Sustainability Index (WJWSI).
1.2 AIMS OF THE RESEARCH
The aim of this study was to develop the West Java Water Sustainability Index (WJWSI), which
can be used as a tool to assess the sustainability of West Java water resources, prioritise water
issues, and communicate water issues to the wider community. The application of WJWSI in
West Java catchments will assist decision makers in the province to have better knowledge of
the overall water resource conditions, and to prioritise water-related issues and their
respective programs towards a more sustainable water resources management. The results of
WJWSI application will also be used to increase the awareness of the wider community and to
encourage them to participate in the improvement of water resource performance in West
Java.
1.3 SIGNIFICANCE OF THE RESEARCH
In the past few decades, the increased water demand in West Java Province has resulted in
excessive groundwater extractions, both by industries and households. This situation is
worsened by the increase of surface water pollution, caused by wastewater discharges by
industries, households and agriculture. Even though these water resource deteriorations are
evident, the awareness by people in West Java is poor due to a lack of understanding about
comprehensive conditions and the importance of those water resources.
The development of a West Java Water Sustainability Index (WJWSI) is proposed in this study
to meet the need to obtain comprehensive information on the conditions of water resources
in West Java, specifically developed through the involvement of water stakeholders in West
Java. The WJWSI will be an important part of sustainable water resources management in

Introduction 1-4
West Java, as it provides a holistic tool to assess the current status of water-related issues, as
well as providing a tool for communicating water issues in the wider community. Having
communicated this message to the wider community about the status of water sustainability
in the area, they will become more aware of the conditions and therefore willing to participate
in the improvement of water resource performance.
The applications of WJWSI in West Java catchments will give decision makers information on
current conditions of water issues in the respective catchments. Consequently, these decision
makers will be able to design and deliver better programs to improve the overall water
resource management. In the near future, the developed index can also be modified for
application in other areas in Indonesia, as well as in other countries. Modifications might be
needed to include any unique characteristics of other areas, and ensure that the unique
characteristics are included in the calculation and analysis.
Furthermore, the Delphi technique used in this study offers new insights into the selection of
components and indicators of the water sustainability index, since the Delphi technique has
not been used in the selection of components and indicators of previous water sustainability
indices.
1.4 RESEARCH METHODOLOGY
The development of the WJWSI included the following tasks:
1. Design of the conceptual framework of WJWSI
2. Fieldwork preparation
3. Delphi application and results analysis
4. Applications of WJWSI in West Java catchments
5. Robustness analysis of WJWSI
Task 1 – Design of the conceptual framework of WJWSI
The conceptual framework of WJWSI includes the identification of components, indicators and
thresholds of indicators. The components and indicators were identified, based on the
literature review on sustainability criteria, water resource sustainability guidelines, and

Introduction 1-5
existing water sustainability indices of WPI, CWSI and WSI. The relevancy of these
components and indicators to water resources, environmental, social and economic
characteristics of West Java, and the availability of data for use in the index applications were
also considered. Once the components and indicators were identified, thresholds for the
indicators were obtained from relevant policies, regulations and guidelines.
Task 2 – Fieldwork preparation
Fieldwork in Indonesia consisted of two parts: the Delphi application and WJWSI applications
in West Java catchments. In this study, the Delphi technique was used to refine the
components, indicators and thresholds identified in the literature review (i.e. Task 1). The
preparation for the Delphi technique application included identifying stakeholders as
respondents, making initial contact with stakeholders and preparing questionnaires. The
stakeholders who participated in this study were selected from university lecturers,
governmental officials, environmental consultants and community groups. For applications of
WJWSI in West Java catchments, the preparation included identifying potential areas for
application and contact persons for collecting data related to the catchments. The
identification of contact persons is important to ensure that the required data for the WJWSI
applications are available during fieldwork.
Task 3 – Delphi application and results analysis
As indicated earlier, the Delphi technique was used in this study to seek opinions from water-
related stakeholders in West Java on the identified components, indicators and thresholds of
WJWSI. Steps undertaken in the Delphi application included revising the list of selected
stakeholders (where applicable), distributing series of questionnaires, and analysing the
information obtained through these questionnaires. In this study, the main questions for the
initial questionnaire focused on the components, indicators and thresholds emanating from
the literature review. During the questionnaire distribution, the respondents were asked about
their agreement on the components, indicators and thresholds. In addition, they were also
allowed to add, modify or remove the components, indicators and thresholds from the list.
Using the Delphi technique, questionnaires were distributed to respondents in multiple rounds
to seek consensus among respondents. After each round of questionnaire distribution, the
information obtained through the questionnaires was analysed. Based on the information, a

Introduction 1-6
new WJWSI framework was developed and used in the next round. Due to consensus being
reached for all components and most of the indicators after two rounds of questionnaire
distribution, an in-depth interview with key stakeholders followed the Delphi technique
application.
Task 4 – Applications of WJWSI in West Java catchments
The WJWSI framework was finalised and applied in three catchments in West Java. Each
application commenced with collecting required data and information related to the WJWSI
indicators and sub-indicators. Data was collected from past studies, institutional databases and
other relevant sources. The data was used to compute the sub-index values of each WJWSI
indicator and sub-indicator. These sub-index values were then calculated and aggregated to
produce the final WJWSI value. The results of these applications were used to analyse the
performance of the catchments, so that recommendations to improve the management of
water resources in these catchments could be provided to respective catchment authorities.
Task 5 – Robustness analysis of WJWSI
Robustness analysis is an important step in index development because the inputs for
developing an index are generally based on some assumptions, which might lead to variation
in the index values as outputs (Esty et al., 2005). The robustness of WJWSI was analysed in this
study by performing an uncertainty and sensitivity analysis on the index. In general, the
uncertainty analysis focused on how the upper and lower values of thresholds, different
weighting schemes and aggregation methods affect the values of sub-indices and the final
index. The sensitivity analysis was undertaken to answer the following questions:
- Which thresholds of the indicators and sub-indicators were the most sensitive to the
changes in their upper and lower values?
- How important was the upper and lower values of the thresholds of the indicators and
sub-indicators in determining the final index value?
- Which weighting schemes or aggregation methods were more sensitive to the final index
value?

Introduction 1-7
1.5 THESIS STRUCTURE
This thesis presents five chapters as shown in Figure 1.1. The growing information on
sustainable water resource management (Chapter 2) led to the development of a water
sustainability index in West Java (Chapter 3), which was then applied in three West Java
catchments (Chapter 4). Detailed explanations for each chapter are described in the following
sub-sections.
Figure 1.1 Thesis structure
Chapter 1. Introduction
This chapter presents the general overview of the overall thesis, which assists readers in
comprehending the main ideas explored in the thesis. It briefly describes the current
conditions of water resource management in West Java, as well as identifying growing studies
on sustainable water resource management. These led to the development of a water
sustainability index for West Java.
The aims of the research are clearly defined in this chapter, which highlights general objectives
of the research, and how the results can be used by relevant decision makers in West Java,
Indonesia. To emphasise the importance of the study, its significance is presented after the
aims of the research. The chapter continues with a brief methodology used in the study, where
various tasks undertaken are presented and discussed.

Introduction 1-8
Chapter 2. Indicator-based sustainability assessment
This chapter provides a state-of-the-art review of sustainability and water resource
management that leads to the development of WJWSI. Under the sub section on sustainability,
past studies on sustainability definitions are presented, followed by important principles and
criteria of sustainability. Under the sub section on sustainable water resource management,
criteria and guidelines for sustainable water resource management are described. These
principles, criteria and guidelines are then analysed for use during the identification of
components and indicators of WJWSI.
This chapter then discusses the indicator-based sustainability assessment. Here, general issues
on the method and a detailed explanation of elements of the indicator-based sustainability
assessment are presented. Finally, this chapter concludes by presenting the examples of three
existing water sustainability indices: the Canadian Water Sustainability Index (CWSI), Water
Poverty Index (WPI) and Watershed Sustainability Index (WSI). For each index, issues on the
selection of components and indicators, obtaining sub-index values, aggregation of indicators,
and interpretation of the final index are discussed.
Chapter 3. Development of the West Java Water Sustainability Index
This chapter focuses on development of the West Java Water Sustainability Index (WJWSI). It
comprises design elements and how the WJWSI conceptual framework is finalised. The design
of the framework discusses how the components, indicators and thresholds are identified and
selected. In addition, justification for the selection of components, indicators and thresholds is
provided.
Following discussion on the development of the conceptual framework, this chapter explores
the use of the Delphi technique to refine the conceptual framework. Here, definitions,
advantages and disadvantages of the Delphi technique are described, followed by detailed
steps of Delphi application. These steps include the identification of water-related
stakeholders as respondents, the design of questionnaires for Delphi application, the
distribution and collection of questionnaires, and analysis of the information obtained from
questionnaires. Finally, in-depth interviews with key stakeholders follow the application of
Delphi technique to finalise WJWSI components, indicators and thresholds.
Introduction 1-9
Chapter 4. Applications of West Java Water Sustainability Index
This chapter presents the application of WJWSI to three different catchments in West Java.
The applications are undertaken to provide valuable insights into the improvement of water
resource management in West Java, Indonesia.
Prior to WJWSI applications, this chapter discusses various factors related to water resource
management in West Java, which include demographic facts, socio-economic issues, and
environmental aspects of water resource management. Detailed applications of WJWSI in
Citarum, Ciliwung and Citanduy catchments are then discussed. In each application,
descriptions of the respective catchments, calculations and analysis, and relevant
recommendations to decision makers are presented. Finally, a comparative analysis of
different catchments and correlation analysis of WJWSI indicators, sub-indicators and final
index are provided.
Chapter 5. Summary, conclusions and recommendations
This chapter provides a summary of the tasks undertaken in this study, conclusions drawn
from the analysis provided in the main chapters, identified limitations of the study, and
potential areas of future research.
Indicator‐based Sustainability Assessment 2‐1
Chapter 2
Indicator‐based Sustainability Assessment
2.1 INTRODUCTION
Consumption, economic growth and environmental degradation impact
sustainable development in complex and often apparently contradictory
ways. The question is: how do we know whether overall we are on a
sustainable development path? If the rhetoric of policy makers committed
to sustainable development is to be judged against the reality of
performance, then means must be found to measure and monitor
sustainable development (Atkinson et al., 2007, p. 13)
The United Nations Conference on the Human Environment in 1972 sparked environmental
awareness globally. The conference also inspired the publication of the Brundtland Report,
(also known as Our Common Future), where the notion of sustainable development was first
introduced by the Brundtland Commission (Brundtland, 1987). Since the publication of this
Report, studies and efforts to define sustainability and sustainable development have been
extensively carried out by various institutions and organizations at all levels: local, national,
regional and international.
According to Harding (2002), sustainability is the ultimate goal of sustainable development. If a
project development includes sustainability in its goals, the sustainability status of issues
related to the project needs to be assessed. The assessment should be completed during the
planning and evaluation stages. At the planning stage, sustainability assessment ensures that
project design follows sustainability guidelines. At the evaluation stage, assessment monitors
the sustainability progress of project development.

Indicator‐based Sustainability Assessment 2‐2
In the past few decades, there have been extensive efforts on measuring sustainability. One
example is the development of assessment tools based on sustainability indicators. Several
individuals and organisations have suggested various indicators for assessing sustainability.
Some authors have developed general sustainability indicators, such as the Environmental
Sustainability Index (Esty et al., 2005), Corporate Sustainability Indicators (Spangenberg &
Bonniot, 1998), the Barometer of Sustainability (Prescott‐Allen, 2001), Environmental Pressure
Indices (Jesinghaus, 1999), Taking Sustainability Seriously (Portney, 2003), Sustainability
Indicator Systems (Spangenberg & Bonniot, 1998) and Pressure‐State‐Response (PSR) based
sustainability indicators (Spangenberg & Bonniot, 1998). Some sustainability indicators are
field‐specific, such as indicators for environment (Esty et al., 2005), agriculture (Parris, 1998;
Van Ittersum et al., 2008), fossil fuel (Ediger et al., 2007) and water resources. Indicators for
water resource sustainability, for example, are the Water Poverty Index – WPI (Lawrence et al.,
2003), Canadian Water Sustainability Index – CWSI (Policy Research Initiative, 2007) and
Watershed Sustainability Index – WSI (Chaves & Alipaz, 2007). All these indices have the same
goal to measure sustainability, which can further be used to assist decision makers and other
stakeholders achieve sustainability.
This chapter focuses on the review of water resource sustainability using the indicator‐based
approach. In its early sub‐sections, the chapter discusses major definitions of sustainable
development proposed by various individuals and institutions. These definitions re‐affirm the
definition of sustainable development in the Brundtland Report (Brundtland, 1987), which
highlighted the concerns for future generations. Based on these definitions, more specific
concepts of sustainability are then presented through a discussion of sustainability principles
and criteria.
Having completed the discussion on sustainability definitions, principles and criteria; this
chapter proceeds with the review of existing definitions, principles and guidelines on
sustainable water resource management. Later, these definitions, principles and criteria are
used as the basis for the identification of components and indicators in the development of a
water sustainability index for West Java, Indonesia.
Following the above mentioned review, this chapter explores elements of an indicator‐based
sustainability assessment. These elements include the selection of components and indicators,

Indicator‐based Sustainability Assessment 2‐3
obtaining sub‐index values, weighting schemes for components and indicators, aggregation of
components and indicators, robustness analysis of the index, and interpretation of the final
index value.
To provide an in‐depth understanding of how such indicators are applied in actual cases, three
existing water sustainability indices are discussed: the Water Poverty Index (WPI), Canadian
Water Sustainability Index (CWSI) and Watershed Sustainability Index (WSI). For each of these
indices, issues related to the following are discussed: selection of components and indicators,
obtaining sub‐index values, weighting of components and indicators, aggregation of
components and indicators, and classification of the aggregated index value. Similarities and
differences are studied with the aim of using these concepts to develop the WSI for West Java,
Indonesia.
Finally, in the last section of the chapter, the Human Development Index ‐ HDI (Rodriguez,
2010) and the Environmental Sustainability Index ‐ ESI (Esty et al., 2005) are discussed to
provide analysis on the applications of the indicator‐based assessment approach in areas other
than water resources. The ESI and HDI were selected as they have been widely used for years
by various institutions (Cooke et al., 2004; Cui et al., 2004; Erker, 2003; Mohanty & Ray, 2002;
Reed et al., 2006; Samuel‐Johnson & Esty, 2002; Stapleton & Garrod, 2007; Thapa, 1995) to
measure human development and environmental sustainability issues respectively.
2.2 SUSTAINABLE DEVELOPMENT DEFINITIONS AND SUSTAINABILITY PRINCIPLES
Liverman (1988) states that efforts to measure sustainable development can only be achieved
when this concept is clearly defined. Since it was introduced in 1987 (Brundtland, 1987), there
have been extensive studies to define sustainable development. The first definition of
sustainable development was proposed by the Brundtland Commission (Brundtland, 1987),
which defined sustainable development as:
…development that meets the needs of the present without compromising the
ability of future generations to meet their own needs. (Brundtland, 1987, p. 87)

Indicator‐based Sustainability Assessment 2‐4
This definition was followed by other definitions, such as the following:
…to maximize simultaneously the biological system goals (genetic diversity, resilience,
biological productivity), economic system goals (satisfaction of basic needs,
enhancement of equity, increasing useful goods and services), and social system goals
(cultural diversity, institutional sustainability, social justice, participation). (Barbier,
1987)
…meeting human needs while conserving the Earth’s life support systems and reducing
hunger and poverty. (Palmer et al., 2005, p. 5)
Even though the above definitions are presented in different forms, the messages are
comparable. These definitions urge human actions to care for present and future
environments, while at the same time utilising natural resources to fulfill human needs. The
Brundtland definition focuses on the balance of present and future generations, while the
other two definitions further address the need for concern for environmental, social and
economic interests.
These definitions on sustainable development were further explained by the growing studies
on sustainability principles. One of the most well‐known sustainability principles is the “triple
bottom line approach”, which includes the environmental, economic and social aspects of
sustainability (Cui et al., 2004; Ekins et al., 2003; Farsari & Prastacos, 2002). Spangenberg
(2004) proposes similar principles labeled as challenges, namely environmental, social and
institutional challenges. The environmental challenge emphasises the degradation of natural
resources for human use; the social challenge highlights the unequal distribution of wealth and
poverty; and the institutional challenge focuses on peace and security.
Other sustainability principles are presented in different forms. Parkin (2000) introduced the
capital flow concept, which stated that any development for achieving sustainability needs to
manage different capital flows. These capital flows are natural, human, social, manufactured
and financial. Any development proposal has to contribute to improving, or at least
maintaining, these five different capital flows (Parkin, 2000).

Indicator‐based Sustainability Assessment 2‐5
Spangenberg & Bonniot (1998) labeled their sustainability principles “sustainability
dimensions”. These dimensions are packed in the so‐called “prism of sustainability”, as
presented in Figure 2.1. This prism, reflecting sustainability, has four dimensions, which are
institutional, environmental, social and economic. Each dimension is then further explored to
identify relevant indicators. For example, for the institutional dimension, the sustainability
indicators are participation, justice and gender balance. For the environmental dimension,
resource use and state indicators are identified. For the social dimension, the indicators are
health care, housing, social security and unemployment. Finally, for the economic dimension,
the indicators are Gross National Product (GNP), growth rate, innovation and competitiveness
(Spangenberg & Bonniot, 1998).
Apart from the indicators of individual dimensions, the prism of sustainability also offers a
framework to identify the inter‐linkage indicators between dimensions. The inter‐linkages can
be two, three or even four dimensional, which seek to compromise and synergise dimensions.
Indicators based on two‐dimensional inter‐linkages are illustrated in Figure 2.1. For example,
the Human Development Index (HDI) indicators are derived from the inter‐linkage between
Figure 2.1 The prism of sustainability (Spangenberg & Bonniot, 1998)
Indicator‐based Sustainability Assessment 2‐6
economic and social dimensions. Similarly, distribution of access to environmental resource
and transport intensity are indicators derived from the interaction of environment and social
dimensions. Furthermore, the inter‐linkage of environment and economic dimensions has
resulted in indicators such as jobs, services and resource intensity of production (Spangenberg
& Bonniot, 1998).
2.3 SUSTAINABLE WATER RESOURCE MANAGEMENT: DEFINITIONS, CRITERIA AND
GUIDELINES
As the complexity of issues related to water resources has increased, there have been
extensive studies (Ashley et al., 2004; Giuppponi et al., 2006; Loucks & Gladwell, 1999; Loucks
et al., 2000; Mays, 2006; Policy Research Initiative, 2007; Starkl & Brunner, 2004) to combine
the concept of sustainability with water resource management issues. By applying
sustainability principles, it is expected that available water resources can be responsibly
utilised, not only by the current generation, but also by future generations. Loucks & Gladwell
(1999) emphasise the importance to re‐examine current water resource planning and
management approaches to achieve more sustainable water resources. This approach needs
to be more integrated, not only in terms of the issues, but also in terms of the stakeholders. In
relation to the issues, all economic, environmental, ecological and social interests need to be
addressed in the planning of water‐related programs. For the stakeholders, contributions from
different sectors, such as academic, engineering, economy and politics, need to be integrated.
Nardo et al. (2005) note that in measuring sustainability, defining what will be measured is
important. Thus, to develop a water sustainability index, a clear understanding of the
sustainability is required. Once sustainability is clearly defined, different indicators can be
appropriately identified. Loucks & Gladwell (1999) define water resource sustainability as:
…water resource systems designed and managed to fully contribute to the
objectives of society, now and in the future, while maintaining their
ecological, environmental, and hydrological integrity. (Loucks & Gladwell,
1999, p. 30)

Indicator‐based Sustainability Assessment 2‐7
Other authors have defined water resource sustainability as:
…the ability to provide and manage water quantity so as to meet the present
needs of humans and environmental ecosystems, while not impairing the
needs of future generations to do the same. (Mays, 2006, p. 4)
…the ability to use water in sufficient quantities and quality from the local
to the global scale to meet the needs of humans and ecosystems for the
present and the future to sustain life, and to protect humans from the
damages brought about by natural and human‐caused disasters that affect
sustaining life. (Mays, 2006, p. 4)
…a process which promotes the coordinated development and management
of water, land and related resources, in order to maximize the resultant
economic and social welfare in an equitable manner without compromising
the sustainability of vital ecosystems. (GWP‐TAC, 2000, p. 1)
These definitions on water sustainability urge any water‐related decision maker and/or other
stakeholders to consider every impact of their water‐related programs on both present and
future generations. Considerations on purely technical criteria are no longer sufficient as the
complexity and uncertainty of water‐related issues intensify. Inclusion of environmental,
economic and social criteria is critical to address such complex and uncertain water‐related
problems (Loucks & Gladwell, 1999).
The above definitions also clearly indicate that sustainable water resource management can
only be achieved through the integration of water‐related issues and stakeholders. Savenije &
Van der Zaag (2002) highlight the importance of Dublin principles on integrated water resource
management, which state that:
1. Water is an essential resource, to be used and managed appropriately.
2. All relevant stakeholders should be involved in the development and management of
water resources.

Indicator‐based Sustainability Assessment 2‐8
3. The central role of women in the provision, management and protection of water
resources is recognized and acknowledged.
4. Economic value of water in all uses should be emphasized and taken into account in the
decision making.
Mays (2006) accentuates three domains of integrated water resource management, which
include scope, scale and governance. Scope covers social and developmental issues related to
water resources, its related sectors, gender empowerment, poverty eradication and fairness
among the community. Scale ranges from local to national, and also possibly the river basin
level. Governance needs to include public sector, business community and wider community
representation.
The need for the integration of water‐related issues is also noted by Loucks & Gladwell (1999).
They state that water sustainability endorses water‐related programs to be directed towards a
more integrated or holistic approach. Water‐related projects can no longer be emphasised
from a purely technical view, ignoring social and economic concerns (Loucks & Gladwell, 1999).
Towards a better understanding of water sustainability principles, Loucks & Gladwell (1999)
provide water sustainability guidelines, which include the importance of water infrastructure,
environmental quality, economics and finance, institutions and society, human health and
welfare, as well as planning and technology. In line with these guidelines, Mays (2006)
introduces seven requirements to ensure the sustainability of water resource systems. They
are basic water needs to maintain human health; minimum standard of water quality; basic
water needs to maintain ecosystem health; long‐term renewability of available water
resources; accessible data on water resources for all parties; institutional schemes to resolve
water conflict; and democratic water‐related decision making.
Jakeman et al. (2005) introduce issues to be addressed in integrated water resource
management, which include water supply and demand, poverty alleviation and subsistence
production, agricultural land use, and environmental issues such as erosion and forest
maintenance. All these issues are essential because they can be used as the basis for
developing water resource improvement programs to consider how these different issues
impact present and future generations.

Indicator‐based Sustainability Assessment 2‐9
Loucks & Gladwell (1999) emphasise the flexibility and resilient characteristics of water
sustainability. Flexibility is defined as the ability of the system to adapt due to changes of
demand and purpose in the future. Resilience is defined as the ability to recover, with
appropriate treatment, after the occurrence of unpredictable damage. The current criteria
may no longer be fully applicable in the future due to these unpredictable changes. Reliable
sustainable water resource management is required to be flexible due to these changes, and
still function effectively in protecting water resources and maintaining human needs (Loucks &
Gladwell, 1999).
To summarise, the main characteristic of water resource sustainability lies in the attitude of
key stakeholders to constantly review and re‐examine their approaches to address the
changing issues of water resources. At all times, in all plans and processes, water stakeholders
need to strive for decisions that fulfill economic, environmental and social demands (Loucks &
Gladwell, 1999).
2.4 ELEMENTS OF INDICATOR‐BASED SUSTAINABILITY ASSESSMENT
In general, the indicator‐based sustainability assessment seeks to identify indicators to
measure sustainability. An indicator is a measure, either qualitative or quantitative, of facts or
conditions of particular issue(s). If the indicators are observed regularly, they can analyse
changes during the observed period (Nardo et al., 2005). Some indicators might be grouped to
form a component, or particular indicator(s) might be further explained by having sub‐
indicators. A group of indicators and/or components, which are combined together, is called
an index or composite indicator. Nardo et al. (2005) emphasise that ideally an index should
measure multi‐dimensional ideas that cannot be explained by one indicator.
To apply the indicator‐based sustainability assessment, common elements to be considered
include component and indicator selection, obtaining sub‐index values of components and
indicators, weighting of components and indicators, aggregation of components and
indicators, and robustness analysis of the index. The components and indicators provide a
framework for indicator‐based sustainability assessment, as it identifies all the components
and indicators of the index. To assess sustainability using this approach, all identified indicators

Indicator‐based Sustainability Assessment 2‐10
must have common unit values. The values of the indicators in common units are known as
sub‐index values. After all the sub‐index values of the indicators are obtained, they can be
aggregated to a single index value. In the aggregation, the indicators might be assigned equal
or non‐equal weights. The robustness analysis of the index is conducted to study the
uncertainty of inputs on the index.
2.4.1 Selection of components and indicators
Components and indicators are the main elements in an index. Therefore, in developing an
index, selection of components and indicators is extremely important. Components and
indicators for an index are commonly selected through a literature review on previous
sustainability frameworks and existing sets of components and indicators (Chaves & Alipaz,
2007; Policy Research Initiative, 2007; Sullivan & Meigh, 2007). Generally, an initial set of
components and indicators is identified, based on those reviews. This initial set is then refined
through discussion with key stakeholders (Policy Research Initiative, 2007; Sullivan & Meigh,
2007).
Liverman & Hanson (1988) suggest the following characteristics for the selection of indicators:
- Sensitive to change in time
A reliable indicator must be observable throughout the particular time series of data;
otherwise the indicator will not be able to provide information on how the issues related
to the indicator have changed over time.
- Sensitive to change across space or within groups
An indicator should reflect the changes occurred across space or within groups. If not, the
indicator will be less useful to measure a condition. The Gross National Product (GNP) is
an example of an economic indicator which is not sensitive to change within groups. The
GNP value may increase even though for the majority of community groups the economic
condition worsens. In this case, such an indicator might be replaced by one that measures
the distribution of income.
Indicator‐based Sustainability Assessment 2‐11
- Predictive or anticipatory
With regard to sustainability, reliable indicators should be able to predict or anticipate the
signs of unsustainable conditions. Then, once the signal is received, the indicators can be
traced to identify the main causes for the unsustainable signal.
The water stress indicator by Falkenmark (1989), for example, is an indicator which can
provide an early signal, if water availability in a particular area is under threat. As this
indicator is derived from two variables – population and available fresh water – further
analysis can demonstrate which variable has caused the stress to water resources. Once
specific causes of the unsustainable condition are identified, appropriate action to
address these causes can be deployed.
- Reference or threshold values available
Indicators which have been identified will be less useful when reference or threshold
values to assess the indicators are not available. Therefore, if the data or reference value
is not available for an indicator, the indicator might have to be replaced by a ‘similar’
indicator, for which its data is available.
In developing countries, this is a major concern as required data to assess the identified
indicators might not be available or inaccurate (West Java Environmental Protection
Agency, 2008). Therefore, it is important that during the indicator selection process, the
issue of data availability is included as one of the selection criteria.
- Unbiased
Biases in the selection of sustainability indicators may occur due to various reasons, such
as the existing knowledge of the index developer, political interests, and the background
given in the existing literature. It might not be possible to eradicate these biases.
Therefore it is important, for the index developer, to identify the potential sources of
biases and take necessary measures to minimise them.
Indicator‐based Sustainability Assessment 2‐12
- Appropriate data transformation
For most indicators, the identified indicator is not the raw data. Therefore, to obtain the
value for the indicator, appropriate data transformations or calculations are needed. It is
important to carefully develop or adopt the appropriate method for transforming the
data into the meaningful indicator value.
- Integrative
The importance of integrative or composite indicators is to provide the signs on relative
conditions that are not sustainable. Senior decision makers need to be informed on the
conditions based on these signs, which will be analysed to trace the main causes that lead
to conditions that are not sustainable.
Some concerns regarding the importance of indicator selection are presented by Nardo et al.
(2005), who emphasise the quality of basic data for indicators and procedures to carry out the
selection of indicators. The concerns for quality of basic data include their relevance, accuracy,
timeliness, accessibility, interpretability and coherence. The concerns for procedures include
design of the theoretical framework, obtaining sub‐index values, linkage to other indicators
and robustness analysis.
2.4.2 Obtaining sub‐index values
In general, the identified indicators for an index have their own units. For example, the Water
Availability indicator of the Canadian Water Sustainability Index (CWSI) has the unit of
m3/cap/year. The amount of available water for one person per year in a certain area
(presented in m3/cap/year), is known as the actual value of Water Availability indicator. As the
actual values of indicators of an index are presented in different unit values, they cannot be
aggregated or compared. The indicators can only be aggregated or compared when they have
the same unit value. The values of indicators, which have the same unit, are known as sub‐
index values. Different methods to obtain the sub‐index value of indicators are currently
available. The selection of the most appropriate method will be based on properties of the
data and the purpose of developing the index (Nardo et al., 2005). Special attention and
careful analysis is needed, as different methods may result in different outcomes (Ebert &
Welsch, 2004). Some of these methods are discussed below.

Indicator‐based Sustainability Assessment 2‐13
a) Ranking method
The ranking method is the simplest method, as the sub‐index is obtained, based on the relative
importance of identified indicators. This method is used to compare the values of a particular
indicator for different areas. Once the values are obtained, they are simply arranged in
ascending or descending order, and the rankings are defined. In some cases (Jencks et al.,
2003), the values for the indicator for different areas across different years are also compared.
The equation to calculate sub‐index values using this method is:
(2.1)
where Si is the sub‐index value for indicator i and Xi is the actual value for indicator i.
This method was used in assessing the Medicare Beneficiaries Indicators (Jencks et al., 2003)
and applications of the Technology Achievement Index (TAI) to obtain the sub‐index values of
TAI indicators (Cherchye et al., 2007). In these applications, this method was useful in
prioritising the identified indicators. Based on the prioritisation, relevant policy actions were
formulated to each indicator.
The advantage of using this method is its simplicity. However, once the rankings are presented,
the information attached to each indicator becomes less meaningful (Nardo et al., 2005).
Consequently, a comparative analysis between indicators cannot be achieved in absolute
terms of their values; rather it is based on relative importance.
b) Continuous re‐scaling
The continuous rescaling method is used to produce an identical range for the values of
indicators, e.g., 0 – 1 or 0 – 100. These values assist decision makers to better understand the
performance of respective indicators, and allow them to formulate more specific action plans
to address the issues related to certain indicators.
This method has been widely used in the development of various indices, such as the Canadian
Water Sustainability Index (Policy Research Initiative, 2007), Water Poverty Index (Lawrence et
al., 2003), Human Development Index (Rodríguez, 2010), and Environmental Sustainability

Indicator‐based Sustainability Assessment 2‐14
Index (Esty et al., 2005). The general equation to calculate the sub‐index values using this
method is as follows:
(2.2a)
(2.2b)
where Si is the sub‐index value for indicator i, Xi is the actual value for indicator i, and Xmin and
Xmax are the minimum and maximum threshold values of the indicator.
Eq. (2.2a) gives the sub‐index value in 0 – 1 scale, while Eq. (2.2b) provides a 0 – 100 scale.
These two equations are used when the Xmin is the least preferred value and the Xmax is the
most preferred value. If Xmin and Xmax are the most and least preferred values respectively, Eq.
(2.2a) and Eq. (2.2b) are modified to:
(2.3a)
(2.3b)
In order to use the continuous rescaling method, maximum and minimum threshold values for
each indicator must be defined. The actual values for the indicator are then re‐scaled, based
on the range of threshold values. For example, as illustrated in Figure 2.2, the maximum and
minimum threshold values for Availability indicator in CWSI are 1,700 m3/cap/yr and 500
m3/cap/yr respectively.
If the actual value for this indicator, for instance, is 1000 m3/cap/yr, then its sub‐index value is
calculated as follows:

Indicator‐based Sustainability Assessment 2‐15
ActualValues
Sub-indexValues
1700 100
500 0
Maximum Values
Minimum Values
Figure 2.2 Illustration of the continuous rescaling method
c) Percentage of annual differences over two consecutive years
This method calculates the sub‐index value of a particular indicator based on the difference of
an actual value in a particular year compared to the previous year. The use of this method is
subject to time‐series data availability for the identified indicators (Nardo et al., 2005).
The general equation for this method is:
(2.4)
where Si is the sub‐index value of indicator i, Xi,t is the actual value of indicator i at the time t ,
Xi,t‐1 is the actual value of indicator I at the time t‐1.
This method was used in the application of the Internal Market Index (Nardo et al., 2005).

Indicator‐based Sustainability Assessment 2‐16
d) Categorical scaling
The categorical scaling method assigns categories for indicators based on some defined
criteria. The categories can be numerical (values such as 1 – 5) or qualitative (such as ‘very
good’, ‘good’ or ‘poor’). Compared to the continuous rescaling method, instead of having the
sub‐index values in continuous form, this method produces the sub‐index values in categories.
The use of this method using numerical categories is illustrated in Figure 2.3.
1460 - 1700 51220 - 1460 4980 - 146 3740 - 980 2500 - 740 1
1700 100
Maximum Values
500 0
Minimum Values
Figure 2.3 An example of use of the categorical scaling method
In this application, the distance between the maximum threshold (1700 m3/cap/yr) and
minimum threshold (500 m3/cap/yr) of Availability indicator is divided into five criteria, each
representing a certain range of actual value for Availability. Each criterion corresponds to one
category of the sub‐index values. Thus, for example, if the actual value water availability is
1,000 m3/cap/yr, its sub‐index value is ‘3’.
This method can also be used with quantitative data to obtain the sub‐index values of certain
indicators when they are not available. For example, to assess the Institutional Capacity
indicator of the WSI, there was no quantitative information available. Thus, the WSI developer
suggested two indicators to assess the Institutional Capacity, they were Legal Framework and

Indicator‐based Sustainability Assessment 2‐17
Participatory Management. Each of these two indicators has a criterion, which was divided
into five scales (very poor, poor, medium, good and excellent) (Chaves & Alipaz, 2007). Each
criterion corresponded with a sub‐index value. The sub‐index value for the Institutional
Capacity was the average of sub‐index values of Legal Framework and Participatory
Management.
The general equation for using this method is:
(2.5)
where Si is the sub‐index value of indicator i, Xi is the actual value of indicator i, Zj is the
category for Xi that meets criteria j, and n is the number of categories.
e) Distance to a reference
Nardo et al. (2005) discussed the use of this method by Parker (1991) in ‘Concern About
Environmental Problems’. In this application, the values of indicators of one country (or the
average values of different countries) are used as a reference. The sub‐index values of
respective indicators of other countries are assessed, based on their relative conditions to the
reference value(s).
The general equation to use this method is:
(2.6)
where Si is the sub‐index value for the indicator, Xi is the actual value for the indicator, and Xr is
the actual value used as reference.

Indicator‐based Sustainability Assessment 2‐18
2.4.3 Weights
In the index development, weights are used in the indicator aggregation, allowing index
developers (or users) to assign different weights on the indicators. In general, Nardo et al.
(2005) classify weighting techniques in two broad categories, which are statistical‐based
methods and participatory‐based methods. In the former method, weights are assigned based
on the analysis on the data of the indicators. In the latter method, weights are given based on
opinion from experts or the general public. As the selection of experts might involve subjective
judgment, justifications for the selection of these experts are required.
Methods such as Factor Analysis (FA)/Principal Component Analysis (PCA) and Unobserved
Component Model (UCM) are examples of the statistical‐based weighting approach. In
general, the FA/PCA assigns weights based on the loading factor of each indicator to the final
index. The use of FA/PCA to determine weights involves four steps. The first step is to analyse
the correlation of the indicators. If no correlation exists, it is likely that the indicators do not
share common factors. Then, in such cases where the indicators are not correlated, the
indicators are assigned equal weights. If the correlation existed, the second step is to identify
common factors, representing group(s) of indicators. In PCA, the factors are known as
(principal) components. Each factor indicates how well the factor in explaining the overall
variance. The third step is to determine the contribution of each indicator to its corresponding
factor using the factor loading analysis. Then, the final step is to compute the weights based on
the common factor and factor loading analysis. Higher weights are given to the indicators with
high loading factor, and high percentage in explaining the overall variance (Nardo et al., 2005).
The UCM method assumes that indicators of an index are dependent on other unknown
factors. These factors are labeled as unobserved component(s) (Harvey & Koopman, 2000;
Nardo et al., 2005). The dependency on the unobserved component(s), as well as errors
associated with each indicator of an index, is shown by the variance of each indicator. To use
this method, the first step is to calculate the variance of each indicator of the index. Then, the
sum of variance of other indicators is calculated. The weight for an indicator increases as the
variance of that indicator decreases, and as the sum of variance of other indicators increases
(Nardo et al., 2005).

Indicator‐based Sustainability Assessment 2‐19
In the participatory‐based approach, methods such as Budget Allocation (BAL), Analytical
Hierarchical Process (AHP) and Revised Simos’ Procedure are available. The BAL method is
used to assign weights for different indicators based on allocation of budget by selected
experts. The experts are requested to allocate certain budgets to each indicator. Once the
budget is allocated, weights are calculated based on the budget. If necessary (optional), the
budget allocation is repeated until convergence among experts is reached (Nardo et al., 2005).
The AHP method is a multi‐criteria decision‐making technique used in different fields such as
customer service (Kwong & Bai, 2002), operational design (Macharis et al., 2004) and water
conservancy (Zhang, 2009). This method is used to determine weights of different criteria in
decision making. Using AHP, weights are determined through pair wise comparison of the
identified criteria. The method was found to be useful to determine weights of criteria where
qualitative judgment from experts or the general public was involved.
The Revised Simos’ Procedure seeks to assign weights to different indicators based on the
preference of selected decision makers ‐ DM (Kodikara et al., 2010). Using this method,
weights for different indicators were assigned by distributing cards to the selected DMs. Each
card represented one indicator. Along with the cards to represent each indicator, the DM is
also given blank cards. Then, the DMs are asked to arrange the cards in order of importance,
from the least important to the most important. The weights of the indicators are computed,
based on card order. An example of this method can be found in the study of multi‐objective
operation of urban water supply systems by Kodikara (2008).
2.4.4 Aggregation
In developing an index, aggregation may occur in sequential stages, as illustrated in the
example in Figure 2.4, assuming that the index has components, indicators and sub‐indicators.
In this figure, the values of sub‐indicators are aggregated to obtain the values of the indicators.
The values of the indicators are then aggregated to obtain the values of components. Finally,
the values of components are aggregated to obtain the final index value.
In some cases the final index is not obtained from the aggregation of the components. Instead
it is obtained from the aggregation of indicators or sub‐indicators. The Environmental
Sustainability Index (ESI) is such an example. Even though the ESI has five components, the

Indicator‐based Sustainability Assessment 2‐20
final index value is obtained through the aggregation of 21 sub‐index values, instead of the
aggregation of sub‐index values of components (Esty et al., 2005).
Figure 2.4 Stages of aggregation of an index
The two most common methods for aggregation of sub‐indices are the arithmetic and
geometric methods. The former method is widely used to aggregate sub‐indices of various
indices including the existing water sustainability indices of CWSI, WPI and WSI (Chaves &
Alipaz, 2007; Policy Research Initiative, 2007; Sullivan, 2002). This method is applied through
the summation of weighted sub‐index values (Nardo et al., 2005), as given in Eq. (2.6).
(2.7)
where I represents the aggregated index, N is the number of indicators to be aggregated, Si is
the sub‐index for indicator i and wi is the weight of indicator i.
With this method, perfect substitutability and compensability among all sub‐indices occurs
(Nardo et al., 2005). This means low values of some sub‐indices are compensated with high

Indicator‐based Sustainability Assessment 2‐21
values of other sub‐indices. Consequently, it is possible for an index to have the same
aggregated index values for different cases, even if the sub‐index values for each of these
cases differ quite considerably, but the weighted average sub‐index values of all cases are
identical. Consider the following example of an index with two indicators and different sets of
values of indicators. In the first case, the sub‐index values of the two indicators are 40 and 40
(maximum scale of 100) and in the second case, they are 10 and 70. If the arithmetic method
with equal weights is applied to aggregate the indicators, both cases will have aggregated
index values of 40. The extreme difference in sub‐index values of the two indicators (10 and
70) in the second case compensated each other to produce the average value of 40 for the
index.
The other common method used for aggregation is the geometric method. This method is used
by multiplying weighted sub‐index values, as shown in the following equation (Swamee &
Tyagi, 2000):
1
iN
i
WI iS=
=∏ (2.8)
the symbols for Eq. (2.8) are the same as for Eq. (2.7).
In contrast to the arithmetic method, the geometric method does not create perfect
substitutability and compensability among the sub‐index values of the indicators.
Consequently, two cases with a significant difference in their sub‐indices will have different
aggregated index values, even if their weighted average sub‐index values are identical. If the
above hypothetical example is used with the geometric method with equal weights, both cases
will have different aggregated index values. The aggregated index value is 40 for the first case
and 26.5 for the second case. Here, the low sub‐index value (10) of the second case is not fully
compensated by the high value of the other sub‐index (70). Rather, the difference of these two
sub‐indices is reflected in the aggregated index value.
The above hypothetical example is extended with first indicator values changing linearly from
0 – 100, while at the same time the second indicator value changing linearly from 100 – 0. The
results from the two aggregation methods are shown in Figure 2.5. Both cases use equal

Indicator‐based Sustainability Assessment 2‐22
weights for the two indicators. In the first case (the arithmetic aggregation method),
regardless of extreme differences between the two sub‐index values, the aggregated index
values remain constant. This is because the average values of the two sub‐indices are the
same. However, in the second case (the geometric aggregation method), the aggregated index
values varied according to differences between sub‐index values. A higher difference on the
sub‐index values results in lower aggregated index values.
Figure 2.5 Comparisons of arithmetic and geometric aggregation methods
If the difference of sub‐index values is important, the geometric method is more appropriate.
The geometric aggregation method takes into account the differences in the sub‐index values
when aggregating indicators, while the arithmetic aggregation method does not take these
differences into account. Using the geometric aggregation method, substitutability and
compensability among the sub‐index values do not occur. Poor indicator performances, shown
by the low sub‐index values, will be reflected in the aggregated index value. In contrast, when
the arithmetic aggregation method is used, poor indicator performances will not be reflected
in the aggregated index value if other indicators perform well.
Note that in Eq. (2.7) and Eq. (2.8), the aggregated index is obtained from the indicators.
However, the same form of equation(s) can be used at different levels of aggregation.

Indicator‐based Sustainability Assessment 2‐23
2.4.5 Robustness analysis
The robustness analysis of the index is concerned with the ability of the index to be applied
under different circumstances, such as different locations, sets of indicators, and methods
involved in calculating the final index. The robustness analysis is useful to provide a better
understanding to relevant stakeholders, particularly users of the index, on the limitations of
the index. The robustness analysis is commonly carried out by undertaking uncertainty and
sensitivity analysis on the index.
Uncertainty analysis deals with uncertainties, related to the index development, affecting the
final index value. Uncertainty analysis aims at identifying input variables that are varied, and
potentially lead to error or uncertainty in the outputs (Esty et al., 2005; Nardo et al., 2005). It
attempts to analyse the effects of uncertainties in the input on the output values (Saisana et
al., 2005).
Sensitivity analysis aims to assess and apportion the effects of variation in input variables on
outputs (Nardo et al., 2005; Saltelli et al., 2004). It seeks out, mostly quantitatively, which
input variation has mostly affected output variation (Esty et al., 2005; Saltelli et al., 2004). The
sensitivity analysis will provide information on how much the variation in output is influenced
by input uncertainty (Nardo et al., 2005).
The Monte Carlo technique performs both uncertainty and sensitivity analysis. It operates by
randomly considering different input variables, based on their range and appropriate
probability distribution, and simulating the corresponding output values (Clemen & Reilly,
2001). With this technique, all uncertainties in the input factors can be taken into account
simultaneously or individually (Saisana et al., 2005). The factors to improve the accuracy of
Monte includes performing more simulations and reducing uncertainty ranges in the input
variables (Clemen & Reilly, 2001).
2.5 EXISTING WATER SUSTAINABILITY INDICES
The indicator‐based sustainability assessment approach has been used in the past to develop
water sustainability indices. Widely used indices are: the Water Poverty Index (WPI) by Sullivan

Indicator‐based Sustainability Assessment 2‐24
(2002), Canadian Water Sustainability Index (CWSI) by the Policy Research Initiative (2007) and
Watershed Sustainability Index (WSI) by Chaves & Alipaz (2007). These indices have common
objectives: to provide information on current conditions of water resources, provide inputs to
decision makers and prioritise water‐related issues (Chaves & Alipaz, 2007; Lawrence et al.,
2003; Policy Research Initiative, 2007). However, these indices also have some differences. In
developing a new water sustainability index, consideration and analysis of similarities and
differences will be of utmost importance.
2.5.1 Water Poverty Index (WPI)
The Water Poverty Index (WPI) was developed to assess the link between poverty and water
availability (Sullivan, 2002). The developers of WPI believed there is a strong correlation
between water availability and poverty. The indicators of WPI were developed to assess this
correlation. The first pilot project was applied internationally in 2003, involving 147 countries
worldwide (Lawrence et al., 2003). The results from the application were compared with the
results of other indices such as the Falkenmark Water Stress Indicator and HDI.
2.5.1.1 Selection of component and indicators
The selection of components and indicators for WPI was based on the consensus of physical
and social experts, water practitioners, researchers and other stakeholders (Lawrence et al.,
2003). These experts were concerned about the relationship between water poverty and
income poverty.
Water poverty is illustrated in cases where people have access to water resources, but the
availability of water is not adequate, whereas income poverty is shown when the availability of
water is adequate but people do not have access to the water resources. Therefore, assessing
the performance of water resources cannot be achieved by ignoring socio‐economic factors
related to water resources (Lawrence et al., 2003). The final framework for WPI, resulting from
expert consensus, is shown in Table 2.1

Indicator‐based Sustainability Assessment 2‐25
Table 2.1 Indicators of Water Poverty Index
Components Indicators (Sub‐components)Resources Internal water resources
External water resourcesAccess Population with access to safe water
Population with access to sanitation Irrigated land
Capacity Gross Domestic Product (GDP)Under‐5 mortality rate
Education Gini coefficient
Use Domestic water useIndustrial water use Agricultural water use
Environment Water qualityWater stress
Regulation and management capacity Informational capacity
Biodiversity
2.5.1.2 Obtaining sub‐index values
To obtain sub‐index values of WPI indicators, the continuous rescaling technique was used in
Eq. (2.2a). As the first application of WPI assessed the performance of participating countries,
maximum and minimum values used in Eq. (2.2a) for each WPI indicator were the highest and
lowest actual values among these countries. The sub‐index values of WPI indicators ranged
from 0 – 1.
2.5.1.3 Weighting
In the original WPI framework, no specific weighting scheme was suggested. Sullivan et al.
(2006) believe that the responsibility in determining indicator weights should be given to
decision makers, not to the researchers. In using WPI, the users are allowed to define their
own weights to be assigned to WPI indicators. However, Sullivan et al. (2006) emphasised the
importance of transparent consultation with relevant stakeholders in defining weights. During
the first WPI application, equal weights among all indicators and components were applied
(Lawrence et al., 2003).

Indicator‐based Sustainability Assessment 2‐26
2.5.1.4 Aggregation
Two aggregation processes are used in WPI. The first aggregation is used to combine sub‐index
values of different indicators into components using the arithmetic aggregation method. As
the indicators are equally weighted, the index value for each component is the average of the
sub‐index values. Once these values for the five WPI components are obtained, they are
aggregated using the arithmetic method to obtain the final index value, ranging from 0 – 100
(Lawrence et al., 2003).
2.5.1.5 Final index value interpretation
In general, higher values of WPI are preferred. However, in its first application, the
performance of a country is interpreted by comparing its final WPI value, as well as the sub‐
index values of the components, with those of other countries. During the application, it was
found that most of the rich or developed countries performed better, compared to the less‐
developed countries. However, Lawrence et al. (2003) noted few anomalies, such as Guyana
which was unexpectedly ranked fifth out of the 147 participated in the pilot study, even
though this country is not one of the rich or developed countries. Guyana performed well on
Resource, Access and Use components.
To better interpret these results, the correlation of final WPI values and the values of other
existing indices such as the Falkenmark Water Stress Indicator and Human Development Index
(HDI) in different countries was analysed. The analysis showed moderate to strong positive
correlation between WPI and HDI (correlation coefficient = 0.81), explained by the fact that
some of WPI indicators were taken from HDI components and/or indicators. The correlation
coefficient of WPI and the Falkenmark Water Stress Indicator is 0.35, which indicates low to
moderate correlation (Lawrence et al., 2003). The correlation coefficients of the
abovementioned indices, based on their applications in 2003, are shown in Table 2.2.
Table 2.2 Correlation coefficients of WPI, Falkenmark Water Stress Indicator and HDI
WPI Falkenmark Water Stress Indicator
HDI
WPI 1 0.35 0.81 Falkenmark Water Stress Indicator 0.35 1 0.11 HDI 0.81 0.11 1
Indicator‐based Sustainability Assessment 2‐27
2.5.2 Canadian Water Sustainability Index (CWSI)
The application of WPI in 2003 on an international scale, involving most countries in the world,
has inspired the Policy Research Initiative (PRI) to develop the CWSI. In the application of WPI
in 2003, Canada was ranked second (of 147 participating countries). Even though the
performances of Canadian water resources were considered excellent at that time, PRI
believes that Canada still has water resource issues, particularly among its rural communities.
It was believed that the benefits from these water resources, received by local communities,
were compromised.
The CWSI was developed to specifically point out these disparities. Similar to WPI, the
development of the CWSI framework seeks to integrate physical, environmental and socio‐
economic aspects of water resources in Canada. The application of CWSI in various Canadian
communities is expected to identify important water issues and prioritise water‐related issues,
to communicate the conditions of Canadian water resources to the wider public, and to raise
awareness of the Canadian stakeholders about water resources at the community level.
2.5.2.1 Selection of components and indicators
The selection of components and indicators for CWSI was based on the literature review on
water resource management and existing indicators of the Water Poverty Index (WPI). In the
preliminary document of CWSI (Policy Research Initiative, 2007), indicators of WPI were
modified to suit Canadian water resource characteristics. The document was then brought into
a two‐day workshop and experts finalised the selection of components and indicators to be
included in the final CWSI framework, as shown in Table 2.3.
The selection criteria used by these experts include scope, scale, applicability, relevancy, data
and scoring (Policy Research Initiative, 2007). The scope criterion is concerned with the
numbers of indicators to be included under each component. The experts believed that
appropriate trade‐off was made between a ‘too narrow’ and ‘too broad’ scope of indicators for
each component. As for the scale, the concern was the difficulty in assessing the performance
of water resources purely based on one particular community or area. In many cases, water
conditions in one area are highly influenced by other areas. Therefore, in CWSI, physical
availability of water resources and ecosystem health are monitored at the river basin scale,

Indicator‐based Sustainability Assessment 2‐28
instead of the community scale. For other issues such as education, poverty and infrastructure,
they are assessed at the community scale (Policy Research Initiative, 2007).
Table 2.3 Indicators of Canadian Water Sustainability Index
Components Indicators
Resource AvailabilitySupply Demand
Ecosystem Health StressQuality Fish
Infrastructure DemandCondition Treatment
Human Health Access
Reliability Impact
Capacity FinancialEducation Training
The next four criteria, which are applicability, relevancy, data and scoring, are highly related.
They are concerned with the applicability of the index due to data availability, how the sub‐
index values of the indicators are obtained, and how meaningful these results are to the
communities they serve. If an indicator will only be meaningful to particular communities, and
much less meaningful for others, this indicator is replaced with another indicator (Policy
Research Initiative, 2007).
2.5.2.2 Obtaining sub‐index values
In obtaining sub‐index values, CWSI adopted the continuous rescaling technique. With this
technique, the actual values of CWSI indicators were computed to be within the range of 0 –
100 (refer to Eq. (2.2b)). To do this, maximum and minimum threshold values for each
indicator were determined, based on specific targets or benchmarks. These targets or
benchmarks were obtained from literature reviews. The maximum and minimum threshold
values of the Availability indicator, for example, were taken from the Falkenmark Water Stress
Indicator. The maximum and minimum values for this indicator were 1700 m3/cap/yr and 500
m3/cap/yr respectively (Falkenmark et al., 1989).
Indicator‐based Sustainability Assessment 2‐29
2.5.2.3 Weighting
In the CWSI, an equal weighting scheme was used to aggregate the indicators. This means each
indicator has the same weight during the aggregation process. The decision to apply the equal
weighting scheme (along with the finalisation of components and indicators) was made by
selected experts during the abovementioned two‐day workshop. However, each catchment or
community is also allowed to make changes for the weighting scheme, if justifications can be
provided.
2.5.2.4 Aggregation
To aggregate CWSI indicators, the arithmetic method was used (Eq. (2.6)). In CWSI,
aggregation occurs both at the component and indicator levels. The three indicators in each
component are aggregated to obtain the sub‐index value of the component. The five sub‐index
values of components are then aggregated to obtain the final index value. As CWSI has equal
numbers of indicators in each component and all indicators have equal weights, the final
aggregated index value is also the average of sub‐index values. The equal weights applied to all
indicators also imply that each component value is the average value of its respective indicator
values (Policy Research Initiative, 2007).
2.5.2.5 Final index value interpretation
Higher values of the final index show higher water sustainability. If a particular community or
catchment scored 100, it means this community has the perfect status of water sustainability.
Further interpretation of the final CWSI value was based on comparison of CWSI applications
among various communities. It was found that the index was more useful when applied to
communities in the same region, or communities which shared similar water resource
conditions (Policy Research Initiative, 2007). Based on these results, the communities were
able to work together to formulate relevant water policies at the regional scale.
2.5.3 Watershed Sustainability Index (WSI)
The Watershed Sustainability Index (WSI) was specifically applied at the basin level. It
attempted to integrate issues of hydrology, environment and life and policy into a single and

Indicator‐based Sustainability Assessment 2‐30
comparable number (Chaves & Alipaz, 2007). The developers of the index indicated that
previous indices on water resources had not been specifically designed for use at the basin
scale, and did not take into account the cause–effect relationship of their indicators. The
application of sustainability indices at the basin level is important as the assessment of water
resource sustainability cannot be bordered by jurisdictional frontiers (Chaves & Alipaz, 2007).
To follow up on the cause–effect relationships among indicators, the WSI has used the
Pressure‐State‐Response (PSR) model to address each of the HELP dimensions (Hydrology‐
Environment‐Life‐Policy) (Chaves & Alipaz, 2007).
2.5.3.1 Selection of components and indicators
As mentioned earlier, the indicators of WSI were selected, based on the HELP platform,
designed by UNESCO’s International Hydrologic Program (Chaves & Alipaz, 2007). For each
indicator, different parameters (or sub‐indicators) were developed using the PSR model
illustrated in Figure 2.6.
The PSR model seeks to analyse the causality of the following three issues (Smeets et al.,
1999):
- The pressures of human activities on various environmental issues
- How these pressures affect the states of the natural systems
- The responses by governments and general communities to address the environmental
changes through different policies and regulations
Using the HELP platform and the PSR model, WSI indicators and parameters were developed.
At the end of the selection process, the authors of the WSI proposed four different indicators:
Hydrology, Environment, Life and Policy. Pressures, states and responses for each of these
indicators were then identified and labeled as parameters. The Hydrology indicator comprises
pressure parameters, two state parameters and two response parameters. For the other three
indicators, each has one parameter representing pressure, state and response. In total, 15
parameters were identified. WSI indicators and parameters are shown in Table 2.4.

Indicator‐based Sustainability Assessment 2‐31
Table 2.4 Indicators of Watershed Sustainability Index
Indicator Parameter
Hydrology
Variation in basin water availability (P)Variation in basin BOD (P)
Per capita water availability (S) Basin BOD (S)
Improvement in water‐use efficiency (R) Improvement in adequate sewage treatment (R)
Environment Basin Environmental Pressure Index ‐ EPI (P)
Natural vegetation (S) Evolution in basin conservation (R)
Life Variation in income (P)
Human Development Index ‐ HDI (S) Evolution in HDI (R)
Policy Variation in HDI‐Education (P)
Institutional capacity (S) Evolution in expenditures (R)
P = Pressure, S = State, R = Response
Figure 2.6 The Pressure‐State‐Response (PSR) model (Smeets et al., 1999)
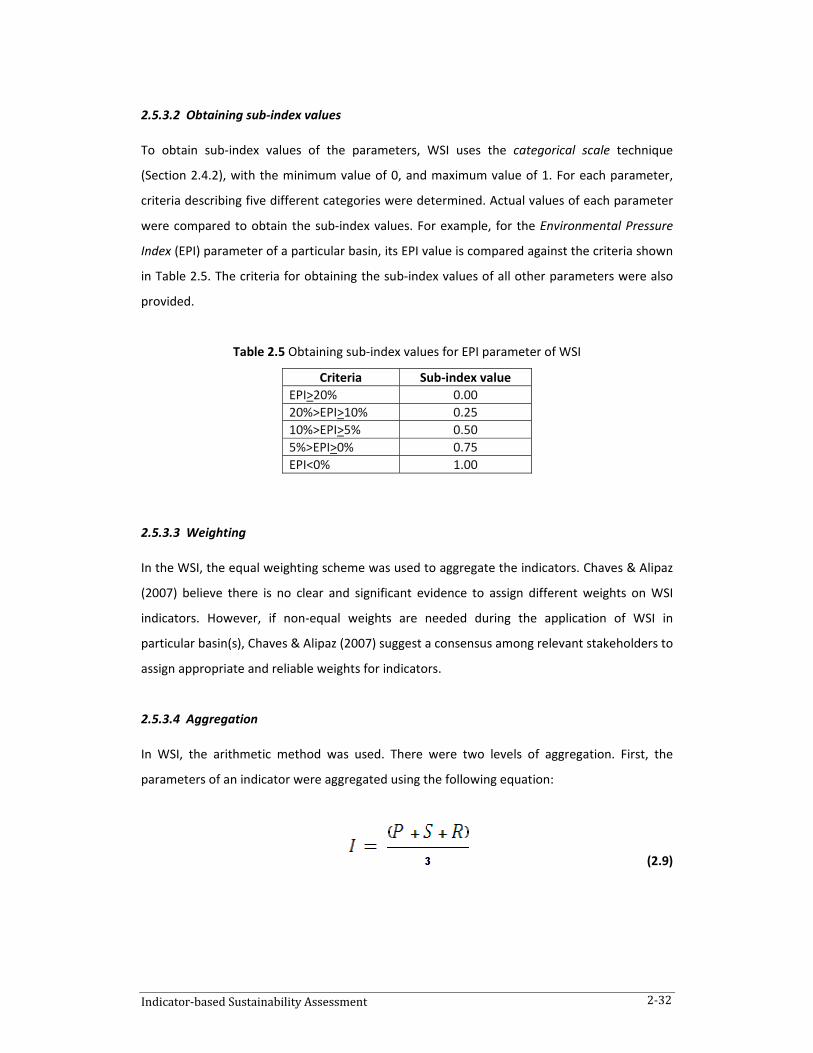
Indicator‐based Sustainability Assessment 2‐32
2.5.3.2 Obtaining sub‐index values
To obtain sub‐index values of the parameters, WSI uses the categorical scale technique
(Section 2.4.2), with the minimum value of 0, and maximum value of 1. For each parameter,
criteria describing five different categories were determined. Actual values of each parameter
were compared to obtain the sub‐index values. For example, for the Environmental Pressure
Index (EPI) parameter of a particular basin, its EPI value is compared against the criteria shown
in Table 2.5. The criteria for obtaining the sub‐index values of all other parameters were also
provided.
Table 2.5 Obtaining sub‐index values for EPI parameter of WSI
Criteria Sub‐index valueEPI>20% 0.0020%>EPI>10% 0.2510%>EPI>5% 0.505%>EPI>0% 0.75EPI<0% 1.00
2.5.3.3 Weighting
In the WSI, the equal weighting scheme was used to aggregate the indicators. Chaves & Alipaz
(2007) believe there is no clear and significant evidence to assign different weights on WSI
indicators. However, if non‐equal weights are needed during the application of WSI in
particular basin(s), Chaves & Alipaz (2007) suggest a consensus among relevant stakeholders to
assign appropriate and reliable weights for indicators.
2.5.3.4 Aggregation
In WSI, the arithmetic method was used. There were two levels of aggregation. First, the
parameters of an indicator were aggregated using the following equation:
(2.9)

Indicator‐based Sustainability Assessment 2‐33
where I is the sub‐index value of the indicator, P is the average sub‐index value for pressure
parameters, S is the average sub‐index value for state parameters and R is the average sub‐
index value for response parameters.
Once the sub‐index values for all indicators were obtained, they were aggregated using the
following equation:
(2.10)
where WSI is the final index, H is the sub‐index value for the Hydrology indicator, E is the sub‐
index value for the Environment indicator, L is the sub‐index value for the Life indicator and P is
the sub‐index value for the Policy indicator. The values of H, E, L and P are obtained from Eq.
(2.9).
2.5.3.5 Final index value interpretation
For the interpretation of the final index, WSI adopted the Human Development Index (HDI).
According to HDI interpretation, the performance of a basin is considered low if the final index
of WSI is < 0.5; intermediate if WSI is between 0.5 and 0.8; and high if WSI is > 0.8. This HDI
interpretation, adopted by WSI, was based on the 2000 HDI Report (Chaves & Alipaz, 2007).
2.5.4 Comparative analysis of water sustainability indices
In terms of their structure, all three indices comprise a set of indicators covering various water
resources aspects. WPI and CWSI indicators are grouped to form components. The WSI
indicators are known as parameters, and the components are known as indicators. Table 2.6
summarises similarities and differences of these three indices.
It is previously shown in Table 2.6 that the components and indicators of these three indices
were initially identified, based on literature reviews. For CWSI and WPI, in particular, the
literature review was followed by stakeholder consultations. The literature review in CWSI and
WPI was undertaken to produce the initial set of components and indicators. This set was then

Indicator‐based Sustainability Assessment 2‐34
brought into stakeholder consultations or expert meetings to be discussed and finalized
(Lawrence et al., 2003; Policy Research Initiative, 2007).
The selection of the method to be used in obtaining sub‐index values of indicators is
determined by the purpose for developing the index, as well as the availability of data to
obtain sub‐index values (Nardo et al., 2005). The continuous rescaling method allows any
values within the minimum and maximum values of the index (for example, values between 0 ‐
100), while the categorical scale method assigns discrete values for different categories within
the index range (Nardo et al., 2005).
Table 2.6 Comparisons of CWSI, WPI and WSI
Index Component Selection
Obtaining Sub‐index Values Method
Weighting Scheme
Aggregation Method
Final Index Value
InterpretationCWSI (Canadian Water Sustainability Index)
Literature review, then expert workshop
Continuous rescaling
Equal weights
Arithmetic 0 ‐ 100
WPI (Water Poverty Index)
Literature review, then consensus opinion of experts and other stakeholders
Continuous rescaling
Equal weights
Arithmetic 0 ‐ 100
WSI (Watershed Sustainability Index)
Literature review by authors
Categorical scaling
Equal weights
Arithmetic 0 ‐ 1< 0.5: Low 0.5 – 0.8:
Intermediate > 0.8: High
The continuous rescaling method was used in both WPI and CWSI to obtain the sub‐index
values of the indicators. Typically, the WPI and CWSI used local, regional, national or
internationally recognised policies, regulations or standards to determine maximum and
minimum threshold values, which were then used to compute sub‐index values (Nardo et al.,
2005). The categorical scale method was used by WSI to obtain sub‐index values. Criteria for
each indicator were identified to obtain sub‐index values using the categorical method. These
criteria were divided into different groups, representing the categories of the sub‐index values.

Indicator‐based Sustainability Assessment 2‐35
The interpretation of the final index value for CWSI and WPI is based on the 0 ‐ 100 range. The
final index value for these indices are preferred if it is closer to 100, and less preferred if it is
closer to 0. The interpretation of WSI value is based on the 0 ‐ 1 range, with 1 being the most
preferred and 0 the least preferred. In WSI, further interpretation was given based on the 2000
HDI Report. The performance of a basin is considered low, intermediate or high if the WSI
value is < 0.5, between 0.5 and 0.8, or > 0.8 respectively.
2.6 OTHER INDICES
The indicator‐based approach has been widely used in fields other than water resources, such
as economics or human development. The applications of indices in these fields were
considerably useful for decision makers in their respective fields. The following sub‐sections
discuss the developments and applications of two indices, namely the Human Development
Index (HDI) and Environmental Sustainability Index (ESI).
2.6.1 Human Development Index
The Human Development Index (HDI) was proposed by the Pakistani economist, Mahbub ul
Haq (Haq, 1989) and was published by the United Nations Development Program ‐ UNDP
(Rodríguez, 2010) in 1990. Since then, its applications have been widely used to assess
performances of various countries in three areas: health, knowledge and income (Rodríguez,
2010). These areas are known as dimensions, which are similar to components in other indices.
The index was proposed as the alternative to previous human development measurements,
which focused solely on economic issues (Haq, 1989). Haq argued that human development
cannot be assessed solely on economic growth, but other areas, such as knowledge and
health, should be considered (Haq, 1989). The following sub‐sections discuss some HDI issues,
which include the selection of dimensions and indicators, obtaining sub‐index values,
weighting and aggregation methods of HDI dimensions and indicators, and the interpretation
of final HDI values.
2.6.1.1 Selection of dimensions and indicators
Originally, the selection of dimensions and indicators of HDI, including threshold values to
assess the indicators, was published by the index founder (Haq, 1989). When this paper was
published, it received enormous response from various stakeholders, including public officials,

Indicator‐based Sustainability Assessment 2‐36
policy makers, media and others (Rodríguez, 2010). Compared to the Gross National Product
(GNP) measure, the stakeholders considered HDI a more comprehensive tool to measure
human development. Having global and positive attention from various stakeholders, the HDI
was then adopted by UNDP to assess the performance on human development among
countries. This assessment is updated regularly and still reported today. The dimensions,
indicators and threshold values of HDI are regularly reviewed by a panel of experts, and
necessary changes have been made during the review. The latest HDI framework of 2010 has
four indicators in its three major dimensions: health, knowledge and income. Each of the
health and income dimensions has one indicator, while knowledge has two indicators: literacy
and children in schools.
2.6.1.2 Obtaining sub‐index values
In HDI, the sub‐index values of health, knowledge and income dimensions are obtained using
the continuous rescaling method (Eq. (2.2a)). In HDI, the minimum and maximum threshold
values to be used with this method are known as target values. To obtain the sub‐index value
of the health dimension, for example, the target values used for the maximum value is a life
expectancy of 85 and the minimum value is a life expectancy of 25.
If the average life expectancy of one country is 71.4, the sub‐index value of the health
dimension is calculated as follows:
As the health dimension has only one indicator (life expectancy), the sub‐index value of this
indicator is the same as the sub‐index value of health dimension.
2.6.1.3 Weighting of dimensions and indicators
The HDI uses equal weights for all three dimensions. Under the knowledge dimension, the
literacy indicator, a higher weight (two‐thirds) is assigned than for the children in schools
indicator (one‐third), as the former indicator is deemed more important than the latter
(Rodríguez, 2010). Once the index values for all dimensions are obtained, the aggregated index
is computed with equal weights for all dimensions.

Indicator‐based Sustainability Assessment 2‐37
2.6.1.4 Aggregation of dimensions and indicators
As each of the health and income components has only one indicator, the sub‐index values of
these indicators are also considered as respective dimensions. The sub‐index values of
indicators for the knowledge dimension are aggregated using the geometric method to obtain
the sub‐index value of the knowledge dimension.
Once the sub‐index values for all three dimensions are obtained, they are aggregated to
produce the final HDI value. The sub‐index values of HDI dimensions are aggregated using the
geometric method and the equation used in the aggregation process is as follows (Rodríguez,
2010).
(2.11)
With this method, a country with considerably high and low sub‐index values for three
dimensions will have a lower HDI value, compared to another country with the same sub‐index
values for all three dimensions.
2.6.1.5 Final index value interpretation
In the 2010 HDI Report (Rodríguez, 2010), changes have been made to the interpretation of
the final HDI value. In previous HDI reports, absolute HDI values were used to interpret country
performance. In the 2010 HDI Report however, the interpretation of the final HDI values were
based on relative HDI values among participating countries. The changes of classification and
interpretation of the HDI are shown in Table 2.7.
Based on performance, it is intended that each country will develop relevant policies for
improving low performance. Different countries with similar HDI values or dimension values
can also work together in designing appropriate policy actions.

Indicator‐based Sustainability Assessment 2‐38
Table 2.7 Interpretation of final HDI values
Year Final HDI Value Performance
Pre 2010 HDI <0.5 Low
0.5 < HDI < 0.8 IntermediateHDI > 0.8 High
2010
HDI: 0‐25 percentiles LowHDI: 26‐50 percentiles MediumHDI: 51‐75 percentiles HighHDI: 76‐100 percentiles Very High
2.6.2 Environmental Sustainability Index
The Environmental Sustainability Index (ESI) was developed to measure the overall
environmental sustainability achievement of countries worldwide (Esty et al., 2005). Since its
first application in 2001, the ESI has been regularly applied until now. Even though the index
was previously used to compare environmental sustainability performances of countries
worldwide, it is emphasized that the rankings are not the main concern. Rather, the
information on the underlying indicators and variables (or sub‐indicators), and how the
information is used to formulate relevant policies, are the most essential (Esty et al., 2005).
The ESI aims at providing a logical, systematic and empirical framework to assess
environmental sustainability performance within and among countries. It also attempts to
identify which environmental issues need higher priority. In many countries, the index is used
as a starting point for addressing environmental‐related issues. In Indonesia, for example,
along with the Millennium Development Goals, the Ministry of Environmental Affairs of the
Republic of Indonesia has used the ESI to create and develop relevant programs for improving
environmental conditions in Indonesia (Sinta, 2011).
2.6.2.1 Selection of indicators and variables
The ESI comprises 21 indicators, with each indicator having 2 to 13 variables. In total, there are
76 variables used in the ESI. The 21 indicators are classified in 5 environmental themes, namely
(1) Environmental Systems, (2) Reducing Environmental Stresses, (3) Reducing Human

Indicator‐based Sustainability Assessment 2‐39
Figure 2.7 The DPSIR model (Smeets et al., 1999)
Vulnerability to Environmental Stresses, (4) Societal and Institutional Capacity to Respond to
Environmental Challenges, and (5) Global Stewardship.
The indicators and variables of ESI were selected by experts and based on existing analytical
frameworks. As the index was meant to be applied globally, availability of data sources across
these countries was considered during the selection of ESI indicators and variables. The
indicators and variables of ESI were selected using the improved PSR method known as Driving
force Pressure State Impact Response (DPSIR). This method is illustrated in Figure 2.7.
The DPSIR, while maintaining PSR components, also includes driving forces and impact.
Indicators derived from driving forces are related to the development on social, economic and
population sectors. The population growth is an example of indicators derived from driving
forces. These driving forces lead to the increase of pressures on the natural resources. These
pressures are indicated by the use of resources, as well as the increase of pollutants. Thus, the
use of resources and pollutants are examples of indicators from pressures.
Then, as pressure increases, the state of natural resources will be affected. Figure 2.7 provides
quality as an example of indicator changes in the state. When the natural resources are

Indicator‐based Sustainability Assessment 2‐40
affected, human health and other functions of the environment may be impacted, explained
by indicators such as human health and ecosystem degradation.
Further, to address these impacts, society needs to respond to these situations. Examples of
indicators as the response of society are policies and regulations for preventing, reducing and
(if possible) eliminating the negative impacts. As illustrated in Figure 2.7, these responses
might be directed to address driving forces, pressures, state or impacts separately, or in the
combination of DPSIR components (Smeets et al., 1999).
2.6.2.2 Obtaining sub‐index values
The sub‐index values of ESI are obtained using the continuous rescaling method (Eq. (2.2b)).
The maximum and minimum threshold values used in the equation were based on the actual
values of variables of participating countries.
2.6.2.3 Weighting of variables and indicators
The analysis of the non‐equal weighting schemes during the development of the ESI has shown
that no ESI indicators or variables were significantly superior to other indicators or variables
(Esty et al., 2005). One of the non‐equal weighting schemes used in the ESI was based on
Principal Component Analysis (PCA), which showed that 76% of the data variation was
explained by six principal components of the 21 ESI indicators. To determine the weights based
on this analysis, the loading of each ESI indicator on each of the six principal components was
calculated. The analysis shows that the loading factors of all indicators are nearly equal (Esty et
al., 2005).
Another non‐equal weighting scheme used in the ESI was based on the Budget Allocation
scheme, in which experts were provided with 100 points as a ‘budget’. The experts were
requested to allocate the budget to all 21 ESI indicators, based on their importance. In the end,
it was found that the weights of the indicators differed insignificantly from the equal weighting
results (Esty et al., 2005).

Indicator‐based Sustainability Assessment 2‐41
Therefore, based on analysis of these two non‐equal weighting schemes, the ESI uses equal
weights to aggregate its indicators and variables.
2.6.2.4 Aggregation of indicators and variables
To aggregate the ESI indicators and variables, the arithmetic method was used at both levels
(Eq. (2.6)). With this method, the value of each indicator is the weighted sum of its variables
and the value of the final ESI is the weighted sum of all 21 indicators.
2.6.2.5 Robustness analysis
Robustness analysis of ESI was done by undertaking an uncertainty and sensitivity analysis of
the index, using the Monte Carlo simulation. During the Monte Carlo (MC) simulation, different
scenarios were performed, based on identified uncertainties. The scenarios performed in the
MC simulation were the combinations of the following uncertainties:
(i) Imputed missing data or non‐imputed missing data
(ii) Equal weighting scheme or expert opinion weighting scheme
(iii) Aggregation at the component level or aggregation at the indicator level
(iv) Linear (arithmetic) aggregation method or multi‐criteria aggregation method
More specifically, the uncertainty and sensitivity analysis of ESI were undertaken to answer the
following questions (Esty et al., 2005):
1. How can the ESI values in a particular year change under different scenarios?
The results of the Monte Carlo robustness analysis of ESI 2005 showed that for 90 countries (of
146 countries), the changes on their rankings under different scenarios are less than 10
positions (Esty et al., 2005). It was claimed that these results confirmed the robustness of the
index.
2. What is the most preferable scenario for each country?
The results of the simulations showed that few countries, such as Congo, the Netherlands and
Japan, improved their rankings at least 20 positions under the combinations of all scenarios.
Under a particular scenario, other countries even improved to at least 40 positions (Burkina

Indicator‐based Sustainability Assessment 2‐42
Faso and Algeria) and 50 positions (Belgium, South Korea and Guatemala). The change of
rankings for Burkina Faso and Guatemala occurred when the dataset imputation changed. As
for Algeria, Belgium and South Korea, their rankings changed when different aggregation
methods were applied.
3. Which countries are vulnerable to changes in uncertainties?
The final ESI values of 15 participating countries were the most vulnerable to identified
uncertainties. For these countries, their initial rankings were between 13 and 39. When the
different scenarios performed, their rankings changed between 50‐80 positions. In particular,
changes on the rankings of these countries occurred when the imputation datasets was
changed, due to the large problem of missing data for these countries. For other countries, as
indicated earlier, the changes are less than 10 positions.
4. Which of the uncertainty factors affect the countries’ rankings at the most?
Finally, the robustness analysis of ESI also indicated which of the uncertainty factors that have
mostly affected the rankings of the countries. The uncertainty on the imputation of missing
data was found to have an average impact of 10 positions, while the weighting schemes have
an impact of 5 positions. For the other two uncertainties, which are the aggregation level and
aggregation method, both have an average impact of 8 positions. Based on these average
position changes, the imputation of missing data is considered as the factor that has the
largest effect on overall rankings of the countries (Esty et al., 2005).
2.6.2.6 Final index value interpretation
The interpretation of the final ESI value was not purely based on its absolute value. The
absolute value of ESI is preferred if it is closer to 100, and less preferred if it is closer to 0.
Further interpretation is undertaken by comparing the results of one country with other
countries. One of the comparisons were based on the cluster analysis (Esty et al., 2005) of sub‐
index values of ESI themes. In the cluster analysis, countries with similar sub‐index values of
themes are grouped together. There were seven clusters or groups identified, as shown in
Table 2.8.

Indicator‐based Sustainability Assessment 2‐43
2.7 SUMMARY
The use of indicators to measure sustainability has been growing rapidly in the last decade.
The applications of different sustainability indices in different fields have had great benefits for
environmental decision makers around the world. One of the major benefits of sustainability
index applications is related to their capability to signal sustainability performance in a
particular area to decision makers.
In this chapter definitions of sustainable development and principles of sustainability were
presented. These definitions and principles have provided guidance on how to perceive
sustainability. Various definitions of sustainable development presented in this chapter have
common messages. The key message was the concern on the quality of natural resources now,
so that they can be utilised by future generations. Based on these definitions, various sets of
sustainability principles were identified.

Indicator‐based Sustainability Assessment 2‐44
Table 2.8 Cluster analysis based on values of ESI themes (Esty et al., 2005)
Cluster 1 Cluster 2 Cluster 3 Cluster 4 Cluster 5 Cluster 6 Cluster 7Low System& Stress scores;
low Vulnerability & high Capacity;
moderate Stewardship
Moderate System&Stress scores; high Vulnerability & low Capacity; above average Stewardship
Above averageSystem score;
low Vulnerability; high Capacity;
moderate Stress& Stewardship
Moderate System,Stress, &Capacity
scores; low Vulnerability& Stewardship
Above averageSystem score,
moderate Stress, Vulnerability, Capacity, & Stewardship
ModerateSystem, Stress, &Vulnerability scores; low Capacity& Stewardship
Low Systemscore; moderate
Stress, Vulnerability, Capacity, & Stewardship
Austria Belgium Denmark France Germany Ireland Israel Italy Japan
Netherlands Portugal Slovenia
South Korea Spain
Switzerland Taiwan
United Kingdom
Angola Benin Bhutan
Burkina Faso Burundi Cambodia Cameroon
Central Africa Chad Congo
Cote de Ivoire Dem. Republic of Congo
Ethiopia Gambia Ghana Guinea Haiti Mali
Mauritania Mozambique Myanmar Nepal Nigeria
AustraliaCanada Finland Iceland
New Zealand Norway Sweden
United States
BosniaBulgaria Croatia Czech Estonia Greece Hungary Jamaica Latvia
Lebanon Lithuania Macedonia Poland Romania Serbia Slovakia
Trinidad & Tobago Turkey
ArgentinaBolivia Brazil Chile
Colombia Costa Rica Ecuador Gabon
Guatemala Guyana Honduras Namibia Nicaragua Panama Paraguay Peru
Uruguay Venezuela
AlgeriaBelarus
Azerbaijan Belarus Iraq
Kazakhstan Kuwait
Kyrgyzstan Libya
Moldova Mongolia
North Korea Oman Russia
Saudi Arabia Turkmenistan
Ukraine UAE
Uzbekistan
AlbaniaBangladesh
China Cuba
Dominican Republic Egypt
El Salvador Georgia India
Indonesia Iran
Jordan Malaysia Mexico Morocco Pakistan Philippines South Africa Sri Lanka Syria
Thailand Tunisia
Note: The ESI themes are: System, Stress, Vulnerability, Capacity and Stewardship

Indicator‐based Sustainability Assessment 2‐45
One set of sustainability principles is “the triple bottom line approach”. Other sets are
“sustainability challenges”, “capital flow concept” and “prism of sustainability”. However, they
all have common sustainability principles: environmental, economic and social. They were the
basis for the identification of sustainability indicators. In this study, as the indicator‐based
sustainability assessment will be applied in the field of water resources, definitions, criteria
and guidelines for sustainable water resource management were also discussed. Later, these
sustainability principles and sustainable water resource management guidelines are used as
the basis for identifying a water sustainability index.
Further, to properly understand the use of the indicators for measuring sustainability, it is
important to study the elements of the indicator‐based sustainability assessment tools. In
general, these elements include the selection of components and indicators, the method to
obtain sub‐index values, the method for weighting and aggregation of components and
indicators, the interpretation of the aggregated index value, and robustness analysis of the
index to better understand the uncertainty and sensitivity factors of the index. Each of these
elements was discussed in this chapter to assist the development of the water sustainability
index.
The discussion on the selection of components and indicators provided key characteristics for
good indicators. The presentation of available methods to obtain sub‐index values of indicators
offered information on the suitability of each method for obtaining different indicators. The
equations for each of these methods, presented in this chapter, have indicated the
requirement of data for using these methods. Such information was useful in developing a new
water sustainability index.
Similar to the previous elements, discussion on different methods available for other elements
of indicator‐based sustainability assessment (weighting, aggregation and interpretation of the
final index) has also provided insights to index developers on available methods. In addition,
discussions on methods for each element provided information on their advantages and
disadvantages.
Following detailed discussion of each of these elements of indicator‐based sustainability
assessment, this chapter also explored how these elements shaped the existing water

Indicator‐based Sustainability Assessment 2‐46
sustainability indices, as well as two other indices. Three existing water sustainability indices
outlined were: the Water Poverty Index (WPI), Canadian Water Sustainability Index (CWSI) and
Watershed Sustainability Index (WSI). The other two indices mentioned were the Human
Development Index (HDI) and Environmental Sustainability Index (ESI). Methods that were
used in each element of the existing indices were carefully analysed and considered for the
development of the Water Sustainability Index for West Java, which will be discussed in
Chapter 3.

Development of West Java Water Sustainability Index 3-1
Chapter 3
Development of West Java Water Sustainability Index
3.1 INTRODUCTION
In assessing water resource management for West Java in Indonesia, the development of a
water sustainability index is critical. As the index will be applied to many different catchments
in West Java, it needs to represent the general characteristics of water resource conditions. To
ensure the acceptability of the index among West Java water‐related stakeholders, it also
needs to accommodate the views of all stakeholders. The inclusion of relevant and important
water issues in the water sustainability index, coupled with stakeholders’ views, will provide a
strong basis for the application of the index to different catchments in West Java.
The main parts of the West Java Water Sustainability Index (WJWSI) include the conceptual
framework, the final framework, weights of indicators and sub‐indicators, and index
interpretation. These parts are discussed in this chapter. The conceptual framework of WJWSI
was developed through an extensive literature review on available sustainability criteria, water
resource guidelines and existing water sustainability indices, as previously mentioned, namely
the Water Poverty Index (WPI), Canadian Water Sustainability Index (CWSI) and Watershed
Sustainability Index (WSI). Once the conceptual framework was developed, it was refined
through the application of the Delphi technique and an in‐depth interview with key
stakeholders. The application of the Delphi technique ensured that the views of relevant
water‐related stakeholders in West Java were included.
To accommodate the overall tasks in the development of the index, this chapter consists of
four main sections. The first two sections discuss the development of the conceptual
framework and the refinement of the framework through the application of the Delphi
technique, followed by analysis on in‐depth interviews. The third section describes weighting

Development of West Java Water Sustainability Index 3-2
schemes developed for WJWSI components, indicators and sub‐indicators, and their
aggregations. The classification of the index value, which aims to help with index
interpretation, is presented in the final section of this chapter.
Under the sub‐heading Conceptual Framework, the identification of components, indicators
and thresholds for the conceptual framework is explained. A flow chart, that describes the
processes for developing the conceptual framework, is presented to provide a clear
understanding of how the potential WJWSI components, indicators and thresholds are
adopted. At the end of this section, justification for the selection of each component, indicator
and threshold is provided.
Having discussed the development of the conceptual framework, the sub‐section Final
Framework proceeds with the refinement of the conceptual framework. Here, the application
of Delphi technique to refine the conceptual framework is elaborated, which includes the
identification of water‐related stakeholders as respondents in the Delphi process, the design of
questionnaires and method to analyse responses, and the distribution and collection of
completed questionnaires. This is followed by discussion on in‐depth interviews with key
stakeholders. There are four groups stakeholders participated in the Delphi application and the
in‐depth interview, they are: Community, University Lecturer, Environmental Consultant and
Government Official.
In the next section, two weighting schemes (equal and non‐equal) considered in the
application of WJWSI are discussed. Particularly for the non‐equal weighting scheme, the
procedure to calculate the weights of WJWSI components, indicators and sub‐indicators is
explicated. In addition to the explanation of this scheme, the analysis of different weighting
preferences by different groups of respondents is also presented. The weight preferences of
four different groups of respondents (as in the Delphi application and in‐depth interview), are
also presented.
Finally, this chapter concludes by presenting the interpretation of WJWSI index values to be
used in the index applications. The discussion on WJWSI interpretation includes a review on
existing literature of index value interpretation, with specific attention to how existing water
sustainability indices have classified their indices.

Development of West Java Water Sustainability Index 3-3
3.2 CONCEPTUAL FRAMEWORK
The WJWSI conceptual framework is essential in the overall index development. This
framework provides early and comprehensive understanding of the WJWSI to relevant and
interested stakeholders, particularly to identified Delphi respondents. The framework consists
of three main parts: components, indicators and thresholds. The indicators represent issues
that are covered in the index, which later need to be addressed through formulating policies
and designing programs. The thresholds are required to compute the value of these indicators.
Furthermore, to better address these indicators during the policy formulation, indicators with
the same theme are grouped. The group of indicators is called a component.
In the following sub‐sections, the processes to identify potential components, indicators and
thresholds, as well as justifications for their selection, are provided. To help understand the
processes better, a flow chart showing the sequence of tasks is provided, as shown in Figure
3.1.
3.2.1 Identification of Components, Indicators and Thresholds
As mentioned above, the main elements of the conceptual framework are the components,
indicators and thresholds. Therefore, the main task of developing the WJWSI conceptual
framework is their selection, relevant to West Java water resource characteristics. Generally,
the identification of potential components, indicators and thresholds is undertaken through an
extensive literature review, as was the case with the development of existing water
sustainability indices of Water Poverty Index – WPI (Sullivan & Meigh, 2007), Canadian Water
Sustainability Index – CWSI (Policy Research Initiative, 2007), and Watershed Sustainability
Index – WSI (Chaves & Alipaz, 2007).
As illustrated in Figure 3.1, the identification of WJWSI components and indicators was
initiated by reviewing (a) sustainability criteria, (b) water resource sustainability guidelines,
and (c) existing water sustainability indices of WPI, CWSI and WSI. With respect to the review
of the sustainability criteria, WJWSI attempted to address all dimensions of the “prism of
sustainability”, namely social, economic, environmental and institutional (Spangenberg, 2002),
when identifying its components and indicators.

Development of West Java Water Sustainability Index 3-4
Figure 3.1 Flowchart for identification of potential components and indicators of WJWSI
The environmental dimension of the sustainability prism (refer to section 2.2) has given insight
into the conceptual framework of WJWSI for its inclusion of the Water Resources component.
In the sustainability prism, the environmental dimension mainly deals with sustainability of
natural resources. Furthermore, the economic dimension of the prism has resulted in the
inclusion of Finance and Poverty indicators in the conceptual framework. And finally, the
Capacity and Human Health components of the conceptual framework of WJWSI, along with
their respective indicators, were inspired by the social and institutional dimensions of the
sustainability prism.
The water resource sustainability guidelines concern with water infrastructure, environmental
quality and availability, institutional and human health (Loucks & Gladwell, 1999; Mays, 2006).
The water infrastructure and institutional requirement were addressed in the conceptual
framework of WJWSI by including Water Provision as one of its components. The next
requirement, which was environmental quality and availability, was addressed by including
Water Availability, Water Quality and Land Use Changes indicators in the component of Water
Resources. And finally, to account for human health in the water resource sustainability
guidelines, the conceptual framework of WJWSI has included a component called Human
Health.

Development of West Java Water Sustainability Index 3-5
From these reviews on sustainability principles and water resource sustainability guidelines,
four components (i.e. Water Resources, Water Provision, Capacity and Human Health) and five
indicators (Finance, Poverty, Water Availability, Water Quality and Land Use Changes) of the
conceptual framework were identified. For further identification, the indicators of the three
existing water sustainability indices (i.e. WPI, CWSI and WSI) were reviewed. The components
and indicators of these indices are presented in Table 3.1.
Table 3.1 Components and indicators of existing water sustainability indices
WPI CWSI WSI COMPONENT INDICATOR COMPONENT INDICATOR COMPONENT INDICATOR
Resources
Internal flows
Resource
Availability
Hydrology
Water Availability
External flows
Supply BOD
Population Demand
Access
Clean water
Ecosystem Health
Stress
Environment
EPI
Sanitation Quality Vegetation
Irrigation Fish Conservation
Capacity
Income Infrastructure
Demand Life Income Mortality Condition
Education Treatment Income
distribution
Human Health
Access
Policy
Education
Use Domestic Reliability
Institutional Capacity
Industry & Agriculture
Impact IWRM
Expenditure
Environment
Water quality
Capacity
Financial
Pollution
Education
Training
Regulation Information Biodiversity
These indicators in Table 3.1 were grouped under the components of the conceptual
framework of WJWSI to form potential indicators of the conceptual framework, as shown in
the second column in Table 3.2. The relevancy of these indicators to water resources,
environmental, social and economic characteristics of West Java, and the availability of data
for use in the index applications were then considered. If the indicators were not relevant to

Development of West Java Water Sustainability Index 3-6
West Java, they were excluded from the third column. Data and information for the remaining
indicators (which were not excluded) were also analysed. If sufficient data and information
were not available to measure a particular indicator, it was excluded from the list. The results
of this step are shown in the fourth column of Table 3.2. Finally, similar indicators are
combined into single indicators for the conceptual framework of WJWSI, as shown in the fifth
column.
Table 3.2 Regrouping of indicators of existing water sustainability indices
COMPONENT POTENTIAL INDICATORS RELEVANCY TO WEST JAVA
DATA AVAILABILITY
WJWSI INDICATORS
Water Resources
Internal flows External flows Availability Supply
Availability Population
Internal flowsExternal flows Availability Supply
Availability Population
Internal flows External flows Availability Supply
Availability Population
Water Availability
Water Demand Stress
Water Use Domestic Use
Industry & Agriculture Use Irrigation
Water DemandStress
Water Use Domestic Use Industry &
Agriculture Use Irrigation
Water DemandStress
Water Use Domestic Use Industry &
Agriculture Use Irrigation
Water Demand
Quality Fish BOD5
Quality Fish BOD5
Quality Water Quality
Basin Pressure Vegetation
Basin Pressure Vegetation
Basin Pressure Land Use Changes
Water Provision
Condition Reliability
Condition Reliability
Condition Coverage Water Loss
Finance Institutional
IWRM Expenditure Treatment
Finance Institutional Treatment
Finance Finance
Capacity
Income Mortality
Income Income Poverty
Education Training
Education Training
Education Education
Human Health
Clean water Access
Clean water Access
Clean water Access
Water Access
Sanitation Sanitation Sanitation Sanitation
Impact Impact Impact Health Impact

Development of West Java Water Sustainability Index 3-7
It is to be noted that the names of some of the WJWSI indicators in the fifth column of Table
3.2 are changed as per the terminology commonly used by water stakeholders in West Java,
although they convey the same meaning as that of the potential indicators from previous
studies. For example, the potential indicator Income in the fourth column was changed to
Poverty in the fifth column of Table 3.2.
Once the indicators for the conceptual framework of WJWSI were identified, their initial
respective thresholds were obtained through a literature review on existing policies, guidelines
and regulations, as further discussed in section 3.2.2. Table 3.3 shows the components and
indicators of the conceptual framework, as well as their thresholds. Further justifications for
their selection are discussed in section 3.2.2.
Table 3.3 Conceptual framework of the WJWSI
Component Indicator Thresholds
Unit Max Min
Water Resources
Water Availability m3/cap/yr 1700 a 500 b Water Demand % 40 b 0 a Water Quality ‐ 0 a ‐31 b Land Use Changes ‐ 1 b 0 a
Water Provision
Coverage % 80 a 0 b Water Loss % 15 b 0 a Finance ‐ 0 c 0 c
Capacity Poverty % 100 b 0 a Education % 100 a 0 b
Human Health
Water Access % 100 a 0 b Sanitation % 100 a 0 b
Health Impact (cases/1000 people) 100 b 0 a
a: preferable; b: not preferable and c: > 0 preferable, < 0 not preferable
The maximum and minimum values of thresholds are the highest and lowest possible values
for the indicator, respectively. The preferable values reflect the ideal conditions to be achieved
for each indicator. On the other hand, the not preferable values reflect the worst condition
possible for each indicator.

Development of West Java Water Sustainability Index 3-8
3.2.2 Justification for the Selection of Components, Indicators and Thresholds
The following sub‐sections discuss how components, indicators and thresholds of the
conceptual framework of WJWSI were selected. In particular, each sub‐section attempts to
justify the selection of one component of the conceptual framework, as well as its respective
indicators and thresholds.
3.2.2.1 Justification for the Component Water Resources and its Indicators and Thresholds
The Water Resources component was selected, based on the ultimate goal of sustainable
water management: to have healthy water resources that can be utilised by present and future
generations. In recent years, most areas in the West Java Province faced water‐resource‐
related problems, such as inadequate water supply from public water companies, and extreme
water conditions during dry and rainy seasons. In addition, as shown in Table 3.1, each of the
existing water sustainability indices has included the water resource component in its index (in
WSI the component is Environment), which shows the importance of this component in a
water sustainability index. Therefore, the inclusion of Water Resources for WJWSI was
inevitable. The justification for each indicator included in this component is discussed below.
(a) Water Availability
In the existing water sustainability indices, this indicator was included in various forms. In WPI,
for example, the Water Availability indicator was represented by the indicators of internal
flows and external flows. The former were concerned with water resources generated
internally in a country and the latter were concerned with water resources generated in other
countries (Lawrence et al., 2003). Together, these flows represented the availability of water
resources for WPI. If the index is applied at the catchment level, the internal flows are related
to water resources generated in the catchment, while the external flows represented water
resources generated in other catchments.
This indicator is a valuable entry point to any policy for improving the management of water
resources. An area with adequate water availability needs to manage the resources so they
can be used to fulfill water demand. On the other hand, an area with low availability may need
to find other sources of water. Therefore, the inclusion of this indicator is extremely important
for developing a water sustainability index, including WJWSI.

Development of West Java Water Sustainability Index 3-9
The Water Availability indicator considers the amount of water available for each person per
year in a particular area. Falkenmark & Rockstrom (2004) stated that ideally a person needs as
much as 1,700 m3/year to support his or her life, with minimum usage of 500 m3/year. This
figure was based on the amount of water required to fulfill the needs for household,
agriculture, industry and energy, as well as for the environment (Falkenmark et al., 1989). This
information will also be used as thresholds of the Water Availability indicator in WJWSI.
(b) Water Demand
This indicator considers the amount of water used for different purposes compared to
renewable water available. It gives an idea of the stress on water resources caused by water
consumption by the community. High levels of stress on water resources will affect
sustainability of water resources. This indicator is necessary to assess the current situation and
take appropriate action for reducing the stress on water resources in the future.
In West Java, the increased demand on fresh water is triggered by the expansion of industries
in the province. As people migrate to West Java to meet the demand for labourers for
industries, the population in West Java is increasing. Consequently, the need for fresh water to
support various activities (such as domestic, agriculture and industry) also increases. To
analyse this issue, Water Demand was included as one of the WJWSI indicators.
For thresholds, the United Nations Commission on Sustainable Development (UNCSD)
standard (a maximum of 40% available water withdrawn) was used. Studies show that the
uptake of 40% (or above) of renewable fresh water will cause severe stress to water resources,
and values under 40% reflect less stress on water resources (Rijsberman, 2006). The 0% was
used as the minimum threshold for this indicator.
(c) Water Quality
Water Quality is an important issue when assessing the sustainability of water resources
because poor water quality cannot be used for various purposes, and can affect social, health
and economic aspects of water sustainability. According to Wangsaatmaja (2004), water
quality monitoring in three major West Java catchments (i.e. Citarum, Ciliwung and Citanduy)

Development of West Java Water Sustainability Index 3-10
in the last five years shows that average water quality in these catchments is very poor.
Samples taken from at least 10 different sections of these waterways indicate that water
quality in these catchments is below Indonesian water quality standards. Therefore, the
inclusion of the Water Quality indicator in WJWSI is essential, which is also in line with
guidelines for water resource sustainability by Mays (2006), Loucks & Gladwell (1999) and
various indicators of previous water sustainability indices (Chaves & Alipaz, 2007; Lawrence et
al., 2003; Policy Research Initiative, 2007).
In WJWSI, the Storet water quality index was used to define thresholds for the Water Quality
indicator (Cude, 2001). This water quality index has been used by West Java governments to
monitor the quality of water streams in West Java catchments in the last decade. Using the
Storet index, various physical, chemical and biological water quality parameters are assessed,
which provide a comprehensive understanding of the general surface water quality (Cude,
2001). The maximum and minimum thresholds for this indicator, as adopted from the Storet
index, are 0 and ‐31 respectively.
(d) Land Use Changes
Past studies have shown that changes in land use have a strong relationship with water quality.
Falkenmark & Rockstrom (2004) believe that land use changes contribute not only to the
amount of runoff, but also to the level of evaporation and rainfall in respective local areas. In
Indonesia, particularly in the West Java Province, studies have shown that land use regulation
is not properly implemented. For example, the area in the upper part of Bandung City,
designed as a conservation area, has been extensively built for housing and commercial
purposes.
Rahmat & Wangsaatmadjaja (2007) reported considerable land use changes in West Java,
which have resulted in lowering groundwater levels. Land use that is dominated by forestry
allows rainfall to infiltrate into the ground, which then increases groundwater levels. On the
other hand, land use that is dominated by impermeable material prevents rainfall from
infiltrating into the ground, increasing surface runoff volume. This increase will eventually lead
to more erosion and degradation of surface water quality.

Development of West Java Water Sustainability Index 3-11
Based on the above reasons, Land Use Change was included as one of WJWSI indicators. For
thresholds of this indicator, the maximum value of 1 and minimum value of 0 are used. The
maximum value reflects maximum flow of runoff, allowing no rainfall to infiltrate (not
preferable). On the other hand, the minimum value reflects maximum infiltration of runoff
(preferable).
3.2.2.2 Justification for the Component Water Provision and its Indicators and Thresholds
Another vital component of the management of water sustainability is infrastructure. In
Indonesia, issues related to water infrastructure are best explained by the performance of
water service providers (WSPs). For every city in Indonesia, water is supplied by one public
water company. This company is responsible for treatment of water and its distribution to the
community in its respective city. The importance of water service provision in overall water
sustainability management has been emphasized by many authors {e.g. Foxon et al., (2002);
Butler et al., (2003)}, by having the water service provision as a parameter to assess the
performance of water management.
For WJSWI, three indicators of the Water Service Provision component were identified:
Coverage, Water Loss and Finance. The justification for their selection is given below.
(a) Coverage
This indicator considers the number of WSP customers compared to the total population,
which gives an indication of the coverage of company infrastructure. Low coverage has
allowed non‐WSP‐customers to ‘misuse’ water resources, due to lack of government control of
the individual use of available groundwater and surface water (Rahmat & Wangsaatmadja,
2007). In Indonesia, the WSPs cover approximately 60% of the total population in their
respective areas (Kirmanto, 2007). As far as West Java is concerned, on average, water
companies currently supply only about 40% of the total water needs of the West Java
population (Syarief, 2008). This means that a large percentage of the population have to find
alternative water supply. The analysis on the coverage issue will make a significant
contribution to overall water resource management in the catchments. Therefore, Coverage
was included as one of the WJWSI indicators.

Development of West Java Water Sustainability Index 3-12
As indicated earlier, the average coverage of water companies in West Java is only 40%. Ideally,
as stated in the national regulation on water provision development, WSPs are expected to
supply fresh water to at least 80% of the total population in their respective areas (Kirmanto,
2007). In WJWSI, 80% coverage will be used as the maximum threshold, with a minimum
threshold of 0%.
(b) Water Loss
Loss of water, both in production and distribution, is considered waste. The importance of
using available water resources wisely, especially by reducing water loss, has been emphasised
in many studies (e.g. Loucks & Gladwell, 1999; Butler et al., 2003) . Falkenmark & Rockstrom
(2004) emphasise that water scarcity in many places throughout the world can be overcome
by reducing water loss. Therefore, it is important to include Water Loss as one of the WJWSI
indicators.
The Association of Water Service Providers in Indonesia has noted that the average loss in
WSPs in West Java is 50‐60% during the period of 2006–2008. This value is very high,
compared to the maximum loss recommended by government. The national government of
Indonesia has set a maximum water loss target of 15% for every WSP. Based on this
percentage, maximum and minimum thresholds for Water Loss in WJWSI are set to 15% and
0% respectively.
(c) Finance
This indicator concerns the profitability of WSP. It considers the difference between company
earnings and water production costs. Ideally, to maintain the sustainability of the water
company, production expenses at least need to be covered by the water tariff. This indicator
was included because many water companies in Indonesia have expressed water tariff
dissatisfaction. They argued that the current water tariff is too low to cover production cost
(Kirmanto, 2007). Failure to include willingness on the part of society to pay will surely affect
the sustainability of water resources management. Therefore, this indicator was selected as
one of the WJWSI indicators. As thresholds, the 0 point was used. Any value above 0 for the
comparison of company earnings and production cost is considered as profit, and any value
below 0 is considered as loss.

Development of West Java Water Sustainability Index 3-13
3.2.2.3 Justification for the Component Capacity and its Indicators and Thresholds
The justification for the third component, Capacity, is based on the fact that sustainability of
water resources is not only determined by its availability, but also by the affordability of the
community and the ability to maintain water resources. There are cases where water
resources are available and reliable, but the community cannot afford the water supply service
due to low income. Other cases show that people have sufficient income, but water is not
adequately available due to poor quality (Sullivan, 2002). Therefore, it is important to analyse
issues surrounding the ability of the community to access and pay for water resources. Two
indicators were identified for the Capacity component, namely Poverty and Education.
(a) Poverty
Issues related to poverty have been strongly linked to sustainability by many authors (Antle &
Stoorvogel, 2008; Karami & Hayati, 2005; Kates & Dasgupta, 2007; Sullivan, 2002). More
specifically, Sullivan (2002) defined the relationship between poverty and sustainability. She
concluded that sustainability of water resources could be effectively achieved by reducing
poverty within the community. In Indonesia, people are considered poor if their income falls
below the poverty line. In 2008, the poverty line for West Java was Rp. 182,636.00 per
person/month (approximately AUD 20.29). BPS Team (2009) reported that as much as 13% of
the population in West Java lived below the poverty line. These people spend most of their
income on food, and thus have no allocation for accessing clean water. Their inability to afford
legal water service leads to their resorting to illegal water connections, which in turn have
caused huge water losses to the water companies. Therefore, poverty is an issue that needs to
be considered in developing the WJWSI. For initial thresholds, zero poverty was used as the
minimum value (preferable) and 100% poverty as the maximum value (not preferable).
(b) Education
Education is believed to have an important role in the sustainability of water resources.
Sullivan (2002) claims that there is a strong correlation between the level of education of a
community and the sustainability of its water resources. People with a higher education level
Development of West Java Water Sustainability Index 3-14
are believed to have a better water sustainability awareness, compared to those with a lower
education level. With regards to formal education, in 2007 only 14% of the West Java
population completed primary education (Bappeda Team, 2008). And only recently,
environmental issues were included in the curriculum of primary schools in West Java (Salim,
2011). Syarief (2008) believes that community education is one of the key factors for the
successful management of water resources in West Java. The importance of education in West
Java, particularly its role in water resource management, has led to the inclusion of Education
as one of the WJWSI indicators.
The 0% (not preferable) and 100% (preferable) of the total population who completed primary
education were used as minimum and maximum thresholds respectively for this indicator.
3.2.2.4 Justification for the Component Human Health and its Indicators and Thresholds
Human health is one of the important social principles of sustainability. Past studies have
indicated the influence of human health on the sustainability of water resources (Loucks &
Gladwell, 1999). The importance of human health in managing water resources is also
acknowledged by Loucks et al. (2000) and the Policy Research Initiative (2007), by the inclusion
of Human Health as a component of their water sustainability guideline and framework
respectively. In West Java, poor management of water resources has resulted in the decrease
in quality health in the community. Past studies show that areas with low access to clean water
suffer from a high number of water‐borne diseases (Wangsaatmaja, 2004). Three indicators
were identified under the component of Human Health, as discussed below.
(a) Access
This indicator considers how much water is accessible to the community, through the WSP,
compared to actual community need. Past studies have shown that most water companies in
Indonesia, including West Java Province, cannot cover all the needs of its total population in
service areas (Cahyono, 2007; Yuwono, 2009). Since water companies in West Java are not
able to meet the demand, some people are forced to live with inadequate water supply, while
others draw groundwater without appropriate consideration of sustainability of groundwater
sources. With regard to human health, it is also believed that communities with adequate
water supply will have better health quality compared to those with inadequate water supply.

Development of West Java Water Sustainability Index 3-15
For these reasons, Access (i.e. accessibility to water) is included as an indicator under the
component Human Health in the WJWSI. The thresholds used for this indicator are 0% (not
preferable) and 100% (preferable) for minimum and maximum values respectively.
(b) Sanitation
This indicator is concerned with the number of people who have access to basic sanitation
facilities. In Indonesia, people with no access use the river to discharge their wastewater,
which leads to the deterioration of river water quality. This is also happening in West Java, one
of the most populated provinces in Indonesia. Recent studies by the West Java Environmental
Protection Agency show that river quality in three major West Java catchments fail to meet
minimum requirements (Badan Pengendalian Lingkungan Hidup Daerah Jabar, 2008).
Therefore, the inclusion of Sanitation as an indicator of water sustainability is critical. At the
time of developing the conceptual framework of WJWSI, no specific policies and guidelines
were available to be used as thresholds for the Sanitation indicator. Therefore, 0% (not
preferable) and 100% (preferable) for minimum and maximum values were used respectively.
(c) Health Impact
This indicator considers the number of cases affected by water‐borne diseases in the
community. In the past, insufficient water supply has caused some health issues in
communities (Sullivan, 2002). In West Java, water‐borne disease cases are very common, both
in urban and sub‐urban areas. In urban areas, the diseases are mostly caused by poor quality
water consumed daily by poor people. For these people, consuming poor quality water is the
only option, as they cannot afford well‐treated water from the water company. In sub‐urban
areas, diseases are mostly caused by lack of awareness of basic health and hygiene behaviors.
As the programs on water resource sustainability rely on community health, the decrease of
human health will affect sustainability of water resources. As for thresholds of this indicator,
100 water‐borne diseases per 1000 head of population was used as the maximum threshold
(not preferable) and 0 cases per 1000 head of population as the minimum threshold
(preferable).
Development of West Java Water Sustainability Index 3-16
3.3 FINAL FRAMEWORK
The identification of components and indicators is a critical stage in developing a water
sustainability index. As the issue of water sustainability is considerably complex, and comprises
environmental, social, and economic aspects, inputs from a wide range of stakeholders are
needed. Of the many group decision methods, the Delphi method was chosen as it ensures
that inputs from a wide range of stakeholders are properly addressed.
In this section, the application of the Delphi technique is discussed, followed by in‐depth
interviews with key stakeholders, to refine the conceptual WJWSI framework in section 3.2.
The Delphi application includes the design of questionnaires, the selection of respondents, the
distribution and collection of completed questionnaires, and data analysis. The stakeholders
selected for this study were university lecturers, governmental officials, environmental
consultants and water stakeholders from community groups, who were asked to add, modify
or remove components and/or indicators provided in the questionnaires.
3.3.1 The Delphi Technique
The Delphi Technique is a method to extract opinion from identified stakeholders without
them congregating at an agreed time and place (Delbecq et al., 1975; Dunham, 1998). This
technique aims to reach consensus among the wider public or groups of people through
questionnaire distribution (Delbecq et al., 1975; Toward & Ostwald, 2002). To reach
consensus, questionnaire distribution in the Delphi technique is undertaken in multiple rounds
(Delbecq et al., 1975; Hasson et al., 2000; Hsu & Sandford, 2007; Jolson & Rossow, 1971). In
each round, opinions of respondents are sought, and their responses analysed. If consensus
has not been reached in the first round, the questions are repeated in the next round(s),
where responses from the previous round are disseminated to other respondents. In this way,
some respondents may change answers from previous round(s), which leads to consensus
being reached after a few rounds (Hasson et al., 2000; Hsu & Sandford, 2007; Raskin, 1994;
Rayens & Hahn, 2000).
In the past, the Delphi technique has been applied for indicator or parameter selection in
various fields, such as health services (Toward & Ostwald, 2002), health industries (Hudak et
al., 1993), marketing (Jolson & Rossow, 1971; Lunsford & Fussell, 1993), education (Olshfski &
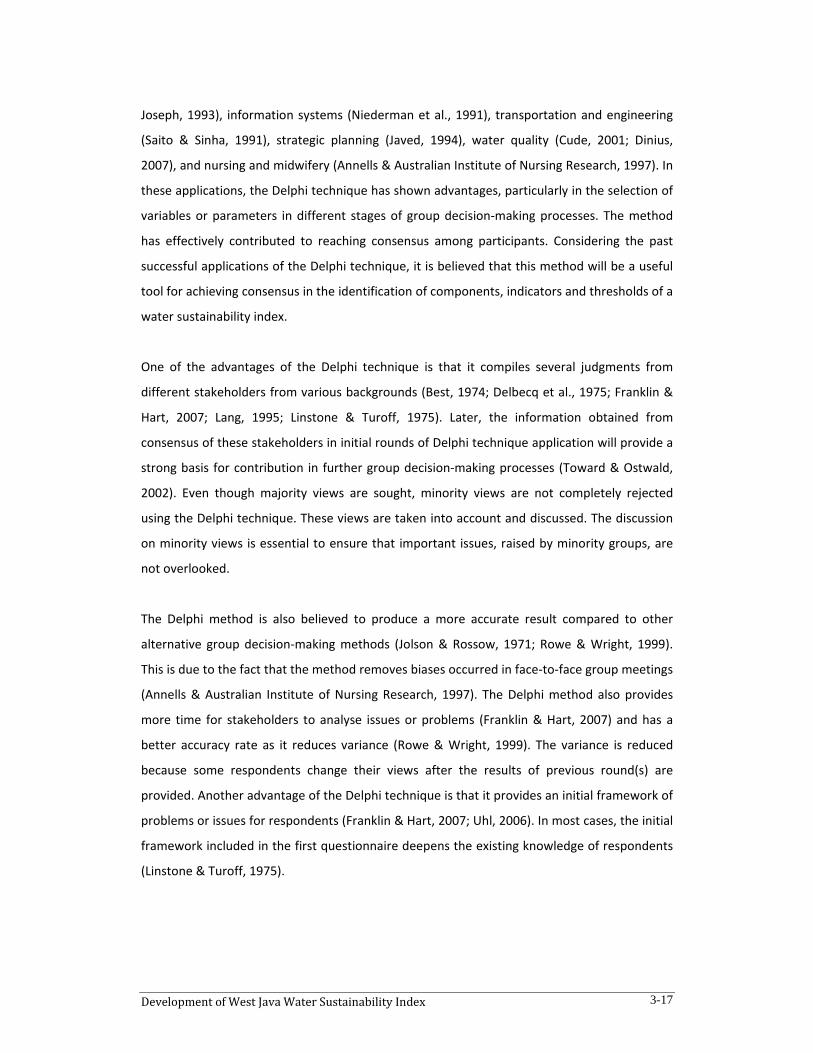
Development of West Java Water Sustainability Index 3-17
Joseph, 1993), information systems (Niederman et al., 1991), transportation and engineering
(Saito & Sinha, 1991), strategic planning (Javed, 1994), water quality (Cude, 2001; Dinius,
2007), and nursing and midwifery (Annells & Australian Institute of Nursing Research, 1997). In
these applications, the Delphi technique has shown advantages, particularly in the selection of
variables or parameters in different stages of group decision‐making processes. The method
has effectively contributed to reaching consensus among participants. Considering the past
successful applications of the Delphi technique, it is believed that this method will be a useful
tool for achieving consensus in the identification of components, indicators and thresholds of a
water sustainability index.
One of the advantages of the Delphi technique is that it compiles several judgments from
different stakeholders from various backgrounds (Best, 1974; Delbecq et al., 1975; Franklin &
Hart, 2007; Lang, 1995; Linstone & Turoff, 1975). Later, the information obtained from
consensus of these stakeholders in initial rounds of Delphi technique application will provide a
strong basis for contribution in further group decision‐making processes (Toward & Ostwald,
2002). Even though majority views are sought, minority views are not completely rejected
using the Delphi technique. These views are taken into account and discussed. The discussion
on minority views is essential to ensure that important issues, raised by minority groups, are
not overlooked.
The Delphi method is also believed to produce a more accurate result compared to other
alternative group decision‐making methods (Jolson & Rossow, 1971; Rowe & Wright, 1999).
This is due to the fact that the method removes biases occurred in face‐to‐face group meetings
(Annells & Australian Institute of Nursing Research, 1997). The Delphi method also provides
more time for stakeholders to analyse issues or problems (Franklin & Hart, 2007) and has a
better accuracy rate as it reduces variance (Rowe & Wright, 1999). The variance is reduced
because some respondents change their views after the results of previous round(s) are
provided. Another advantage of the Delphi technique is that it provides an initial framework of
problems or issues for respondents (Franklin & Hart, 2007; Uhl, 2006). In most cases, the initial
framework included in the first questionnaire deepens the existing knowledge of respondents
(Linstone & Turoff, 1975).

Development of West Java Water Sustainability Index 3-18
In spite of these advantages, the Delphi technique also has some limitations. One is that the
extreme views of respondents are potentially rejected (Bardecki, 1984). As the method seeks
consensus, the views of the majority tend to dominate extreme (minority) opinions, which
might lead to the minority view being rejected. In such cases, researchers need to be aware of
this possibility and analyse the minority view carefully, as it might conceal important insights
(Hosokawa & Zweig, 1990).
Further limitation of the method is the preparation of the initial questionnaire, which is time
consuming (Annells & Australian Institute of Nursing Research, 1997; Franklin & Hart, 2007),
the overwhelming inputs and comments from stakeholders, which might lead to an over‐
expanded research topic (Franklin & Hart, 2007), and the possibility of important
stakeholder(s) not selected as Delphi respondents (Annells & Australian Institute of Nursing
Research, 1997).
Some researchers also highlighted other limitations regarding the analysis of feedback from
the stakeholders. Moore (1987) believes that the process of refining and redeveloping further
questionnaires is controlled by previous and existing knowledge of the researchers (Annells &
Australian Institute of Nursing Research, 1997; Linstone & Simmonds, 1977). In addition, the
technique also suffers from the extended duration of questionnaire distribution, as
participants become less enthusiastic towards the end of the study (Franklin & Hart, 2007).
With a focus on the advantages, but taking into account the disadvantages, the Delphi
technique will provide valuable insights when applied to water resource sustainability. To
achieve sustainability of water resources management, the involvement of water‐related
stakeholders is essential. The Delphi technique is a tool used to involve these stakeholders.
This technique encourages various water resource stakeholders to be involved in finalizing
components, indicators and thresholds of the WJWSI. Once the consensus among stakeholders
is reached, it will provide a strong and sustainable basis to conduct further work by
stakeholders in managing water resources in West Java.
The application of the Delphi technique in this study comprises the following steps:
(i) identification of water‐related stakeholders
(ii) design of the questionnaires

Development of West Java Water Sustainability Index 3-19
(iii) distribution and collection of completed questionnaires
(iv) analysis of the results.
Each of these steps is discussed below.
3.3.2 Identification of Water‐related Stakeholders
One of the critical steps in the Delphi application is the identification of water‐related
stakeholders. In this study, these stakeholders were identified, as previously mentioned, from
four different categories in West Java: University Lecturer, Government Official, Environmental
Consultant and Community Group. These categories are considered to represent stakeholders
with strong interests in the development of a water sustainability index in West Java.
Importantly, the stakeholders were chosen from West Java as they are considered to have
extensive knowledge of issues related to water resource management in West Java, compared
to stakeholders from other areas. For Round One of the Delphi application, 40 to 50
stakeholders were targeted to represent four respondent categories.
The targeted stakeholders were contacted via email or by phone. Most expressed their
willingness to participate in this study. Finally, 43 stakeholders were confirmed to participate
in the study. The numbers of stakeholders from each category are as follows: 15 university
lecturers, 10 government officials, 10 environmental consultants and 8 community groups.
Initially, it was planned to have equal numbers of stakeholders in each category, targeted to a
minimum of 10 stakeholders for each category. However, it was difficult to find the
stakeholders from community groups, especially those with extensive knowledge of the overall
water resource issues in West Java. Thus, only 8 community group stakeholders agreed to
participate.
There are many universities in West Java with many lecturers and researchers who have
interests in water resource issues, thus more university lecturer stakeholders were included.
The relatively higher number of such stakeholders may create biases in the analysis, for
example, their opinion dominating other stakeholders’ opinions. However, this can also be an
advantage, as these university lecturers are known to have extensive knowledge on water
resource issues in West Java and have therefore been involved in various water resource

Development of West Java Water Sustainability Index 3-20
projects. It is worth mentioning that the gender composition of the stakeholders was 22
females (51.6%) and 21 males (48.4%).
3.3.3 Design of the Questionnaires
In this study, several rounds of questionnaires were planned. However, only two rounds of
questionnaire distribution were necessary, due to consensus being reached for all components
and most indicators after two rounds.
Round One
In Round One, the major part of the questionnaire was based on the conceptual framework,
which comprises potential components, indicators and thresholds of WJWSI as discussed in
Section 3.2. Through this questionnaire, respondents were asked whether they agreed or
disagreed with the components, indicators and thresholds. Also, they were allowed to add,
change and modify these components, indicators and thresholds. Along with the
questionnaires, justifications for selection of these components, indicators and thresholds
were provided to respondents.
After the questionnaire for Round One was developed, it was distributed to a few selected
respondents in Melbourne as a pilot study, to seek early inputs and comments on
questionnaire layout and clarity of questions. Since the distribution of the questionnaire was
meant to be in Indonesia, the draft questionnaire was distributed to several Indonesian
students in Melbourne, who had previous water resource related backgrounds. Based on these
comments (mainly on the clarity of the questions), some questions were revised, and the
questionnaire for Round One was finalised. The final version of the questionnaire for Round
One is provided in Appendix A.
Round Two
The questionnaire for Round Two was designed, based on the results from the previous round
(Round One). Questions in this questionnaire included suggestions that related to the
components by some respondents; indicators and thresholds not agreed on by the majority of
respondents; and new indicators and thresholds suggested by some respondents. Similar to
the questionnaire in Round One, respondents were asked whether they agreed with the above

Development of West Java Water Sustainability Index 3-21
issues. They were also allowed to add, modify and change components, indicators and
thresholds presented in the questionnaire. The questionnaire for Round Two can be found in
Appendix B.
3.3.4 Method to Analyse the Responses of the Respondents
In both rounds, Likert‐scales were used to assess the responses of the respondents on the
potential components, indicator and thresholds. A study by Matell & Jacoby (1972) on the use
of Likert‐scales show that uncertain and neutral responses were found more often in 3‐point
and 5‐point scales, and less uncertain and neutral responses were found in 7‐point and above
scales. Recent studies also show that 7‐point scales were used in numerous Likert applications
(Bayley et al., 2004; Brouwer et al., 2008; Frick, 1993; Hardy et al., 2004; Martens & Zywietz,
2006). Another advantage in using the 7‐point scale is that it provides more options for
respondents to assess the relative importance among all indicators, compared to 5‐point
scales. As a result, better accuracy for answers is expected. For these reasons, in this study a 7‐
point scale is used in the questionnaires.
Thus, in both rounds of the Delphi application, respondents were asked whether they agreed
with the potential components, indicators and thresholds using the 7‐point Likert‐scale.
Respondents were considered to ‘agree’ if they answered 6 or 7 on the Likert‐scale, and
‘disagree’ if they answered 1 or 2 on the Likert‐scale. An answer of 3, 4 or 5 on the Likert‐scale
is considered a neutral response. As indicated earlier, after respondents were asked whether
they agreed, they were also given the opportunity to add, modify and change components,
indicators and thresholds, if necessary.
With regards to analysis, Alexandrov et al. (1996) considered that a consensus is achieved if
more than 67% of respondents agree on the offered option. This percentage (or two‐thirds
cut‐off line) has also been used by Chang et al. (2009) and Lehmann et al. (2004). In statistical
terms, 67% is considered significant to be used as the decision threshold (Alexandrov et al.,
1996). In the Delphi application for WJWSI, 67% cut‐off was also used. In this study, it was
considered that consensus was reached if at least 67% of respondents agreed on the
‘important’ options (by selecting 6 or 7 on the Likert‐scale) for each question. If the
components, indicators and thresholds were agreed on by less than 67% of responses, they
were repeated in the following round.

Development of West Java Water Sustainability Index 3-22
3.3.5 Distribution and Collection of Completed Questionnaires
The questionnaires were distributed to selected respondents in the West Java Province. A
face‐to‐face meeting was chosen to distribute the questionnaires in Round One to provide
comprehensive details on the research topic. During these face‐to‐face meetings, respondents
were allowed to raise questions on the topic. The majority of respondents raised some
questions that led to further discussion on the water sustainability index, as well as general
water resource management in West Java. The main objective of these meetings was to
ensure that all respondents fully comprehended the questionnaire and were able to complete
the questionnaire within the agreed time limit. At the end of the meetings, respondents were
informed about the date for collection of the questionnaire. In general, respondents were
asked to complete the questionnaire within a week.
At the point of collection, the completed questionnaires were checked to see whether all
questions were answered. Respondents were also asked about the possibility of their
participation in the next round of the Delphi application. In total, two rounds of questionnaire
distribution were carried out. The results of both rounds are discussed below.
3.3.5.1 Round One of the Delphi Application
In Round One, after the distribution of questionnaires to the selected 43 respondents, 41
respondents (93.2%) returned the questionnaires. Two respondents, who did not return the
questionnaires, were both from the University Lecturer category. In general, respondents were
asked to agree on the initial set of components, indicators and thresholds; the results were
presented in Section 3.2.1 as Table 3.3. These responses for Round One are presented as
follows.
Components
The responses on component‐related questions are shown in Figure 3.2, which shows that for
Water Resources, 100% respondents agreed on the component (choosing 6 or 7 on the 7‐point
Likert‐scale), whereas for Water Service Provision, Capacity and Human Health, 68%, 68% and
72% of respondents respectively agreed. As mentioned previously, in this study, a consensus is
achieved when more than 67% of respondents agree on the option offered in the Delphi

Development of West Java Water Sustainability Index 3-23
technique. It means that for this study, all the offered components in the first‐round
questionnaire were agreed by respondents.
For the component of Water Resources, none of the respondents disagreed nor had a neutral
response. For the components of Water Service Provision, Capacity, and Human Health, 29%,
29% and 22% were neutral responses respectively. This shows that respondents valued Water
Resources more than the other components. In addition, with less percentage of ‘disagree’ and
neutral responses, the component of Human Health is valued more compared to Water Service
Provision and Capacity.
However, despite agreement on these components, few respondents suggested that
components should be modified to reflect the National Regulation No. 7/2004 on Water
Resources (Presiden Republik Indonesia, 2004). According to this Regulation, Water Resources
should be Conservation, Water Service Provision should be Water Use, and Capacity and
Figure 3.2 Percentage of responses agreed on components – Round One

Development of West Java Water Sustainability Index 3-24
Human Health components together should be Policy and Governance. This suggestion,
provided by few respondents, was included in the next round to obtain further opinions from
all respondents.
Indicators
With regard to the initially identified indicators of the WJWSI, responses are shown in Figure
3.3. More than 67% of respondents answered 6 or 7 on the 7‐point Likert‐scale for 9
indicators, namely, Water Availability, Water Demand, Water Quality, Land Use Changes,
Coverage, Water Loss, Water Access, Sanitation and Health Impact. For these indicators and as
consensus was reached, they were not brought into the next round(s) of the Delphi
application. For the other three indicators, Finance, Poverty and Education, 6 or 7 on the
Likert‐scale was chosen by 56%, 66% and 61% of respondents respectively. As the percentages
fell below 67%, these indicators were taken into Round Two of the Delphi application.
It is also important to note that ‘disagree’ percentages for all indicators are 2% or less, which
indicated the majority of the respondents preferred indicators to be included in the WJWSI
framework. However, as the ‘neutral’ responses for Finance, Poverty and Education were high,
they were brought into Round Two of the Delphi application.

Development of West Java Water Sustainability Index 3-25
Apart from the indicators in the conceptual framework, few respondents suggested new
indicators be included in the WJWSI framework. Indicators that were suggested by
respondents were Population Pressure, Information Disclosure, Governance Structure, Public
Participation and Law Enforcement. This was addressed by having these indicators in the next
round to seek further comments from respondents.
Thresholds
The conceptual framework of the WJWSI also included thresholds for their respective
indicators. Respondents were asked to assess these thresholds (both maximum and minimum
thresholds together); their responses are illustrated in Figure 3.4.
Figure 3.3 Percentage of responses agreed on indicators – Round One

Development of West Java Water Sustainability Index 3-26
Figure 3.4 shows that consensus was reached for few thresholds, considering the 67% cut‐off.
Thresholds above the 67% cut‐off are for Water Quality, Land Use Changes, Coverage,
Sanitation and Health Impact. For thresholds of these indicators, as the consensus was
reached, they were not brought into the next round of the Delphi application.
For other thresholds that have not been agreed (i.e. thresholds for Water Availability, Water
Demand, Water Loss, Finance, Poverty, Education and Access), most have ‘neutral responses’,
‘disagree’ or give ‘no answer’. Most respondents did not have alternative thresholds, and only
a few respondents provided alternative thresholds for some indicators. Compared to the
responses for components and indicators, responses on thresholds gave higher percentages on
‘disagree’, ‘neutral’ and ‘no answer’. These responses showed that respondents were less
Figure 3.4 Percentage of responses agreed on thresholds – Round One

Development of West Java Water Sustainability Index 3-27
confident to include these thresholds in the WJWSI framework. Some respondents also
suggested new thresholds for Poverty, Coverage and Water Demand indicators. Their
suggestions are presented in Table 3.4.
Table 3.4 Thresholds suggested in Round One
Indicator Thresholds
Old NewPoverty 0 a – 100% b 0% a ‐ 20% b
Coverage 0 b – 80% a 0 b – 60% a
Water Demand 0 a – 40% b 10 a – 40% b
a: preferable; b: not preferable
Conclusions on Round One
Based on the results from Round One, the conceptual framework of WJWSI was modified, as
shown in Table 3.5. This modified framework was then brought to the next round of Delphi
application. This modified framework incorporated suggestions from Round One to correspond
with three major components of water resource management, stated in the National
Regulation on Water Resources: Conservation, Water Use and Policy and Governance. Table
3.5 also includes new indicators and sub‐indicators from Round One: Population Pressure,
Information Disclosure, Governance Structure, Public Participation and Law Enforcement.
In Round One, consensus was reached on thresholds for the following indicators and sub‐
indicators: Land Use Changes, Water Quality, Coverage, Sanitation and Health Impact.
However, even though consensus was reached for the threshold of Coverage, few respondents
suggested new thresholds for this indicator. For other indicators and sub‐indicators, as shown
by the shaded areas in Table 3.5 below, their thresholds have not been agreed. The thresholds
for new indicators suggested in Round One (i.e. Population Pressure, Information Disclosure,
Governance Structure and Law Enforcement) were not available. Due to low responses in
Round One, these thresholds for new indicators were not used in Round Two, but discussed in
the in‐depth interviews instead.
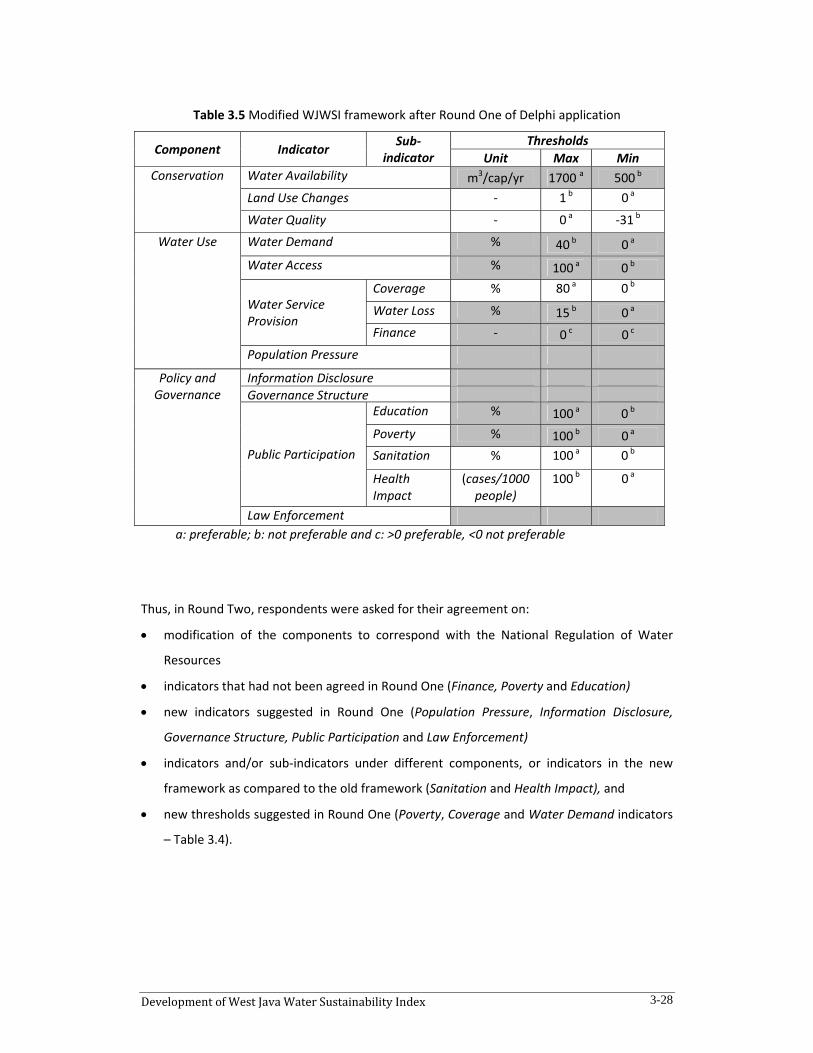
Development of West Java Water Sustainability Index 3-28
Table 3.5 Modified WJWSI framework after Round One of Delphi application
Component Indicator Sub‐indicator
Thresholds Unit Max Min
Conservation Water Availability m3/cap/yr 1700 a 500 b Land Use Changes ‐ 1 b 0 a
Water Quality ‐ 0 a ‐31 b
Water Use Water Demand % 40 b 0 a Water Access % 100 a 0 b
Water Service Provision
Coverage % 80 a 0 b
Water Loss % 15 b 0 a Finance ‐ 0 c 0 c
Population Pressure
Policy and Governance
Information Disclosure Governance Structure
Public Participation
Education % 100 a 0 b Poverty % 100 b 0 a Sanitation % 100 a 0 b
Health Impact
(cases/1000 people)
100 b 0 a
Law Enforcement a: preferable; b: not preferable and c: >0 preferable, <0 not preferable
Thus, in Round Two, respondents were asked for their agreement on:
• modification of the components to correspond with the National Regulation of Water
Resources
• indicators that had not been agreed in Round One (Finance, Poverty and Education)
• new indicators suggested in Round One (Population Pressure, Information Disclosure,
Governance Structure, Public Participation and Law Enforcement)
• indicators and/or sub‐indicators under different components, or indicators in the new
framework as compared to the old framework (Sanitation and Health Impact), and
• new thresholds suggested in Round One (Poverty, Coverage and Water Demand indicators
– Table 3.4).

Development of West Java Water Sustainability Index 3-29
3.3.5.2 Round Two of the Delphi Application
In Round Two, the questionnaire was distributed to 37 of 43 respondents in Round One, as
some withdrew after Round One due to other commitments. The numbers of respondents in
Round Two, in each category, were 13 for University Lecturer, 8 for Environmental Consultant,
10 for Government Official and 6 for Community Group.
In this round, respondents had the opportunity to review and refine their answers provided in
Round One of questionnaire distribution. As the responses of Round One were provided in the
beginning of Round Two, respondents were able to analyse the answers of other respondents
(along with their justifications) and were more confident to provide their answers in Round
Two. This process has contributed to the convergence of respondents’ answers in Round Two.
The responses in Round Two are described in the sub‐sections below.
(a) Components
As the components were modified to correspond with the National Regulation No. 7/2004 on
Water Resources, in this round respondents were asked to assess the modified components.
The responses are illustrated in Figure 3.5. This figure shows that 75% respondents agreed on
modifications to correspond with the national regulation on water resources management.
Another 16% respondents did not agree. As 67% was the cut‐off in this application, the new
set of components was used in the WJWSI.

Development of West Java Water Sustainability Index 3-30
Figure 3.5 Percentage of responses agreed on all components together – Round Two
(b) Indicators and sub‐indicators
In Round Two, respondents were asked to agree on nine indicators and sub‐indicators. These
were the indicators that less than 67% of respondents agreed in Round One, and the new
indicators or sub‐indicators suggested by respondents during Round One of the Delphi
application. These indicators and sub‐indicators as well as their responses are shown in Figure
3.6.
Figure 3.6 shows that eight of nine indicators had the response percentage of 67% or above.
Only Finance was below 67% (in the first round only Finance was agreed by 56% of
respondents). Indicators with 67% or above (i.e. Population Pressure, Information Disclosure,
Governance Structure, Education, Poverty, Sanitation, Health Impact and Law Enforcement)
were then finalised.
Figure 3.6 also shows there is no ‘disagree’ response for all indicators, including Finance.
However, as the ‘agree’ percentage for Finance is below 67%, this indicator was brought into
in‐depth interviews in Round Two (explained in Section 3.3.6) with key stakeholders for further
analysis.

Development of West Java Water Sustainability Index 3-31
(c) Thresholds
There were only three new thresholds (both maximum and minimum) suggested by
respondents in Round One: Poverty, Coverage and Water Demand. Therefore, in Round Two
only these thresholds were presented to respondents. As the respondents in Round One had
neutral responses for other thresholds (i.e. shaded areas in Table 3.5, except the above new
thresholds), they were not included in Round Two. Instead, they were brought to in‐depth
interviews with key stakeholders (Section 3.3.6).
Respondents in Round Two were requested to compare these thresholds with the old values in
Round 1. They were also asked which thresholds (new or old) were preferred. The old
thresholds (proposed in the conceptual framework for Round One) and the new thresholds
(suggested by respondents during Round One of the Delphi application) are shown in Table
3.4. Responses on these questions are shown in Figure 3.7. This figure shows that for Poverty
and Water Demand, 81% respondents (compared to 56% in Round One) and 89% respondents
(compared to 59% in Round One) preferred new thresholds respectively. For Coverage, 65%
respondents chose old thresholds. In Round One, 71% agreed with old thresholds, although
some suggested new thresholds. Based on these responses, considering the 67% cut‐off, new
Figure 3.6 Percentage of responses agreed on indicators and sub‐indicators – Round Two

Development of West Java Water Sustainability Index 3-32
thresholds for Poverty and Water Demand were used in WJWSI, and the old thresholds for
Coverage were used.
Conclusions on Round Two
Based on the results of Round Two, further modifications were made to the WJWSI
components, indicators and thresholds, as shown in Table 3.6. This table includes components,
indicators and sub‐indicators, and thresholds which have been agreed based on the two
rounds of the Delphi application.
Thresholds which have not been agreed to are presented in the shaded area in Table 3.6. They
are Water Availability, Water Access, Water Loss, Population Pressure, Information Disclosure,
Governance Structure, Education and Law Enforcement. These thresholds were brought to the
in‐depth interviews with the key stakeholders (Section 3.3.6).
Figure 3.7 Percentage of responses agreed on thresholds – Round Two
Development of West Java Water Sustainability Index 3-33
Table 3.6 Framework of WJWSI as agreed after Delphi application Round Two
Component Indicator Sub‐indicator Thresholds Unit Max Min
Conservation Water Availability m3/cap/yr 1700 a 500 b Land Use Changes ‐ 1 b 0 a
Water Quality ‐ 0 a ‐31 b
Water Use Water Demand % 40 b 10 a
Water Access % 100 a 0 b Water Service Provision
Coverage % 80 a 0 b
Water Loss % 15 b 0 a Population Pressure Not discussed in Round Two
Policy and Governance
Information Disclosure Not discussed in Round Two Governance Structure Not discussed in Round Two Public Participation Education % 100 a 0 b
Poverty % 20 b 0 a
Sanitation % 100 a 0 b
Health Impact
(cases/1000 people)
100 b 0 a
Law Enforcement Not discussed in Round Two
a: preferable; b: not preferable
To finalise the framework after two rounds of the Delphi application, in‐depth interviews were
conducted. This was an effective way to finalise the framework, as the results from two
rounds were already converged to a greater level. The time spent in conducting in‐depth
interviews was believed to be less than the time spent in more round(s) of questionnaire
distribution.
3.3.6 In‐Depth Interview with Key stakeholders
A limitation of the Delphi technique is its time‐consuming nature, particularly with a large
number of rounds (Annells & Australian Institute of Nursing Research, 1997). Some other
researchers also found that the accuracy of the Delphi technique diminishes after the
completion of a few early rounds (Boje & Murnighan, 1982), as the willingness and motivation
of some respondents have declined (Franklin & Hart, 2007).

Development of West Java Water Sustainability Index 3-34
Therefore, for this study, as consensus has been reached for all components, and most
indicators and sub‐indicators after the completion of Delphi Round Two, in‐depth interviews
with a few key stakeholders were conducted to finalise the framework. These interviews were
meant to increase the effectiveness for reaching consensus (of other remaining indicators and
thresholds which have not been agreed in the two rounds of Delphi application), as well as
motivate participants.
Criteria for the selection of key stakeholders for in‐depth interviews includes their
understanding and advance expertise on water resource issues; their interest and motivation
in the study; their influence in the decision‐making process related to water resources in West
Java; and recommendations from other respondents. Prior to interview, representations from
each respondent group participating in the Delphi application were identified. During the
selection process, no one from the Environmental Consultant group was available for the
interview. Then, for this study, four key stakeholders were chosen representing three
respondent groups: University Lecturer (two stakeholders), Community Group (one
stakeholder) and Government Official (one stakeholder).
The two university lecturers were senior lecturers in reputable universities in Bandung, with
extensive research on water resources. They have also been involved in policy formulation on
water resources in West Java in the last decade. The representative for the Community Group
has been actively writing on water resource issues, and these articles published in different
newspapers and magazines. The representative for the Government Official is influential in
formulating water‐related policies in West Java.
Due to their tight schedules, it was not possible to arrange a specific time and place to meet.
Therefore, interviews were conducted separately. In interview, key stakeholders were asked
their opinion on the results of the Delphi application, and invited to make further comments to
refine the WJWSI framework. The questions focused on components, indicators and
thresholds. The questions to guide the interview are provided in Appendix C.
All key stakeholders considered consensus had been reached for the WJWSI components,
based on two rounds of the Delphi application. The agreed components were Conservation,

Development of West Java Water Sustainability Index 3-35
Water Use, and Policy and Governance. With regard to indicators and sub‐indicators, key
stakeholders concluded that indicators and sub‐indicators were not important. The main
aspect was the inclusion or exclusion of these indicators and sub‐indicators in the framework.
This finding was also supported by the results of the Delphi application, which showed no
comments given by the Delphi respondents when some indicators in Round One were changed
in Round Two.
In‐depth interviews also concluded that Access and Coverage, as well as Population Pressure
and Water Availability needed to be combined. Both Access and Coverage concern with the
coverage of water supply for the community. The Population Pressure concerns with the
growing population which is included in the Water Availability. Therefore, in the final
framework of the WJWSI, Access was represented by Coverage and Population Pressure was
included in Water Availability. It was decided to remove Finance from the WJWSI framework
due to low responses in Round One and Round Two of the Delphi application (56% and 64%
respectively).
The key stakeholders also expressed their concerns on the thresholds of the three indicators:
Information Disclosure, Governance Structure and Law Enforcement. They believed these
indicators have unique characteristics, in terms of data availability. The key stakeholders
suggested further literature reviews on similar cases of previous indices, such as WPI, CWSI
and WSI.
In relation to thresholds of other indicators that have not been agreed during the Delphi
application (i.e. Information Disclosure, Governance Structure and Law Enforcement), key
stakeholders highlighted the importance of carefully identifying these thresholds. They
considered that, at this stage, most of these values are not available at relevant water‐
resource institutions. Relevant agencies and institutions responsible for water resources have
not recognised the importance of these indicators, let alone their respective thresholds.
Table 3.7 illustrates the final framework of the WJWSI based on in‐depth interviews. The
thresholds, neither finalised nor available, are shown in the shaded areas. It is to be noted that
the threshold values for WJWSI (finalized as well as not finalized ones after the in‐depth
interviews) may have to be updated in the future, as and when new data or information is
available.

Development of West Java Water Sustainability Index 3-36
Table 3.7 Final framework of WJWSI after the in‐depth interview
Component Indicator Sub‐indicator
Thresholds Unit Max Min
Conservation Water Availability m3/cap/yr 1700 a 500 b Land Use Changes ‐ 1 b 0 a
Water Quality ‐ 0 a ‐31 b
Water Use Water Demand % 40 b 10 a
Water Service Provision Coverage % 80 a 0 b
Water Loss % 15 b 0 a Policy and Governance
Information Disclosure Not yet identifiedGovernance Structure Not yet identifiedPublic Participation Education % 100 a 0 b
Poverty % 20 b 0 a
Health Impact
(cases/1000 people)
100 b 0 a
Sanitation % 100 a 0 b
Law Enforcement Not yet identifieda: preferable; b: not preferable
3.4 WEIGHTING
One of the aims for developing the WJWSI is to analyse the performance of different
catchments by comparing their aggregated index values. To aggregate the indicators and sub‐
indicators of WJWSI, index developers (or users) have the option to assign equal or different
weights. During the Delphi application and interview, water‐related stakeholders in West Java
considered some WJWSI indicators and sub‐indicators to be more important than others.
Therefore, for this study, both equal and non‐equal weighting schemes were considered.
During the Delphi application and interview (as discussed in Section 3.3), water‐related
stakeholders in West Java considered the position of indicators and sub‐indicators in the
WJWSI framework unimportant. Therefore, during the weighting and aggregation, the
indicators and sub‐indicators of WJWSI are treated the same.

Development of West Java Water Sustainability Index 3-37
3.4.1 Equal Weighting
With this scheme, each indicator and sub‐indicator was assigned an equal weight during
aggregation. The weight was obtained using Eq. (3.1), as follows:
(3.1)
where Wi is the weight for indicator or sub‐indicator i and n is the total number of indicators
and sub‐indicators. Using Eq. (3.1), the weight for each WJWSI indicator and sub‐indicator was
calculated as 0.077, since n = 13.
3.4.2 Non‐equal Weighting
The non‐equal weightings for WJWSI were obtained using the Revised Simos procedure
(Figueira & Roy, 2002). This procedure has been used by various researchers to assign weights
for sets of indicators or parameters (Fontana et al., 2011; Kodikara et al., 2010; Milani et al.,
2007; Shanian et al., 2008). The main advantage is that respondents are requested to provide
their preferences on the weights of indicators or parameters in an ordinal scale. The
respondents participating in studies using this method found that providing weight preference
on an ordinal scale was easier, compared to providing weight preference using numerical
scales (Fontana et al., 2011; Kodikara et al., 2010; Milani et al., 2007; Shanian et al., 2008).
With this procedure, WJWSI indicators and sub‐indicators were assigned different weights
based on the input from water‐related stakeholders in West Java. The stakeholders who
participated in this part of the study were a subset of stakeholders who participated in the
Delphi technique application. Of 37 respondents who participated in Round Two of the Delphi
application, 33 respondents agreed to provide information to compute the weights for WJWSI
indicators and sub‐indicators. The information was obtained through a survey, as discussed in
Section 3.4.2.1. Of these 33 respondents, 31 returned the questionnaires during the survey.
The questionnaire used in the survey can be found in Appendix D.

Development of West Java Water Sustainability Index 3-38
3.4.2.1 The procedure
In the survey, each respondent was asked to assign weights on WJWSI indicators and sub‐
indicators through the following procedure:
1. Respondents were given a set of cards, with each card representing WJWSI indicators and
sub‐indicators. Even though all respondents were familiar with these indicators, they
were briefed on each indicator and sub‐indicator. Along with the oral explanation, the
respondents were also given written explanation in separate documents. These
documents included the final WJWSI framework, explanation and justification of
indicators and sub‐indicators, and an example of how the cards should be arranged to
provide information on weights (as shown in Appendix D).
2. With the given set of cards, respondents were asked to arrange the cards in order of
importance, with the indicator or sub‐indicator ranked least important or least preferred.
If respondents considered two or more indicators or sub‐indicators equally important,
their cards were grouped together.
3. When arranging the cards, respondents were allowed to place blank card(s) between
indicators and sub‐indicators to indicate smaller or greater weights. Several blanks cards
were also given to the respondents.
4. Finally, respondents were also asked: “How many times more important is the most
preferred indicator or sub‐indicator relative to the least preferred indicator or sub‐
indicator?”
3.4.2.2 Results and Calculations
An example from one respondent is shown in Figure 3.8. The respondent considered Law
Enforcement as the least preferred indicator and Governance Structure the most preferred
indicator. Other information that can be retrieved from Figure 3.8 as follows :
- Governance Structure is considered 22.5 times more important than Law Enforcement
- Indicators with equal weights: Education and Poverty, as well as Water Loss and Coverage

Development of West Java Water Sustainability Index 3-39
Figure 3.8 Response of a respondent in the Revised Simos’ procedure
Based on responses during the survey (Figure 3.8), weights for indicators and sub‐indicators
were calculated using the Revised Simos’ Procedure (Figueira & Roy, 2002). The results of the
calculation are presented in Table 3.8.
First, the Rank, (r) is defined in order of increasing importance as in Figure 3.8 and presented
as column (1) in Table 3.8, ‘z’ being the value given by respondents to the question: “How
many times more important is the most preferred indicator or sub‐indicator relative to the least
preferred indicator or sub‐indicator?” In this case z = 22.5.
Then, ‘x’ is defined as the number of gap(s) existed between two indicators and sub‐indicators
(column (4) of Table 3.8) based on number of blank cards placed after cards representing
indicators and sub‐indicators (column (3)). If no blank cards are inserted between two
indicators and/or sub‐indicators, one gap is considered between them. Similarly, if two blank
cards are inserted, three gaps are considered between the indicators or sub‐indicators. It is
also important to note that if two or more indicators or sub‐indicators are grouped together
(indicators or sub‐indicators are considered equally important), then the number of blank
Note: Law Enforcement – least preferred Governance Structure – most preferred
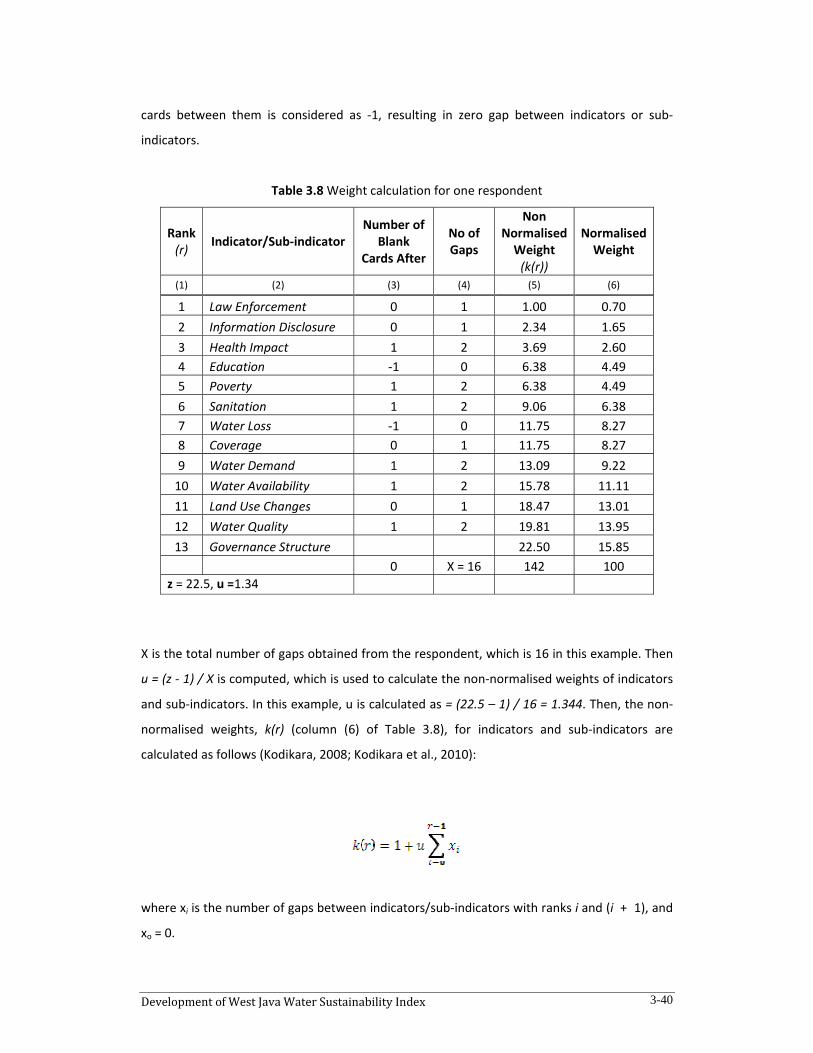
Development of West Java Water Sustainability Index 3-40
cards between them is considered as ‐1, resulting in zero gap between indicators or sub‐
indicators.
Table 3.8 Weight calculation for one respondent
Rank (r) Indicator/Sub‐indicator
Number of Blank
Cards After
No of Gaps
Non Normalised Weight (k(r))
Normalised Weight
(1) (2) (3) (4) (5) (6)
1 Law Enforcement 0 1 1.00 0.70 2 Information Disclosure 0 1 2.34 1.65 3 Health Impact 1 2 3.69 2.60 4 Education ‐1 0 6.38 4.49 5 Poverty 1 2 6.38 4.49 6 Sanitation 1 2 9.06 6.38 7 Water Loss ‐1 0 11.75 8.27 8 Coverage 0 1 11.75 8.27 9 Water Demand 1 2 13.09 9.22 10 Water Availability 1 2 15.78 11.11 11 Land Use Changes 0 1 18.47 13.01 12 Water Quality 1 2 19.81 13.95 13 Governance Structure 22.50 15.85 0 X = 16 142 100
z = 22.5, u =1.34
X is the total number of gaps obtained from the respondent, which is 16 in this example. Then
u = (z ‐ 1) / X is computed, which is used to calculate the non‐normalised weights of indicators
and sub‐indicators. In this example, u is calculated as = (22.5 – 1) / 16 = 1.344. Then, the non‐
normalised weights, k(r) (column (6) of Table 3.8), for indicators and sub‐indicators are
calculated as follows (Kodikara, 2008; Kodikara et al., 2010):
where xi is the number of gaps between indicators/sub‐indicators with ranks i and (i_+_1), and
xo = 0.
Development of West Java Water Sustainability Index 3-41
To give the sum of 100%, for weights of all indicators and sub‐indicators these non‐normalised
weights are then normalised, as shown in the last column of Table 3.8.
This procedure was repeated to calculate weights from all respondents. The summary of the
calculations of all respondents is shown in Table 3.9, with respondent 1 representing the
calculation of Table 3.8. It shows that, based on the mean value of weights given by all
respondents, Water Availability has the highest weight and Information Disclosure has the
lowest weight.
Table 3.9 also shows that there is significant difference between minimum and maximum
values of each indicator or sub‐indicator. Minimum weights range from 0.30 to 2.34, while
maximum weights range from 11.68 to 17.73. The difference between minimum and
maximum weight values given by respondents indicates significant variation in responses.
These variations are also reflected in values of coefficient variation, which range from 0.37 to
0.95 (shown in the last column of Table 3.9). The largest variation belongs to the Information
Disclosure, and the lowest variation belongs to the Water Demand. These means of the
calculated weights were then used in the aggregation of WJWSI indicators and sub‐indicators,
as well as in the robustness analysis of WJWSI. Results from the aggregation and robustness
analysis are discussed in Chapter 4.
3.4.3 Weights Given by Different Respondent Groups
As previously mentioned, four categories of respondents participated in the survey to obtain
weights for WJWSI indicators and sub‐indicators. The average weights varied. The Community
Group and University Lecturer group responses were contradictory on Water Availability,
Water Demand, Information Disclosure, Law Enforcement, Poverty and Water Quality, as
shown in Figure 3.9. The University Lecturer group assigned relatively high weights on Water
Availability, Water Demand and Water Quality, while the Community Group assigned relatively
low weights on these indicators and sub‐indicators. In contrast, the Community Group
assigned high weights on Information Disclosure, Law Enforcement and Poverty, while the
University Group assigned low weights to these indicators.

Development of West Java Water Sustainability Index 3-42
Table 3.9 Normalised weights for 13 indicators and sub‐indicators from all respondents
Indicator/Sub‐
indicator 1 2 3 4 5 6 7 8 9 10 11 12 13 14 15 16 17
1 Law Enforcement 0.70 4.65 4.42 5.52 2.74 9.04 2.19 7.06 3.51 11.41 11.98 8.85 8.64 3.70 2.70 4.09 12.99
2 Information Disclosure 1.65 5.97 0.66 2.27 4.53 2.87 0.91 1.18 1.33 1.17 5.27 2.41 1.03 1.71 4.05 4.90 1.30
3 Health Impact 2.60 6.63 6.92 14.20 8.10 5.95 12.41 8.24 10.04 4.01 6.43 9.92 2.93 10.68 8.78 12.97 5.19
4 Education 4.49 7.95 1.91 13.12 1.85 9.04 6.02 3.53 5.68 10.84 11.11 7.77 4.84 4.70 4.73 10.55 1.30
5 Poverty 4.49 3.33 5.67 6.61 0.96 3.90 6.02 2.35 6.77 11.98 10.52 4.56 3.89 7.69 9.46 11.35 5.19
6 Sanitation 6.38 2.67 9.43 8.78 7.21 3.90 9.85 8.24 8.95 6.86 9.06 8.85 5.79 11.68 10.14 10.55 2.60
7 Water Loss 8.27 9.26 9.43 4.44 9.89 6.98 7.30 9.41 7.86 9.71 8.48 3.49 7.69 6.70 7.43 12.97 10.39
8 Coverage 8.27 9.26 10.68 12.03 9.00 10.06 11.13 11.76 11.12 9.14 2.34 6.70 7.69 8.69 5.41 8.13 7.79
9 Water Demand 9.22 10.58 9.43 10.95 10.78 6.98 8.58 10.59 12.21 8.00 6.73 6.70 10.55 12.68 6.76 8.13 7.79
10 Water Availability 11.11 13.88 14.44 3.35 12.57 16.23 13.69 12.94 12.21 7.43 8.19 12.06 13.40 13.68 12.16 3.29 15.58
11 Land Use Changes 13.01 11.90 13.19 7.69 11.68 11.09 4.74 4.71 2.42 10.28 9.94 12.06 11.50 5.70 11.49 0.86 14.29
12 Water Quality 13.95 13.22 8.17 9.86 14.36 13.15 13.69 14.12 13.30 8.57 9.65 10.99 13.40 9.69 13.51 7.32 9.09
13 Governance Structure 15.85 0.69 5.67 1.18 6.32 0.81 3.47 5.88 4.59 0.60 0.30 5.63 8.64 2.71 3.38 4.90 6.49
18 19 20 21 22 23 24 25 26 27 28 29 30 31 Mean Min Max Std.
Deviation Coeff.
Variation
7.59 13.47 11.09 14.18 15.79 5.91 13.75 11.03 9.72 4.87 12.84 13.26 3.05 1.38 7.81 0.68 15.79 4.47 0.571.27 11.68 4.46 17.73 1.47 3.59 0.91 8.00 6.42 13.16 14.72 6.41 11.17 15.34 5.14 0.66 17.73 4.90 0.95
6.33 0.95 8.15 7.09 7.20 5.91 2.62 0.94 4.77 11.97 10.01 3.48 13.49 12.73 7.47 0.94 14.20 3.74 0.50
3.80 11.68 3.72 13.48 0.75 3.59 12.04 9.01 6.42 10.79 8.13 4.46 8.85 13.60 7.08 0.75 13.60 3.84 0.543.80 2.74 2.99 6.38 5.76 12.87 3.48 2.96 14.68 9.61 7.18 4.46 12.33 4.00 6.44 0.96 14.68 3.54 0.55
6.33 2.74 9.62 2.13 7.91 3.59 6.05 1.95 4.77 10.79 9.07 2.50 10.01 7.49 6.96 1.95 11.68 2.98 0.43
1.27 4.53 6.67 2.84 2.18 8.23 8.61 13.05 14.68 7.24 5.30 11.30 7.69 9.24 7.82 1.27 14.68 3.10 0.40
5.06 4.53 5.93 2.84 2.90 12.87 5.19 3.97 11.38 8.42 6.24 12.28 6.53 10.98 8.03 2.34 12.87 3.04 0.38
12.66 6.32 5.20 5.67 4.33 15.19 4.33 5.98 1.47 7.24 6.24 8.37 4.21 11.85 8.24 1.47 15.19 3.05 0.37
15.19 8.10 13.30 4.26 11.49 12.87 11.18 12.04 1.47 1.32 2.47 7.39 1.89 3.13 9.74 1.32 16.23 4.78 0.49
12.66 9.89 12.57 12.77 17.23 1.27 15.46 14.06 11.38 4.87 0.59 9.35 0.73 0.51 9.02 0.51 17.23 4.94 0.55
15.19 8.10 15.52 9.93 9.35 10.55 9.47 6.99 3.12 3.68 3.42 1.52 5.37 3.13 9.71 1.52 15.52 3.96 0.41
8.86 15.26 0.78 0.71 13.64 3.59 6.90 10.02 9.72 6.05 13.78 15.22 14.65 6.62 6.53 0.30 15.41 4.90 0.75

Development of West Java Water Sustainability Index 3-43
Figure 3.9 Weights given by different groups of respondents
Development of West Java Water Sustainability Index 3-44
The preference of the University Lecturer group on Water Availability, Water Demand and
Water Quality is likely to be driven by ‘hard’ data and facts related to these indicators. Recent
studies in West Java have shown that Water Availability, Water Demand and Water Quality
conditions are deteriorating considerably. On the other hand, the Community Group is more
interested in community or social‐related issues, such as Information Disclosure, Law
Enforcement and Poverty. Even though ‘hard’ data on these socially related issues are not
available, these issues have been constantly discussed and criticized through public media
widely.
3.5 INDEX INTERPRETATION
Index interpretation is important to understand the sub‐index and aggregated index values. In
the existing water sustainability indices (i.e. WPI and CWSI), the interpretation of these values
is based on the maximum range of both values. As both WPI and CWSI used the 0‐100 index
scale, the value of an indicator is considered preferable if it is closer to 100 and not preferable
if the value is closer to 0.
The other existing water sustainability index, the WSI, uses the Human Development Index
(HDI) with its thresholds to classify its aggregated index. The HDI, which comprises three main
components (Health, Knowledge and Income), classifies the calculated index value into three
groups. The value of HDI < 0.5 is considered to have low performance, the HDI between 0.5
and 0.8 having intermediate performance, and the HDI > 0.8 having high performance (Anand
& Sen, 1994). Thus, for WSI, once the value for an indicator is computed, it is classified, based
on the above HDI classification scheme. For example, the final WSI value for the Verdadeiro
basin, Brazil, was 0.65 (Chaves & Alipaz, 2007). According to the HDI classification, this index
value was considered to be at the intermediate performance level. Based on this classification,
further recommendations were provided to relevant decision makers to improve the
sustainability of the basin.
For the WJWSI, the interpretation for sub‐indices and their aggregated index will be based on a
quartile scale. Using this scheme, the WJWSI maximum value of 100 and minimum value of 0
are classified, as shown in Table 3.10.

Development of West Java Water Sustainability Index 3-45
Table 3.10 Interpretations of sub‐indices and aggregated Index
Aggregated index and Sub‐indices
Performance Priority of Action
0 – <25 Poor High 25 – <50 Poor – Medium High – Medium 50 – <75 Medium – Good Medium – Low 75 – 100 Good Low
This scheme provides four levels of index performance, compared to three HDI groups. This
performance classification is used as the basis for relevant priority action to improve the water
resource management at the catchment scale. In the WJWSI, Performance reflects the
condition of issue(s) related to an indicator, a sub‐indicator, or the overall water resource
condition at a particular time of assessment. The Priority of Action reflects the priority of
action(s) required to address the issue(s).
3.6 SUMMARY
The development of the West Java Water Sustainability Index (WJWSI) involved two main
stages. The first stage was the development of the conceptual framework, based on the
extensive literature review. Available sustainability criteria, water resource guidelines and
existing water sustainability indices are valuable sources of input to identify components,
indicators and thresholds as main constituents of the conceptual WJWSI framework. These
previous studies, combined with data availability and relevancy to West Java conditions, have
eventually shaped the conceptual framework. A well‐developed conceptual framework is
critically important to major initial input in the Delphi application. A sound conceptual
framework ensures that water‐related stakeholders have a comprehensive understanding of
the proposed water sustainability index.
The second stage of development was the Delphi application, which aimed at refining the
WJWSI conceptual framework. In the application of the Delphi technique, several steps were
involved. They were the identification of respondents, the design of questionnaires, the
distribution and collection of completed questionnaires, and analysis of results. In the Delphi
application for this study, two rounds of questionnaire distribution were involved.

Development of West Java Water Sustainability Index 3-46
Round One has provided valuable input and views from stakeholders on how to improve the
conceptual framework. This input was carefully analysed and included in the Round Two
questionnaire. At the end of Round One, respondents reached consensus for most of the
WJWSI components, indicators and thresholds. After Round Two, respondents reached
consensus for all components, most indicators and sub‐indicators, and some thresholds. The
remaining indicators, sub‐indicators and thresholds (that have not been agreed) were brought
into in‐depth interviews with key stakeholders. Here, all indicators and sub‐indicators were
finalised, and remaining thresholds were finalised with a further literature review on available
policies and guidelines.
In this study, a survey was conducted to obtain the weights for WJWSI indicators and sub‐
indicators. In the survey, respondents who participated in Delphi applications were asked to
provide their weight preferences on WJWSI indicator and sub‐indicators. Based on this
information, weights of indicators and sub‐indicators were calculated using the Revised Simos’
procedure. Calculation results revealed that the highest weight belonged to the Water
Availability and the lowest weight belonged to the Information Disclosure. It was also found
that the University Lecturer group and Community group had reverse preference on some
indicators. The University Lecturer group had a high preference on the Water Availability,
Water Demand and Water Quality indicators, while the Community group had a low
preference for these indicators. In contrast, the Community group had a high preference on
Information Disclosure, Law Enforcement and Poverty indicators, while the University Lecturer
group had a low preference for these indicators.
Performance and Priority of Action for WJWSI were introduced for index interpretation.
Performance reflects the condition of issue(s) related to an indicator, a sub‐indicator or the
overall water resource condition at a particular time of assessment. The Priority of Action
reflects the priority of action(s) required to address the above issue(s). High Performance
corresponds to low Priority of Action for the catchment, and vice versa.
Having finalised the development of WJWSI, the next task will be the application of the index
in different West Java catchments. In this study, as mentioned, the index will be applied to
three catchments: Citarum, Ciliwung and Citanduy. In these case studies, the water
sustainability performance of each catchment will be assessed, and necessary programs to

Development of West Java Water Sustainability Index 3-47
address important issues will be identified. During the case studies, the aggregated index
values of the three catchments will be compared to determine which catchments need higher
priority. The detailed process of application in these catchments is presented in Chapter 4.
Application of West Java Water Sustainability Index 4-1
Chapter 4
Application of West Java Water Sustainability Index
4.1 INTRODUCTION
Having developed the West Java Water Sustainability Index (WJWSI), it was then applied to
three water catchments in West Java, Indonesia. These applications provided valuable
information on (1) how the index was applied systematically, (2) what data were needed to
apply the index and (3) how the results could be used for improvement of water resource
management in these catchments. The main outcome of these case studies was the
assessment on the conditions of water resource issues for each catchment, used as the basis
for recommendations to relevant decision makers in respective catchments.
Through applications of WJWSI in different catchments, methods to obtain the sub‐index
values and methods to aggregate the final index were tested. These applications clearly
indicated the data requirement to perform each task and demonstrated the link between the
results of the applications and the recommendations suggested to relevant authorities
managing these water catchments.
This chapter discusses the applications of WJWSI in three West Java catchments in Indonesia:
Citarum, Ciliwung and Citanduy. At the time of the applications (and, in particular, during the
field study), the latest available data for all three catchments was for 2008. Therefore, all
relevant calculations for all catchments were first completed for that year. To compare these
results with previous years, the WJWSI was also applied to these catchments for 2006 and
2007.
This chapter first explains the methodology used for WJWSI applications. This includes the
methods used to obtain the sub‐index values of WJWSI indicators, aggregate the final index,
and perform the robustness analysis of the index. The chapter then describes the general

Application of West Java Water Sustainability Index 4-2
conditions of West Java Province, where the three catchments are located. In this section,
general climatic and socio‐economic conditions in West Java are presented, followed by
current water management practices. This includes discussion on relevant water authorities,
available policies and regulations, as well as current water management programs.
The applications of WJWSI in three catchments are then presented. The application in Citarum
catchment is presented in more detail as compared to Ciliwung and Citanduy catchments. This
approach is to avoid any unnecessary repetition of similar tasks performed in these
catchments. For each catchment, the following information is provided: description of the
catchment, application of the index in the catchment for 2006, 2007 and 2008, robustness
analysis, and suggested recommendations to water authorities that relate to results of these
applications.
Finally, following a discussion of WJWSI applications in each catchment, a comparative analysis
for the three different catchments is also presented. This analysis highlights similarities and
differences in applications and provides useful benchmarking for water authorities to further
improve water resource management practices in their respective catchments.
4.2 METHODOLOGY USED FOR APPLICATIONS
In general, this sub‐section discusses the methods used to obtain sub‐index values, aggregate
indicators and sub‐indicators, and perform robustness analysis. Two methods were used to
obtain sub‐index values for various indicators and sub‐indicators, which were continuous
rescaling and categorical scale methods. To aggregate all indicators, arithmetic and geometric
methods were considered.
4.2.1 Obtaining Sub‐index Values
As outlined in Section 2.4.2, the methods used to obtain sub‐indices are ranking, continuous
rescaling, percentage of annual differences over consecutive years, categorical scale and
distance to reference.
Application of West Java Water Sustainability Index 4-3
The ranking method will not be used in this study, as this method provides only a rank for each
indicator and sub‐indicator, and does not provide information on the conditions of indicators
and sub‐indicators. In the WJWSI, information on these conditions is required to further
formulate necessary policies and programs for improving overall water resource management.
The percentage of annual differences method will not be used for the WJWSI due to lack of
data. To be useful, this method requires several years of data, which is not available in West
Java. The rationale for not using the distance to reference method was because this method
requires prior knowledge of the values of indicators, so they can be used as reference values.
With regards to water resource management in West Java, such indicators with known values
are not available.
The continuous rescaling and the categorical scale methods were chosen because they are
able to provide information on the conditions of WJWSI indicators and sub‐indicators, which is
reflected in their respective sub‐indices. Also, these methods were used, as required
information to use these methods was also available. Based on the characteristics of available
data, three groups of indicators and sub‐indicators were identified to compute their sub‐index
values.
The first group of indicators and sub‐indicators are Water Availability, Land Use Changes,
Coverage, Education and Sanitation. The sub‐index values for this group were obtained using
the continuous rescaling method (Eq. (2.2b)). Eq. (2.2b) is reproduced below as Eq. (4.1).
Indicators and sub‐indicators of the second group are Water Quality, Water Demand, Water
Loss, Poverty and Health Impact. The sub‐index values for this group were obtained using the
modified continuous rescaling method (Eq. (2.3b)). Eq. (2.3b) is reproduced below as Eq. (4.2).
min
max min
100ii
X XSX X
−= ×
− (4.1)
min
max min
100 100ii
X XSX X
⎛ ⎞−= − ×⎜ ⎟−⎝ ⎠
(4.2)

Application of West Java Water Sustainability Index 4-4
where Si is the sub‐index value for indicator i, Xi is the actual value for indicator i, and Xmin and
Xmax are the minimum and maximum threshold values of the indicator.
The third group consists of three indicators: Information Disclosure, Governance Structure and
Law Enforcement. Due to their qualitative nature, minimum and maximum thresholds to
calculate the sub‐indices of these indicators and sub‐indicators using the continuous rescaling
method are not available. Therefore, for these indicators, the categorical scale was used to
obtain their sub‐indices, as shown in Eq. (4.3). A quartile scale was proposed in Eq. (4.3). This
equation was modified from Eq. (2.5).
0 – < 25 if Xi meets criteria 1 Si = 25 – < 50 if Xi meets criteria 2 (4.3) 50 – < 75 if Xi meets criteria 3 75 – 100 if Xi meets criteria 4
where Xi is the actual condition (similar to actual values for the non‐categorical indicators and
sub‐indicators) assessed in a particular catchment. The four criteria (1 to 4) that are used to
obtain sub‐indices for each of these three categorical indicators and sub‐indicators are defined
as follows:
Information Disclosure
The Information Disclosure indicator examines the availability and accessibility of key data
related to water resource management, for public use. Table 4.1 shows the quartile scale that
was proposed to quantify the sub‐index for this indicator, with its criteria. Key data include
rainfall, population, water quality, water use, coverage, water losses, education, poverty,
sanitation, water‐related diseases and land use.
Table 4.1 Criteria for sub‐index values of Information Disclosure
Criteria Sub‐index Few key data (25% or less) are available 0 – <25 Key data are available, but only a few are accessible through the internet
25 – <50
Key data are available, accessible, but not regularly updated 50 – <75 Key data are available, accessible and regularly updated 75 – 100

Application of West Java Water Sustainability Index 4-5
Governance Structure
Governance Structure analyses the governance structure of water‐related institutions in West
Java, particularly with respect to job descriptions, and overlaps among different institutions.
Table 4.2 shows the criteria, based on the quartile scale, which was proposed to quantify the
sub‐index of this indicator.
Table 4.2 Criteria for sub‐index values of Governance Structure
Criteria Sub‐index
Only few institutions (25% or less) responsible for managing water resources have clear structures
0 – <25
All institutions responsible for managing water resources have clear structures
25 – <50
Structure of the institutions are clear, but overlap of tasks occur 50 – <75Clear structure and no overlap of tasks among different institutions 75 – 100
Law Enforcement
This indicator considers the enforcement of regulation on water resources, particularly on
stream quality. Table 4.3 shows the criteria, based on the quartile scale, which was proposed
to quantify the sub‐index for Law Enforcement.
Table 4.3 Criteria for sub‐index values of Law Enforcement
Criteria Sub‐index
Procedure for enforcement is not available 0 – <25 Procedure for enforcement is available, but no supporting resources (human, budget)
25 – <50
Procedure for enforcement and supporting resources (human, budget) are available, but not implemented
50 – <75
Procedure for enforcement and supporting resources (human, budget) are available, and implemented
75 – 100
4.2.2 Final Index
The sub‐index values of indicators and sub‐indicators were aggregated using arithmetic and
geometric aggregation methods. The detail explanation of these aggregation methods can be
found in Section 2.4.4. The sub‐index values of WJWSI indicators and sub‐indicators were also

Application of West Java Water Sustainability Index 4-6
aggregated using different weighting schemes. Thus, the final index values were computed,
based on the combinations of different weighting schemes and aggregation methods.
4.2.3 Robustness Analysis
The robustness of WJWSI was analysed through uncertainty and sensitivity analysis of the
index. In general, uncertainty analysis focuses on how uncertainties of thresholds affect
respective sub‐index values and the final index value. It also attempts to analyse the variation
in the final index caused by changes in weighting schemes and aggregation methods.
Sensitivity analysis evaluates the importance of each threshold of indicators and sub‐indicators
in determining the final index value. Sensitivity analysis of the WJWSI was undertaken to
answer the following questions:
- Which thresholds were the most sensitive to the changes in their upper and lower values?
- How important were the upper and lower values of the thresholds in determining the final
index value?
- Which of the weighting schemes or aggregation methods was more sensitive to the final
index value?
The uncertainty and sensitivity analysis for WJWSI included three major tasks: (1) identification
of uncertainty sources, (2) defining the upper and lower values for thresholds and their
probability distributions and (3) Monte‐Carlo simulations. In this study, three sources of
uncertainties were identified including different thresholds of indicators and sub‐indicators,
weighting schemes and aggregation methods. These uncertainties were then analysed, based
on the Monte‐Carlo simulation. The simulation was performed using @Risk software from
Palisade Corporation (Clemen & Reilly, 2001). The Monte Carlo (MC) simulation sampled
various values of the upper and lower thresholds of WJWSI indicators and sub‐indicators, and
calculated their respective sub‐indices. In this study, the uncertainty and sensitivity analysis
was conducted using data for Citarum, Ciliwung and Citanduy catchments for 2008, as they
were the latest available data during the analysis.
(a) Thresholds of Indicators and Sub‐indicators
Due to different characteristics of categorical and non‐categorical indicators and sub‐
indicators, upper and lower values of thresholds for these two groups are different. The review

Application of West Java Water Sustainability Index 4-7
on existing policies and guidelines has identified different values for thresholds of the majority
of non‐categorical indicators and sub‐indicators. These were used as the upper and lower
values of respective thresholds in the uncertainty analysis. For the remaining non‐categorical
indicators and sub‐indicators, ±10% of the base value (Table 3.7) was used as the upper and
lower values for respective thresholds. Base values are the maximum or minimum threshold
for each indicator or sub‐indicator, used to obtain the sub‐index values of WJWSI indicators
and sub‐indicators. These upper and lower values are shown in Table 4.4.
Table 4.4 Upper and lower values of thresholds of non‐categorical indicators and sub‐indicators
Indicator/Sub‐indicator Unit
Thresholds of Indicators and Sub‐indicators Max Upper/Lower
ValuesMin Upper/Lower
Values Water Availability m3/cap/yr 1700 a 1300 ‐ 1800 500 b 500 ‐ 600 Land Use Changes % 100 a 80 ‐ 100 0 b +10% Water Quality ‐ 0 a ‐ 10% ‐31 b + 10% Water Demand % 40 b ± 10% 10 a 0 – 10% Coverage % 80 a ± 10% 0 b +10% Water Loss % 30 b 25 – 30 15 a 0 ‐ 15 Education % 100 a ‐10% 0 b 0 – 20%
Poverty % 20 b 15 ‐ 25 0 a +10% Health Impact (cases/1000
population) 2 b ± 10% 0 a +10%
Sanitation % 100 a ‐ 10% 0 b 0 – 20% a: preferable; b: not preferable
The uncertainty analysis was based on the thresholds of categories. The 0 ‐ 100 spectrum in
the quartile method used to define the categories in this study has three boundary values as
the source of uncertainties. These values are 25, 50 and 75 (refer to Tables 4.1, 4.2 and 4.3),
which define boundaries for criteria. Based on these values, upper and lower values for the
thresholds of boundary values were defined. These values are shown in Table 4.5.
Table 4.5 Uncertainties of categorical indicators and sub‐indicators
Original Categories Upper and Lower0 – <25 0 – <(12.5‐37.5)25 – <50 (12.5‐37.5) – <(37.5‐62.5)50 – <75 (37.5‐62.5) – <(62.5‐87.5)75 – 100 (62.5‐87.5) – <(12.5‐37.5)

Application of West Java Water Sustainability Index 4-8
(b) Weighting Schemes
Two weighting schemes were considered in the analysis: equal and non‐equal. Using the equal
weighting scheme, all indicators and sub‐indicators were assigned equal weights in the
aggregation. With the non‐equal weighting scheme, however, indicators and sub‐indicators
were assigned different weights. The non‐equal weighting scheme used in this study was
based on opinions from water‐related stakeholders in West Java, using the Revised Simos’
procedure (refer to section 3.4.2).
(c) Aggregation Methods
The other source of uncertainty in the WJWSI is the aggregation method. Two aggregation
methods were considered: arithmetic and geometric. Details of these aggregation methods are
presented in section 2.4.4 of Chapter 2.
(d) Procedures for the Uncertainty and Sensitivity Analysis
As indicated earlier, these uncertainties (upper and lower values of thresholds, weighting
schemes and aggregation methods) were analysed based on Monte‐Carlo (MC) simulation
results. The procedures to assess these uncertainties are illustrated in DF ‐ Distribution Function;
TV – Threshold Value; BV – Boundary Value (for the categorical indicators and sub‐indicators); SV –
Sub‐index Value
Figure 4.1. This figure shows that uncertainty and sensitivity analysis for this study involves
four major steps. The first step is to obtain the distribution functions for the maximum and
minimum thresholds of each indicator or sub‐indicator. For the non‐categorical indicators and
sub‐indicators, only the upper, base and lower values for thresholds are available. Therefore,
considering the availability of data for thresholds of these indicators and sub‐indicators, the
triangular distribution function was used for each threshold. For categorical indicators and
sub‐indicators, the uniform distribution function was used.
In the case of non‐categorical indicators and sub‐indicators, the upper and lower values are
respectively the highest and lowest values possible for the threshold of the indicator or sub‐
indicator. The base value is used to calculate the sub‐index value in the application of WJWSI,

Application of West Java Water Sustainability Index 4-9
taken from the final WJWSI framework (Tables 3.7, Table 4.4). As an example, the three
required values (i.e. upper, base and lower) for defining the distribution function of the
maximum threshold of Water Availability are shown in Table 4.6, which are extracted from
Table 4.4.
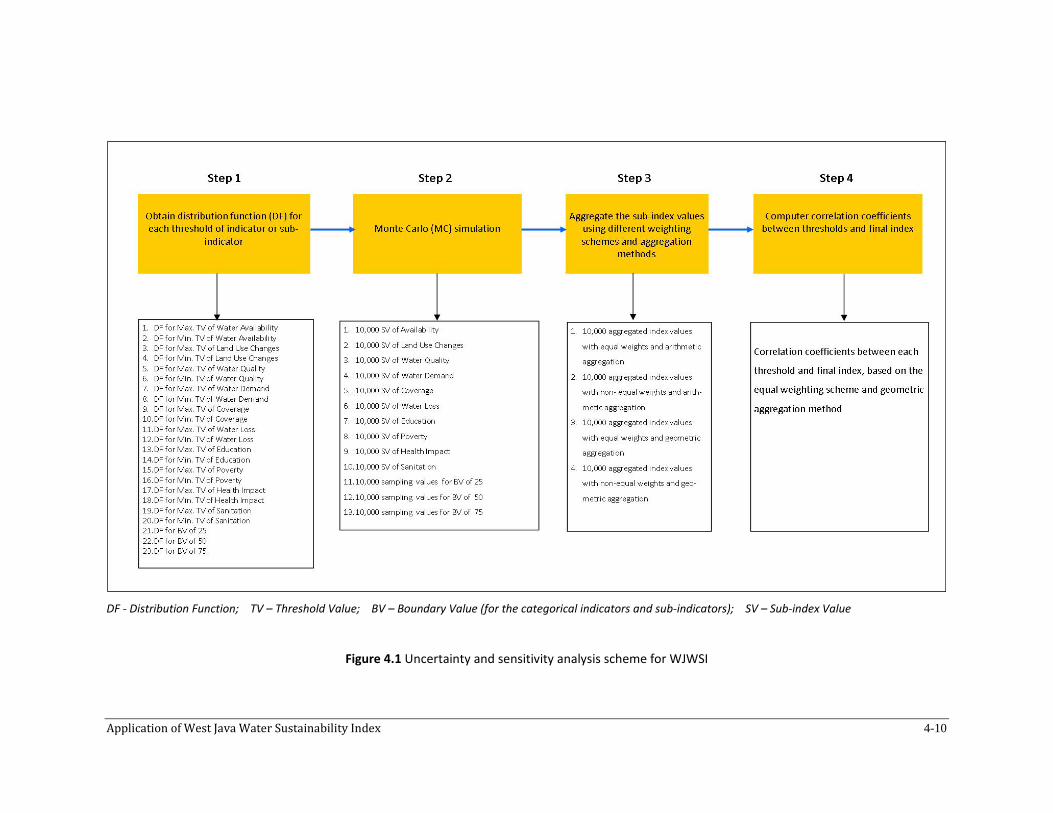
Application of West Java Water Sustainability Index 4-10
DF ‐ Distribution Function; TV – Threshold Value; BV – Boundary Value (for the categorical indicators and sub‐indicators); SV – Sub‐index Value
Figure 4.1 Uncertainty and sensitivity analysis scheme for WJWSI
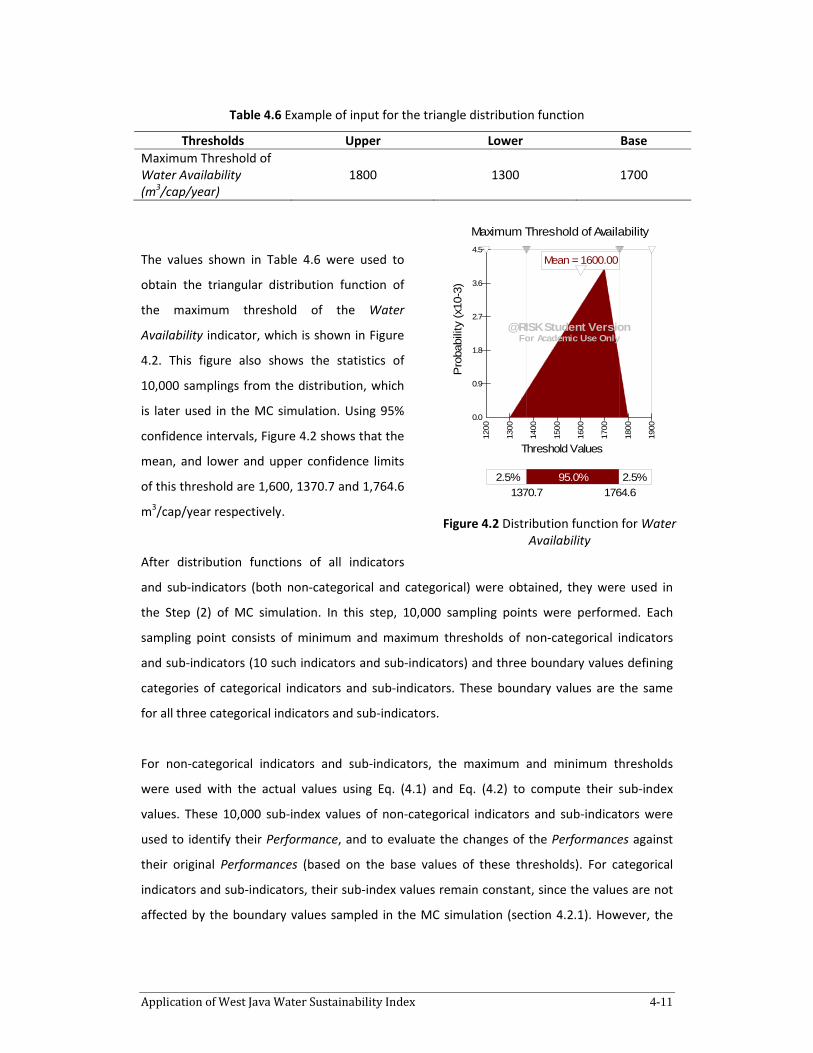
Application of West Java Water Sustainability Index 4-11
Table 4.6 Example of input for the triangle distribution function
Thresholds Upper Lower Base Maximum Threshold of Water Availability (m3/cap/year)
1800 1300 1700
The values shown in Table 4.6 were used to
obtain the triangular distribution function of
the maximum threshold of the Water
Availability indicator, which is shown in Figure
4.2. This figure also shows the statistics of
10,000 samplings from the distribution, which
is later used in the MC simulation. Using 95%
confidence intervals, Figure 4.2 shows that the
mean, and lower and upper confidence limits
of this threshold are 1,600, 1370.7 and 1,764.6
m3/cap/year respectively.
After distribution functions of all indicators
and sub‐indicators (both non‐categorical and categorical) were obtained, they were used in
the Step (2) of MC simulation. In this step, 10,000 sampling points were performed. Each
sampling point consists of minimum and maximum thresholds of non‐categorical indicators
and sub‐indicators (10 such indicators and sub‐indicators) and three boundary values defining
categories of categorical indicators and sub‐indicators. These boundary values are the same
for all three categorical indicators and sub‐indicators.
For non‐categorical indicators and sub‐indicators, the maximum and minimum thresholds
were used with the actual values using Eq. (4.1) and Eq. (4.2) to compute their sub‐index
values. These 10,000 sub‐index values of non‐categorical indicators and sub‐indicators were
used to identify their Performance, and to evaluate the changes of the Performances against
their original Performances (based on the base values of these thresholds). For categorical
indicators and sub‐indicators, their sub‐index values remain constant, since the values are not
affected by the boundary values sampled in the MC simulation (section 4.2.1). However, the
Maximum Threshold of Availability
P
roba
bilit
y (x
10-3
)Threshold Values
0.0
0.9
1.8
2.7
3.6
4.5
1200
1300
1400
1500
1600
1700
1800
1900
2.5% 2.5%95.0%1370.7 1764.6
@RISK Student VersionFor Academic Use Only
Mean = 1600.00
Figure 4.2 Distribution function for Water Availability

Application of West Java Water Sustainability Index 4-12
boundary values sampled in the MC simulation might affect Performances (Tables 4.1, 4.2 and
4.3).
In Step 3, the 10,000 sub‐index values of indicators and sub‐indicators (from the MC
simulation) were aggregated using different combinations of weighting schemes and
aggregation methods.
Finally, Step 4 calculates correlation coefficients between thresholds of each indicator or sub‐
indicator and the final index value, using SPSS software. To calculate correlation coefficients,
10,000 data of each threshold from the MC simulation, and the corresponding 10,000 final
index values from Step 3 (using equal weighting and geometric aggregation methods) were
used. These correlation coefficients were also used to evaluate which thresholds were more
sensitive to the final index value.
4.3 WEST JAVA
The West Java Province is one of the most highly populated provinces in Indonesia. The
province is located and adjacent to the Jakarta Province, as shown in Figure 4.3. Currently, the
Jakarta Province relies on the West Java Province for various needs such as labourers, raw
materials for industries and daily household needs. The West Java Province plays an important
role in national development, because of its natural resources and economic potential. The
natural resources in West Java have been utilised by various sectors and stakeholders in
Indonesia, which have resulted in the degradation of environmental resources, including water
resources (Rahmat & Wangsaatmadja, 2007).
The West Java Province is located between 5050’‐7050’ S and 104048’‐108048’ E. To the north,
it is bordered by the Java Sea, while to the west it is bordered by Jakarta and Banten Provinces.
To the south and east, the province is bordered by the Indonesian Ocean and Central Java
Province respectively (Rahmat & Wangsaatmadja, 2007).
According to its topography, the West Java Province is divided into three sections. The first
section constitutes the steep mountainous area, with an altitude higher than 1,500 metres
above mean sea level. The second section is the hillside area, with an altitude between 100
Application of West Java Water Sustainability Index 4-13
and 1,500 metres above mean sea level. And the third section is the extensive plains area, with
an altitude of 0 to 10 metres above mean sea level.
WEST JAVAPROVINCE
JAVA ISLAND
BANTENPROVINCE
INDONESIA
JAKARTA
PROVINCE
CENTRAL JAVAPROVINCE
Figure 4.3 West Java province
4.3.1 Climatic Conditions
The West Java Province has a tropical climate. Average temperatures in the steep mountains
and coastal areas are 90C and 340C respectively. The average temperature in the extensive
plains is between 17.40C and 30.70C (Dinas Pertanian Jawa Barat, 2011). The average annual
rainfall in mountain areas is between 3,000 and 5,000 mm/year, whereas in other areas the
average annual rainfall is 2,000 mm/year.
4.3.2 Socio‐Economic Conditions
(a) Population
The population in West Java has increased progressively from year to year. In 2006, for
example, the population was 40.74 million. Three years later, in 2009, the total population was
43.02 million (18.11% of the national population). The population of the capital, Bandung City,
was 2.40 million in 2009 (5.56 % of the total population in the province). The density of the
population in West Java in 2009 was 1,159 people/km2, with Bandung City having the largest
concentration of 14,228 people/km2.

Application of West Java Water Sustainability Index 4-14
(b) Land Use
The increased population in West Java has impacted land use to support various activities.
Apart from the need for housing, the demand from industries in the Jakarta Province has led to
changes in West Java land use, and also the Banten Province (Bappeda Team, 2004). As a
result, forestry and agricultural areas in these provinces have significantly changed.
During 1994 to 2005, the highest increase in land use was for housing. In the same period, the
forestry area was significantly reduced. These land use changes have resulted in a decrease in
conservation areas in West Java Province (Rahmat & Wangsaatmadja, 2007). These changes
are believed to be the main factor responsible for increased floods and droughts in different
parts of the West Java Province (Gandapurnama, 2008; Ginting, 2007; Helmy, 2008).
4.3.3 Water Management
The West Java Province has 40 catchments. Of these catchments, 22 flow into northern parts
of the province and 18 flow into southern parts of the province. The main river in the
catchment, the Citarum River, flows across two provinces (i.e. West Java and Jakarta). A study
by Hasibuan (2005) reported that 18 West Java catchments were in a critical condition, based
on various factors including the quality of major rivers, land use and soil saturation.
In general, the conditions of water resources in catchments, both quality and quantity, are far
from satisfactory. In terms of water quality, five main rivers in West Java catchments including
Citarum, Ciliwung, Citanduy, Cileungsi and Cimanuk Rivers are considered critical (Tarigan,
2009). The water quality in these rivers did not meet the national standards for water quality
during 2005 to 2009. The main contributors to the low water quality of these rivers are
industries polluting the rivers, as well as domestic and agricultural discharge. The
Environmental Protection Agency (EPA) of West Java (West Java Environmental Protection
Agency, 2008) stated that as many as 542 industries were polluting rivers in West Java. The
rivers also suffered from the improper discharge of 79.8 hectares of agriculture waste and
domestic waste of 8.6 million of people. In terms of water quantity, in the last two decades,
many areas in West Java have suffered drought and floods (Wangsaatmaja, 2004).
Of the 40 catchments in West Java, three catchments are considered highly important for
various reasons. The three catchments are Citarum, Ciliwung and Citanduy. In the Citarum

Application of West Java Water Sustainability Index 4-15
catchment, three reservoirs were built, which are used to supply water for various purposes,
such as domestic, agriculture, power plant and fishery. In the Ciliwung catchment, the Ciliwung
River flows across two main provinces, West Java and Jakarta. The Ciliwung catchment is the
most densely populated catchment, with approximately 3.5 million people live along the
Ciliwung River banks. The Citanduy River, as the main river in the Citanduy catchment, flows
across two provinces (West Java and Central Java), which make the catchment highly
important. The Citanduy River also supplies water needs for different kinds of farming in the
Citanduy catchment.
4.3.3.1 Water Authorities
Various authorities are responsible for the management of water resources in West Java.
These authorities include the West Java Environmental Protection Agency (EPA), West Java
Water Resource Management Agency (WRMA) and the Catchment Authority. Both West Java
EPA and WRMA function at the provincial level, while the Catchment Authority functions at
catchment level.
The main role of the West Java EPA in managing water resources is to formulate
environmental policies (including water resource management) within the West Java Province,
with particular emphasis on coordination of environmental monitoring, and providing
environmental management assistance to local governments.
The West Java Water Resource Management Agency (WRMA) has the responsibility to
formulate policies on water resource management in West Java at the operational level, and
specifically to (Indonesian Ministry of Public Works, 2010):
1. Formulate operational and technical policies on water resource management
2. Facilitate investment on water resource utilisation
3. Provide consent on the use of water source
4. Monitor and evaluate programs on water resource management
At the catchment level, catchment authorities are responsible for the implementation of water
resource management in their respective catchments, which include planning, construction,
operation, and maintenance of all aspects of water resource management. In most cases, one
catchment authority is responsible for one catchment. However, in some cases, one catchment

Application of West Java Water Sustainability Index 4-16
authority is responsible for several catchments, as the size of some catchments is too small to
have a separate catchment authority. For example, the Citarum Catchment Authority is
responsible only for the Citarum catchment, whereas the Ciliwung Catchment Authority is
responsible for both Ciliwung and Cisadane catchments.
4.3.3.2 Policies and Regulations
In 2006, the National Ministry of Internal Affairs, the Ministry of Forestry and the Ministry of
Public Works together released a decree on the importance of water catchments (Indonesian
Ministry of Public Works, 2006). The decree stated that high priority is given to a catchment
that meets at least one of the following criteria: (1) availability of water resources is at least
20% of the total availability in the province, (2) population in the catchment is at least 30% of
the total population in the province and (3) the impact of the catchment on the national
development is highly significant.
There were other policies and regulations related to water resource management in West
Java’s catchments. They include:
(1) National Regulation No 7/2004, Provincial Decree on Water Resource Management
(2) National Regulation No 82/2001 on Water Quality Management and Water Pollution
Control
(3) Provincial Decree No 3/2004 on Water Quality Management and Water Pollution Control
(4) Ministry of Environment of Indonesia Decree No 51/1995 on Effluent Standard for
Industries
(5) Ministry of Environment of Indonesia Decree No 35‐A/1995 on Performance Assessment
of Industries in Pollution Control Management
(6) Provincial Decree No 2/2006 on Management of Conservation Areas
These policies and regulations accommodate necessary tools to improve water resource
management in Indonesia, particularly in West Java. However, these policies and regulations
have not been implemented effectively. For example, with regard to the conservation area,
the Provincial Decree No. 2/2006 on Management of Conservations Areas clearly defined areas
designated for water conservation, however some of these areas are also used for housing and
commercial purposes (Wangsaatmaja, 2004).

Application of West Java Water Sustainability Index 4-17
4.3.3.3 Current Water Management Programs
For more than a decade, water management programs in West Java have mainly focused on
improving the quality of its major rivers. There were two main programs implemented in West
Java to improve river quality. The first program is known as Proper Prokasih. This is a national
program, started in 1995 by the Indonesian Ministry of Environment, implemented under the
coordination of the Environmental Protection Agency (EPA) of Indonesia. The other program is
called Environmental Pollution Control Manager (EPCM), and was started in 2005. However,
these two programs have not significantly contributed to the improvement of river quality in
West Java. The monitoring of five major rivers in West Java in 2010 shows that water quality at
all sampling points was below the national standard (Turindra, 2011).
(a) Proper Prokasih
The objective of this program is to improve the compliance of industries through regulations
that are relevant to environmental impact management, particularly on waste water quality
(Environmental Protection Agency (EPA) of West Java, 2008). This program was expected to
reduce the level of pollutants discharged into the river systems by industries. At
implementation stage, the program was conducted in three phases (Wheeler & Afsah, 2000):
1. Identification and selection of industries to participate in the program
Journalists, local government and universities were involved in the identification process.
As industrial development was concentrated on the island of Java, the majority of
industries that participated in the program were from Java. Of the total industries
participating in the program, 75% were from Java and the other 25% were from Sumatera,
Sulawesi, and Kalimantan. In June 1995, a pilot study for the program was conducted, and
187 factories were assessed. In 1998 as many as 350 factories voluntarily participated in
the program (Wheeler & Afsah, 2000).
2. Waste water Sampling of industries
Sampling of effluent quality of industries was carried out twice yearly by a designated team
from the EPA Indonesia.

Application of West Java Water Sustainability Index 4-18
3. Results Monitoring
Effluent samplings are compared and analysed against the National Effluent Standard,
specified in the Environmental Ministerial Decree of Indonesia No.122/MENLH/2004.
Based on this analysis, industries are classified according to Table 4.7 (Wheeler & Afsah,
2000).
The monitoring process is conducted every six months, and announced to the public via local
and national media. The monitoring of the program in 2010 showed that the number of
industries participating in the program has increased. In total, 691 industries were monitored
at the end of 2010. Of these industries, two were classified as Gold, 54 (8%) as Green, 435
(63%) as Blue, 153 (22%) as Red and the remaining 47 (7%) as Black (Tamin & Reliantoro,
2010). The monitoring in 2010 also noted that the number of industries under compliance
categories of Gold, Green and Blue have improved from 432 industries (end of 2009) to 491
industries (end of 2010). Based on these results, the Ministry of Environment of Indonesia has
claimed that the program had been successful in improving environmental performances of
participating industries. In future, as many as 2000 industries (about 25% of the total
industries in Indonesia) will be targeted to participate in the program.
Table 4.7 Categories for industry in Proper Prokasih program (Wheeler & Afsah, 2000)
TYPE CRITERIA REQUIREMENTS
GOLD
EXCEED COMPLIANCE
All requirements for Green, plus similar levels of pollution control for air and hazardous waste. Industries reach high international standards by the extensive use of clean technology, waste minimization, pollution prevention, recycling, etc.
GREEN
Pollution level is lower than waste waterstandards by at least 50 percent. Factory ensures proper disposal of sludge, good housekeeping, accurate pollution records, and reasonable maintenance of the waste water treatment system
BLUE IN COMPLIANCE Factory only applies sufficient effort to meet the minimum discharge standards.
RED
NOT IN COMPLIANCE
Factory makes some effort to control pollution, but it is not sufficient to achieve compliance
BLACK Factory makes no effort to control pollution, or causes serious environmental damage

Application of West Java Water Sustainability Index 4-19
(b) Environmental Pollution Control Manager
The Environmental Pollution Control Manager (EPCM)is designed by the West Java EPA, in
collaboration with the Japan External Trade Organization (JETRO), which aims at improving the
capacity of human resources responsible for managing industrial pollution at the company
level (Wangsaatmadja, 2009).
Currently, in the West Java Province, many industries are believed to discharge their waste
water without proper treatment. Therefore, the improvement of river quality cannot be
achieved without the involvement of industries. One of the reasons for such bad practice is the
lack of capable human resources to manage waste water problems. To address this issue, the
provincial government of West Java requires every industry in West Java to employ a certified
pollution control manager, through the Environmental Pollution Control Manager (EPCM)
program. This is undertaken by providing training to the company manager responsible for
waste water treatment. To support the EPCM program, the Provincial Government of West
Java enacted a Provincial Decree on Industrial Waste water Treatment, which states that every
industry is obliged to have a certified person, responsible for waste water treatment and
discharge(Asdep Standardisasi, 2008). The certification is organised by the Environmental
Protection Agency of West Java. Since its implementation in 2005, 285 managers have been
certified through this scheme as of early 2011.
According to Resmiani (2010), the success of the EPCM program is determined by its constant
dissemination to all industries and district governments. In addition, Resmiani (2010) also
emphasises the need to monitor the performance of certified pollution control managers,
through compliance of industries with effluent standard regulations. It is expected that the
increase in compliance will improve the quality of rivers in the West Java Province.
4.4 CITARUM CATCHMENT
4.4.1 Description of the Catchment
The Citarum catchment occupies an area of approximately 7,400 km2, which can be divided
into three parts; upper (1,771 km2), middle (4,242 km2) and lower (1,387 km2). As illustrated in
Figure 4.4, three reservoirs have been built in the catchment, which are used to supply water

Application of West Java Water Sustainability Index 4-20
for various purposes, such as domestic, agriculture, power plant and fishery. From upstream of
the catchment, there are three reservoirs: Saguling, Cirata and Jatiluhur. Average rainfall over
the catchment is 2,300 mm/year, and the flow of the Citarum River, gauged at the inlet of
Saguling, approximately equals 5.7 billion m3/year.
According to the decree of the National Ministry of Internal Affairs, Ministry of Forestry and
Ministry of Public Works of 2006, the Citarum catchment is a highly prioritised catchment, as
has made a significant impact on the national development of Indonesia, particularly the
economic sector (Tarigan, 2009). Irrigation and industrial sectors in West Java and Jakarta
provinces highly rely on the Citarum River. Also, the reservoirs in the Citarum catchment
generate electricity for use in West Java and Jakarta provinces respectively.
Figure 4.4 Citarum catchment in West Java
In 2008, the total population within the catchment was just over 11 million. The majority live
along the river banks, and have directly used the river for various domestic uses, including
drinking water. Several water service companies in the catchment have also built water intakes
to use raw water in their water treatment plants. Pressures on the catchment and its rivers
come from pollutants from various activities within the catchment. Pollutants from the
domestic sector originate from both direct and indirect discharge of black water and grey
water of households. Hundreds of industries located along the river also pollute the river due

Application of West Java Water Sustainability Index 4-21
to lack of awareness, as well as lack of law enforcement from relevant authorities. In addition,
agriculture and livestock have also contributed to river pollution in the catchment.
4.4.2 Application of WJWSI for 2008
The application of WJSWI in the Citarum catchment requires collecting data for each indicator
and sub‐indicator. Data were collected from past studies, institutional databases and other
relevant sources. After all required data had been collected, sub‐index values for WJWSI
indicators and sub‐indicators were calculated. These sub‐index values were then aggregated to
produce the final index.
4.4.2.1 Sub‐index Values and Final index
As indicated earlier, the sub‐index values of non‐categorical indicators and sub‐indicators are
obtained using Eq. (4.1) and Eq. (4.2). To compute these sub‐index values, maximum and
minimum thresholds, as well as the actual values of indicators and sub‐indicators need to be
obtained.
The maximum and minimum thresholds are presented in Table 4.4. The actual value for each
indicator or sub‐indicator is obtained, based on relevant data and information available from
various West Java institutions. The details on how these actual values were obtained are
discussed in the following sub‐sections. For categorical indicators and sub‐indicators, sub‐index
values are obtained using the criteria presented in Tables 4.1, 4.2 and 4.3.
Water Availability
According to Falkenmark (2004), the maximum amount of water available for human use is
approximately 60% of the total rainfall, and this amount is used in the WJWSI application. This
amount is then divided by the total population in the catchment to obtain the actual value of
Water Availability. Based on this information, the actual value was calculated as
587m3/person/year for the Citarum catchment in 2008. Eq. (4.1) was then used to calculate
the sub‐index for Water Availability as 7.28. The low sub‐index for Water Availability in the
Citarum catchment is caused by the large population living within the catchment. Recently the
big cities in the catchment, such as Bandung, Depok and Bogor, have attracted people from

Application of West Java Water Sustainability Index 4-22
other areas. Currently, there is no appropriate regulation to prevent this growing influx of
people.
However, minority of people in the catchment have practised the recycle and reuse of water in
their daily activities. Unfortunately, these practices have not been systematically implemented
through the coordination of water authorities in West Java. The availability of water in West
Java is also a concern for non‐governmental organisations, such as the IUWASH (Indonesia
Urban Water, Sanitation and Hygiene). The USAID‐based organisation has started to increase
the availability of groundwater resources in West Java by injecting rainfall directly to the
ground (USAID Indonesia, 2011). Since this program has only been started at the end of 2011,
its results has not yet been confirmed.
Land Use Changes
Ideally, the actual value of the Land Use Changes indicator is obtained by comparing actual
land use in the catchment with land use planning, issued by the Regional City Planning Body.
However, in the Citarum catchment such land use data were not available. Therefore, the sub‐
index for land use changes was obtained by calculating the percentage of identified
conservation areas within the catchment, which are supported with necessary planning
documents. It was found that in 2008, as much as 84.68% of the total conservation area was
supported with necessary planning documents. Using Eq. (4.1), the sub‐index for this indicator
was calculated as 84.68.
Water Quality
The actual value of Water Quality was obtained by calculating the Storet value (Cude, 2001;
Indonesian Ministry of Environment, 2003) for 10 sampling points of water quality along the
Citarum river, as practised by the West Java Environmental Protection Agency (EPA). In the
2008, the average Storet value for all 10 sampling points was ‐96.1. Based on its Storet value,
water quality is classified into 4 groups: very good (Storet value of 0), good (Storet value of ‐1
to ‐10), medium (Storet value of ‐11 to ‐30) and bad (Storet value less than ‐31) (Indonesian
Ministry of Environment, 2003).

Application of West Java Water Sustainability Index 4-23
Using Eq. (4.2), the sub‐index for Water Quality was calculated as 0. Poor water quality is
caused by different factors. The major factor is pollution from various activities along the
rivers, particularly from domestic and industrial discharge. Lack of awareness by the general
public has resulted in daily discharge of large amounts of pollutants into the rivers. This
situation is worsened by the inadequacy of law enforcement and corrupt practice by relevant
authorities, which allow some companies to discharge their untreated waste water directly
into the river.
Water Demand
The first step to obtain the actual value of Water Demand was to summarise water used for
different purposes including domestic, public facility, irrigation and industry. This sum was
then expressed as a percentage of the availability of water resources for the catchment to
obtain the actual value of the Water Demand indicator. For the Citarum catchment in 2008,
this was calculated as 23.04%. The sub‐index for this indicator was then computed using Eq.
(4.2) as 56.54.
Coverage
Within the Citarum catchment, there are 12 water service providers. The actual value of the
Coverage indicator was obtained by considering the ratio of the population covered by the
pipeline distributions of water companies to the total population within the catchment. Once
this actual value was obtained (34.96%), the sub‐index for Coverage was calculated using Eq.
(4.1) as 43.70.
Water Loss
The actual value of Water Loss was obtained by considering the average loss of water both in
the processes of water production and water distribution of all 12 water service providers. In
2008, this was calculated as 40.10%. After the actual value was obtained, the sub‐index for the
Water Loss indicator was calculated using Eq. (4.2) as 0. The sub‐index value for Water Loss
shows that all water companies in the catchment suffer from a high level of water loss.
Information Disclosure
The sub‐index for Information Disclosure considered the availability and accessibility of key
data, as well as regular data updates. The key data includes rainfall, population, water quality,

Application of West Java Water Sustainability Index 4-24
water use, water distribution coverage, water losses, education, poverty, sanitation, water‐
borne diseases and land use. Each of these data was assessed using the criteria in Table 4.1.
The values for all these data were then averaged to obtain the sub‐index of the Information
Disclosure sub‐indicator. For the Citarum catchment, most of these data were available, but
they could not be accessed by the public through the internet. The sub‐index value for this
indicator was calculated as 37.27.
Governance Structure
The sub‐index for Governance Structure was obtained by assessing the structure, job
description and tasks of various water‐related institutions. Clarity of structures and job
descriptions, and identification of any tasks overlapping institutions are the criteria to obtain
the sub‐index for this indicator, as presented in Table 4.2. The analysis for the Citarum
catchment in 2008 shows that only a few institutions, which are responsible for the
management of water resource issues in the Citarum catchment, have clear institutional
structure and job descriptions. In some cases, overlaps of tasks occur among different
institutions. For these reasons, the sub‐index for Governance Structure was estimated as 35.
Education
The actual value of Education was obtained by calculating the percentage of people in the
Citarum catchment who have completed primary education. In 2008, this was calculated as
14.19%. The sub‐index of the Education indicator was then calculated using Eq. (4.1) as 14.19.
Poverty
The actual value of Poverty in the Citarum catchment was calculated using the percentage of
people who fell below the poverty standard, defined by the Indonesian national government.
According to this standard, poverty is defined as the inability of an individual to meet monthly
basic living standard (BPS Team, 2009). This standard is known as the poverty line, which is
updated once every three years. In 2008, the poverty line for West Java is Rp. 182,636.00 per
person/month, equal to approximately AUD 20.29 (1 AUD = Rp. 9,000.00). The percentage of
people under the poverty standard was calculated as 15.23%. Using this percentage value, the
sub‐index of the Poverty indicator was computed using Eq. (4.2) as 23.87.

Application of West Java Water Sustainability Index 4-25
Health Impact
The actual value of Health Impact was calculated by considering the number of haemorrhagic
dengue cases for every 1000 people. In the Citarum catchment for 2008, the actual value was
calculated as 0.99. The sub‐index for this indicator was then calculated using Eq. (4.2) as 50.60.
Sanitation
The actual value of the Sanitation indicator was obtained by calculating the percentage of
people having basic sanitation facilities, in accordance with the national regulation on the
minimum standard of sanitation facilities. According to this regulation, basic sanitation is
defined as having any sanitation facility, such as pit latrine or closet (MDG Indonesia Team,
2007). The actual value was calculated as 61.86%. Once this value was obtained, the sub‐index
was calculated using Eq. (4.1) as 61.86. This value reflects that there were still around 40% of
the population in the catchment (about 4 million) who had no access to basic sanitation
facilities.
Law Enforcement
The sub‐index for Law Enforcement was obtained by assessing procedures to enforce water‐
resource‐related policies and regulations, compared with the actual implementation of the
procedures. Currently, the West Java EPA already has procedures for regulation enforcement,
but is not fully implemented, due to lack of support from other relevant institutions. For this
reason, the sub‐index for the Law Enforcement indicator in the Citarum catchment (based on
detailed criteria in Table 4.3) was estimated as 40.
Sub‐index Values of Indicators and Sub‐indicators
The sub‐index values of the indicators and sub‐indicators, calculated earlier, and their
respective performances and priority of actions are presented in Table 4.8.

Application of West Java Water Sustainability Index 4-26
Table 4.8 Sub‐indices of Citarum catchment for 2008
Indicator/sub‐indicator
Unit Actual Value
Sub‐index Performance Priority of Action
Water Availability m3/cap/yr 587.32 7.28 a Poor High Land Use Changes % 84.68 84.68 a Good Low Water Quality ‐ ‐96.1 0.00 b Poor High Water Demand % 23.04 56.54 b Medium‐
GoodMedium‐Low
Coverage % 34.96 43.70 a Poor‐Medium
High‐Medium
Water Loss % 40.10 0.00 b Poor High Information Disclosure ‐ ‐ 37.27c Poor‐
MediumHigh‐
MediumGovernance Structure ‐ ‐ 35.00 d Poor‐
MediumHigh‐
MediumEducation % 14.19 14.19 a Poor High Poverty % 15.23 23.87 b Poor High Health Impact (cases/1000
pop)0.99 50.60 b Medium‐
GoodMedium‐Low
Sanitation % 61.86 61.86 a Medium‐Good
Medium‐Low
Law Enforcement ‐ ‐ 40.00 e Poor‐Medium
High‐Medium
Final Index (arithmetic aggregation method) 35.00 Poor‐Medium
High‐Medium
Final Index (geometric aggregation method) 20.04 Poor High a = obtained using Eq. (4.1); b = obtained using Eq. ( 4.2); c = obtained using Table 4.1; d = obtained using Table 4.2; e = obtained using Table 4.3
The third column shows the actual value for each indicator, followed by its sub‐index value in
the fourth column. The next two columns are Performance and Priority of Action for the
indicators and sub‐indicators, which were obtained using Table 3.10 (Section 3.5). The
Performance was based on the sub‐index value of the respective indicator or sub‐indicator.
There are four levels of performance: Good, Medium‐Good, Poor‐Medium, and Poor. Priority
of Action reflects the priority of action to improve the Performance of indicators or sub‐
indicators, which is the opposite of its respective Performance. If Performance of an
indicator/sub‐indicator is Poor, the Priority Action of the indicator/sub‐indicator is High.
Conversely, if Performance is Good, the Priority of Action is low.
Table 4.8 shows that some indicators and sub‐indicators have performed poorly. They are
Water Availability, Water Quality, Water Loss, Education and Poverty. Only one indicator
Application of West Java Water Sustainability Index 4-27
performed well, which is Land Use Changes. The other indicators are considered either Poor‐
Medium or Medium‐Good.
4.4.2.2 Robustness Analysis of WJWSI
The robustness of the WJWSI was analysed by performing the uncertainty and sensitivity
analysis on the index, based on data of 2008, as discussed in section 4.2.3. The outcomes of
various steps in the uncertainty and sensitivity analysis of the Citarum catchment are
presented in Tables 4.9, 4.10 and 4.11.
To analyse uncertainty, the coefficient of variation and percentage of unchanged performance
of 10,000 sub‐index values were used. The coefficient of variation was the ratio of the
standard deviation to the mean value. The percentage of unchanged performance was
obtained by comparing 10,000 Performances obtained from outputs of the Monte‐Carlo
simulation with the original Performances of indicators and sub‐indicators shown in Table 4.8.
In this study, the Performance reflects the condition of issue(s) related to an indicator or sub‐
indicator, which was obtained based on the sub‐index value of an indicator or sub‐indicator.

Application of West Java Water Sustainability Index 4-28
Table 4.9 Results of uncertainty analysis for Citarum catchment
1 2 3 4 5 6 7 8 9
Thresholds Unit Base Value Mean Std.
Deviation Coefficient of Variation
Indicators/Sub‐Indicators
Sub‐index values Unchanged Performance
(%) Mean
(Original Values) Standard Deviation
Coefficient of Variation
Water Availability – Maximum m3/cap/yr 1,700 1,599.8 108.50 0.07 Water Availability
5.09 (7.28)
2.24 0.44 100 Water Availability – Minimum m3/cap/yr 500 533.2 23.80 0.05
Land Use Changes – Maximum % 100 93.3 4.69 0.05 Land Use Change
90.53 (84.68)
4.66 0.05 100 Land Use Changes – Minimum % 0 3.4 2.36 0.70
Water Quality – Maximum ‐ 0 ‐1.0 0.72 0.71 Water Quality
0.00 (0.00)
0.00 ‐ 100 Water Quality – Minimum ‐ ‐31 ‐30.0 0.73 0.02
Water Demand ‐ Maximum % 40 40.0 1.64 0.04 Water Demand
50.94 (56.54)
4.29 0.08 59.97 Water Demand – Minimum % 10 6.6 2.39 0.36
Coverage – Maximum % 80 80.0 3.23 0.04 Coverage
41.81 (43.70)
2.26 0.05 100 Coverage – Minimum % 0 2.6 1.87 0.71
Water Loss – Maximum % 30 28.3 1.18 0.04 Water Loss
0.00 (0.00)
0.00 ‐ 100 Water Loss ‐ Minimum % 15 10.0 3.52 0.35
Education – Maximum % 100 96.7 2.35 0.02 Education
8.41 (14.19)
4.52 0.54 100 Education – Minimum % 0 6.6 4.66 0.71
Poverty ‐ Maximum % 20 20.0 2.04 0.10 Poverty
23.85 (23.87)
8.23 0.35 100 Poverty ‐ Minimum % 0 0.7 0.47 0.70
Health Impact – Maximum (cases/1000
pop) 2 2.0 0.08
0.04 Health Impact
52.29 (50.60)
2.39 0.05 82.74
Health Impact – Minimum (cases/1000
pop) 0 0.1 0.05
0.70
Sanitation – Maximum % 100 96.7 2.37 0.02 Sanitation
61.23 (61.86)
2.68 0.04 100 Sanitation – Minimum % 0 6.7 4.74 0.71
Boundary Value of 25
‐ 25 25.1 7.2 0.29 Information Disclosure
37.27 (37.27)
‐ ‐ 98.95
Boundary Value of 50
‐ 50 50.0 7.2 0.14 Governance Structure
35.00 (35.00)
‐ ‐ 89.86
Boundary Value of 75
‐ 75 75.1 7.2 0.10 Law Enforcement
40.00 (40.00)
‐ ‐ 90.26
Application of West Java Water Sustainability Index 4-29
Data in columns 4, 5 and 6 in Table 4.9 were obtained from the results of MC simulation. For
each threshold of non‐categorical indicators and sub‐indicators and each boundary value
defining categories of categorical indicators and sub‐indicators, the mean, standard deviation
and coefficient variation of 10,000 data generated from its distribution function were
computed. Table 4.9 shows that higher coefficients of variation belong to the minimum
thresholds of Land Use Changes, Coverage, Education, Poverty, Health Impact and Sanitation,
and the maximum threshold of Water Quality. This implies that upper and lower values of
these thresholds have resulted in the higher variation compared to other thresholds. For
future use, it is important to collect more specific information on these thresholds, so that the
uncertainty can be reduced.
The lowest coefficients of variation values belong to the maximum thresholds of Education and
Sanitation, and the minimum threshold of Water Quality, all having a value of 0.02. However,
there are several other thresholds which were less than 0.1 coefficient of variation.
Table 4.9 also provides links between thresholds and respective sub‐index values of non‐
categorical indicators and sub‐indicators. It should be noted that for categorical indicators and
sub‐indicators, for all 10,000 sampling points, their sub‐index values are the same, since the
boundary values do not affect the sub‐index values of these indicators and sub‐indicators. Each
pair of minimum and maximum thresholds has produced a sub‐index value of an indicator or
sub‐indicator. For each indicator or sub‐indicator, the mean, standard deviation and coefficient
of variation of its sub‐index value were calculated. This information is also used to analyse how
the upper and lower values of thresholds affect the sub‐index value of its respective indicator
or sub‐indicator.
For most indicators and sub‐indicators, the differences in coefficients of variation of their
maximum and minimum thresholds compensate each other in producing the sub‐index values,
as reflected in their coefficients of variation (e.g. Poverty, Education and Land Use Change). For
example, the coefficients of variation for maximum and minimum thresholds for the Poverty
indicator (0.10 and 0.70 respectively) compensate each other to produce the coefficient
variation of 0.35 for Poverty.

Application of West Java Water Sustainability Index 4-30
The above pattern does not apply to Water Availability, Water Quality and Water Loss. Low
values of coefficients of variation of maximum and minimum thresholds for Water Availability
(0.07 and 0.05 respectively) have resulted in a higher coefficient of variation (0.44). The
coefficients of variation for sub‐indices of Water Quality and Water Loss cannot be computed
because their sub‐index values were 0 (zero) throughout the analysis (as shown in Table 4.8).
Table 4.9 (column 9) also presents how 10,000 Performances of each indicator or sub‐indicator
resulted from the MC simulation, as compared to its original performance. It shows that
performance has changed only ± 10% or less compared to original performance (except for
Water Demand and Health Impact). According to Esty (2005), these changes of approximately
10% during simulation of uncertainties are considered insignificant. The performances of
Water Demand and Health Impact indicators have changed 4,003 times (40.03%) and 1,726
times (17.26%) during the MC simulation from Medium‐Good to Medium respectively, as sub‐
index values were close to the performance boundary.
Sensitivity analysis of the WJWSI was undertaken, based on the correlation coefficients of the
thresholds of the non‐categorical indicators and final index value. The boundary values of
categorical indicators were not included as they do not affect their sub‐index values and the
final index value. The correlation was based on the Spearman correlation method, with the
two‐tailed probability value for its significance. This value (the hypothesis used in the analysis)
is non‐directional, i.e. there is no preference as to whether the correlation value is either
positive or negative. The correlation coefficients for the thresholds and the final index value
are shown in Table 4.10.
Table 4.10 shows that the upper and lower values for the maximum threshold of Poverty have
produced the highest correlation coefficient (0.520), while the minimum threshold of Water
Quality produced the lowest correlation (0.004). The correlation coefficient should lie between
the values of ‐1 and 1. A perfect correlation is shown by the value of ‐1 or 1. The correlation
coefficient of 0 represents no correlation between variables (Caldwell, 2010; Corty, 2007;
Gravetter & Wallnau, 2011; Howell, 2011; Lind et al., 2000; Steinberg, 2011; Urdan, 2010).
Further interpretations on correlation coefficients are provided by different authors. Lind et al.
(2000) consider correlation coefficients as strong (>0.67), moderate (between 0.33 and 0.67)
Application of West Java Water Sustainability Index 4-31
and weak (<0.33). Caldwell (2010) interprets correlation coefficients as follows: no correlation
(0 ‐ 0.2), weak (0.2 ‐ 0.4), moderate (0.4 ‐ 0.6), strong (0.6 ‐ 0.8) and very strong (0.8 – 1).
Table 4.10 Correlation coefficients between final index and thresholds for Citarum catchment
No Thresholds of Indicators and Sub‐indicators Correlation Coefficient 1. Water Availability / Maximum Threshold ‐0.049* 2. Water Availability / Minimum Threshold ‐0.111* 3. Land Use Changes / Maximum Threshold ‐0.254* 4. Land Use Changes / Minimum Threshold ‐0.015 5. Water Quality / Maximum Threshold 0.004 6. Water Quality / Minimum Threshold ‐0.014 7. Water Demand / Maximum Threshold 0.132* 8. Water Demand / Minimum Threshold 0.199* 9. Coverage / Maximum Threshold ‐0.101* 10. Coverage / Minimum Threshold ‐0.074* 11. Water Loss / Maximum Threshold 0.023 12. Water Loss / Minimum Threshold ‐0.011 13. Education / Maximum Threshold ‐0.005 14. Education / Minimum Threshold ‐0.265* 15. Poverty / Maximum Threshold 0.520* 16. Poverty / Minimum Threshold 0.043* 17. Health / Maximum Threshold 0.107* 18. Health / Minimum Threshold 0.069* 19. Sanitation / Maximum Threshold ‐0.082* 20. Sanitation / Minimum Threshold ‐0.136*
* Significant, based on the two‐tailed probability value (p value< 0.05)
According to the above interpretations, only the maximum threshold of Poverty has a
significant effect on the aggregated value (the most sensitive). This means that changes in the
maximum threshold of Poverty will have the most statistically significant impact on the final
index value, compared to changes in any other thresholds. The positive correlation value of the
Poverty indicator implies that the increase in its maximum threshold will produce an increase
value in the final index. In this study, 20% was used as the maximum threshold, which means
that the actual Poverty value of 20% and above will result in the sub‐index value of 0 (zero). If
the maximum threshold for Poverty is increased to 40%, for example, actual values of 40% and
above will result in the sub‐index value of 0 (zero). This change on the maximum threshold of
Poverty might also change its priority of action.

Application of West Java Water Sustainability Index 4-32
The sensitivity analysis in this study also aims to answer the question: “Which of the weighting
schemes or aggregation methods mostly affect the final index?” To answer this question,
different aggregation combinations, based on different weighting schemes and aggregation
methods, were analysed. Results for the Citarum catchment are shown in
Table 4.11.
Table 4.11 Aggregation based on different weighting schemes and aggregation methods
Scenario Arithmetic Geometric Changes Equal weights 34.67 19.00 15.67 Non‐equal weights 30.97 20.52 10.45 Changes 3.7 1.52
Table 4.11 shows that changes in the final index values as a result of changes from equal to
non‐equal weights were 3.7 and 1.52. These changes as a result of changes from arithmetic to
geometric aggregation methods were 15.67 and 10.45. Based on these results, it is concluded
that the aggregation method is more sensitive to the final index value, compared to the
weighting schemes.
Therefore, for future use of the WJWSI, either the equal or non‐equal weighting scheme can
be used, as it will not significantly affect the final index. The aggregation method
recommended for the WJWSI is geometric. This method is more appropriate for the WJWSI as
the differences of sub‐index values among indicators are important and these differences are
reflected better in the final index obtained through the geometric aggregation method than
through the arithmetic method (Section 2.4.4).
By using the geometric aggregation method, the differences in sub‐index values of WJWSI
indicators and sub‐indicators are taken into account. Poor indicator performances, shown by
low sub‐index values, will be reflected in the aggregated index value. In contrast, when using
the arithmetic aggregation method, poor indicator performances will not be reflected in the
aggregated index value if other indicators perform well. Thus, it is recommended that the
geometric aggregation method is used to aggregate WJWSI indicators and sub‐indicators.
Application of West Java Water Sustainability Index 4-33
4.4.3 Application for Different Years
To obtain the sub‐index values of WJWSI indicators for 2006 and 2007, the rationales and
equations for 2008 were also used. The sub‐index values of Water Availability, Land Use
Changes, Coverage, Education and Sanitation were computed using Eq. (4.1), while the sub‐
index values of Water Quality, Water Demand, Water Loss, Poverty and Health Impact were
computed using Eq. (4.2). The sub‐index values of the categorical indicators and sub‐indicators,
which are Information Disclosure, Governance Structure and Law Enforcement, were obtained
using criteria in Tables 4.1, 4.2 and 4.3 respectively. As indicated from the results of the
robustness analysis (Section 4.4.2.2), the final index was computed using the equal weighting
scheme and geometric aggregation method. Results of the computation for these sub‐indices
are presented in Table 4.12. The comparison of results for 2006, 2007 and 2008 is illustrated in
Figure 4.5.
Figure 4.5 shows that the final index of the Citarum catchment in 2007 is slightly higher,
compared to 2006 and 2008. During this three year period, the sub‐index values for most
indicators remain constant or change slightly, with exceptions for Water Availability and Water
Demand. These latter indicators are affected by climate. The sub‐index value of Water
Availability in 2007 was very high due to high rainfall. The annual rainfall in the Citarum
catchment in 2007 was 2273 mm, which was much higher, compared to the annual rainfall in
2006 (1778 mm) and 2008 (1612 mm). As the sub‐index value of Water Availability is
dependent on rainfall in the catchment, higher rainfall in 2007 (coupled with insignificant
population growth) has resulted in the significant increase in the sub‐index value of Water
Availability.
The sub‐index value of Water Demand has also been affected by the significant increase in
rainfall in 2007. The actual value of Water Demand was obtained by comparing the use of
water for various activities with the availability of water in the area. Since the availability of
water increased considerably in 2007 (the result of high rainfall) and the use of water was
relatively constant, the actual value of Water Demand has decreased significantly. This
decrease was reflected in the high sub‐index value of Water Demand (Eq. 4.2).
Application of West Java Water Sustainability Index 4-34
For indicators and sub‐indicators other than Water Availability and Water Demand, during
2006‐2008, there were not significant changes on the variables of these indicators and sub‐
indicators. Consequently, the sub‐index values of these indicators and sub‐indicators have only
slightly changed.

Application of West Java Water Sustainability Index 4-35
Table 4.12 Sub‐indices of Citarum catchment for 2006 and 2007
Indicator/sub‐indicator
Unit
2006 2007
Actual Value Sub‐index/ Final Index
Performance Priority of Action
Actual Value Sub‐index/ Final Index
Performance Priority of
Action
Water Availability m3/cap/yr 672.40 14.37 a Poor High 849.32 29.11 a Poor‐Medium High‐Medium
Land Use Changes %
Water Quality ‐ ‐130.9 0.00 b Poor High ‐68.4 0.00 b Poor High
Water Demand % 17.34 75.54 b Good Low 14.71 100.00 b Good Low
Coverage % 30.84 38.54 a Poor‐Medium High‐Medium 35.20 44.00 a Poor‐Medium High‐Medium
Water Loss % 39.36 0.00 b Poor High 40.41 0.00 b Poor High
Information Disclosure
‐ 37.27 37.27 c Poor‐Medium High‐Medium 37.27 37.27c Poor‐Medium High‐Medium
Governance Structure ‐ 35 35.00 d Poor‐Medium High‐Medium 35 35.00 d Poor‐Medium High‐Medium
Education % 15.17 15.17 a Poor High 15.32 15.32 a Poor High
Poverty % 15.17 24.14 b Poor High 15.21 23.97 b Poor High
Health Impact (cases/1000 pop)
0.88 56.03 b Medium‐Good Medium‐Low 1.00 49.65 b Poor‐Medium High‐Medium
Sanitation % 65.14 65.14 a Medium‐Good Medium‐Low 60.64 60.64 a Medium‐Good Medium‐Low
Law Enforcement ‐ 40 40.00 e Poor‐Medium High‐Medium 40 40.00 e Poor‐Medium High‐Medium
Geometric Final index ‐ 21.77 Poor High 23.08 Poor High
a = obtained using Eq. (4.1); b = obtained using (Eq.4.2); c = obtained using Table 4.1; d = obtained using Table 4.2; e = obtained using Table 4.3

Application of West Java Water Sustainability Index 4-36
Figure 4.5 Sub‐index values of indicators and sub‐indicators for Citarum catchment
Application of West Java Water Sustainability Index 4-37
4.4.4 Recommendations for Water Authorities
Better quality and management of water resources in the Citarum catchment can be best
achieved by providing higher priority to the improvement of the indicators and sub‐indicators
that are Poor in Performance. Based on WJWSI applications in 2006 to 2008, the indicators and
sub‐indicators that are Poor in Performance are Water Availability, Water Quality, Education,
Water Loss and Poverty. The following sub‐sections provide recommendations to improve poor
performance indicators and sub‐indicators to achieve at least a sub‐index value of 25, and to
move up to Poor‐Medium performance. If these Poor indicators and sub‐indicators are
improved to at least 25 of their sub‐indices, the final index value will be improved from 20.04
to 37.19 (Poor to Poor‐Medium). It is recommended that water authorities in the Citarum
catchment take appropriate actions to improve the sub‐index values of these Poor indicators
and sub‐indicators. Some actions are presented below, which were as previously mentioned
based on the data from 2008.
Water Availability
According to the WJWSI results, the actual availability of water in West Java in 2008 was 587
m3/year. To increase the performance to at least Poor‐Medium (or a sub‐index value of 25),
the actual availability needs to be increased to at least 812 m3/person/year.
As mentioned earlier, the main factor causing low availability of water resources in the Citarum
catchment is the density of population. Thus, the most effective way to increase the
availability of water resources is by managing the population. One way to manage the
population in the area is through the re‐introduction of the ‘transmigration’ program, initiated
in the early 1960s (Gondowarsito, 1986). Through this program, people were encouraged to be
relocated to less‐dense areas, outside the Java Island. They were given a piece of land,
housing, and an establishment allowance to start a new life in a less dense area. However, this
program was discontinued because people who had agreed to be relocated were unable to
manage the land and housing given by the government, due to lack of skills (Gondowarsito,
1990). Therefore, if this program is to be re‐initiated in the future, government needs to
provide the necessary skills for people to manage the land in the proposed areas.
Application of West Java Water Sustainability Index 4-38
Another way of managing the population is to create centres of activities in less dense
population areas within the West Java Province. At this stage, these centres (such as reliable
shopping centres, leisure places and business areas) are concentrated in Bandung City in the
Citarum catchment. Creating these centres in other areas will significantly reduce the
motivation of people to migrate to Bandung City and other highly populated areas in the
Citarum catchment. This can be done through the involvement and coordination of related
stakeholders, particularly the Regional Planning Council as the responsible authority in
planning and development, along with other business sectors, local governments and the
community.
Water Quality
According to WJWSI results, in order to move from Poor to Poor‐Medium performance, the
actual value of Water Quality needs to be increased from ‐96.1 to ‐8.06.
Poor water quality in the catchment, as previously mentioned, has mainly been caused by lack
of awareness of stakeholders. To address this issue, the government, West Java EPA and
community groups need to develop programs to improve community awareness on water
resources. To be successful, program targets should be clearly stated and progress regularly
monitored.
Along with these community awareness programs, relevant authorities also need to enforce
laws and regulations on river quality. To do this, close monitoring of the operation of waste
water treatment plants is required to ensure that industrial waste water discharge meets the
designated standard.
Education
The WJWSI results indicate that for the Education indicator, in order to move from Poor to
Poor‐Medium performance, the actual value needs to be increased from 14.19% to 25%.
In the last few years, the Ministry of Education in Indonesia has launched programs to improve
the quality of primary education, namely Bantuan Operasional Sekolah (School Operational
Grant) and Sekolah Gratis (Free School for Everyone). These programs include the exemption
Application of West Java Water Sustainability Index 4-39
of education fees for all primary students in Indonesia, providing necessary books to most
elementary schools, and improving the quality of school infrastructure. However, these
programs have not yet been fully implemented. There are still cases where schools collect
money from students by giving various excuses (Auditan, 2006; Widjajanti, 2006).
Consequently, students from low income families are prevented from enrolling in these
schools. Therefore, to effectively improve the quality of primary education, these obstacles
need to be eliminated.
Water loss
Based on the WJWSI results, in order to move from Poor to Poor‐Medium performance, the
average actual value of Water Loss in the Citarum catchment needs to be reduced from
40.10% to 18.50%. The actual value of 18.50% will give the sub‐index value of 25, as the
minimum value for Poor‐Medium performance.
According to Sukmayeni (2007), the water losses of water service providers (WSPs) in
Indonesia, including the Citarum catchment, were caused by both physical and non‐physical
factors. The physical causes that lead to water losses are leakages in water treatment plants,
transmission systems and distribution systems. As for the non‐physical causes, the losses
mainly come from unbilled consumption, inaccuracies of customer metering and illegal
connections (Djamal et al., 2009). Yuwono (2009) suggests that higher priorities should be
given to reducing the non‐physical losses, as programs for reducing non‐physical losses are
more cost‐efficient. The reduction of the non‐physical losses will be an important starting
point for the overall reduction of water losses by water service providers, even though the
physical leakages are not yet addressed. It is believed that even though the non‐physical losses
are not real losses, they contribute to approximately 50% of the total unaccounted water of
WSPs in West Java (Yuwono, 2009).
Poverty
For Poverty, WJWSI results indicate that a decrease of 0.43% of its actual value is needed to
move from Poor to Poor‐Medium performance. In the last few years, local, provincial and
national governments have launched programs such as ‘direct cash assistance’ and ‘cheap rice’
to reduce the poverty level. The authorities reported that these programs have significantly

Application of West Java Water Sustainability Index 4-40
reduced poverty in most provinces in Indonesia. However, such programs benefited the poor
for a short period of time and some of these programs have been terminated. Once the
programs were terminated, poverty levels increased. Also, due to lack of monitoring, it was
found that some of these subsidy programs did not reach needy people. Thus, in the future,
closer monitoring of implementation and continuation of these programs is crucial to ensure
that benefits are received by those who most need them.
4.5 CILIWUNG CATCHMENT
4.5.1 Description of the Catchment
The main river in the Ciliwung catchment is the Ciliwung River. This river flows across two main
provinces, West Java and Jakarta. The river originates from Talaga Warna spring, located in the
Bogor region, and flows to Depok and Jakarta (Pusair, 2008), as illustrated in Figure 4.6. The
catchment occupies an area of approximately 440 km2, along the 119 km length of the
Ciliwung River. According to the flow gauge in Satuduit Station, river flows vary during rainy
and dry seasons. In 2007, a maximum flow of 125m3/s and a minimum flow of 49.4m3/s were
recorded at this gauge (Pusair, 2008).
Figure 4.6 Ciliwung catchment in West Java
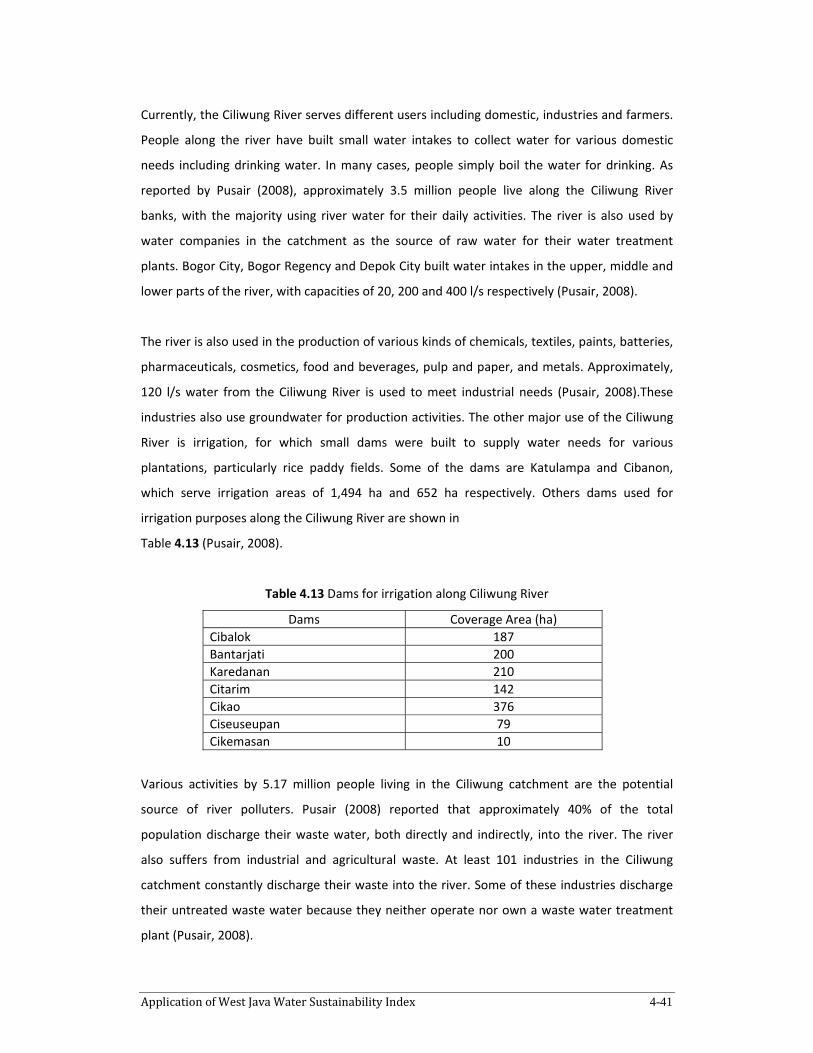
Application of West Java Water Sustainability Index 4-41
Currently, the Ciliwung River serves different users including domestic, industries and farmers.
People along the river have built small water intakes to collect water for various domestic
needs including drinking water. In many cases, people simply boil the water for drinking. As
reported by Pusair (2008), approximately 3.5 million people live along the Ciliwung River
banks, with the majority using river water for their daily activities. The river is also used by
water companies in the catchment as the source of raw water for their water treatment
plants. Bogor City, Bogor Regency and Depok City built water intakes in the upper, middle and
lower parts of the river, with capacities of 20, 200 and 400 l/s respectively (Pusair, 2008).
The river is also used in the production of various kinds of chemicals, textiles, paints, batteries,
pharmaceuticals, cosmetics, food and beverages, pulp and paper, and metals. Approximately,
120 l/s water from the Ciliwung River is used to meet industrial needs (Pusair, 2008).These
industries also use groundwater for production activities. The other major use of the Ciliwung
River is irrigation, for which small dams were built to supply water needs for various
plantations, particularly rice paddy fields. Some of the dams are Katulampa and Cibanon,
which serve irrigation areas of 1,494 ha and 652 ha respectively. Others dams used for
irrigation purposes along the Ciliwung River are shown in
Table 4.13 (Pusair, 2008).
Table 4.13 Dams for irrigation along Ciliwung River
Dams Coverage Area (ha)Cibalok 187Bantarjati 200Karedanan 210Citarim 142Cikao 376Ciseuseupan 79Cikemasan 10
Various activities by 5.17 million people living in the Ciliwung catchment are the potential
source of river polluters. Pusair (2008) reported that approximately 40% of the total
population discharge their waste water, both directly and indirectly, into the river. The river
also suffers from industrial and agricultural waste. At least 101 industries in the Ciliwung
catchment constantly discharge their waste into the river. Some of these industries discharge
their untreated waste water because they neither operate nor own a waste water treatment
plant (Pusair, 2008).

Application of West Java Water Sustainability Index 4-42
Other potential pollutants come from agricultural and poultry activities. Agricultural waste
includes the use of fertilisers and pesticides. Pusair (2008) reported that as much as 0.25
tonnes/day of nitrogen, 0.12 tonnes/day of phosphate and 0.013 tonnes/day of potassium
were disposed in the river as fertilisers and pesticides. As for poultry, 583.5 kg of BOD/day and
1,540 kg/day of suspended particles and 90.5 kg/day of nitrogen were discharged (Pusair,
2008).
4.5.2 Application of WJWSI for 2006, 2007 and 2008
Similar to the Citarum catchment, the WJWSI was applied to the Ciliwung catchment for 2006,
2007 and 2008. Applications in different years were undertaken to provide a better
understanding of water resource conditions.
4.5.2.1 Sub‐index Values and Final index
The WJWSI was applied to the Ciliwung catchment using the same rationales as the application
in the Citarum catchment. This includes the use of equations to obtain the sub‐index values of
indicators and sub‐indicators, as well as the weighting scheme and aggregation method used
to aggregate the indicators and sub‐indicators. The results of the application are shown in
Table 4.14. The sub‐index values of Information Disclosure, Governance Structure and Law
Enforcement in the Ciliwung catchment are the same as those in the Citarum catchment. This
is due to centralised management at the provincial level. As both catchments are located in
the West Java Province, the approach and actions related to indicators and sub‐indicators are
the same.
In general, the water sustainability performance of the Ciliwung catchment during 2006 to
2008 is considered Poor (geometric aggregation method). In 2008, 6 of 13 performance
indicators are considered Poor (Water Availability, Water Quality, Water Demand, Water Loss,
Education and Health Impact) and 4 are considered Poor‐Medium (Coverage, Information
Disclosure, Governance Structure and Law Enforcement). Of the Poor indicators, some
indicators and sub‐indicators have sub‐index values of 0 including Water Availability, Water
Quality and Water Loss. The following sub‐sections discuss these indicators and sub‐indicators
with Poor performances based on data for 2008.

Application of West Java Water Sustainability Index 4-43
Table 4.14 Sub‐indices of Ciliwung catchment for 2006, 2007 and 2008
Indicator/sub‐indicator
Unit 2006 2007 2008
Actual Value
Sub‐index/ Final Index
Performance Priority of Action
Actual Value
Sub‐index/ Final Index
Performance Priority of Action
Actual Value
Sub‐index/ Final Index
Performance Priority of Action
Water Availability
m3/cap/yr 463.21 0.00 a Poor High 375.00 0.00 a Poor High 485.22 0.00 a Poor High
Land Use Changes
% 98.56 98.56 a Good Low 98.56 98.56 a Good Low 98.56 98.56 a Good Low
Water Quality ‐ ‐100.67 0.00 b Poor High ‐50.22 0.00 b Poor High ‐55.78 0.00 b Poor High
Water Demand % 30.30 32.54 b Poor High 40.49 0.00 b Poor High 34.72 17.60 b Poor High
Coverage % 32.54 40.68 a Poor‐Medium High‐Medium
32.67 40.84 a Poor‐Medium High‐Medium
32.63 40.79 a Poor‐Medium High‐Medium
Water Loss % 29.94 0.00 b Poor High 30.31 0.00 b Poor High 30.26 0.00 b Poor High
Information Disclosure
‐ 37.27 37.27c Poor‐Medium High‐Medium
37.27 37.27c Poor‐Medium High‐Medium
37.27 37.27c Poor‐Medium High‐Medium
Governance Structure
‐ 35 35.00 d Poor‐Medium High‐Medium
35 35.00 d Poor‐Medium High‐Medium
35 35.00 d Poor‐Medium High‐Medium
Education % 23.54 23.54 a Poor High 20.70 20.70 a Poor High 19.49 19.49 a Poor High
Poverty % 5.22 73.87 b Medium‐Good
Medium‐Low
5.23 73.84 b Medium‐Good
Medium‐Low
5.24 73.81 b Medium‐Good Medium‐Low
Health Impact (cases/1000 pop)
1.36 32.27 b Poor‐Medium High‐Medium
1.60 19.99 b Poor High 1.57 21.32 b Poor High
Sanitation % 86.51 86.51 a Good Low 83.78 83.78 a Good Low 82.81 82.81 a Medium‐Good Medium‐Low
Law Enforcement ‐ 40 40.00 e Poor‐Medium High‐Medium
40 40.00 e Poor‐Medium High‐Medium
40 40.00 e Poor‐Medium High‐Medium
Geometric Final index
18.64 Poor High 13.59 Poor High 16.94 Poor High
a = obtained using Eq. (4.1); b = obtained using (Eq.4.2); c = obtained using Table 4.1; d = obtained using Table 4.2; e = obtained using Table 4.3

Application of West Java Water Sustainability Index 4-44
The actual value of Water Availability in the Ciliwung catchment in 2008 is 485.22 m3/cap/yr,
which is below the minimum threshold. This means available water resources in the catchment
are not sufficient to support basic water needs for the entire population within the catchment
(Falkenmark & Rockström, 2004). As stated in Section 4.4.2.1, two variables were used to
calculate the actual value of this indicator, which are rainfall and population. Even though the
average annual rainfall in the area for 2008 is well above the average annual rainfall in the
West Java Province (3867 mm/year compared to the average of 2000 mm/year), the
catchment is densely populated. Consequently, available fresh water is not sufficient to
support the demand. The main factor for highly populated areas in the Ciliwung catchment is
the proximity of the catchment to Jakarta, the capital city of Indonesia. As Jakarta offers job
opportunities, people from different regions of Indonesia continuously come to live in Jakarta.
These people, due to various economic reasons, are forced to live in areas adjacent to Jakarta,
including the Ciliwung catchment.
Water Quality is also a poor indicator with the sub‐index value of 0 (zero). The value of 0 (zero)
indicates that water quality along the Ciliwung River does not meet national water quality
standards. Lack of resources and commitment to the implementation of stream regulations are
the factors that lead to deterioration of water quality in the catchment. At national, regional
and local levels, regulations on stream use are already available, but these regulations are not
adequately implemented. For example, even though regulations on the discharge of waste
water along the river are available, community groups report that many industries and
households directly discharge their waste water into the river, without proper treatment
(Febrian et al., 2004). These households discharge waste water because of the lack of
treatment facilities and lack of awareness about river water quality. The improper practices of
industries are mainly caused by weakness in law enforcement by the relevant authorities.
Water Demand is another indicator with Poor performance, calculated as the ratio of water
use for different purposes (domestic, industry and agriculture), to the total available water. In
2008, the actual value for Water Demand was calculated as 34.72%. The value nearly reached
the standard for maximum percentage of water use set by the United Nations Commission on
Sustainable Development (40%), also the minimum threshold used in the WJWSI. The high

Application of West Java Water Sustainability Index 4-45
percentage of water demand in the Ciliwung catchment for 2008 was mainly caused by high
population density (331 people/km2).
In addition to high population density, as mentioned, there are a large number of industries
along the Ciliwung River (101 different industries) and considerable agricultural areas (1,200
hectares) dependent on the river for water needs. These factors have led to the increase of
water use in the Ciliwung catchment, and consequently contributed to the low sub‐index value
of the Water Demand indicator.
The Water Loss indicator has a sub‐index value of 0. This was calculated, based on the average
water loss of 7 WSPs in the Ciliwung catchment. This water loss for 2006 to 2008 is shown in
Table 4.15. It indicates that these losses for the three year period are considerably high, and
well above the threshold of 15% regulated by the National Government of Indonesia
(Kirmanto, 2007), which is also the maximum threshold used in the WJWSI. Both physical and
non‐physical losses have contributed to the high value of water loss by WSPs.
As previously mentioned, common physical losses are leakages in water treatment plants,
transmission systems and distribution systems, whereas non‐physical losses are unbilled
consumption, inaccuracies of customer metering and illegal connections (Djamal et al., 2009).
Therefore, genuine efforts must be made to achieve the maximum water loss target (15%) in
the Ciliwung catchment, as required by government.
Table 4.15 Percentage of Water Loss in Ciliwung catchment
City/District 2006(%)
2007(%)
2008 (%)
Bogor Regency 35 38 35 Sukabumi Regency 49 43 39 Cianjur Regency 29 36 32 Bekasi Regency 40 39 39 Bogor City 30 30 33 Bekasi City 23 23 23 Depok City 35 35 35

Application of West Java Water Sustainability Index 4-46
The sub‐index value of 19.49 for Education in the Ciliwung catchment means that only 19.49%
of the total population have completed basic education (or primary school) during 2008. Since
2005, the government has introduced programs to increase the number of enrolled students in
primary schools.
As stated in section 4.4.4, these programs include Bantuan Operasional Sekolah (School
Operational Grant) and Sekolah Gratis (Free School for Everyone). These programs were
mainly designed to improve the enrolment rate of primary school students in Indonesia. As the
programs were started in 2005, assessment on their success in increasing student numbers
who complete primary school (6 years) can only be completed after 2011. Therefore, the sub‐
index value of Education does not reflect the effect of these programs.
The last indicator for Poor performance is Health Impact. During 2006 to 2008, the average
actual value for this indicator was 1.51, which means of 10,000 people, 15 were reported to
suffer from haemorrhagic dengue, well above the target of 0 (zero) cases issued by the Health
Ministry of Indonesia. Most of these cases in the Ciliwung catchment were caused by the
quality of water consumed. Many people utilise water from the Ciliwung River for their daily
needs, including drinking water, without proper treatment. These practices, along with the
poor quality of river water, are believed to be the causes for high cases of haemorrhagic
dengue in the Ciliwung catchment (Health Department of Republic of Indonesia, 2005).
In addition to Table 4.14 which shows the results of WJWSI applications in the Ciliwung
catchment,
Figure 4.7 illustrates the comparison for 2006 to 2008. This figure shows that the sub‐index
values remain constant or slightly change over this period, except for Water Demand and
Health Impact. The sub‐index value for Water Demand in 2007 equals 0 (zero), whereas in
2006 and 2008, sub‐index values were 32.54 and 17.60 respectively.
Table 4.16 shows the variables that compose the sub‐index value of Water Demand, which
constitutes the water used for various activities and available water (shown by rainfall).

Application of West Java Water Sustainability Index 4-47
Figure 4.7 Sub‐index values of indicators and sub‐indicators for Ciliwung catchment

Application of West Java Water Sustainability Index 4-48
Table 4.16 The rainfall and water used in Ciliwung catchment, 2006 to 2008
Variables 2006 2007 2008 Rainfall (mm/year) 3575.40 2952.63 3866.67 Total water used (million m3/year) 1.24 1.35 1.49
As shown in Table 4.16, the water used for various purposes in the Ciliwung catchment
increased gradually from 2006 to 2008. However, during the same period, rainfall fluctuated
significantly. The average rainfall in 2007 has shown a considerable decrease from the previous
year, and then increased substantially in 2008. These changes have resulted in fluctuation of
sub‐index values of the Water Demand indicator. The relatively low rainfall in 2007, which
implies the decrease of water availability, has resulted in the increase of actual value for Water
Demand. This increase in actual value has resulted in the demand for water in the area above
40%, as the maximum threshold of Water Demand indicator (refer to Eq. 4.2). As the actual
demand was above 40%, the sub‐index value for Water Demand was calculated as 0.
Fluctuation in rainfall also affected the actual values of Water Availability in the same period.
However, as these actual values are below the minimum threshold, the sub‐index values of
Water Availability are 0.
Figure 4.7 also shows that final index values for the Ciliwung catchment are below 20, and
considered Poor in performance. In 2006, the final index value was slightly higher compared to
2007 and 2008, due to better performances in Water Demand, Education and Health Impact.
The lowest final index value was in 2007, due to low performances of Water Demand and
Health Impact indicators.
4.5.2.2 Robustness Analysis of WJWSI
Similar to the Citarum catchment, the robustness of the WJWSI based on the Ciliwung
catchment was analysed by performing uncertainty and sensitivity analysis on the index, based
on data of 2008. The outcomes of various steps are presented in Table 4.17, 4.19 and 4.20.

Application of West Java Water Sustainability Index 4-49
Similar to robustness analysis for the Citarum catchment, the robustness analysis for the
Ciliwung catchment is based on the methodology explained in section 4.2.3. Uncertainty
analysis seeks to understand how thresholds affect sub‐index values and the final index. The
results of uncertainty analysis for the Ciliwung catchment are shown in Table 4.17. This table
shows that coefficients of variations of the thresholds are varied. These results are similar to
those of the Citarum catchment, as the distribution function of minimum and maximum
thresholds of indicators and sub‐indicators used in the MC simulation are the same. The only
difference is the actual value of indicators and sub‐indicators.
It is also shown in Table 4.17 that coefficients of variation compensate each other to produce
sub‐index values (shown in Column 8). Table 4.17 shows that minimum thresholds of Land Use
Changes, Coverage, Education, Poverty, Health Impact and Sanitation, and the maximum
threshold of Water Quality have higher coefficients. Thus, it is important to collect more
specific information on these thresholds, so that uncertainty can be reduced. The coefficients
of variation of Water Availability, Water Quality and Water Loss cannot be computed as their
sub‐index values are calculated as 0 during the MC simulation.
Table 4.17 (column 9) also presents how 10,000 Performances of each indicator or sub‐
indicator resulted from the MC simulation, compared to its original performance. It shows that
Performances of most indicators and sub‐indicators have changed by only ±10% or less
compared to their original performance (except for Poverty). This indicates that performance
of these indicators and sub‐indicators are not sensitive to changes in thresholds. Performances
of the Poverty indicator have changed 3,480 times (34.8%) during the simulation from
Medium‐Good to Good, as the means of the sub‐index values resulting from the MC simulation
of 76.1 (original sub‐index value of 73.8) was close to the performance boundary of 75,and it
has crossed the performance boundary 3,480 times. The Performance reflects the condition of
issue(s) related to an indicator or sub‐indicator, which was obtained based on the sub‐index
value of an indicator or sub‐indicator.

Application of West Java Water Sustainability Index 4-50
Table 4.17 Results of uncertainty analysis for Ciliwung catchment
1 2 3 4 5 6 7 8 9
Thresholds
Unit Base Value
Mean Std.
Deviation Coefficient of Variation
Indicators/Sub‐Indicators
Sub‐index values Unchanged Performance
(%) Mean Std.
Deviation Coefficient of Variation
Water Availability – Maximum m3/cap/yr 1,700 1,600.3 107.9 0.07 Water Availability
0.0 (0.0)
0.0 ‐
100 Water Availability – Minimum m3/cap/yr 500 532.9 23.5 0.04
Land Use Changes – Maximum % 100 93.2 4.8 0.05 Land Use Change
99.9 (98.6)
0.3 0.00
100 Land Use Changes – Minimum % 0 3.4 2.4 0.71
Water Quality – Maximum ‐ 0 ‐1.0 0.7 0.70 Water Quality
0.0 (0.0)
0.0 ‐
100 Water Quality – Minimum ‐ ‐31 ‐30.0 0.7 0.02
Water Demand – Maximum % 40 40.0 1.6 0.04 Water Demand
15.7 (17.6)
4.3 0.27
100 Water Demand – Minimum % 10 6.7 2.4 0.35
Coverage – Maximum % 80 79.9 3.3 0.04 Coverage
38.8 (40.8)
2.2 0.06 100 Coverage – Minimum % 0 2.7 1.9 0.71
Water Loss – Maximum % 30 28.3 1.2 0.04 Water Loss
0.0 (0)
0.0 ‐
100 Water Loss – Minimum % 15 10.0 3.5 0.35
Education – Maximum % 100 96.7 2.4 0.02 Education
14.0 (19.49)
4.7 0.33
100 Education – Minimum % 0 6.7 4.7 0.71
Poverty – Maximum % 20 20.0 2.0 0.10 Poverty
76.1(73.8) 3.2
0.04
65.2 Poverty – Minimum % 0 0.7 0.5 0.71
Health Impact – Maximum (cases/1000
pop) 2 2.0 0.1 0.04 Health Impact
21.9 (21.3)
3.4 0.15
100 Health Impact – Minimum
(cases/1000 pop)
0 0.1 0.1 0.71
Sanitation – Maximum % 100 96.7 2.4 0.02 Sanitation
84.6 (82.8)
2.4 0.03 100 Sanitation – Minimum % 0 6.7 4.7 0.70
Boundary Value of 25
‐ 25 25.1 7.2 0.29
Information Disclosure
37.27 (37.27)
‐ ‐ 98.95
Boundary Value of 50
‐ 50 50.0 7.2 0.14
Governance Structure
35.00 (35.00)
‐ ‐ 89.86
Boundary Value of 75
‐ 75 75.1 7.2 0.10 Law Enforcement
40.00 (40.00)
‐ ‐ 90.26

Application of West Java Water Sustainability Index 4-51
The sensitivity analysis in relation to the Ciliwung catchment was performed as for the Citarum
catchment. The correlation of the thresholds of non‐categorical indicators and sub‐indicators
and the final index value were analysed. To do this, the correlation coefficients of 10,000
threshold data and corresponding final index values resulting from the MC simulation were
computed. The correlation coefficients are shown in Table 4.18.
Table 4.18 Correlation coefficients between final Index and thresholds
Thresholds of Indicators and Sub‐indicators Correlation Coefficient
Water Availability / Maximum Threshold 0.010 Water Availability / Minimum Threshold ‐0.002 Land Use Changes / Maximum Threshold 0.007 Land Use Changes / Minimum Threshold ‐0.001 Water Quality / Maximum Threshold ‐0.006 Water Quality / Minimum Threshold 0.006 Water Demand / Maximum Threshold ‐0.009 Water Demand / Minimum Threshold ‐0.002 Coverage / Maximum Threshold ‐0.016 Coverage / Minimum Threshold 0.002 Water Loss / Maximum Threshold ‐0.008 Water Loss / Minimum Threshold ‐0.006 Education / Maximum Threshold ‐0.030* Education / Minimum Threshold 0.009 Poverty / Maximum Threshold ‐0.013 Poverty / Minimum Threshold ‐0.005 Health / Maximum Threshold 0.013 Sanitation / Maximum Threshold 0.001 Health / Minimum Threshold 0.015 Sanitation / Minimum Threshold ‐0.015
* Significant, based on the two‐tailed probability value (p value< 0.05)
Table 4.18 shows that only the correlation coefficient for the maximum threshold of Education
is statistically significant. Thus, any changes in other thresholds will not significantly increase or
decrease the final index value. Based on this finding, it is concluded that the final index value
of the Ciliwung catchment is not sensitive to most of the thresholds, using the analysis for
2008. With regards to Education, its correlation with the final index is considered weak
(although statistically significant), as shown by the value of its correlation coefficient (‐0.030).
This weak correlation coefficient means that changes in the sub‐index value of Education will
not significantly change the final index value.

Application of West Java Water Sustainability Index 4-52
The sensitivity analysis in this study also aims to answer the question: “Which weighting
scheme or aggregation method mostly affects the final index?” In order to answer this
question, different aggregation combinations, based on different weighting schemes and
aggregation methods, were analysed as for the Citarum catchment. Results of these
aggregations are shown in Table 4.19.
Table 4.19 Aggregation results based on different weighting schemes and aggregation methods
Scenario Arithmetic Aggregation Method
Geometric Aggregation Method
Changes
Equal weights 35.64 20.18 15.46 Non‐equal weights 31.26 20.52 10.74 Changes 4.38 0.34
Table 4.19 shows the changes on final the index values due to the changes from equal to non‐
equal weights. They were 4.38 and 0.34 respectively for arithmetic and geometric aggregation
methods. Changes to final index values from the arithmetic method to the geometric
aggregation method were 15.46 and 10.74 for equal weights and non‐equal weights
respectively. Similar to the results for the Citarum catchment, Ciliwung catchment results show
that the aggregation method is more sensitive to the final index value, compared to the
weighting schemes.
Therefore, similar to the recommendation given based on the results of robustness analysis in
the Citarum catchment, for future use of the WJWSI, either the equal or non‐equal weighting
scheme can be used. For the aggregation method, it is recommended to use the geometric
method.
4.5.2.3 Recommendations for Water Authorities
The results of the WJWSI applications in the Ciliwung catchment for 2006 to 2008 have shown
that indicators of Water Availability, Water Quality, Water Demand, Water Loss and Health
Impact require immediate action, as they have performed poorly. For each indicator, specific
issues that cause low performances need to be adequately addressed.

Application of West Java Water Sustainability Index 4-53
Relevant authorities should carefully design appropriate programs to address these issues, and
supported by reasonable and achievable target(s). For example, as the low sub‐index value of
the Water Quality indicator was mainly caused by the discharge of waste water by industries,
the West Java Environmental Protection Agency (EPA) along with other relevant authorities
need to strictly enforce the industries to abide by the law on waste water discharge and
treatment. The following sub‐sections provide recommendations to improve poor performing
indicators and sub‐indicators to achieve at least the sub‐index value of 25, in order to move to
the next best performance (Poor‐Medium). If these indicators and sub‐indicators with Poor
performance can be improved, at least to 25 sub‐indices, the final index value in the Ciliwung
catchment will improve from 16.94 to 37.72 (Poor to Poor‐Medium). These recommendations
were based on 2008 data.
Water Availability
The actual value of Water Availability in the Ciliwung catchment in 2008 is 428.22 m3/year. To
increase the performance to Poor‐Medium (or a sub‐index value of 25), the actual value needs
to be increased by at least 812 m3/person/year.
Similar to the Citarum catchment, the main factor causing low value of Water Availability in
the Ciliwung catchment is the high density of population living in the area. As mentioned
earlier, the only way to increase Water Availability in the area is by managing the population.
This can be done through the re‐introduction of the ‘transmigration’ program and creating
centres of activities in less dense population areas within the West Java Province. Details of
these programs were presented under the ‘Recommendation to Water Authorities’ for the
Citarum catchment (section 4.4.4).
Water quality
According to the WJWSI application in the Ciliwung catchment for 2008, the actual value for
Water Quality was ‐55.78. In order to move from Poor to Poor‐Medium performance, the
actual value of the Water Quality needs to be increased to ‐8.06.
Similar to the Citarum catchment, poor water quality in the Ciliwung catchment was mainly
caused by the lack of awareness of stakeholders (particularly domestic and industries along the

Application of West Java Water Sustainability Index 4-54
rivers). Relevant approaches that can be used to address these issues for the Ciliwung
catchment were explained in section 4.4.4.
Water Demand
Table 4.14 on the application of the WJWSI to the Ciliwung catchment for 2008 shows that the
actual value of Water Demand is 34.72%, which gives the sub‐index value of 17.60 (Poor
performance). In order to increase the sub‐index to 25, as the minimum value for Poor‐
Medium performance, the actual value of 34.72% needs to be reduced to 32.5%.
The actual value of Water Demand was the ratio of water use to available water in the
catchment. As the available water was dependent on rainfall, the reduction of actual value of
Water Demand can only be achieved by controlling the use of water in the catchment. Water
uses in the catchment are mainly for domestic, industry and irrigation. Therefore, the water
authorities in the Ciliwung catchment, in coordination with other relevant authorities, should
carefully determine the combination of water use reduction from domestic, industry and
irrigation sectors. The reduction in water use for domestic needs can be achieved by
controlling the population in the catchment, which will also improve Water Availability. The
reduction of water use for industry can be done through controlling the number of industries,
or introducing new practices with significant reduction in water uses. Similar ideas can also be
applied to irrigation, where new cultivation practices can be introduced to reduce the amount
of water used for irrigation.
Water loss
According to the results of WJWSI application in the Ciliwung catchment in 2008, in order to
move from Poor to Poor‐Medium performance, the actual value of Water Loss needs to be
reduced from 30.26% to 18.50%. The actual value of 18.50% will give the sub‐index value of
25, as the minimum value for the Poor‐Medium performance. Similar to the recommendations
given for the Citarum catchment, WSPs in the Ciliwung catchment should focus on reducing
non‐physical losses to improve the performance of Water Loss, as the non‐physical losses in
WSPs contribute to approximately 50% of the total losses (Yuwono, 2009). After significant
progress is made on the reduction of non‐physical losses, programs on the reduction of the
physical losses should also be initiated.

Application of West Java Water Sustainability Index 4-55
Health Impact
During the application of the WJWSI to the Ciliwung catchment for 2008, it was found that the
actual value of Health Impact was 1.57. This needs to be reduced to 1.5, in order to move from
Poor to Poor‐Medium performance.
The high actual value of Health Impact in the Ciliwung catchment was caused by poor water
quality and sanitation (Health Department of Republic of Indonesia, 2005). The only way to
lower the actual value of this indicator is by reducing haemorrhagic dengue cases within the
catchment. The Ministry of Health in Indonesia has introduced simple programs to prevent the
proliferation of disease. These programs mainly aim at abating the mosquitoes responsible for
spreading the disease (Pujiyanto et al., 2008), which include cleaning water storages regularly,
closing the lids of water storages properly, and removing any bins that can be used by
mosquitoes to reproduce. To implement these programs, relevant authorities in the Ciliwung
catchment should set reasonable targets, and monitor them. To effectively implement these
programs, the involvement of relevant health centres and other community‐based
organisations is essential.
4.6 CITANDUY CATCHMENT
4.6.1 Description of the Catchment
The Citanduy catchment is one of the largest in the West Java Province, and also one of the
critical catchments in terms of erosion, sedimentation and flood risk (Hasibuan, 2005;
Prasetyo, 2004). The main river in the catchment is the Citanduy River, which flows across two
provinces, in West Java and Central Java. The river originates from Tasikmalaya in West Java
and ends in the Indian Ocean (Nair et al., 2010).
The Citanduy catchment covers a total area of approximately 346,000 ha, divided into five sub‐
catchments. The coverage area of each sub‐catchment is shown in Table 4.20. The Citanduy
catchment is located on the eastern part of the West Java Province, bordered by the Central
Java Province, as shown in Figure 4.8.

Application of West Java Water Sustainability Index 4-56
Table 4.20 Coverage areas of sub‐catchments in Citanduy catchment
Sub‐Catchments Approximate Coverage Area (ha) Upper Citanduy 70,000Cimuntur 60,000Cijolang 48,000Cikawung 70,000Ciseel 98,000
The Citanduy catchment occupies several cities and regencies in the West Java Province. These
cities are Banjar and Tasikmalaya, and the regencies are Ciamis, Tasikmalaya, Kuningan,
Majalengka, Cilacap and Banyumas. Compared to the other two catchments (i.e. Citarum and
Ciliwung), the Citanduy catchment is the least densely populated. In each sub‐catchment, the
population density varies. The most populated area is the sub‐catchment of Upper Citanduy
and the least populated is the sub‐catchment of Cimuntur (Nair et al., 2010). In the Citanduy
catchment, farms constitute the most dominant land use. As much as 54.6% of the catchment
area is used for farming, such as fruit gardens, perennial crop‐lands and agro‐forests(Nair et
al., 2010). The next dominant land use is paddy fields (20.5%) and forestry (14.6%).
Figure 4.8 The Citanduy catchment in West Java

Application of West Java Water Sustainability Index 4-57
4.6.2 Application of WJWSI for 2006, 2007 and 2008
Similar to the other catchments in this study, the application of the WJSWI in the Citanduy
catchment was initiated by collecting the required data for each indicator and sub‐indicator.
The sub‐index values for WJWSI indicators and sub‐indicators were then calculated. These sub‐
index values were then aggregated to produce the final index. This process was followed for
2006, 2007 and 2008.
4.6.2.1 Sub‐index Values and Final index
The same equations that were used for the Citarum and Ciliwung catchments were used for
the Citanduy catchment. This includes the use of equations to obtain the sub‐index values of
indicators and sub‐indicators, as well as the weighting scheme and aggregation method used
to aggregate the indicators and sub‐indicators. The results are shown in Figure 4.9 and Table
4.21. Table 4.21 (as well as Tables 4.8, 4.12 and 4.14) shows that the sub‐index values of
Information Disclosure, Governance Structure and Law Enforcement in the Citanduy catchment
are the same as those in the Citarum and Ciliwung catchments. This is due to centralised
management at the provincial level. As all three catchments are located in the West Java
Province, the approach and actions related to indicators and sub‐indicators are the same.
Figure 4.9 shows that during the three year period from 2006 to 2008, the sub‐index values of
WJWSI indicators and sub‐indicators in the Citanduy catchment are relatively constant.
Apparently, during 2006‐2008, there were not significant changes on the variables of the
indicators and sub‐indicators in the Citanduy catchment. Consequently, the sub‐index values of
these indicators and sub‐indicators have only slightly changed.
It is also noticeable that during this period, Water Availability and Water Demand indicators
have sub‐index values of 100. The sub‐index value of Water Availability reached its maximum
value because the relatively high rainfall in the catchment was sufficient to accommodate the
water needs of the entire population. Compared to the Citarum and Ciliwung catchments,
population density in the Citanduy catchment is considerably low. Consequently, available
water is abundant, as reflected in the high sub‐index value of Water Availability of the Ciliwung
catchment.

Application of West Java Water Sustainability Index 4-58
Figure 4.9 Sub‐index values of indicators and sub‐indicators for Citanduy catchment

Application of West Java Water Sustainability Index 4-59
Table 4.21 Sub‐indices of Citanduy catchment for 2006, 2007 and 2008
Indicator/sub‐indicator
Unit 2006 2007 2008
Actual Value
Sub‐index/ Final Index
Performance Priority of Action
Actual Value
Sub‐index/ Final Index
Performance Priority of Action
Actual Value
Sub‐index/ Final Index
Performance Priority of Action
Water Availability m3/cap/yr 3299.29 100.00 a Good Low 3723.32
100.00 a Good Low 2507.87 100.00 a Good Low
Land Use Changes % 79.86 79.86 a Good Low 79.86 79.86 a Good Low 79.86 79.86 a Good Low
Water Quality ‐ ‐91.33 0.00 b Poor High ‐40.33
0.00 b Poor High ‐68.67
0.00 b Poor High
Water Demand % 2.50
100.00 b Good Low 2.24
100.00 b Good Low 4.93
100.00 b Good Low
Coverage % 51.57
64.47 a Medium‐Good
Medium‐Low
51.61
64.51 a Medium‐Good
Medium‐Low
51.65
64.56 a Medium‐Good Medium‐Low
Water Loss % 44.29
0.00 b Poor High 35.42
0.00 b Poor High 33.70
0.00 b Poor High
Information Disclosure ‐ 37.27 37.27c Poor‐Medium
High‐Medium
37.27 37.27c Poor‐Medium High‐Medium
37.27 37.27c Poor‐Medium High‐Medium
Governance Structure ‐ 35.00 35.00 d Poor‐Medium
High‐Medium
35.00 35.00 d Poor‐Medium High‐Medium
35.00 35.00 d Poor‐Medium High‐Medium
Education % 5.04
5.04 a Poor High 5.04
5.04 a Poor High 5.62 5.62 a Poor High
Poverty % 17.98
10.12 b Poor High 17.97
10.13 b Poor High 17.97
10.15 b Poor High
Health Impact (cases/1000 pop)
0.21
89.50 b Good Low 0.25
87.50 b Good Low 0.25
87.70 b Good Low
Sanitation % 47.74
47.74 a Poor‐Medium
High‐Medium
47.74
47.74 a Poor‐Medium High‐Medium
46.55
46.55 a Poor‐Medium High‐Medium
Law Enforcement ‐ 40.00 40.00 e Poor‐Medium
High‐Medium
40.00 40.00 e Poor‐Medium High‐Medium
40.00 40.00 e Poor‐Medium High‐Medium
Geometric Final index 23.26 Poor High 23.23 Poor 23.39 Poor High
a = obtained using Eq. (4.1); b = obtained using Eq. (4.2); c = obtained using Table 4.1; d = obtained using Table 4.2; e = obtained using Table 4.3

Application of West Java Water Sustainability Index 4-60
The sub‐index value of Water Demand is also high, as the water use for different purposes in
the catchment was low compared to the availability of water in the catchment. The percentage
of water use compared to the availability of water in Citanduy in 2008, for example, is
relatively low (3.36%), compared to those of in Citarum (23.04%) and Ciliwung (34.72%). In
spite of 100% sub‐index values for Water Availability and Water Demand, the indicators and
sub‐indicators of Water Quality, Water Loss, Education and Poverty in the Citanduy catchment
show the sub‐index values are below 25 (Poor). These low sub‐index values were also
observed in the Citarum and Ciliwung catchments, and the causes for such low values are
similar (refer to sections 4.4.4 and 4.5.2.1).
4.6.2.2 Robustness Analysis of WJWSI
Similar to the Citarum and Ciliwung catchments, uncertainty and sensitivity analysis were
carried out for the Citanduy catchment based on the uncertainty and sensitivity analysis
scheme using the data of 2008, as described in Section 4.2.3. The outcomes of this analysis of
the Citanduy catchment are presented in Table 4.22, 4.24 and 4.25.
Table 4.22 shows that the coefficients of variation of the sub‐indices for Education and Poverty
are relatively high, compared to those for other indicators and sub‐indicators. Therefore, for
future use, it is important to collect more specific information on the thresholds related to
Education and Poverty, so that uncertainty related to these thresholds and their sub‐index
values can be reduced. In the last column of Table 4.22, it is also shown that the performances
of indicators and sub‐indicators have changed only by 10% or less. This implies that
Performances are not sensitive to changes in their thresholds. The Performance reflects the
condition of issue(s) related to an indicator or sub‐indicator, which was obtained based on the
sub‐index value of an indicator or sub‐indicator.
The sensitivity analysis in relation to the Citanduy catchment was performed using the same
procedures as for previous catchments. The correlation of thresholds and final index value was
analysed. To do this, the correlation coefficients of 10,000 threshold data and 10,000 final
index values resulting from the MC simulation were computed. These correlation values reflect
the effects of changes in thresholds in the final index value. Results of the computation of
correlation coefficients of these two variables are shown in Table 4.23, with significant
correlation coefficients marked with asterisks.

Application of West Java Water Sustainability Index 4-61
Table 4.22 Results of uncertainty analysis for Citanduy catchment
1 2 3 4 5 6 7 8 9
Thresholds
Unit Base Value Mean Standard Deviation
Coefficient of
Variation
Indicators/Sub‐Indicators
Sub‐index valuesUnchanged Performance
(%)
Mean (original values)
Standard Deviation
Coefficient of Variation
Water Availability – Maximum m3/cap/yr 1,700 1,600.0 107.9 0.07 Water Availability
100.0 (100.0)
0.0 0.0 100 Water Availability – Minimum m3/cap/yr 500 533.4 23.6 0.04
Land Use Changes – Maximum % 100 93.3 4.7 0.05 Land Use Change
85.3 (79.9)
4.7 0.1 100 Land Use Changes – Minimum % 0 3.3 2.4 0.71
Water Quality – Maximum ‐ 0 ‐1.0 0.7 0.71 Water Quality
0.0 (0.0)
0.0 ‐
100 Water Quality – Minimum ‐ ‐31 ‐30.0 0.7 0.02
Water Demand – Maximum % 40 40.0 1.7 0.04 Water Demand
98.9 (100)
2.4 0.0 100 Water Demand – Minimum % 10 6.7 2.4 0.36
Coverage – Maximum % 80 80.0 3.2 0.04 Coverage
63.4 (64.6)
2.8 0.0 100 Coverage – Minimum % 0 2.7 1.9 0.71
Water Loss – Maximum % 30 28.3 1.2 0.04 Water Loss
0.0 (0.0)
0.0 ‐
100 Water Loss – Minimum % 15 10.0 3.6 0.36
Education – Maximum % 100 96.7 2.4 0.02 Education
1.5 (5.6)
1.9 1.3 100 Education – Minimum % 0 6.8 4.7 0.70
Poverty – Maximum % 20 20.0 2.0 0.10 Poverty
10.5 (10.2)
7.9 0.8 100 Poverty – Minimum % 0 0.7 0.5 0.71
Health Impact – Maximum (cases/1000
pop) 2
2.0 0.1 0.04 Health Impact
90.8 (87.7)
2.3 0.0
100
Health Impact – Minimum (cases/1000
pop) 0
0.1 0.1 0.71
Sanitation – Maximum % 100 96.6 2.4 0.02 Sanitation
44.3 (46.6)
3.2 0.1 98.92 Sanitation – Minimum % 0 6.6 4.7 0.71Boundary Value of 25
‐ 25 25.1 7.2 0.29
Information Disclosure
37.27 (37.27)
‐ ‐ 98.95
Boundary Value of 50
‐ 50 50.0 7.2 0.14
Governance Structure
35.00 (35.00)
‐ ‐ 89.86
Boundary Value of 75
‐ 75 75.1 7.2 0.10 Law Enforcement 40.00 (40.00)
‐ ‐ 90.26
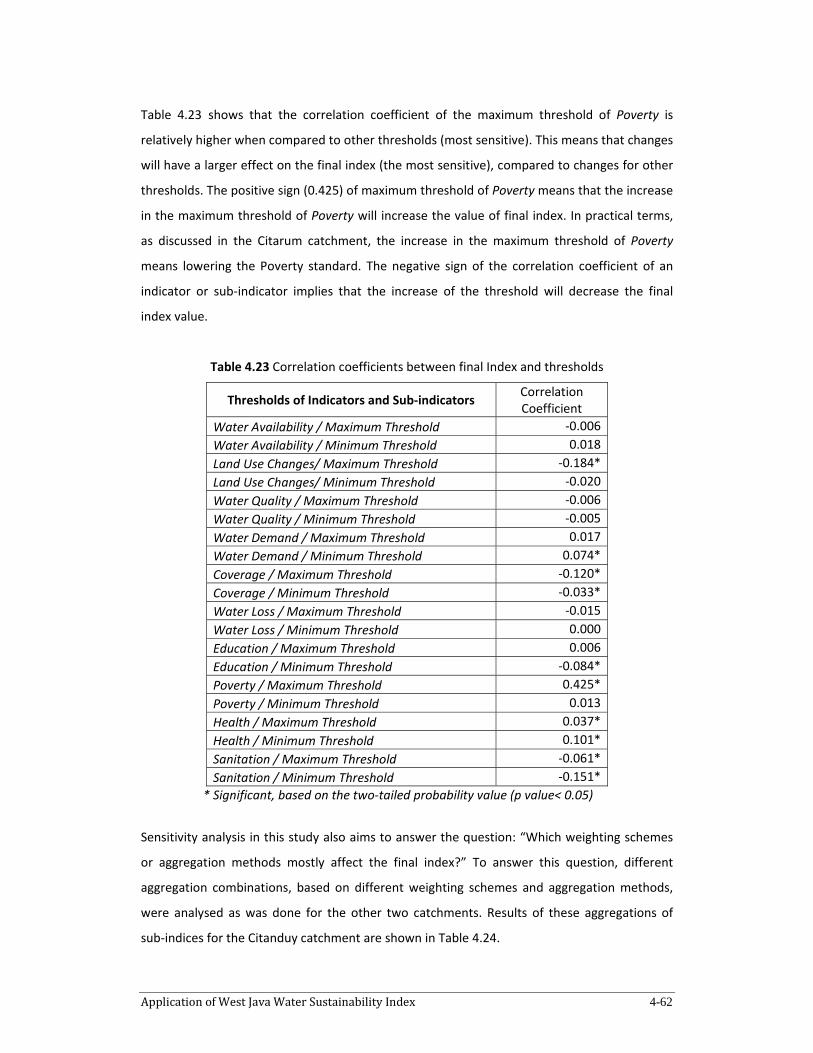
Application of West Java Water Sustainability Index 4-62
Table 4.23 shows that the correlation coefficient of the maximum threshold of Poverty is
relatively higher when compared to other thresholds (most sensitive). This means that changes
will have a larger effect on the final index (the most sensitive), compared to changes for other
thresholds. The positive sign (0.425) of maximum threshold of Poverty means that the increase
in the maximum threshold of Poverty will increase the value of final index. In practical terms,
as discussed in the Citarum catchment, the increase in the maximum threshold of Poverty
means lowering the Poverty standard. The negative sign of the correlation coefficient of an
indicator or sub‐indicator implies that the increase of the threshold will decrease the final
index value.
Table 4.23 Correlation coefficients between final Index and thresholds
Thresholds of Indicators and Sub‐indicators Correlation Coefficient
Water Availability / Maximum Threshold ‐0.006 Water Availability / Minimum Threshold 0.018 Land Use Changes/ Maximum Threshold ‐0.184* Land Use Changes/ Minimum Threshold ‐0.020 Water Quality / Maximum Threshold ‐0.006 Water Quality / Minimum Threshold ‐0.005 Water Demand / Maximum Threshold 0.017 Water Demand / Minimum Threshold 0.074* Coverage / Maximum Threshold ‐0.120* Coverage / Minimum Threshold ‐0.033* Water Loss / Maximum Threshold ‐0.015 Water Loss / Minimum Threshold 0.000 Education / Maximum Threshold 0.006 Education / Minimum Threshold ‐0.084* Poverty / Maximum Threshold 0.425* Poverty / Minimum Threshold 0.013 Health / Maximum Threshold 0.037* Health / Minimum Threshold 0.101* Sanitation / Maximum Threshold ‐0.061* Sanitation / Minimum Threshold ‐0.151*
* Significant, based on the two‐tailed probability value (p value< 0.05)
Sensitivity analysis in this study also aims to answer the question: “Which weighting schemes
or aggregation methods mostly affect the final index?” To answer this question, different
aggregation combinations, based on different weighting schemes and aggregation methods,
were analysed as was done for the other two catchments. Results of these aggregations of
sub‐indices for the Citanduy catchment are shown in Table 4.24.

Application of West Java Water Sustainability Index 4-63
Table 4.24 Aggregation results based on different weighting Schemes and aggregation methods
Scenario Arithmetic Aggregation Method
Geometric Aggregation Method
Changes
Equal weights 46.70 15.48 31.22 Non‐equal weights 45.80 20.25 25.55 Changes 0.90 4.77
Table 4.24 shows that the changes in final index values are due to equal to non‐equal weights
as 0.90 and 4.77 respectively for arithmetic and geometric aggregation methods. The changes
on the final index values from the arithmetic method to the geometric method were 31.22 and
25.55 for equal weights and non‐equal weights respectively. Similar to the results for the other
catchments, these results for the Citanduy catchment show that the aggregation method is
more sensitive to the final index value, compared to the weighting schemes. Therefore, it is
recommended that geometric aggregation method is used, with any weighting scheme, to
aggregate WJWSI indicators and sub‐indicators in future use.
4.6.2.3 Recommendations for Water Authorities
In general, the water sustainability performance of the Citanduy catchment (using the equal
weighting scheme and geometric aggregation method) are considered Poor, with the
aggregated WJWSI value of 23.39 (application in 2008). The highest priority of actions should
be given to indicators with Poor performances, which are Water Quality, Water Loss and
Poverty. If the performances of these indicators are improved to the Poor‐Medium level, the
overall final index value will be improved to Poor‐Medium. It is recommended that water
authorities in the Citanduy catchment take appropriate actions to improve the sub‐index
values of these Poor indicators and sub‐indicators. Some actions are given below, which were
based on data for 2008.
Water Quality
Based on the information provided in Table 4.21, the actual value for Water Quality in the
Citanduy catchment for 2008 was calculated as ‐68.67 (Poor). In order to move from Poor to
Poor‐Medium performance, the actual value of Water Quality needs to be increased from ‐
68.67 to ‐8.06.

Application of West Java Water Sustainability Index 4-64
The low water quality in the Citanduy catchment was mostly caused by improper waste water
discharges from domestic and agricultural practices. This is due to the lack of awareness of the
relevant stakeholders on the importance of the rivers, as well as sustainability of water
resources for future use. To address this issue, similar approaches are recommended to water
authorities in the other two catchments. The West Java EPA, along with other relevant
authorities, should initiate programs to improve awareness. These programs need to have
clear and reasonable targets to be achieved. Along with these programs, the implementation
of laws and regulations related to water quality also need to be re‐enforced. Currently, laws
and regulations on water quality are available, but they are not fully implemented.
Water Loss
The application of WJWSI in the Citanduy catchment, as presented in Table 4.21, shows that
the actual value of Water Loss is 33.70, which is considered Poor in performance. In order to
move from Poor to Poor‐Medium, the average actual value of Water Loss in the Citanduy
catchment needs to be reduced to 18.50%. The actual value will give the sub‐index value of 25,
as the minimum value for Poor‐Medium performance. Similar to the recommendations for the
previous two catchments, reducing the non‐physical losses of all WSPs within the catchment
should be a priority.
Poverty
For the Poverty indicator, the application of the WJWSI in the Citanduy catchment shows that
the actual value of Poverty was 17.97%, which gives the sub‐index value of 10.15. To improve
the performance to the Poor‐Medium level, the actual value should be decreased to at least
14.78%. Similar to the recommendations given to authorities in the Citarum catchment, the
immediate programs to reduce poverty (i.e. ‘direct cash assistance’ and ‘cheap rice’) should be
implemented consistently. Consistent implementation of these programs also includes
government monitoring and/or monitoring by other institutions to ensure that the poor
benefit from these programs. Eventually, this will lead to the reduction of the poverty level in
the catchment.

Application of West Java Water Sustainability Index 4-65
4.7 CORRELATION ANALYSIS OF INDICATORS AND SUB‐INDICATORS
To better understand how some of the indicators and sub‐indicators relate, a correlation
analysis is performed in this study. The analysis is based on the sub‐index values of indicators
and sub‐indicators for 2006 to 2008 in three different catchments. The correlation analysis for
WJWSI indicators and sub‐indicators are based on the Spearman correlation coefficient with a
two‐tailed probability value.
The correlation analysis was undertaken by computing correlation coefficients between sub‐
index values of indicators and sub‐indicators. The values used to compute these correlation
coefficients were the sub‐index values already mentioned for 2006 to 2008. The computation
of the correlation coefficients used SPSS version 19.0 (Field, 2005). The results of the
computation of these correlation coefficients are provided in Table 4.25. Table 4.25 shows that
for some indicators and sub‐indicators, their coefficient correlations are not applicable (N/A).
These indicators and sub‐indicators are Water Quality, Water Loss, Information Disclosure,
Governance Structure, and Law Enforcement. The coefficient correlations for these indicators
and sub‐indicators cannot be computed as their sub‐index values were constant throughout
the analysis.
The correlations of some indicators and sub‐indicators are highlighted in Figures 4.10 and 4.11
(i.e. Poverty and Sanitation, as well as Coverage and Health Impact). The correlation between
Poverty and Sanitation is highlighted as these indicators are significantly correlated with all
other indicators and sub‐indicators. The correlation coefficients of these two indicators with
other indicators and sub‐indicators were high, ranging from 0.8 to 0.982 (as shown in Table
4.25). According to Caldwell (2010), correlation coefficients above 0.8 are considered very
strong. Figure 4.10 illustrates how each data point of the sub‐index values of Poverty is
correlated with each data point of the sub‐index values of Sanitation. The nine data points
show a clear pattern in their relationship.

Application of West Java Water Sustainability Index 4-66
Table 4.25 Correlation coefficients of WJWSI indicators and sub‐indicators
Water Availability
Land Use Changes
Water Quality
Water Demand
Coverage Water Loss
Information Disclosure
Governance Structure
Education Poverty Health Impact
Sanitation Law
Enforcement
Water Availability
1.000 ‐.982* N/A .955* .794 N/A N/A N/A ‐.901* ‐.914* .914* ‐.953* N/A
Land Use Changes 1.000 N/A ‐.908* ‐.791 N/A N/A N/A .953* .949* ‐.949* .953* N/A
Water Quality N/A N/A N/A N/A N/A N/A N/A N/A N/A N/A N/A
Water Demand 1.000 .714 N/A N/A N/A ‐.787 ‐.827* .853* ‐.892* N/A
Coverage 1.000 N/A N/A N/A ‐.728 ‐.800* .617 ‐.879* N/A
Water Loss N/A N/A N/A N/A N/A N/A N/A N/A
Information Disclosure N/A N/A N/A N/A N/A N/A N/A
Governance Structure N/A N/A N/A N/A N/A N/A
Education 1.000 .979* ‐.904* .899* N/A
Poverty 1.000 ‐.883* .929* N/A
Health Impact 1.000 ‐.854* N/A
Sanitation 1.000 N/A
Law Enforcement N/A
* Significant, based on the two‐tailed probability value (p value< 0.05) N/A: Not applicable.

Application of West Java Water Sustainability Index 4-67
In contrast, correlation coefficients for Coverage with other indicators and sub‐indicators were
not statistically significant, except with Poverty and Sanitation. The relationship of the nine
data points for Coverage and Health Impact indicators, as shown in Figure 4.11, is different
from those of Poverty and Sanitation. In the scatter plot for Coverage and Health Impact, there
is no clear pattern of the relationship between their data points, as was observed in the data
points for Poverty and Sanitation.
The above correlation analysis was based only from nine data points, due to the data
availability in West Java catchments. These nine data points were obtained from three
different catchments. For each catchment, three data points were used, reflecting the sub‐
index values of different years.
Due to this limitation on the data points, it is important to be cautious on the results of this
correlation analysis. Nevertheless, the results can be used as starting point for further research
on the correlation of WJWSI indicators and sub‐indicators. In the future, further analysis can
be undertaken with additional data from other catchments (if possible for all 40 catchments in
West Java) for a longer time period. Additional data points to analyse the correlations among
WJWSI indicators and sub‐indicators will increase the accuracy of correlation, shown by
correlation coefficients.
If the correlation analysis with more data points shows strong correlations of some indicators
and sub‐indicators, the reasons for the highly correlated indicators and sub‐indicators should
be investigated. Then, appropriate actions need to be undertaken. For these highly correlated
indicators and sub‐indicators, they can be assigned less weight (compared to other indicators
and sub‐indicators with no significant correlation) during the aggregation to compute the final
index. Also, the weights given based on the correlation can be used as another source of
uncertainty during the robustness analysis of the index. The robustness analysis will then
indicate whether weights obtained from the correlation analysis significantly affect the final
index value.
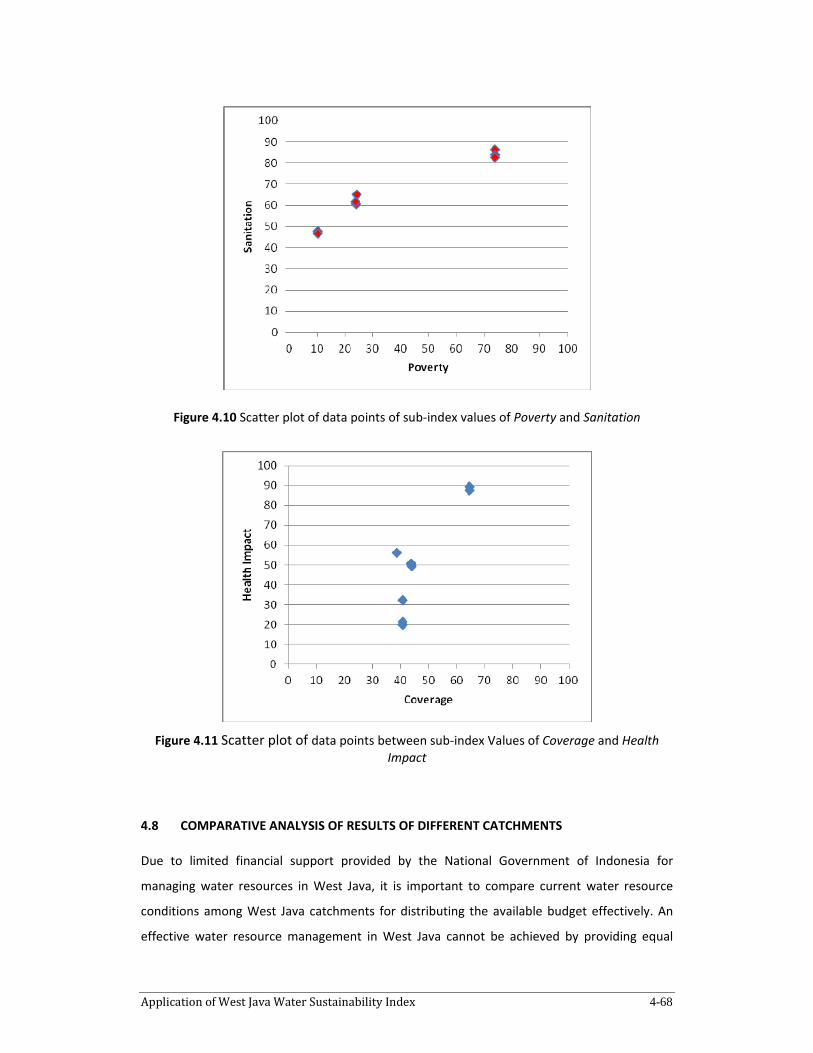
Application of West Java Water Sustainability Index 4-68
Figure 4.10 Scatter plot of data points of sub‐index values of Poverty and Sanitation
Figure 4.11 Scatter plot of data points between sub‐index Values of Coverage and Health
Impact
4.8 COMPARATIVE ANALYSIS OF RESULTS OF DIFFERENT CATCHMENTS
Due to limited financial support provided by the National Government of Indonesia for
managing water resources in West Java, it is important to compare current water resource
conditions among West Java catchments for distributing the available budget effectively. An
effective water resource management in West Java cannot be achieved by providing equal

Application of West Java Water Sustainability Index 4-69
financial support to all catchments. A needs analysis for each catchment is required to
distribute funding appropriately. A comparative analysis of WJWSI applications for different
catchments is one way to provide information on the general conditions of water resources in
each catchment, as well as their specific needs.
A comparative analysis of WJWSI applications for different catchments can also be used to
cluster catchments with similar conditions. The catchment authorities under the same clusters
will be able to share and discuss water resource conditions in their areas, and further develop
programs for the improvement of water resource management. This comparative analysis can
be undertaken, based on final index or sub‐index values. An overview of this comparative
analysis is illustrated in Figure 4.12, where the comparison of sub‐index and final index values
of three West Java catchments is provided, based on applications for 2008.
As can be seen from Figure 4.12 (particularly the final index value), performances for Citarum
and Ciliwung catchments are similar. The final index value of the Citanduy catchment is higher
than the other two catchments. In general, this is because there is less demand in the Citanduy
catchment for various water uses (domestic and industries), due to less population. Thus, with
regard to catchment improvement, the Citarum and Ciliwung catchments should be given
higher priority than the Citanduy catchment. The main improvement for the Citarum and
Ciliwung catchments is to manage growing pressure resulting from various water use activities,
as a consequence of population growth in these catchments.
With regards to sub‐index values, Figure 4.12 shows that, in general, there are similarities
across the three catchments, particularly regarding Water Quality and Water Loss. The causes
for low sub‐index values are also similar in the Citarum and Ciliwung catchments. The low
quality of rivers in West Java is mainly caused by lack awareness of users on the importance of
rivers and sustainability. In addition, river pollution is not adequately handled by relevant
authorities.

Application of West Java Water Sustainability Index 4-70
Figure 4.12 Sub‐index values of three West Java catchments for 2008

Application of West Java Water Sustainability Index 4-71
The other indicators and sub‐indicators with similar performances in these three catchments
are Information Disclosure, Governance Structure and Law Enforcement. The similarity for
these indicators and sub‐indicators is due to centralised management at the provincial level.
As all the catchments are located in the West Java Province, the approach and actions related
to indicators and sub‐indicators are the same.
In the future, comparative analysis can also be carried out in all West Java catchments (40 in
total).
4.9 SUMMARY
The West Java Province is one of the most populated regions in Indonesia, with over 43 million
people in 2010 (more than 20% of the total Indonesian population) and increasing rapidly. The
increase in population has also correspondingly increased the demand for a fresh water
supply. In the last few decades, due to this increased demand, and lack of knowledge on water
resource management and lack of water sustainability awareness, water resources in West
Java have faced serious threats. The most apparent indication is the deterioration of surface
water quality. From 2006 to 2008, the water quality of major rivers in West Java was far below
local and national standards. Another indication of the water problem in West Java is the lack
of fresh water supply to the community. To address these water issues, the West Java
authorities need to properly assess the conditions, and formulate critical water improvement
programs.
The WJWSI was designed to assess current water resource conditions and prioritise water
issues, which can be used by decision makers to design appropriate water improvement
programs. In this chapter, the applications of the WJWSI in three major West Java catchments
were discussed. They were the Citarum, Ciliwung and Citanduy catchments. Each application
discussed sub‐index values of indicators and sub‐indicators and how they were obtained, the
aggregation of indicators and sub‐indicators, the robustness analysis of the index, the
application of the index for different years, and finally, recommendations to water authorities.
The main recommendations related to the performance of indicators and sub‐indicators in
respective catchments, based on the applications of the WJWSI for 2006 to 2008. It strongly
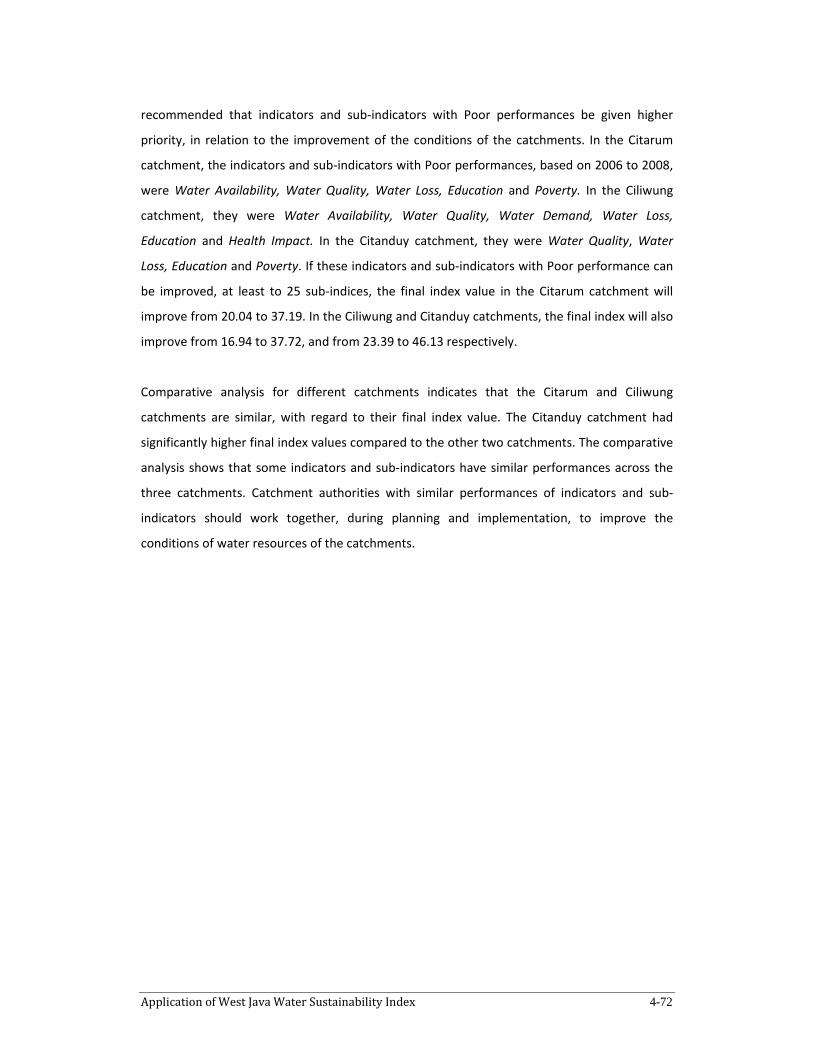
Application of West Java Water Sustainability Index 4-72
recommended that indicators and sub‐indicators with Poor performances be given higher
priority, in relation to the improvement of the conditions of the catchments. In the Citarum
catchment, the indicators and sub‐indicators with Poor performances, based on 2006 to 2008,
were Water Availability, Water Quality, Water Loss, Education and Poverty. In the Ciliwung
catchment, they were Water Availability, Water Quality, Water Demand, Water Loss,
Education and Health Impact. In the Citanduy catchment, they were Water Quality, Water
Loss, Education and Poverty. If these indicators and sub‐indicators with Poor performance can
be improved, at least to 25 sub‐indices, the final index value in the Citarum catchment will
improve from 20.04 to 37.19. In the Ciliwung and Citanduy catchments, the final index will also
improve from 16.94 to 37.72, and from 23.39 to 46.13 respectively.
Comparative analysis for different catchments indicates that the Citarum and Ciliwung
catchments are similar, with regard to their final index value. The Citanduy catchment had
significantly higher final index values compared to the other two catchments. The comparative
analysis shows that some indicators and sub‐indicators have similar performances across the
three catchments. Catchment authorities with similar performances of indicators and sub‐
indicators should work together, during planning and implementation, to improve the
conditions of water resources of the catchments.

Conclusions and Recommendations 5‐1
Chapter 5
Summary, Conclusions and Recommendations
5.1 SUMMARY
The emergent studies on sustainability will be less useful if methods to measure sustainability
are not available. Therefore, studies on these methods are essential. One of the approaches to
measure sustainability is the indicator‐based sustainability assessment. Using this approach,
sustainability is measured through the assessment of a set of identified indicators (and sub‐
indicators). In the past decade, studies on the use of indicators to measure sustainability of
various fields have been carried out. This includes the indicator‐based assessment on water
resources.
To develop an indicator‐based sustainability assessment on water resources, a review on the
sustainability definitions and principles is essential. Comprehensive understanding on these
definitions and principles will provide a strong basis in the selection of indicators of water
resource sustainability. In this study, sustainability definitions and principles from various
researchers were presented and reviewed. Then, to specifically address the issue of water
resources, some definitions, criteria and guidelines on sustainable water resource management
were analysed. These definitions, criteria and guidelines have provided valuable inputs on the
identification of water sustainability indicators.
In the recent past, there have been studies on developing indicator‐based sustainability
assessment on water resources, such as Water Poverty Index (WPI), Canadian Water
Sustainability Index (CWSI) and Watershed Sustainability Index (WSI). In this study, elements of
these three existing indices were reviewed. In each index, the review includes the selection of
components and indicators, method to obtain sub‐index values, weighting and aggregation
methods, and finally the interpretation of the final index.

Conclusions and Recommendations 5‐2
To compare these existing water sustainability indices with indices in other areas, the Human
Development Index (HDI) and Environmental Sustainability Index (ESI) were also reviewed in this
study. Together, the review on the sustainability definitions and principles, the sustainable
water resource management definitions, criteria and guidelines, and the existing indices have
provided a strong basis that underpinned the development of WJWSI.
The main tasks for developing WJWSI were the design of the conceptual framework, the
application of Delphi technique and the in‐depth interview. The conceptual framework was
designed to identify an initial set of components, indicators and thresholds of WJWSI. To identify
the components and indicators of the conceptual framework of WJWSI, the followings (as
discussed in the previous sub‐section) were considered:
- Sustainability definitions and principles
- Sustainable water resource definitions, criteria and guidelines
- Existing water sustainability indices (i.e. WPI, CWSI and WSI)
Once the components and indicators were identified, thresholds of the indicators were sought
from local and national policies and regulations in Indonesia. If they were not available,
thresholds that have been widely used globally were adopted. Then, to refine the conceptual
framework, the Delphi technique was used. In this study, two rounds of questionnaire
distributions were undertaken. The questionnaires were distributed to water‐related
stakeholders in West Java, selected from the following categories: university lecturers,
government officials, environmental consultants, and community groups.
The stakeholders from these categories were asked their agreement on the provided
components, indicators and thresholds. In addition, they were also allowed to make changes on
the components, indicators and thresholds. After two rounds of questionnaire distributions,
consensus was reached for all the components and most of the indicators. The respondents in
the Delphi application were not confident about most of the thresholds as the information on
these thresholds was not available.
After the application of the Delphi technique, an in‐depth interview with key stakeholders was
undertaken to finalise the components, indicators and thresholds of the indicators. These key
stakeholders discussed components, indicators and thresholds that have not been agreed by the

Conclusions and Recommendations 5‐3
respondents during the two rounds of questionnaire distributions. After the interview, these key
stakeholders agreed on all the components, indicators and most of the thresholds to be
included in the final framework of WJWSI. Once the framework was finalised, it was then
applied in three selected West Java catchments.
The applications of WJWSI in three selected catchments have provided valuable information on
the current conditions of water resource performances in the respective catchments. In each
catchment, the following information was obtained:
- Sub‐index values of indicators and sub‐indicators
- Aggregated index value
- Analysis of robustness of the index
The robustness analysis of WJWSI was undertaken by performing uncertainty and sensitivity
analysis of the index based on the data for Citarum, Citanduy and Ciliwung catchments of 2008.
Results of the robustness analysis indicated that the recommended aggregation method to
aggregate indicators and sub‐indicators was the geometric aggregation method. If other
aggregation method(s) is preferred, users of the index should be aware of significant changes
that might occur in the final index.
5.2 CONCLUSIONS
The main objective of the study was to develop a water sustainability index for West Java,
Indonesia, as an attempt to address the lack of tools for obtaining the information on current
water resource conditions in the province. The index was also expected to be used to prioritise
water issues and to communicate the water issues with wider community. These objectives
were achieved in this study. A new water sustainability index was developed, and it has been
applied to three different catchments in West Java.
The following sub‐sections present major conclusions of the study. They are presented under
different headings: conceptual framework of WJWSI, the use of Delphi technique, in‐depth
interview with selected key stakeholders, weights for indicators and sub‐indicators, and
correlations of indicators and sub‐indicators.

Conclusions and Recommendations 5‐4
5.2.1 Conceptual Framework of WJWSI
In this study, the conceptual framework of WJWSI, which was developed prior to the Delphi
application, was found useful in assisting the respondents to identify WJWSI components,
indicators and thresholds. The conceptual framework helped the respondents to understand the
main issues of water resource management in West Java, and eventually to provide their
opinions and ideas on identification of WJWSI components, indicators and sub‐indicators, and
thresholds.
5.2.2 The Use of Delphi Technique
As in previous applications of Delphi technique in various disciplines, the Delphi technique used
in this study has provided numerous benefits when it was used to refine the conceptual
framework of WJWSI. The main benefit from the use of Delphi technique in this study was the
ability of the technique to obtain ideas and opinions from a wider range of water stakeholders in
West Java without having the stakeholders to congregate at one time and place. This has
resulted in an effective time management of the overall management of this study.
The other benefit from the use of this technique was that the respondents of the Delphi
applications had the opportunity to review and refine their answers provided in Round One of
questionnaire distribution. As the responses of Round One were provided in the beginning of
Round Two, respondents were able to analyse the answers of other respondents (along with
their justifications) and were more confident to provide their answers in Round Two. This
process has contributed to the convergence of respondents’ answers in Round Two.
5.2.3 In‐depth Interview with Selected Key Stakeholders
The in‐depth interview with the key stakeholders was found to be an effective way of finalising
the components, indicators and sub‐indicators, and most of the thresholds. For some thresholds
that have not been agreed, valuable inputs were obtained from the discussions with these
stakeholders. These valuable inputs were then used to finalise the remaining thresholds, later in
this study. In the process of finalising these components, indicators and sub‐indicators, and
majority f the thresholds, these stakeholders were able to identify indicators and sub‐indicators
to be removed or replaced in the overall framework.

Conclusions and Recommendations 5‐5
5.2.4 Weights for Indicators and Sub‐indicators
The weights of WJWSI indicators and sub‐indicators were obtained based on the input from
water‐related stakeholders in West Java. The stakeholders participated in this part of the study
were a subset of the stakeholders participated in the Delphi technique application. After the
calculation of weights using the Revised Simos’ procedure, it was revealed that there were
significant difference on weights among the indicators and sub‐indicators. It is concluded that
even though the stakeholders agreed on the indicators and sub‐indicators, these stakeholders
have different preferences on some indicators and sub‐indicators.
This is supported by the results of weighting groups based on the categories of stakeholders.
The results of the weighting groups showed that the Community Group and University Lecturer
have contradictory responses on several indicators and sub‐indicators. Therefore, it is important
to note (again) that the involvement of wide range of stakeholders in a study on water resource
management is essential, due to different views that those stakeholders have.
In this study, the different weights given by the stakeholders were used in the robustness
analysis of the index, which aimed to analyse whether the non‐equal weights given by the
stakeholders significantly affect the final index value. The robustness analysis showed that the
weighting scheme was not sensitive to the final index value. Therefore, for future use of the
WJWSI, either the equal or non‐equal weighting scheme can be used.
5.2.5 Uncertainty and Sensitivity of the Index
The uncertainty analysis on the index, undertaken in this study, was able to identify the sources
of uncertainty in developing WJWSI, which included:
- Thresholds of indicators and sub‐indicators
- Weighting schemes
- Aggregation methods
The uncertainty analysis on the three catchments, as part of the applications of WJWSI in this
study, has indicated that changes in the thresholds of WJWSI indicators and sub‐indicators have
not significantly affected the sub‐index values of most indicators and sub‐indicators. In the
Citarum catchment, for example, only the sub‐index value of Water Availability was affected
significantly by the changes in its thresholds. In consequence, if water authorities (or other users

Conclusions and Recommendations 5‐6
of the index) in the Citarum catchment preferred different thresholds for this indicator, the
index users need to be aware of the possible significant changes on the sub‐index value of the
indicator.
Based on the sensitivity analysis in the three catchments, for future use of the aggregation of
WJWSI indicators and sub‐indicators, either the equal or non‐equal weighting scheme can be
used. As shown in the sensitivity analysis, the changes on the weighting schemes will not
significantly affect the final index.
The sensitivity analysis on the three catchments has also showed that the final index values
were most sensitive to the aggregation methods compared to the weighting schemes or
threshold values. In this study, the recommended aggregation method to aggregate indicators
and sub‐indicators was the geometric aggregation method. The geometric aggregation method
is recommended to be used for WJWSI over the arithmetic aggregation method. Using the
geometric method, the differences in the sub‐index values of WJWSI indicators and sub‐
indicators are taken into account. Poor indicator performances, shown by the low sub‐index
values, will be reflected in the aggregated index value. In contrast, when using the arithmetic
aggregation method, poor indicator performances will not be reflected in the aggregated index
value if other indicators perform well. If other aggregation method(s) is preferred, users of the
index should be aware of significant changes that might occur in the final index.
5.2.6 Correlations of Indicators and Sub‐indicators
The correlation analysis on the WJWSI indicators and sub‐indicators was based on the sub‐index
values of the indicators and sub‐indicators in the three catchments (i.e. Citarum, Ciliwung and
Citanduy) during the period of years 2006 to 2008. The correlation analysis was based from nine
data points, due to the data availability in West Java catchments. These nine data points were
obtained from three different catchments. For each catchment, three data points were used,
reflecting the sub‐index values of different years. Due to this limitation on the data points, it is
important to be cautious on the results of this correlation analysis.
Using the nine data points, it was found that most of the indicators and sub‐indicators were
correlated. However, it is recommended to water authorities in West Java (as well as to users of
the WJWSI) to further study the correlations among the indicators and sub‐indicators using
Conclusions and Recommendations 5‐7
more data points for the sub‐index values. The 9 data points used in this study to compute the
correlation coefficients might not reflect the actual correlations among the indicators and sub‐
indicators.
If the correlation analysis with more data points shows strong correlations of some indicators
and sub‐indicators, appropriate actions need to be undertaken. For these highly correlated
indicators and sub‐indicators, they can be assigned less weight (compared to other indicators
and sub‐indicators with no significant correlation) during the aggregation to compute the final
index. Then, the weights given based on the correlation can be used as one source of
uncertainty during the robustness analysis of the index. The robustness analysis will then
indicate whether weights obtained from the correlation analysis significantly affect the final
index value.
5.3 RECOMMENDATIONS TO WATER AUTHORITIES
The water authorities in West Java can be benefited from both the development of WJWSI and
the results of WJWSI applications in the three catchments. The water authorities in West Java
are now able to understand how a water sustainability index is developed, and make necessary
modifications (if required). Results from the applications of WJWSI have provided information
on the current conditions of water resource in each study catchment, which can be regularly
monitored by the water authorities, as well as by general public. The applications of WJWSI in
this study also proposed relevant programs to the water authorities, which can be used to
improve the performance of the water resources in each catchment.
In addition, based on the results of the applications, the provincial government of West Java is
now able to compare the water resource performances of these three catchments in West Java,
and take appropriate actions to improve the performances of the catchments. In the future, the
comparison of different catchments can be extended to all catchments in West Java.
In general, the applications of WJWSI in three selected catchments have provided valuable
information on the current conditions of water resource performances to respective water
authorities. The sub‐index values of indicators and sub‐indicators, obtained through the
applications of WJWSI in different catchments, were able to inform water authorities in West
Java about the conditions of water resources, related to each of the indicator or sub‐indicator.

Conclusions and Recommendations 5‐8
The applications of WJWSI in different catchments have also indicated water resource issues
that needed higher priority, due to poor performances of relevant indicators and sub‐indicators.
The final index values for the three catchments obtained in this study were used to analyse the
overall conditions of water resource management in the three catchments. The final index
values of the catchments were also used to compare the performances of the three catchments.
With the information on the performances of different catchments, water authorities at the
provincial level are now able to identify catchments that need higher priorities, and to allocate
more funding on these catchments so that they can improve their catchment performances.
The information on the sub‐index values of indicators and sub‐indicators, as well as the final
index values, of the three different catchments in this study can also be used by water
authorities in respective catchments to communicate the water resource conditions to the
community. The final index and sub index values of WJWSI can be easily understood by the
general public and as they become aware of the water conditions in their respective
catchments, they are expected to participate in programs to improve the water resource
conditions.
More specific recommendations to water authorities in three different catchments are
presented in the following sub‐sections:
5.3.1 The Citarum Catchment
The Citarum catchment is the largest catchment in the West Java Province. It has a significant
contribution to the development of the province, as well as to the Jakarta Province. The
application of WJWSI in the Citarum catchment showed that several indicators and sub‐
indicators performed poorly. Overall results indicate that water resource performance in the
catchment is Poor.
To improve the water resource performance of the catchment, it is recommended that water
authorities take immediate actions on the indicators and sub‐indicators that are Poor in their
performances. These indicators and sub‐indicators are: Water Availability, Water Quality, Water
Loss, Education and Poverty. The improvement of these poorly‐performed indicators and sub‐

Conclusions and Recommendations 5‐9
indicators is important to ensure that none of the indicators and sub‐indicators having the sub‐
index value below 25.
The uncertainty analysis on the Citarum catchment showed that changes in the thresholds of
WJWSI indicators and sub‐indicators have not significantly affected the sub‐index values of most
indicators and sub‐indicators. For the Citarum catchment, only the sub‐index value of Water
Availability was affected significantly by the changes in its thresholds. In consequence, if water
authorities (or other users of the index) in the Citarum catchment preferred different thresholds
for this indicator, the index users need to be aware of the possible significant changes on the
sub‐index value of the indicator.
The sensitivity analysis of the index was performed to analyse the effect of the upper and lower
values of the thresholds on the final index values. It was done by analysing the correlation
between the changes on the thresholds and the final index values. The correlation analysis
showed that several thresholds of indicators and sub‐indicators had statistically significant
correlation with the final index. It means that for these indicators and sub‐indicators, changes
on the thresholds will significantly change the final index. However, for these indicators and sub‐
indicators, changes on their thresholds will have low impact to the final index value as the
correlation coefficient was low (ranging from 0.043 to 0.520).
5.3.2 The Ciliwung Catchment
The Ciliwung Catchment was selected as one of the case study catchments due to its importance
for the national development of Indonesia. The main river of the catchment, the Ciliwung River,
flows across two provinces: the West Java and Jakarta provinces. This catchment is the most
densely‐populated catchment in West Java.
The application of WJWSI in the Ciliwung catchment showed that the overall performance of the
catchment is Poor. Indicators and sub‐indicators with Poor performances are Water Availability,
Water Quality, Water Demand, Water Loss, Education and Health Impact. Similar to the Citarum
catchment, it is recommended that water authorities in the Ciliwung catchment take immediate
actions to improve the poorly‐performed indicators and sub‐indicators.

Conclusions and Recommendations 5‐10
The uncertainty analysis of WJWSI indicated that coefficients of variation of the maximum and
minimum thresholds of the indicators and sub‐indicators were compensated each other, as
shown in the coefficients of variation of the sub‐index values of their respective indicators and
sub‐indicators. The coefficient of variations of sub index values for some indicators and sub‐
indicators cannot be analysed as their sub‐index values were calculated as 0 throughout the
simulations. These indicators and sub‐indicators were Water Availability, Water Quality and
Water Loss.
Similar to the sensitivity analysis based on the data of the Citarum catchment, the sensitivity
analysis of the index was also performed based on the data of the Citanduy catchment. It was
done by analysing the correlation between the changes on the thresholds and the final index
values. The correlation analysis showed that only the maximum threshold of Education had
statistically significant correlation with the final index. It means that for most indicators and sub‐
indicators, changes on the thresholds will not significantly change the final index. Even for the
maximum threshold of Education, changes on its thresholds will have low impact to the final
index value as the correlation coefficient was very low (‐0.03).
5.3.3 The Citanduy Catchment
The population in the Citanduy catchment is less dense compared to the other two catchments
(i.e. Citarum and CIliwung catcments). However, in terms of the catchment size, the Citanduy
catchment is the second largest catchment in the province, next to the Citarum catchment.
Application of WJWSI in the Citanduy catchment indicated that the overall performance of the in
the catchment was Poor‐Medium. The indicators that performed poorly are Water Quality,
Water Loss, Education and Poverty. Similar to recommendations related to the previous two
catchments, these indicators and sub‐indicators need to be improved to reach their basic
standards (the sub‐index value of 25).
In the Citanduy catchment, the uncertainty analysis on WJWSI showed that coefficients of
variation of the sub‐index values for Education and Poverty were high. Similar to the previous
two catchments, the sensitivity analysis of the index was also performed using the data of the
Citanduy catchment. It was done by analysing the correlation between the changes on the
thresholds and the final index values. The correlation analysis showed that several thresholds of

Conclusions and Recommendations 5‐11
indicators and sub‐indicators had statistically significant correlation with the final index.
However, for these indicators and sub‐indicators, changes on their thresholds will have low
impact to the final index value as the correlation coefficient was low (ranging from 0.033 to
0.425).
5.4 RECOMMENDATIONS FOR FURTHER RESEARCH
One of the main elements of the WJWSI is the thresholds. These thresholds are based on
policies, regulations and relevant studies available in Indonesia and internationally at the time of
developing WJWSI. Due to the growing studies on the issues related to these thresholds, it is
important to renew these thresholds based on current studies. For WJWSI, thresholds based on
the studies in Indonesia are more preferred than studies in other countries. The thresholds for
Water Availability can be used as the example. In this study, the thresholds for this indicator
were based on research from other countries, as this information for Indonesia was not
available. It will be very useful if a study on the amount of fresh water needed by one person per
year is conducted in Indonesia, in the near future. Such results can be used as the thresholds of
the Water Availability indicator in WJWSI. Thus, the users of WJWSI are recommended to be
aware of current studies, and (when applicable) include the information for thresholds of WJWSI
indicators and sub‐indicators.
With regards to questionnaire distributions, in this study, two questionnaire distributions were
undertaken to obtain respondents’ responses on the components, indicators and thresholds.
Then, after few months, a survey was undertaken to obtain the information on the weights of
the indicators and sub‐indicators. It was found that this survey could have been included in the
questionnaire distributions undertaken earlier. Combining the survey on weights and
questionnaire distributions together would have resulted in more effective time management.
Therefore, if similar studies are undertaken in the future, the survey for obtaining the weights
should be included in the questionnaire distributions.
Another area for improvement of the study was found during the application of WJWSI in three
West Java catchments. In this study, WJWSI was applied in the catchments based on data of
2006‐2008, as data for some indicators was available only from 2006. In future applications,
longer time series for WJWSI indicators and sub‐indicators can be applied. The longer time
series of data in the applications will allow the index users to better analyse the trend of water

Conclusions and Recommendations 5‐12
resource performance (both individual sub‐index values of indicators and sub‐indicators, as well
as the final index values) during the available time period.
For applying the WJWSI to water disaster prone areas, the list of indicators, the threshold values
and weighting preferences of the stakeholders on the indicators will need to be revised. For
instance, if WJWSI is going to be applied in a flood prone area, the list of indicators should be
reviewed to include flood‐related indicators, such as water infrastructure, emergency measures
and procedures, etc. If needed, another Delphi questionnaire or other methods can be
employed to develop a new set of indicators for the index. The threshold values of the revised
set of indicators should also be carefully identified. Few threshold values of existing indicators
(such as Land Use Change, Information Disclosure, Government Structure and Law Enforcement)
should also be reviewed for modifications, to include the flood‐related issues.
Finally, it is also important to note that this water sustainability index has the potential for
applications in other provinces in Indonesia. The index users in other provinces might consider
reviewing the components, indicators and thresholds of the WJWSI as they might not be
completely relevant to the characteristics of water resources in the respective provinces.
Considering the importance of stakeholder participation in the water sustainability, it is
important to ensure that the review on the components, indicators and thresholds is
undertaken through the involvement of relevant water‐related stakeholders in the respective
provinces.

References 6‐1
REFERENCES
Alexandrov, A. V., Pullicino, P. M., Meslin, E. M., & Norris, J. W. (1996). Agreement on disease‐specific criteria for do‐not‐resuscitate orders in acute stroke. Stroke, 27(2), 232‐237.
Anand, S., & Sen, A. (1994). Human development index: methodology and measurement Retrieved 11 November, 2010, from http://economics.ouls.ox.ac.uk/14287/
Annells, M., & Australian Institute of Nursing Research. (1997). An inquiry of research priorities in nursing and midwifery in South Australia using a Delphi technique: report. Adelaide: Australian Institute of Nursing Research.
Antle, J. M., & Stoorvogel, J. J. (2008). Agricultural carbon sequestration, poverty, and sustainability. Environment and Development Economics, 13(03), 327‐352.
Asdep Standardisasi. (2008). Menuju eco province (Towards the eco province) Retrieved 16 May, 2011, from http://www.menlh.go.id/home/index.php?Itemid=73&catid=43%3Aberita&id=3451%3AWAKIL‐GUBERNUR‐JAWA‐BARAT%3A‐MENUJU‐%5C%22ECO‐PROVINCE%5C%22&lang=id&option=com_content&view=article
Ashley, R., Blackwood, D., Butler, D., & Jowitt, P. (2004). Sustainable water services. London: IWA Publishing.
Atkinson, G., Dietz, S., & Neumayer, E. (2007). Handbook of sustainable development. Northampton, Massachusetts: Edward Elgar.
Auditan. (2006). Mengenal Auditan (Introducing Auditan organisation) Retrieved 14 April, 2011, from http://www.antikorupsi.org/docs/profilauditan.pdf
Badan Pengendalian Lingkungan Hidup Daerah Jabar. (2008). Era Prokasih Jawa Barat (West Java clean river program) Retrieved 7 February 2008, from http://www.bplhdjabar.go.id/emplibrary/buletin‐akhir.doc
Bappeda Team. (2004). Kebijakan pengelolaan sumberdaya air di SWS Ciliwung‐Cisadane untuk mengatasi krisis air Jakarta Retrieved 15 May 2011, from air.bappenas.go.id/main/doc/pdf/makalah/Makalah%20Ciliwung.pdf
Bappeda Team. (2008). Profil Jawa Barat: pendidikan (Profile of West Java: education). Bandung: Badan Perencanaan dan Pembangunan Daerah Jawa Barat.
Barbier, E. B. (1987). The concept of sustainable economic development. Environmental Conservation (Suiza), 14(2), 101‐110.
Bardecki, M. J. (1984). Participants’ response to the Delphi method: an attitudinal perspective. Technological Forecasting and Social Change, 25(28), 281‐292.
Bayley, E. W., MacLean, S. L., Desy, P., & McMahon, M. (2004). CE ENA's Delphi study on national research priorities for emergency nurses in the United States. Journal of Emergency Nursing, 30(1), 12.
Best, R. J. (1974). An experiment in Delphi estimation in marketing decision making. Journal of Marketing Research (JMR), 11(4), 448‐452.
Boje, D. M., & Murnighan, J. K. (1982). Group confidence pressures in iterative decisions. Management Science, 28(10), 1187‐1197.
BPS Team. (2009). Annual BPS report: poverty. Bandung: Badan Pusat Statistika Jawa Barat. Brouwer, W., Oenema, A., Crutzen, R., de Nooijer, J., de Vries, N. K., & Brug, J. (2008). An
exploration of factors related to dissemination of and exposure to internet‐delivered behavior change interventions aimed at adults: a Delphi study approach. Journal of Medical Internet Research, 10(2), e10.
Brundtland, G. H. (1987). Our common future / World Commission on Environment and Development. Oxford: Oxford University Press

References 6‐2
Butler, D., Jowitt, P., Ashley, R., Blackwood, D., Davies, J., Oltean‐Dumbrava, C., et al. (2003). SWARD: decision support processes for the UK water industry. Management of Environmental Quality, 14(4), 444‐459.
Cahyono, A. D. (2007). PDAM melayani 66% penduduk kota tahun 2009 (Water service company is expected to cover 66% of water distribution in 2009) Retrieved 10 February, 2009, from http://www.perpamsi.org/news/2007/12_des/Des_03.htm
Caldwell, S. (2010). Statistics unplugged (3rd ed.). Belmont, California: Wadsworth Cengage Learning.
Carson, R. (1962). Silent spring. Greenwich: Fawcett Publications. Chang, W. L., Lo, Y. P., & Hong, Y. T. (2009). A Heuristic model of network‐based group decision
making for e‐services. Paper presented at the 2009 Sixth International Conference on Information Technology New Generations, Las Vegas.
Chaves, H., & Alipaz, S. (2007). An integrated indicator based on basin hydrology, environment, life, and policy: the Watershed Sustainability Index. Water Resources Management, 21(5), 883‐895.
Cherchye, L., Moesen, W., Rogge, N., Van Puyenbroeck, T., Saisana, M., Saltelli, A., et al. (2007). Creating composite indicators with DEA and robustness analysis: the case of the Technology Achievement Index. Journal of the Operational Research Society, 59(2), 239‐251.
Clemen, R., & Reilly, T. (2001). Making hard decisions with decision tools. Pacific Grove, California Duxbury Press.
Cooke, M., Beavon, D., & McHardy, M. (2004). Measuring the well‐being of Aboriginal people: an application of the United Nations human development index to registered Indians in Canada, 1981–2001. Aboriginal policy research: setting the agenda for change, 1, 47–70.
Corty, E. (2007). Using and interpreting statistics : a practical text for the health, behavioral, and social sciences. St. Louis, Missouri: Mosby Elsevier.
Cude, C. G. (2001). Oregon water quality index: a tool for evaluating water quality management effectiveness. Journal of the American Water Resources Association, 37(1), 125‐138.
Cui, Y., Hens, L., Zhu, Y., & Zhao, J. (2004). Environmental sustainability index of Shandong Province, China. International Journal of Sustainable Development and World Ecology, 11(3), 227‐233.
Delbecq, A. L., Ven, A. H. V. d., & Gustafon, D. H. (1975). Group techniques for program planning: a guide to nominal group and Delphi processes. Illinois: Glenview.
Dinas Pertanian Jawa Barat. (2011). Iklim dan curah hujan Jawa Barat (West Java's climate and rainfall) Retrieved 17 May, 2011, from http://diperta.jabarprov.go.id/index.php/subMenu/444
Dinius, S. H. (2007). Design of an index of water quality. Journal of the American Water Resources Association, 23(5), 833‐843.
Djamal, I., Ali, F., Nugroho, R., Kretarto, A., & Utami, R. (2009). Memahami (untuk mengatasi) kehilangan air PAM Jakarta (Understanding water losses at water service provider of Jakarta) Retrieved 23 May, 2008, from http://www.jakartawater.org/images/stories/waterloss.pdf
Dunham, R. B. (1998). Organisational behaviour: The Delphi technique. Wisconsin: University of Wisconsin.
Ebert, U., & Welsch, H. (2004). Meaningful environmental indices: a social choice approach. Journal of Environmental Economics and Management, 47(2), 270‐283.
Ediger, V. S., Hosgor, E., Surmeli, A. N., & Tatlidil, H. (2007). Fossil fuel sustainability index: An application of resource management. Energy policy, 35(5), 2969‐2977.

References 6‐3
Ekins, P., Simon, S., Deutsch, L., Folke, C., & De Groot, R. (2003). A framework for the practical application of the concepts of critical natural capital and strong sustainability. Ecological Economics, 44(2‐3), 165‐185.
Erker, R. S. (2003). Environmental sustainability in Slovenia: Institute for Economic Research. Esty, D. C., Levy, M., Srebotnjak, T., & de Sherbinin, A. (2005). Environmental sustainability
index: benchmarking national environmental stewardship (pp. 102). New Haven, Connecticut: Yale University.
Falkenmark, M., Lundqvist, J., & Widstrand, C. (1989). Macro‐scale water scarcity requires micro‐scale approaches. Natural Resources Forum, 13(4), 258‐267.
Falkenmark, M., & Rockström, J. (2004). Balancing water for humans and nature: the new approach in ecohydrology. London: Earthscan.
Farsari, Y., & Prastacos, P. (2002). Sustainable development indicators: an overview. Hellas: Foundation for the Research and Technology.
Febrian, R., Srihartini, R., & Sutisna, N. (2004). Bila waduk jadi kubangan sampah (when dams become landfill) Retrieved 10 February, 2009, from http://majalah.tempointeraktif.com/id/arsip/2004/09/27/LIN/mbm.20040927.LIN89957.id.html
Field, A. (2005). Discovering statistics using SPSS (3rd ed., pp. 821). London: SAGE Publications. Figueira, J., & Roy, B. (2002). Determining the weights of criteria in the ELECTRE type methods
with a revised Simos' procedure. European Journal of Operational Research, 139(2), 317‐326.
Fontana, M., Morais, D., & de Almeida, A. (2011). A MCDM Model for Urban Water Conservation Strategies Adapting Simos Procedure for Evaluating Alternatives Intra‐criteria. In R. Takahashi, K. Deb, E. Wanner & S. Greco (Eds.), Evolutionary Multi‐Criterion Optimization (pp. 564‐578). Heidelberg: Springer Berlin.
Foxon, T.J., G. McIlkenny, D. Gilmour, C. Oltean‐Dumbrava, N. Souter, R. Ashley, D. Butler, P. Pearson, P. Jowitt & J. Moir, (2002), Sustainability criteria for decision support in the UK water industry. Journal of Environmental Planning and Management, 45(2), 285‐301.
Franklin, K. K., & Hart, J. K. (2007). Idea generation and exploration: benefits and limitations of the Policy Delphi research method. Innovative Higher Education, 31(4), 237‐246.
Frick, M. J. (1993). Developing a national framework for a middle school agricultural education curriculum. Journal of Agricultural Education, 34(2), 77‐84.
Gandapurnama, B. (2008). 6 rumah jebol diterjang banjir Bandung, korban bingung (6 houses were destroyed by flood in Bandung). Media Centre Newspaper Online. Retrieved from http://www.mediacenter.or.id/news/33/tahun/2008/bulan/01/tanggal/30/id/3159/
Ginting. (2007, 7 February 2008). Ingat katulampa ingat Jakarta kebanjiran (Remember katulampa flooding, remember Jakarta flooding). Sinar Harapan Retrieved 2 April, 2011, from http://www.sinarharapan.co.id/berita/0711/07/jab04.html
Giuppponi, C., Jakeman, A. J., Karrssenberg, D., & Hare, M. P. (2006). Sustainable management of water resources. Massachusetts: Edward Elgar Publishing Limited.
Gondowarsito, R. (1986). Transmigrasi bedol desa: an empirical study of inter‐island village resettlement in Indonesia. PhD, Universitat Bielefeld., Bielefeld.
Gondowarsito, R. (1990). Transmigrasi bedol desa: inter‐island village resettlement from Wonogiri to Bengkulu. Bulletin of Indonesian Economic Studies, 26(1), 48‐68.
Gravetter, F. J., & Wallnau, L. B. (2011). Essentials of statistics for the behavioral sciences (7th ed.). Belmont, California: Wadsworth.
GWP‐TAC. (2000). Integrated water resources management Retrieved 12 November, 2008, from

References 6‐4
http://www.gwptoolbox.org/index.php?option=com_content&view=article&id=8&Itemid=3
Haq, M. (1989). People in development. New York, New York: Bootstrap Press Harding, R. (2002). Environmental decision making. Sydney: The Federation Press. Hardy, D. J., O'Brien, A. P., Gaskin, C. J., O'Brien, A. J., Morrison‐Ngatai, E., Skews, G., et al.
(2004). Practical application of the Delphi technique in a bicultural mental health nursing study in New Zealand. Journal of Advanced Nursing, 46(1), 95‐109.
Harvey, A., & Koopman, S. J. (2000). Signal extraction and the formulation of unobserved components models. Econometrics Journal, 3(1), 84‐107.
Hasibuan, A. S. (2005). Pengembangan kebijakan pengelolaan daerah aliran sungai bagian hulu untuk efektivitas waduk: studi kasus Citarum Hulu terhadap efektivitas waduk Saguling di provinsi Jawa Barat (Policy development of catchment management: case study of Citarum Hulu catchment in West Java province) Retrieved 23 January, 2011, from http://repository.ipb.ac.id/bitstream/handle/123456789/40995/Cover_2005ash.pdf?sequence=1
Hasson, F., Keeney, S., & McKenna, H. (2000). Research guidelines for the Delphi survey technique. Journal of Advanced Nursing, 32(4), 1008‐1015.
Health Department of Republic of Indonesia. (2005). Pencegahan dan pemberantasan demam berdarah dengue di Indonesia (Prevention and treatment of dengue fever in Indonesia). Direktorat Jenderal Pengendalian Penyakit dan Penyehatan Lingkungan. Departemen Kesehatan RI Retrieved 4 April, 2011, from http://perpustakaan.depkes.go.id/cgi‐bin/koha/opac‐detail.pl?biblionumber=46&shelfbrowse_itemnumber=101
Helmy, C. (2008). Kerusakan lingkungan: kisah yang tak kunjung usai (Environmental degradation: a never ending story) Retrieved 10 February, 2009, from http://www.dishut.jabarprov.go.id/index.php?mod=detilBerita&idMenuKiri=334&idBerita=338
Hosokawa, M., & Zweig, S. (1990). Future directions in family medicine: results of a Delphi study. Family Medicine, 22(6), 429‐433.
Howell, D. C. (2011). Fundamental statistics for the behavioral sciences (7th ed.). Belmont, California: Wadsworth Cengage Learning.
Hsu, C. C., & Sandford, B. A. (2007). The Delphi technique: making sense of consensus. Practical Assessment, Research & Evaluation, 12(10), 1‐8.
Hudak, R. P., Brooke Jr, P. P., Finstuen, K., & Riley, P. (1993). Health care administration in the year 2000: practitioners' views of future issues and job requirements. Hospital Health Service Administration, 38(2), 181‐195.
Indonesian Ministry of Environment. (2003). Guidelines for water quality assessment Retrieved 23 March, 2010, from http://www.google.com.au/url?sa=t&source=web&cd=1&ved=0CBgQFjAA&url=http%3A%2F%2Fhelpingpeopleideas.com%2Fpublichealth%2Fsearch%2Fkeputusan‐menteri‐lingkungan‐hidup‐tentang‐standar‐baku‐mutu‐air%2F&ei=gdzlTdLXE4bwrQfykYSZCA&usg=AFQjCNHsCYNyR82U5JlJ1BLIr6UKz_ftXQ
Indonesian Ministry of Public Works. (2006). Criteria for catchment priority Retrieved 17 February, 2011, from http://www.google.com.au/#hl=en&q=das+prioritas+departemen+pu&oq=das+prioritas+departemen+pu&aq=f&aqi=&aql=&gs_sm=s&gs_upl=371531l381235l8l31l26l2l14l0l0l735l735l6‐1&bav=on.2,or.r_gc.r_pw.&fp=770255cd9be3b411&biw=1259&bih=788
Indonesian Ministry of Public Works. (2010). Tugas pokok dan fungsi (Authorities and responsibilities) Retrieved 15 May 2011, 2011, from http://www.pu.go.id/satminkal/index.asp?Site_id=0400

References 6‐5
Jakeman, A. J., Letcher, R. A., Rojanasoonthon, S., & Cuddy, S. (2005). Integrating knowledge for river basin management: progress in Thailand. Canberra: Australia Centre for International Agricultural Research.
Javed, M. A. (1994). Developing a strategic plan for the Pakistan Sports Board using the Delphi technique. PhD, University of New Mexico, New Mexico.
Jencks, S. F., Huff, E. D., & Cuerdon, T. (2003). Change in the quality of care delivered to Medicare beneficiaries, 1998‐1999 to 2000‐2001. JAMA: the journal of the American Medical Association, 289(3), 305‐312.
Jesinghaus, J. (1999). A European system of environmental pressure indices. Environmental Pressure Indices Handbook, 1.
Jolson, M. A., & Rossow, G. L. (1971). The Delphi process in marketing decision making. Journal of Marketing Research, 8(4), 443‐448.
Karami, E., & Hayati, D. (2005). Rural poverty and sustainability: the case of groundwater depletion in Iran. Asian Journal of Water, Environment and Pollution, 2(2), 51‐61.
Kates, R. W., & Dasgupta, P. (2007). African poverty: a grand challenge for sustainability science. Proceedings of the National Academy of Sciences, 104(43), 16747‐16750.
Kirmanto, D. (2007). Mekanisme pengembangan sistem penyediaan air minum (Development mechanism of water supply system) Retrieved 20 November, 2010, from http://ciptakarya.pu.go.id/dok/hukum/permen/permen_18_2007.pdf
Kodikara, P. N. (2008). Multi‐objective optimal operation of urban water supply systems. Doctorate Electronic publication; full text available in PDF format; abstract in HTML format, Victoria University, Melbourne. Retrieved from http://eprints.vu.edu.au/1516/
Kodikara, P. N., Perera, B. J. C., & Kularathna, M. (2010). Stakeholder preference elicitation and modelling in multi‐criteria decision analysis‐A case study on urban water supply. European Journal of Operational Research, 206(1), 209‐220.
Kwong, C., & Bai, H. (2002). A fuzzy AHP approach to the determination of importance weights of customer requirements in quality function deployment. Journal of Intelligent Manufacturing, 13(5), 367‐377.
Lang, T. (1995). An overview of four futures methodologies. Manoa Journal of Fried, 7, 1‐43. Lawrence, P., Meigh, J., & Sullivan, C. (2003). The Water Poverty Index: an international
comparison Retrieved 25 June 2007, from http://www.keele.ac.uk/depts/ec/wpapers/kerp0219.pdf
Lehmann, H., Kuhn, J., & Lehner, F. (2004). The future of mobile technology: findings from a European Delphi study. Paper presented at the 37th Hawaii International Conference on System Sciences, Wellington.
Lind, D. A., Marchal, W. G., & Mason, R. D. (2000). Basic statistics for business and economics (3rd ed.). Boston, Boston: Irwin/McGraw‐Hill.
Linstone, H. A., & Simmonds, W. H. C. (1977). Futures research: new directions. Beverly Hills, California: Addison Wesley Publishing Company.
Linstone, H. A., & Turoff, M. (1975). The Delphi method : techniques and applications. New York, New York: Addison Wesley Publishing Company.
Liverman, D., Hanson, M., Brown, B., & Merideth, R. (1988). Global sustainability: toward measurement. Environmental Management, 12(2), 133‐143.
Loucks, D. P., & Gladwell, J. S. (1999). Sustainability criteria for water resource systems. Cambridge: Cambridge University Press.
Loucks, D. P., Stakhiv, E. Z., & Martin, L. R. (2000). Sustainable water resources management. Journal of Water Resources Planning and Management, 126(2), 43‐47.
Lunsford, D. A., & Fussell, B. C. (1993). Marketing business services in central Europe: the challenge: a report of expert opinion. Journal of Services Marketing, 7(1), 13‐21.

References 6‐6
Macharis, C., Springael, J., De Brucker, K., & Verbeke, A. (2004). PROMETHEE and AHP: The design of operational synergies in multicriteria analysis.:: Strengthening PROMETHEE with ideas of AHP. European Journal of Operational Research, 153(2), 307‐317.
Martens, P., & Zywietz, D. (2006). Rethinking globalization: a modified globalization index. Journal of International Development, 18(3), 331‐350.
Matell, M. S., & Jacoby, J. (1972). Is there an optimal number of alternatives for Likert scale items? Effects of testing time and scale properties. Journal of Applied Psychology, 56(6), 506‐509.
Mays, L. W. (2006). Water resources sustainability. New York, New York: McGraw‐Hill Professional.
MDG Indonesia Team. (2007). Achivement of MIllenium Development Goals Indonesia Jakarta: National Planning and Development Board.
Milani, A., Shanian, A., & Abeyaratne, R. (2007). A group decision making approach in multi‐criteria material selection. Paper presented at the Modelling and Simulation, Montreal.
Mohanty, N. K., & Ray, S. (2002). Corporate Environmental Sustainability Index. Development by design.
Moore, C. M. (1987). Group techniques for idea building. Thousand Oaks, California: Sage Publications.
Nair, A., Malhotra, M. K., & Ahire, S. L. (2010). Toward a theory of managing context in Six Sigma process‐improvement projects: an action research investigation. Journal of Operations Management, 29(5), 529‐548.
Nardo, Saisana, Saltelli, Tarantola, Hoffman, & Giovannini. (2005). Handbook on constructing composite indicators: methodology and user guide (Vol. 2005, pp. 108). Ispra, Italy: OECD Statistics Working Paper.
Niederman, F., Brancheau, J. C., & Wetherbe, J. C. (1991). Information systems management issues for the 1990s. MIS Quarterly, 15(4), 475‐500.
Olshfski, D., & Joseph, A. (1993). Assessing training needs of executives using the Delphi technique. Public Productivity and Management Review, 14(3), 297–301.
Palmer, M. A., Bernhardt, E. S., Chornesky, E. A., Collins, S. L., Dobson, A. P., Duke, C. S., et al. (2005). Ecological science and sustainability for the 21st century. Frontiers in Ecology and the Environment, 3(1), 4‐11.
Parker, J. (1991). Environmental reporting and environmental indices: University of Cambridge. Parkin, S. (2000). Sustainable development: the concept and the practical challenge. London:
Thomas Telford‐ICE Virtual Library. Parris, K. (1998). Agricultural nutrient balances as agri‐environmental indicators: an OECD
perspective* 1. Environmental Pollution, 102(1), 219‐225. Policy Research Initiative. (2007). Canadian Water Sustainability Index Retrieved 5 July 2007,
from http://policyresearch.gc.ca/doclib/SD_PR_CWSI_web_e.pdf Portney, K. (2003). Taking Sustainability Seriously. Cambridge, Massachusetts: MIT Press. Prasetyo, L. B. (2004). Deforestasi dan degradasi lahan DAS Citanduy (deforestation and land
degradation in Citanduy catchment) Retrieved 28 March, 2011, from http://repository.ipb.ac.id/bitstream/handle/123456789/26809/Deforestasi%20dan%20degradasi%20lahan%20DAS%20Citanduy_abstract.pdf?sequence=1
Prescott‐Allen, R. (2001). The Barometer of Sustainability. Victoria, California: IUCN. Presiden Republik Indonesia. (2004). Undang‐undang Republik Indonesia nomor 7 tahun 2004
tentang sumber daya air (Indonesian national regulation no. 7/2004 on water resources). Jakarta: Sekretariat Negara RI.
Pujiyanto, S., Kusdiyantini, & Hadi. (2008). Isolasi dan seleksi bakteri Kitinolitik Isolat lokal yang berpotensi untuk mengendalikan larva nyamuk Aedes Aegypti (Isolation and selection of local Kitnolitik Isolat to control Aedes Aegypti). Biodiversitas, 9(1), 5‐8.

References 6‐7
Pusair. (2008). Sumber daya air Jawa Barat (Water resources of West Java) Retrieved 17 April 2008, from http://www.pusair‐pu.go.id/utama.php
Rahmat, A., & Wangsaatmadja, S. (2007). Laporan status lingkungan hidup tahun 2007 (Annual state of environmental report 2007) (pp. 60). Bandung, Indonesia: BPLHD Jawa Barat.
Raskin, M. S. (1994). The Delphi study in field instruction revisited: expert consensus on issues and research priorities. Journal of Social Work Education, 30(1), 75‐89.
Rayens, M. K., & Hahn, E. J. (2000). Building consensus using the policy Delphi method. Policy, Politics, & Nursing Practice, 1(4), 308‐315.
Reed, M. S., Fraser, E. D. G., & Dougill, A. J. (2006). An adaptive learning process for developing and applying sustainability indicators with local communities. Ecological Economics, 59(4), 406‐418.
Resmiani, A. (2010). [Evaluation of Environmental Pollution Control Manager program]. Rijsberman, F. R. (2006). Water scarcity: fact or fiction? Agricultural Water Management, 80(1‐
3), 5‐22. Rodríguez, F. (2010). Human Development Reports: United Nations Development Programme. Rowe, G., & Wright, G. (1999). The Delphi technique as a forecasting tool: issues and analysis.
International Journal of Forecasting, 15(4), 353‐375. Saisana, M., Saltelli, A., & Tarantola, S. (2005). Uncertainty and sensitivity analysis techniques
as tools for the quality assessment of composite indicators. Journal of the Royal Statistical Society: Series A (Statistics in Society), 168(2), 307‐323.
Saito, M., & Sinha, K. C. (1991). Delphi study on bridge condition rating and effects of improvements. Journal of Transportation Engineering, 117(3), 320‐334.
Salim, E. (2011). Kurikulum lingkungan perlu disesuaikan kondisi daerah (Environmental curriculum needs to accomodate local culture) Retrieved 2 June, 2011, from http://id.berita.yahoo.com/emil‐kurikulum‐lingkungan‐perlu‐disesuaikan‐kondisi‐daerah‐082219143.html
Saltelli, A., Tarantola, S., & Campolongo, F. (2004). Sensitivity analysis in practice: a guide to assessing scientific models. Hoboken, New Jersey: John Wiley & Sons Inc.
Samuel‐Johnson, K., & Esty, D. (2002). Environmental Sustainability Index: an initiative of the global leaders of Tomorrow Environment task force.
Savenije, H. H. G., & van der Zaag, P. (2002). Water as an economic good and demand management: paradigms with pitfalls. Water International, 27(1), 98‐104.
Shanian, A., Milani, A., Carson, C., & Abeyaratne, R. (2008). A new application of ELECTRE III and revised Simos' procedure for group material selection under weighting uncertainty. Knowledge‐Based Systems, 21(7), 709‐720.
Sinta. (2011). Program prioritas kementrian di bidang kesejahteraan rakyat 2011 (Program priorities of the public welfare ministries of 2011) Retrieved 27 January, 2011, from http://www.menlh.go.id/home/index.php?option=com_content&view=article&id=4976%3Aprogram‐prioritas‐kementerian‐di‐bidang‐kesra‐2011&catid=43%3Aberita&Itemid=73&lang=id
Smeets, E., Weterings, R., & Agency, E. E. (1999). Environmental indicators: typology and overview: European Environment Agency.
Spangenberg, J. H. (2002). Environmental space and the prism of sustainability: frameworks for indicators measuring sustainable development. Ecological Indicators, 2(3), 295‐309.
Spangenberg, J. H. (2004). Reconciling sustainability and growth ‐ criteria, indicators, policies. Sustainable Development, 12(2), 74‐86.
Spangenberg, J. H., & Bonniot, O. (1998). Sustainability indicators: a compass on the road towards sustainability Wuppertal Paper. Dortmund: Wuppertal Institute.

References 6‐8
Stapleton, L. M., & Garrod, G. D. (2007). Keeping things simple: why the Human Development Index should not diverge from its equal weights assumption. Social Indicators Research, 84(2), 179‐188.
Starkl, M., & Brunner, N. (2004). Feasibility versus sustainability in urban water management. Journal of Environmental Management, 71(3), 245‐260.
Steinberg, W. J. (2011). Statistics alive! (2nd ed.). Thousand Oaks, California: Sage Publications. Sukmayeni. (2007). Manajemen penurunan tingkat kehilangan air PDAM (management of
reducing water losses at water service providers) Retrieved 15 January, 2010, from http://digilib‐ampl.net/detail/detail.php?row=5&tp=artikel&ktg=airminum&kd_link=&kode=1735
Sullivan, C. (2002). Calculating a Water Poverty Index. World Development, 30(7), 1195‐1210. Sullivan, C., & Meigh, J. (2007). Integration of the biophysical and social sciences using an
indicator approach: addressing water problems at different scales. Water Resources Management, 21(1), 111‐128.
Sullivan, C., Meigh, J., & Lawrence, P. (2006). Application of the water poverty index at different scales: a cautionary tale. Water International, 31(3), 412‐426.
Swamee, P. K., & Tyagi, A. (2000). Describing water quality with aggregate index. Journal of Environmental Engineering, 126(5), 451‐455.
Syarief, R. (2008). Pengelolaan sumber daya air (Water resources management) Retrieved 5 March 2008, from http://repository.gunadarma.ac.id:8000/97/1/hal_44_sd_56,_pengelolaan_sumber_daya_air_roestam.pdf
Tamin, R., & Reliantoro, S. (2010). Hasil penilaian kinerja perusahaan dalam Prokasih 2009 ‐ 2010 (Assessment of the Prokasih program ‐ 2010) Retrieved 12 May, 2011, from http://www.menlh.go.id/home/index.php?Itemid=73&catid=43%3Aberita&id=4960%3Asiaran‐pers‐hasil‐proper‐2009‐2010&lang=en&option=com_content&view=article
Tarigan, S. D. (2009). Pengembangan sistem informasi spasial berbasis web untuk sinergi rehabilitasi DAS kritis nasional (Development of web‐based GIS to rehabilitate catchments in critical condition) Retrieved 20 May, 2011, from http://www.google.com.au/url?sa=t&source=web&cd=1&ved=0CBgQFjAA&url=http%3A%2F%2Frepository.ipb.ac.id%2Fbitstream%2Fhandle%2F123456789%2F31391%2FA‐2‐1.doc%3Fsequence%3D1&ei=0‐PlTYCMDZGGrAfVm62wCA&usg=AFQjCNEQUuFWL9hLnsZJczPgy5JFM6o32g
Thapa, S. (1995). The human development index: a portrait of the 75 districts in Nepal. Asia‐Pacific Population Journal, 10(2), 3‐14.
Toward, J. I., & Ostwald, S. K. (2002). Brief report: exploring mental health service needs for the elderly: results of a modified Delphi study. Community Mental Health Journal, 38(2), 141‐149.
Turindra, A. (2011). Kualitas air sungai Citarum buruk (Water quality of Citarum river is below the standard) Retrieved 15 May 2011, from http://m.today.co.id/?kategori=musik&sub=healthy&detail=26147
Uhl, N. P. (2006). Using the Delphi technique in institutional planning. New Directions for Institutional Research, 1983(37), 81‐94.
Urdan, T. C. (2010). Statistics in plain English (3rd ed.). New York, New York: Routledge. USAID Indonesia. (2011). USAID Indonesia Urban Water, Sanitation, and Hygiene Project
(USAID IUWASH) Retrieved 15 October, 2011, from http://indonesia.usaid.gov/en/USAID/Activity/269/USAID_Indonesia_Urban_Water_Sanitation_and_Hygiene_Project_USAID_IUWASH

References 6‐9
Van Ittersum, M. K., Ewert, F., Heckelei, T., Wery, J., Alkan Olsson, J., Andersen, E., et al. (2008). Integrated assessment of agricultural systems: a component‐based framework for the European Union (SEAMLESS). Agricultural Systems, 96(1‐3), 150‐165.
Wangsaatmadja, S. (2009). Environmental Pollution Control Manager Program Retrieved 17 May 2011, 2011, from http://www.bplhdjabar.go.id/index.php/bidang‐pengendalian?start=4
Wangsaatmaja, S. (2004). Dampak konversi lahan terhadap rezim aliran air permukaan serta kesehatan lingkungan (the effects of land conversion on river regime and environmental health). Doctoral, Bandung Institute of Technology, Bandung.
West Java Environmental Protection Agency. (2008). West Java annual state of the environmental report. Bandung: West Java Environmental Protection Agency.
Wheeler, D., & Afsah, S. (2000). Going public on polluters in Indonesia: Bapedal’s Proper‐Prokasih program Retrieved 11 March, 2011, from http://www.google.com.au/url?sa=t&source=web&cd=1&ved=0CBsQFjAA&url=http%3A%2F%2Fsiteresources.worldbank.org%2FNIPRINT%2FResources%2FGoingPubliconPollutersinIndonesia.pdf&ei=W‐TlTdj6N8LxrQfFy5mpCA&usg=AFQjCNF0Hy5cYvr9dQhAUy_V456nblQN5Q
Widjajanti, S. (2006). Study on Bantuan Operasional Sekolah (School Educational Fund ) program Retrieved 3 November 2010, 2011, from http://www.smeru.or.id/report/research/bos/BosInd.pdf
Yuwono, B. (2009). Departemen PU minta PDAM turunkan tingkat kebocoran air (The need to reduce water loss of water service providers in Indonesia) Retrieved 12 June, 2008, from http://ciptakarya.pu.go.id/index.php?option=com_content&task=view&id=1216
Zhang, H. (2009). The analysis of the reasonable structure of water conservancy investment of capital construction in China by AHP method. Water Resources Management, 23(1), 1‐18.

APPENDIX A
QUESTIONNAIRE OF ROUND ONE – DELPHI TECHNIQUE APPLICATION

APPENDIX B
QUESTIONNAIRE OF ROUND TWO – DELPHI TECHNIQUE APPLICATION

APPENDIX C
WEIGHTING SCHEME QUESTIONNAIRE

APPENDIX D
INTERVIEW GUIDE

Appendix A A‐1
Respondent Name:
RESEARCH QUESTIONNAIRE Round One
Development of West Java Water Sustainability Index (WJWSI)
I. General information about this research
Water resources management in Indonesia, particularly in Java Island, faces severe water problems. A sustainable and integrated water management to engage all stakeholders is therefore needed; such water management has demonstrated to be capable of integrating all issues of water resources management (Loucks & Gladwell, 1999; Jakeman, Letcher, Rojanasoonthon et al., 2005). One approach to achieve sustainable and integrated water management is through the application of the indicator‐based approach (Jakeman et al., 2005). In the past, this approach has been used to develop water sustainability indices, namely Water Poverty Index (WPI), Canadian Water Sustainability Index (CWSI) and Watershed Sustainability Index (WSI). This research project proposes to develop the West Java Water Sustainability Index (WJWSI), which can be used as a tool to assess the sustainability of West Java water resources and to communicate water issues with wider community. The application of WJWSI in case studies will assist decision makers in the West Java Province to have better knowledge of the overall water resource conditions, and to prioritise water‐related issues and their respective programs towards more sustainable and integrated water resources management. The results of WJWSI application will also increase the awareness of the wider community and encourage them to participate in the improvement of water resources management. The tasks for developing WJWSI include the identification of components/indicators, thresholds, methods for obtaining sub‐index values and index aggregation, fieldwork, and robustness analysis. The identification of component/indicators and thresholds will be carried out through the distribution of questionnaires to water‐related experts in West Java, Indonesia. This is the first Round questionnaire of maximum three rounds to be completed by selected stakeholders. This questionnaire consists of three parts, which are the information for respondents (Section II), questions to be answered by respondents (Section IV to VI) and an attachment to help respondents answering the questions. In order to have a better understanding of some terms used in the questionnaire, respondents are advised to read the attachment before answering the questions.

Appendix A A‐2
II. What is expected from the respondents? (information only)
At this stage, WJWSI is being developed. WJWSI requires inputs from water management‐related stakeholders. You have been chosen as one of the respondents for this project. The WJWSI currently has a proposed conceptual framework, consists of three main sections, they are: the Components, Indicators and sub‐indicators (if any) and Thresholds. The proposed framework is illustrated as follows:
COMPONENT INDICATOR EXPLANATION THRESHOLD
MAX MIN
WATER RESOURCES
Availability Average annual flow of
surface water (m3/cap/yr)
1700 a 500 b
Demand Use of available water
sources (%) 40 b 0 a
Quality Water Quality Index 0 a ‐31 b Land Use Changes Runoff Coefficient 1 b 0 a
WATER SERVICE PROVISION
Coverage Coverage of water
company (%) 80 a 0 b
Water loss Unaccounted for water of water company (%)
15 b 0 a
Finance Profitability of water
company 0 c 0 c
CAPACITY
Poverty People under the poverty line (%)
100 b 0 a
Education People completed elementary/primary
education (%) 100 a 0 b
HUMAN HEALTH
Access
Water accessible by the community supplied by
water company compared to water
needed (%)
100 a 0 b
Sanitation People with access to basic sanitation (%)
100 a 0 b
Health Impact Number of water‐borne diseases (cases/1000
pop) 100 b 0 a
a: preferable b: not preferable c: >0 preferable, <0 not preferable
With regards to the proposed WJWSI framework, in this questionnaire, the respondents are expected to:

Appendix A A‐3
1. Assess the proposed Components1 and provide inputs for component(s) to be added, modified and or removed from the proposed list
2. Assess the proposed Indicators2 and provide inputs for indicator(s) or to be added, modified and/or removed from the proposed list
3. Assess the proposed Thresholds3 and provide inputs for thresholds to be modified from the proposed list
If needed, respondents may provide their inputs on a separate additional sheet.
III. Personal Information (to be completed by respondents)
Name* :
Institution (optional) :
Phone :
E‐mail (optional) :
IV. Component‐Related Questions (to be completed by respondents)
V.1. Do you agree with the following components to be included in the WJWSI framework?
COMPONENT YOUR ASSESSMENT
(please circle or cross the number)
WATER RESOURCES 1 2 3 4 5 6 7
WATER SERVICE PROVISION 1 2 3 4 5 6 7
CAPACITY 1 2 3 4 5 6 7
HUMAN HEALTH 1 2 3 4 5 6 7
1= disagree, 7 = agree; 1‐7 ranges from disagree to agree with 4 being neutral IV.1. Of the above components, do you think there are component(s) to be modified or
removed? Are there other component(s) to be added?
1 A component is a group of two or more indicators. 2 An indicator is an instrument to measure water resource phenomena. 3 A threshold is a number or figure used to assess an indicator. In this questionnaire, the thresholds have maximum and minimum values as the range of indicator’s performance quality. These values are adopted from standards, policies or guidelines issued by governments or other legitimate institutions.
Yes No
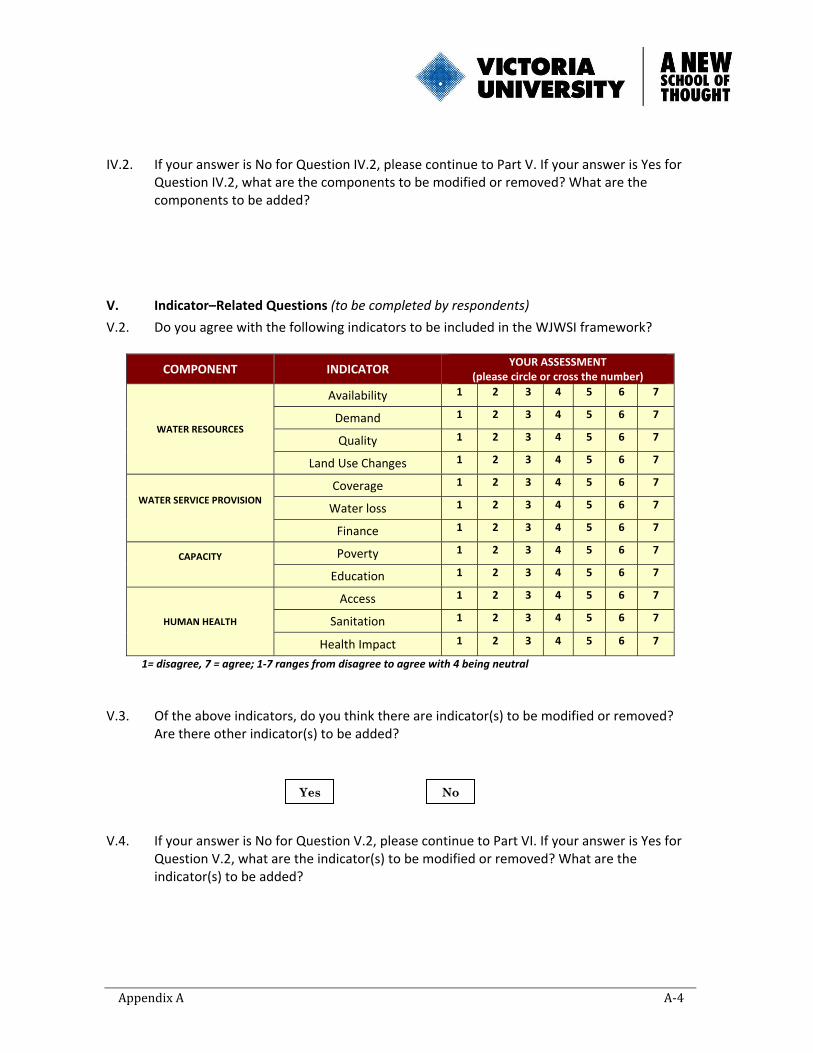
Appendix A A‐4
IV.2. If your answer is No for Question IV.2, please continue to Part V. If your answer is Yes for
Question IV.2, what are the components to be modified or removed? What are the components to be added?
V. Indicator–Related Questions (to be completed by respondents)
V.2. Do you agree with the following indicators to be included in the WJWSI framework?
COMPONENT INDICATOR YOUR ASSESSMENT
(please circle or cross the number)
WATER RESOURCES
Availability 1 2 3 4 5 6 7
Demand 1 2 3 4 5 6 7
Quality 1 2 3 4 5 6 7
Land Use Changes 1 2 3 4 5 6 7
WATER SERVICE PROVISION
Coverage 1 2 3 4 5 6 7
Water loss 1 2 3 4 5 6 7
Finance 1 2 3 4 5 6 7
CAPACITY
Poverty 1 2 3 4 5 6 7
Education 1 2 3 4 5 6 7
HUMAN HEALTH
Access 1 2 3 4 5 6 7
Sanitation 1 2 3 4 5 6 7
Health Impact 1 2 3 4 5 6 7
1= disagree, 7 = agree; 1‐7 ranges from disagree to agree with 4 being neutral
V.3. Of the above indicators, do you think there are indicator(s) to be modified or removed?
Are there other indicator(s) to be added?
V.4. If your answer is No for Question V.2, please continue to Part VI. If your answer is Yes for
Question V.2, what are the indicator(s) to be modified or removed? What are the indicator(s) to be added?
Yes No
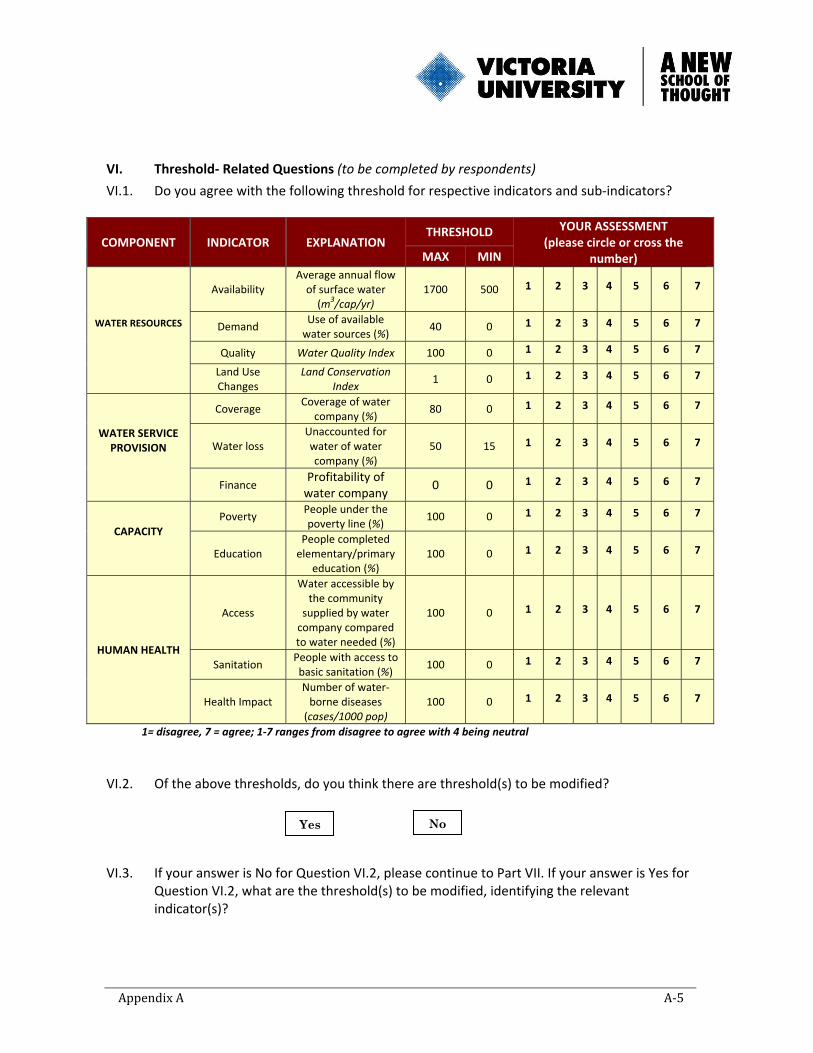
Appendix A A‐5
VI. Threshold‐ Related Questions (to be completed by respondents)
VI.1. Do you agree with the following threshold for respective indicators and sub‐indicators?
COMPONENT INDICATOR EXPLANATION THRESHOLD YOUR ASSESSMENT
(please circle or cross the number) MAX MIN
WATER RESOURCES
Availability Average annual flow of surface water (m3/cap/yr)
1700 500 1 2 3 4 5 6 7
Demand Use of available water sources (%)
40 0 1 2 3 4 5 6 7
Quality Water Quality Index 100 0 1 2 3 4 5 6 7
Land Use Changes
Land Conservation Index
1 0 1 2 3 4 5 6 7
WATER SERVICE PROVISION
Coverage Coverage of water
company (%) 80 0 1 2 3 4 5 6 7
Water loss Unaccounted for water of water company (%)
50 15 1 2 3 4 5 6 7
Finance Profitability of water company
0 0 1 2 3 4 5 6 7
CAPACITY
Poverty People under the poverty line (%)
100 0 1 2 3 4 5 6 7
Education People completed elementary/primary
education (%) 100 0 1 2 3 4 5 6 7
HUMAN HEALTH
Access
Water accessible by the community
supplied by water company compared to water needed (%)
100 0 1 2 3 4 5 6 7
Sanitation People with access to basic sanitation (%)
100 0 1 2 3 4 5 6 7
Health Impact Number of water‐borne diseases (cases/1000 pop)
100 0 1 2 3 4 5 6 7
1= disagree, 7 = agree; 1‐7 ranges from disagree to agree with 4 being neutral VI.2. Of the above thresholds, do you think there are threshold(s) to be modified? VI.3. If your answer is No for Question VI.2, please continue to Part VII. If your answer is Yes for
Question VI.2, what are the threshold(s) to be modified, identifying the relevant indicator(s)?
Yes No

Appendix A A‐6
VII. Closing We thank you for your participation in this Round 1 questionnaire. The results of this questionnaire will be analysed soon, and will be included in the development of the Round 2 questionnaire. We hope that you, as the respondents of Round 1, will also participate to provide more inputs and suggestions in the Round 2 questionnaire. We believe that the time and effort given to fill‐in this questionnaire will be highly beneficial to the improvement of water resources management in Indonesia, particularly in West Java. At the end of this research, recommendation report of this project will be distributed to decision makers related to water management in West Java. As a tribute, with your consent, your name will appear in the report. Best Regards, Researchers School of Engineering and Science Victoria University Melbourne, Australia

Appendix B B‐1
Respondent Name:
RESEARCH QUESTIONNAIRE
Round Two
Development of West Java Water Sustainability Index (WJWSI)
I. Information for Round Two
We would like to thank all respondents for responses given in Round One. The responses in Round One were used to formulate the questionnaire of Round Two. The responses on Round One questions can be found in this questionnaire (Round Two). In this questionnaire, respondents are expected to provide answers on the given questions. If the questions in this questionnaire are the same with the questions in Round One, respondents are allowed to provide the same or different answers. However, we encourage respondents to consider responses from other respondents in Round One when providing answers in Round Two. Based on the suggestions in Round One, the proposed WJWSI framework in this questionnaire is shown in the following table.
Table 1 Modified WJWSI Framework
Component Indicator Sub‐indicator
Conservation Water Availability
Land Use Changes
Water Quality
Water Use Water Demand
Water Access
Water Service Provision Coverage
Water Loss
Finance
Population Pressure
Policy and Governance Information Disclosure
Governance Structure Public Participation Education
Poverty
Sanitation
Health Impact
Law Enforcement

Appendix B B‐2
This questionnaire consists of several parts, which are the information for respondents (Section I), responses from respondents in Round One (Section II), instructions for respondents (Section III), and questions to be answered by respondents (Section IV to VI)
II. Results from Round One
Components
The responses from respondents on the component‐related questions are shown in Error! Reference source not found.. It shows that for the component of Water Resources, 100% of the respondents agreed on the component (chose 6 or 7 on the 7‐point Likert‐scale), whereas for Water Service Provision, Capacity and Human Health components, 68%, 68% and 72% of the respondents respectively agreed. As mentioned previously, in this study, a consensus is considered to be achieved if more than 67% of the respondents agreed on the option offered in the Delphi technique. It means that for this study, all the offered components in the first‐round questionnaire were agreed by the respondents. For the component of Water Resources, none of the respondents disagreed nor had a neutral response. For the components of Water Service Provision, Capacity, and Human Health, there were 29%, 29% and 22% neutral responses respectively. This shows that the respondents valued the component of Water Resources higher than other three components. In addition, with less percentage of ‘disagree’ and neutral responses, the component of Human Health is valued more by the respondents compared to the components of Water Service Provision and Capacity.
However, despite their agreement on the provided components, few respondents suggested that the names of the components were modified to reflect the National Regulation No. 7/2004 on Water
Figure 1 Percentage of Responses Agreed on Indicators – Round One

Appendix B B‐3
Resources (Presiden Republik Indonesia, 2004). According to this regulation, the component of Water Resources should be named Conservation, Water Service Provision should be Water Use, and the Capacity and Human Health components should be Policy and Governance. This suggestion, provided by some respondents, was decided to be included in the next round for further views and opinions from other respondents. Indicators
With regards to the initially identified indicators of the WJWSI, the responses are shown in Figure . It shows that more than 67% of the respondents answered 6 or 7 on the 7‐ point Likert‐scale for 9 indicators, namely, the Water Availability, Water Demand, Water Quality, Land Use Changes, Coverage, Water Loss, Water Access, Sanitation and Health Impact. For these indicators, as the consensus was reached, they were not brought into the next round(s) of the Delphi application. For the other 3 indicators, which were Finance, Poverty and Education, 6 or 7 Likert‐scale was chosen by 56%, 66% and 61% of the respondents respectively. As the percentages of these three indicators fell below 67%, these indicators were taken into Round Two of the Delphi application.
It is also important to note that ‘disagree’ percentages for all indicators are 2% or less, which indicated the majority of the respondents preferred the indicators to be included in the WJWSI framework. However, as the ‘neutral’ responses for the indicators of Finance, Poverty and Education were high, they were brought into Round Two of the Delphi application. Apart from the indicators in the conceptual framework, few respondents also suggested new indicators be included in the WJWSI framework. Indicators that were suggested by the respondents were
Figure 2 Percentage of Responses Agreed on Indicators – Round One

Appendix B B‐4
Population Pressure, Information Disclosure, Governance Structure, Public Participation and Law Enforcement. The suggestion was addressed by having these indicators in Round Two to seek further comments from other respondents. Thresholds
The conceptual framework of WJWSI also included thresholds for their respective indicators. The respondents were asked to assess these thresholds; their responses are illustrated in Figure 3.
Figure 3 shows that consensus was reached for few thresholds, considering the 67% cut‐off. The thresholds above 67% cut‐off are for Water Quality, Land Use Changes, Coverage, Sanitation and Health Impact. For thresholds of these indicators, as the consensus was reached, they were not brought into the next round of the Delphi application. For other thresholds that have not been agreed (i.e. thresholds for indicators of Water Availability, Water Demand, Water Loss, Finance, Poverty, Education and Access), most of the respondents have ‘neutral responses’, ‘disagree’ or ‘no answer’. Compared to the responses for components and indicators, responses on thresholds had higher percentages on ‘disagree’, ‘neutral’ and ‘no answer’. Some of the respondents also suggested new thresholds for Poverty, Coverage and Water Demand indicators. Their suggestions on the thresholds of these indicators are presented in Table .
Figure 3 Percentage of Responses Agreed on Thresholds – Round One

Appendix B B‐5
Table 2 Thresholds Suggested in Round One
Indicator Thresholds
Old New Poverty 0 – 100% 0% ‐ 20% Coverage 0 – 80% 0 – 60%
Water Demand 0 – 40% 10 – 40% Conclusions on Round One
Based on the results from Round One, the conceptual framework of WJWSI was modified, as shown in Table 3. This modified framework was then brought to the next round of Delphi application. The modified framework in Table 3 incorporated suggestions from Round One to correspond with the components with three major components of water resource management stated in the National Regulation on Water Resources; Conservation, Water Use and Policy and Governance. Table 3 also includes new indicators and sub‐indicators suggested in Round One. The new indicators and sub‐indicators were Population Pressure, Information Disclosure, Governance Structure, Public Participation and Law Enforcement. The sub‐indicators are existed in the proposed framework to accommodate suggestions from respondents on the components and indicators in Round One. These suggestions required some indicators to be re‐arranged as sub‐indicators.
Table 3 The Modified WJWSI Framework After Round One of Delphi Application
Component Indicator Sub‐indicator Thresholds
Unit Max MinConservation Water Availability m3/cap/yr 1700 a 500 b
Land Use Changes ‐ 1 b 0 a
Water Quality ‐ 0 a ‐31 b
Water Use Water Demand % 40 b 0 a Water Access % 100 a 0 b Water Service Provision
Coverage % 80 a 0 a
Water Loss % 15 b 0 a Finance ‐ 0 c 0 c
Population Pressure Policy and Governance
Information Disclosure Governance Structure Public Participation Education % 100 a 0 b
Poverty % 100 b 0 a Sanitation % 100 a 0 b
Health Impact
(cases/1000 pop)
100 b 0 a
Law Enforcement

Appendix B B‐6
a: preferable; b: not preferable and c: >0 preferable, <0 not preferable
In Round One, consensus was reached on thresholds for the following indicators and sub‐indicators: Land Use Changes, Water Quality, Coverage, Sanitation and Health Impact. For other indicators and sub‐indicators, shown by the shaded area in the table, their thresholds have not been agreed. III. Instruction to Respondents
In this questionnaire, the respondents are expected to: 1. Assess the new structure of Component 2. Assess the newly proposed Indicators 3. Assess the newly proposed Thresholds
IV. Component‐Related Question (to be completed by respondents)
IV.1. Do you agree with the new structure of WJWSI components?
YOUR ASSESSMENT (please circle or cross the number)
1 2 3 4 5 6 7 1= disagree, 7 = agree; 1‐7 ranges from disagree to agree with 4 being neutral
V. Indicator–Related Questions (to be completed by respondents)
V.1. Do you agree with the following indicators and sub‐indicators to be included in the WJWSI framework?
COMPONENT INDICATOR SUB‐INDICATOR YOUR ASSESSMENT
(please circle or cross the number)
WATER RESOURCE CONSERVATION
Water Availability
Land Use Changes
Water Quality
WATER USE
Water Demand
Water Service Provision
Coverage
Water Loss
Finance
Population Pressure 1 2 3 4 5 6 7
POLICY AND GOVERNANCE
Information Disclosure 1 2 3 4 5 6 7
Governance Structure 1 2 3 4 5 6 7
Public Participation
Education 1 2 3 4 5 6 7
Poverty 1 2 3 4 5 6 7
Sanitation 1 2 3 4 5 6 7
Health Impact 1 2 3 4 5 6 7
Law Enforcement 1 2 3 4 5 6 7

Appendix B B‐7
1= disagree, 7 = agree; 1‐7 ranges from disagree to agree with 4 being neutral
V.2. Is there any other indicator(s) to be added? Or rem0ved? Or modified?
V.3. If your answer is No for Question V.2, please continue to Part VI. If your answer is Yes for Question V.2, what are the indicator(s) to be modified or removed? What are the indicator(s) to be added?
VI. Threshold‐ Related Questions (to be completed by respondents)
VI.1. Which of the thresholds (old or new) is more appropriate?
INDICATOR THRESHOLD VALUES YOUR ASSESSMENT
(please circle or cross the number) Old New
Poverty 0 – 100% 0% ‐ 20% Old New No answer Coverage 0 – 80% 0 – 60% Old New No Idea
Water Demand 0 – 40% 10 – 40% Old New No Idea
VI.2. Of the above thresholds, do you think there are threshold(s) to be modified?
VI.3. If your answer is No for Question VI.2, please continue to Part VII. If your answer is Yes for Question VI.2, what are the threshold(s) to be modified, identifying the relevant indicator(s)?
Yes
Yes
No
No
Appendix B B‐8
VII. Closing We thank you for your participation in Round Two questionnaire. The results of this questionnaire will be analysed soon, and will be informed to the respondents. We believe that the time and effort given to fill‐in this questionnaire will be highly beneficial to the improvement of water resources management in Indonesia, particularly in West Java. At the end of this research, recommendation report of this project will be distributed to decision makers related to water management in West Java. As a tribute, with your consent, your name will appear in the report. Best Regards, Researchers School of Engineering and Science Victoria University Melbourne, Australia

Appendix C C‐1
INTERVIEW GUIDE ‐ In‐depth Interview with Selected Key Stakeholders
Based on the results from two rounds of questionnaire distributions,
‐ Has consensus been reached on all components? Why?
‐ Has consensus been reached on all indicators? Why?
‐ Has consensus been reached on all thresholds? Why?
‐ If consensus has not been reached for particular components/indicators/thresholds, what
suggestions do you have for these components/indicators/thresholds?
‐ Is there any important issues noted from the results of the two rounds of questionnaire
distributions?
Note:
‐ During the interview, further questions were expanded based on the answers from the
interviewees on the above questions
‐ Answers from each interviewee were also discussed with other interviewees

Appendix D D‐1
Respondent Name:
RESEARCH QUESTIONNAIRE Weighting Scheme
Development of West Java Water Sustainability Index (WJWSI)
Introduction
Few months ago, questionnaires related to the identification of components, indicators and sub‐
indicators of WJWSI were distributed. At the moment, the components, indicators and sub‐
indicators for WJWSI have been finalised. Some papers related to WJWSI have been produced, and
they were published and presented in the following journal and conferences:
- Water Science & Technology Journal, IWA Publishing, 2010
- MODSIM International Conference, Cairns‐Australia, Juli 2009
- Hydrology Symposium, Newcastle‐Australia, November 2009
To refine the WJWSI, we would like to assign weights for the indicators and sub‐indicators. This
questionnaire is developed to seek inputs from respondents on the weights for WJWSI indicators
and sub‐indicators. The results from this questionnaire will be used to aggregate the WJWSI
indicators and sub‐indicators, as well as to be used in the robustness analysis of the index.
Best Regards,
Researchers School of Engineering and Science Victoria University Melbourne, Australia

Appendix D D‐2
INSTRUCTIONS
Information for respondents:
- In total, there are 13 indicators and sub‐indicators to be assigned weights
- Respondents are asked to arrange the cards in the order of importance, with the indicator or
sub‐indicator ranked the first is the least important or least preferred
- If the two or more indicators or sub‐indicators are considered equally important, their cards
are grouped together
- When arranging the cards, respondents are allowed to place blank card(s) between indicators
and sub‐indicators, to indicate smaller or greater weights between the indicators and sub‐
indicators
The procedure:
1. Arrange the cards in the order of importance, with the indicator or sub‐indicator ranked the
first is the least preferred
2. Answer the following question: “How many times more important is the most preferred
indicator or sub‐indicator relative to the least preferred indicator or sub‐indicator?”
3. If necessary, place blank card(s) between indicators and sub‐indicators, to indicate smaller or
greater weights between the indicators and sub‐indicators

Appendix D D‐3
AN EXAMPLE OF COMPLETED QUESTIONNAIRE
“How many times more important is the most preferred indicator or sub‐indicator relative to the
least preferred indicator or sub‐indicator?”
Answer: 20 times
Explanations of the above response:
- Quality is considered as the least preferred indicator, and Governance Structure is considered
as the most preferred indicator
- The Governance Structure indicator is considered 20 times more important than the Quality
- Indicators with equal weights: Coverage and Demand