development of a next-generation burner for use in testing
TRANSCRIPT

Development of a Next-Generation Burner for Use in Testing Thermal Acoustic Insulation Burnthrough Resistance Robert I. Ochs May 2009 DOT/FAA/AR-TN09/23 This document is available to the U.S. public through the National Technical Information Services (NTIS), Springfield, Virginia 22161
U.S. Department of Transportation Federal Aviation Administration
ote
tech
nica
l not
e te
chni
ca

NOTICE
This document is disseminated under the sponsorship of the U.S. Department of Transportation in the interest of information exchange. The United States Government assumes no liability for the contents or use thereof. The United States Government does not endorse products or manufacturers. Trade or manufacturer's names appear herein solely because they are considered essential to the objective of this report. This document does not constitute FAA certification policy. Consult your local FAA aircraft certification office as to its use. This report is available at the Federal Aviation Administration William J. Hughes Technical Center’s Full-Text Technical Reports page: actlibrary.tc.faa.gov in Adobe Acrobat portable document format (PDF).

Technical Report Documentation Page 1. Report No. DOT/FAA/AR-TN09/23
2. Government Accession No. 3. Recipient's Catalog No.
4. Title and Subtitle DEVELOPMENT OF A NEXT-GENERATION BURNER FOR USE IN TESTING THERMAL ACOUSTIC INSULATION BURNTHROUGH RESISTANCE
5. Report Date May 2009
6. Performing Organization Code
7. Author(s) Robert I. Ochs
8. Performing Organization Report No.
9. Performing Organization Name and Address U.S. Department of Transportation Federal Aviation Administration Airport and Aircraft Safety Research and Development Division Fire Safety Branch
10. Work Unit No. (TRAIS)
William J. Hughes Technical Center Atlantic City International Airport, NJ 08405
11.
Contract or Grant No.
12. Sponsoring Agency Name and Address U.S. Department of Transportation Federal Aviation Administration Air Traffic Organization NextGen & Operations Planning Office of Research and Technology Development Washington, DC 20591
13. Type of Report and Period Covered Technical Note
14. Sponsoring Agency Code ANM-115
15. Supplementary Notes 16. Abstract A new and improved burner was developed to test the fire penetration resistance of thermal acoustic insulation in accordance with Title 14 Code of Federal Regulations (CFR) Part 25.856 (b). This next-generation (NexGen) burner was developed mainly to provide industry with an alternative to the currently accepted burner apparatus manufactured by Park Electric Motors of Atlantic City, NJ. Title 14 CFR 25.856 was written based on the use of the Park DPL 3400 burner; however, the company stopped production of this apparatus shortly after the new test method became final in 2003. The NexGen burner can be considered a direct replacement to the Park-manufactured burner, with several key improvements. The NexGen burner is based on the same operating principle as the Park DPL 3400, using the same, or very similar, internal components to avoid drastically changing the overall character of the flame. The main difference is the elimination of the electric motor, which provided power to the fuel pump and blower fan in the Park-manufactured burner. In the NexGen burner, these functions have been replaced with regulated and conditioned compressed air and a pressurized fuel delivery system. Compressed air, when metered with a sonic orifice and conditioned to remove heat and moisture, proves to be more consistent over extended periods of time than to using a shaft-driven blower and laboratory air for the burner, thus increasing the repeatability of the NexGen burner. NexGen fuel delivery is provided by applying a head pressure of nitrogen gas on liquid fuel contained in a pressure vessel. This new method eliminates any fluctuations that were previously experienced with the electric motor and shaft-driven fuel pump typical of the Park-manufactured burner. The exit air velocity and the fuel flow rate of the NexGen burner were matched to that of the Park DPL 3400 burner specifications to produce a flame of similar temperature and heat flux. Initial comparison tests indicated that the NexGen burner provides burnthrough results similar to that of the Park burner when comparing identical materials. Multiple NexGen burners were produced, and all were proven to provide the same results. NexGen burners were shipped to participating laboratories, tested with identical materials, and proven to be reproducible at different locations. This work has shown that an equivalent burner can be fabricated from readily available materials and can be used to test materials according 14 CFR 25.856 (b). 17. Key Words Burnthrough, Burner, Next generation, Thermal acoustic insulation
18. Distribution Statement This document is available to the U.S. public through the National Technical Information Service Springfield, VA 22161.
19. Security Classif. (of this report) Unclassified
20. Security Classif. (of this page) Unclassified
21. No. of Pages 67
22. Price
Form DOT F 1700.7 (8-72) Reproduction of completed page authorized

ACKNOWLEDGEMENTS
The author would like to acknowledge those who assisted in the completion of this work: Paul Scrofani of SRA International, Inc. for his assistance in the design, development, and testing of the next-generation burner; Frank Hahn of SRA International, Inc. for his work in developing a data acquisition system for the next-generation burner; Tom Carmen and Wayne Eichner of the Federal Aviation Administration (FAA) William J. Hughes Technical Center Model Fabrication Shop for constructing the next-generation burners; and Tim Marker and Richard Hill of the FAA William J. Hughes Technical Center for their guidance and insight.
iii/iv

TABLE OF CONTENTS
Page EXECUTIVE SUMMARY ix INTRODUCTION 1
Purpose 1 Background 1 Park Burner 1
CONCEPT 2
Burner Housing 4 Airflow 4 Stator 7 Turbulator 7 Pressurized Fuel System 8 Fuel Tube 8 Fuel Nozzle 8 Ignition 9
CONTROL 9
Inlet Air Conditions 9 Inlet Fuel Conditions 11
BURNER PERFORMANCE 14
Flame Temperature Measurement 14 Burnthrough Calibration Material 15 NexGen and Park Burner Comparative Test 15 Picture Frame Blanket Holder 18 NexGen Burner Comparative Test 21 Thermal Acoustic Insulation Comparison Test 24
SUMMARY 29 REFERENCES 30 APPENDIX A—NEXT-GENERATION BURNER DRAWINGS
v

LIST OF FIGURES
Figure Page 1 Park DPL 3400 Burner Schematic 2 2 Original Concept Design for the NexGen Burner 3 3 Final Concept Design for the NexGen Burner 3 4 Cutaway View of a Sonic Nozzle 4 5 Comparison of Measured and Theoretical Values of Mass Flow Rate as a Function
of Inlet Pressure 5 6 Comparison of Measured Exit Velocity vs Sonic Choke Inlet Pressure for a Muffler
Section With and Without Foam Insert 6 7 The Muffler Section Without and With a Foam Insert 6 8 Orientation of the Monarch F-124 Turbulator and Stator, With the Turbulator
Alignment Notch Shown at the 6 O’Clock Position 7 9 Measured NexGen Exit Velocity as a Function of Inlet Air Pressure at 50°F 10 10 Exit Velocity as a Function of Temperature at a Fixed Inlet Air Pressure, Indicating
the Air Temperature Tolerance 10 11 Schematic of a Burner Nozzle 11 12 Measured Fuel Flow Rate as a Function of Fuel Temperature at 100-psig Fuel
Pressure 12 13 Measured Flow Rate for Various Monarch Nozzles With Fixed Fuel Pressure and
Temperature (120 psig and 37°F) 13 14 Density of Two Different Fuels at Various Temperatures 14 15 NexGen Burner Temperature Profile and Average Rake Temperature 14 16 Material A Average Burnthrough Times From Various Laboratories and Burners 16 17 Material B Average Burnthrough Times From Various Laboratories and Burners 16 18 Material C Average Failure Times From Various Laboratories and Burners 17
vi

vii
19 Relative Standard Deviation for Each Burner Averaged Over all Three Materials 18 20 Picture Frame Blanket Holder Schematic 19 21 Burnthrough Times of Four Samples of 15948B-8611R on the Picture Frame
Blanket Holder Using the FAA Park Burner 20 22 Comparison of Average Burnthrough Times on the Picture Frame Blanket Holder
With Material 15948B-8611R 20 23 Average Burnthrough Times for Various Materials Tested on the Picture Frame
Blanket Holder With the FAA Park Burner 21 24 Relative Standard Deviation for Various Materials Tested on the Picture Frame
Blanket Holder With the FAA Park Burner 22 25 Average Burnthrough Times for Various Materials Tested on the Picture Frame
Blanket Holder, Various Laboratories and Burners 23 26 Relative Standard Deviation for Each Laboratory, Burner, and Material Tested
With the Picture Frame Blanket Holder 23 27 Relative Standard Deviation of all Burners and Laboratories for Each Material
Tested With the Picture Frame Blanket Holder 24 28 Test Results From Material A at the FAA Laboratory With the Park Burner 25 29 Test Results From Material A at the FAA Laboratory With Burner NG4 25 30 Test Results From Material A at the Boeing Laboratory With Burner NG6 26 31 Test Results From Material B at the FAA Laboratory With the Park Burner 26 32 Test Results From Material B at the FAA Laboratory With Burner NG4 27 33 Test Results From Material B at the Boeing Laboratory With Burner NG6 27 34 Test Results From Material C at the FAA Laboratory With the Park Burner 28 35 Test Results From Material C at the FAA Laboratory With Burner NG4 28 36 Test Results From Material C at the Boeing Laboratory With Burner NG6 29

LIST OF ACRONYMS AND ABBREVIATIONS CEAT Centre D’Essais Aeronautique De Toulouse CFR Code of Federal Regulations FAA Federal Aviation Administration fpm Feet per minute gph Gallon per hour i.d. Inner diameter NexGen Next Generation o.d. Outer diameter PAN Polyacrylonitrile psig Pounds per square inch gauge RSD Relative standard deviation TC Thermocouple
viii

EXECUTIVE SUMMARY Fuselage burnthrough refers to the penetration of an external postcrash fuel fire into an aircraft cabin. Full-scale tests conducted by the Federal Aviation Administration (FAA) using a purpose-built fuselage test rig have highlighted the effectiveness of alternate thermal acoustic insulation materials at significantly delaying or preventing the penetration of an external fuel fire into an aircraft. Delaying the burnthrough event gives passengers additional time to evacuate an aircraft, thus reducing fatalities. A standardized laboratory test method was developed to replicate a typical, postaccident fire event to evaluate the burnthrough resistance of thermal acoustic insulation blankets. The test apparatus uses a burner adjacent to a sample holder to replicate the burnthrough crash scenario. In August 2003, the FAA issued a Final Rule on thermal acoustic insulation flammability, allowing industry 4 years to comply with the new burnthrough test standard, called out in Title 14 Code of Federal Regulations (CFR) Part 25.856(b). The compliance date was extended two more years because of industry concerns. The new standard was based on the use of a specific oil-fired burner, which was manufactured by Park Electric Motors of Atlantic City, NJ. However, shortly after the issuance of the Final Rule, it was discovered that the Park-manufactured burner was no longer being produced, and a suitable replacement would be necessary. A new and improved alternative burner was conceptualized, designed, constructed, and tested. This next-generation (NexGen) burner can be considered a direct replacement for the Park burner because it is based on the same operating principle, and it uses the same, or very similar, internal components to avoid drastically changing the overall character of the flame. The primary difference is the elimination of the electric motor, which provided power to the fuel pump and blower fan in the Park burner. In the NexGen burner, these functions have been replaced with regulated and conditioned compressed air and a pressurized fuel delivery system. Compressed air, when metered with a sonic orifice and conditioned to remove heat and moisture, proves to be more consistent over extended periods of time than using a shaft-driven blower and laboratory air for the burner, thus increasing the repeatability of the NexGen burner. Fuel delivery is provided by applying a head pressure of nitrogen gas on liquid fuel contained in a pressure vessel. This new method eliminates any fluctuations that were previously experienced with the electric motor and shaft-driven fuel pump typical of the Park burner. The exit air velocity and the fuel flow rate of the NexGen burner were matched to the Park DPL 3400 specifications to produce a flame of similar temperature and heat flux. Initial comparison tests indicated that the NexGen burner provides similar burnthrough results to the Park burner when using identical materials. Multiple NexGen burners were produced and all were proven to provide the same results. NexGen burners were shipped to participating laboratories, tested with identical materials, and proven to be reproducible at different locations. This work has shown that an equivalent burner could be fabricated from readily available materials and be used to test materials according to 14 CFR 25.856(b).
ix/x

INTRODUCTION PURPOSE. This report describes the development of a next-generation (NexGen) burner for testing the fire penetration resistance of thermal acoustic insulation in accordance with Title 14 Code of Federal Regulations (CFR) Part 25.856(b). The objective of this work was to design a replacement burner that is similar in burnthrough performance to the currently accepted burner manufactured by Park Electric Motors of Atlantic City, NJ, (herein referred to as Park), which is no longer being produced. The NexGen burner was designed to be equivalent to the Park burner, to perform consistently repeatable and reproducible tests, and to be constructed from readily available materials. BACKGROUND. In August 2003, the Federal Aviation Administration (FAA) issued a Final Rule on thermal acoustic insulation flammability, requiring that the thermal acoustic insulation installed in the lower half of all passenger-carrying aircraft be resistant to fire penetration during a crash accident. The FAA initially allowed industry 4 years to comply with the new burnthrough test standard, identified in 14 CFR 25.856(b). However, concerns about the Park burner caused the FAA to relax the compliance date until September 2, 2009. Shortly after the issuance of the Final Rule in 2003, it was discovered that the Park DPL 3400 burner was no longer being produced. Although many Park burners were still being used in other FAA-required fire tests, many did not contain the specific internal components necessary to properly calibrate the flame. Additionally, it was discovered that two different castings of the burner, one with a flanged connection and one with a socket connection, were produced with the same model number. It was later determined that these two different burners produced different flame patterns for a given set of configuration parameters. Variations in air pressure, density, humidity, and electrical voltage differences were also found to have a slight impact on the performance of the burner in different laboratories. In general, the lack of available burners and associated problems indicated that there was a need to develop a suitable burner that could replace the Park DPL 3400 burner. PARK BURNER. A thorough understanding of the functionality of the Park burner was required before a replacement burner could be designed. A schematic of the Park burner is shown in figure 1. Air enters the burner housing through the airbox, which is throttled with a butterfly valve to regulate the amount of air entering the housing. The electric motor spins the blower fan, which draws air from the airbox and directs it out through the draft tube. Jet A fuel (or equivalent fuel) passes through the fuel filter and is pressurized by the shaft-driven pump to approximately 100 pounds per square inch gauge (psig). The fuel tube, which is axially aligned in the draft tube, connects the fuel pump to the fuel nozzle. The nozzle is a standard burner nozzle with an 80° hollow spray cone. A transformer box delivers high-voltage direct current to the igniters. An air stream stator located inside the draft tube has several functions; it holds the igniters in place, aligns the fuel tube with the axis of the draft tube, and causes the airflow to swirl. As the
1

airflow approaches the fuel nozzle, the swirling motion of the air results in enhanced mixing with the fuel droplets, increasing the evaporation rate and the overall efficiency of the mixing. A second stator located at the exit end of the draft tube (commonly referred to as the turbulator) serves to slightly increase the exit velocity by reducing the exit plane area and to add counter-swirl to the flow.
Figure 1. Park DPL 3400 Burner Schematic
CONCEPT
The basic concept for the NexGen burner was to replace the electric motor and burner housing but retain the draft tube and internal components. The original concept for the NexGen burner is shown in figure 2. The electric motor on the Park burner has two functions: to supply air to the draft tube at a regulated flow rate and to pressurize the fuel. For the concept NexGen burner, air is supplied by an air compressor and metered with a sonic orifice, while fuel is supplied by a pressurized fuel tank. The basic burner operation remains unchanged; only the source of the airflow and fuel pressure change. Each component of the NexGen burner is described in the following sections. A schematic of the finalized conceptual design is shown in figure 3. The dimensioned drawings of the burner are included in appendix A.
2

Figure 2. Original Concept Design for the NexGen Burner
1. Air Pressure Regulator 2. Sonic Choke 3. Bushing 4. Muffler 5. Keyless Bushing 6. Housing Back Section 7. Housing Coupling 8. Cradle
9. Fuel Rail 10. Draft Tube 11. Igniters 12. Stator 13. Nozzle Adapter 14. Fuel Nozzle 15. Turbulator 16. Burner Cone
14
16
15
13
12
11
10
9
5
6
7
8
4
3
2 1
Figure 3. Final Concept Design for the NexGen Burner
3

BURNER HOUSING. The NexGen burner housing was designed in a manner similar to the Park burner, with a removable draft tube for access to the internal components. The NexGen draft tube housing connection is designed like the socket-style Park burner, where the draft tube slides into a coupling with an inner diameter (i.d.) as large as the outer diameter (o.d.) of the draft tube. The draft tube is constructed of 4-inch i.d. mild-seam steel tubing with a wall thickness of 0.125 inch. The length of the draft tube is 15 inches, with 3 inches of the tube inserted into the coupling, resulting in a coupling-to-tip distance of 12 inches. The coupling is constructed of 4.25-inch i.d. mild-seam steel tubing that is 4 inches long with an o.d. of 4.75 inches. Three set-screw holes are 120° apart and are drilled 1 inch in from the edge to hold the draft tube in place. The coupling has two mounting brackets welded to the sides for easy mounting and adjustment. The back section of the housing is made of the same 4-inch tubing as the draft tube, but is 6 inches long, with the first 1 inch inserted into the coupling and welded in place. A back plate is constructed of a 0.125-inch steel plate cut into a circle to cap the back section, with holes for the air inlet, fuel inlet, and two igniter wires. AIRFLOW. The NexGen burner was designed with the intent to not only construct an equivalent burner but also to provide a higher level of accuracy and repeatability. Therefore, a more precise method of metering the airflow was desired. Sonic nozzles, a practical application of converging-diverging nozzle theory, have previously been used in industry and in laboratories to accurately maintain stable gas flow rates in systems where precision is necessary. A sonic nozzle is shown in figure 4. Air enters at the converging end of the nozzle and quickly becomes compressed until it reaches the throat, or the minimum cross-sectional area. At this section, a shock is established, and any perturbations downstream cannot travel upstream; therefore, the flow is unaffected by fluctuations in the downstream pressure. As long as the nozzle inlet pressure can be accurately regulated, the flow downstream of the nozzle will be stable and unaffected by the backpressure.
Figure 4. Cutaway View of a Sonic Nozzle
The sonic nozzle chosen for this purpose was manufactured by Fox Venturi Products of Dover, New Jersey. When selecting the appropriate size nozzle, consideration was given to the inlet air flow rate of the Park burner. The suggested inlet volumetric flow rate for the Park burner is 80.80 ft3/min. Therefore, a nozzle was designed to deliver 80 standard cubic feet per minute at 80-psig inlet pressure. This nozzle, Fox Valve 612021-8, was the chosen flow-metering device
4

for the NexGen burner. A precision air pressure regulator, ARO (Ingersoll-Rand) 27364-000, was used to maintain a steady nozzle inlet pressure. A calibration check was performed on the sonic nozzle to determine the downstream mass flow rate as a function of the inlet pressure and to compare the measured values with those given in the manufacturer’s theoretical calibration sheet. A vortex-shedding mass flow meter was installed downstream of the regulator and sonic nozzle. Mass flow measurements were made at 10-psig intervals in the range from 0- to 80-psig inlet pressure. The resulting comparison is shown in figure 5. It is observable that the measured values are in good agreement with the theoretical calibration.
010
203040
506070
8090
0 10 20 30 40 50 60 70 80 90
Inlet Pressure, psig
Air
Mas
s Flo
w R
ate,
SC
FM
Measured CalibrationTheoretical Calibration
Figure 5. Comparison of Measured and Theoretical Values of Mass Flow Rate as a Function of Inlet Pressure
During early burner development, it was realized that the expansion of the air from the choke created very high levels of noise. To reduce the burner noise to acceptable levels, a compressed air muffler was tested. It significantly decreased the noise levels, but further noise reduction was desired. Reticulated foam, typically used for fuel tank explosion suppression in military aircraft, was cut into a cylindrical shape and forced into the muffler. This drastically reduced the noise levels even further, to a level about equivalent to that of the Park burner. Due to the properties of the sonic choke, there was no reduction in airflow, since the mass flow rate is fixed for a given upstream-to-downstream pressure ratio, and the foam insert has a very low pressure drop. The comparison of measured exit velocities between a muffler with and without foam is shown in figure 6, and figure 7 shows the muffler and foam insert.
5

0
500
1000
1500
2000
2500
0 20 40 60 80 100 120
Inlet Pressure, psig
Vel
ocity
, FPM
No FoamFoam
Figure 6. Comparison of Measured Exit Velocity vs Sonic Choke Inlet Pressure for a Muffler Section With and Without Foam Insert
Figure 7. The Muffler Section Without and With a Foam Insert
6

STATOR. The stator is the stationary internal swirling device in the draft tube that is intended to create swirling air flow and, in turn, enhance mixing of air and fuel droplets. The stator specified for the FAA Park burner and the NexGen burner is the Monarch H215, which is quite critical to the overall burner performance. Adjusting the axial position and azimuthal orientation has had a significant effect on the measured flame temperatures and heat flux, although no thorough understanding of the effect has been determined. The specified stator position and orientation for the Park burner was found during trial-and-error testing of correlating stator adjustments with measured flame heat flux. For the NexGen burner, an axial depth of 4″ from the nozzle tip to the stator face and an azimuthal orientation of 325° ±5° from the igniter centerline to the vertical were found to provide optimal results. During comparison tests of flanged- and socket-style Park burners, it was found that the radius of the stator has a large effect on burner performance, because the flanged burners had a snug fitting stator in the draft tube and the socket burners had a loose fitting stator. Increasing the radius of the stator so that no air is allowed to pass between the tip of the stator vane and the inner draft tube surface improved the consistency of the flame and increased the measured heat flux. This methodology was applied to the NexGen burners as well. From the factory, the Monarch H215 stators were found to be too small in radius and fit quite loosely in the 4-inch steel tubing. The radius of the stators was increased by applying small amounts of metal-filling epoxy to the vane tips and cutting the excess off by spinning it on a lathe. This process results in a stator that fits snugly in the draft tube and properly aligns the fuel tube with the draft tube axis. TURBULATOR. The turbulator used for the NexGen burner is the 4″ by 2 3/4″ Monarch F-124. The alignment notch should be aligned to approximately 6 o’clock, as shown in figure 8.
Turbulator Alignment Notch
Figure 8. Orientation of the Monarch F-124 Turbulator and Stator, With the Turbulator Alignment Notch Shown at the 6 O’Clock Position
7

PRESSURIZED FUEL SYSTEM. A method of fuel pressurization was required that could pressurize the burner fuel to approximately 120 psig. Pumps were initially considered, but to avoid the possible effect of voltage fluctuations on pump performance, an alternative approach was taken. A pressurized fuel system was devised using a pressure vessel containing approximately 15 gallons of jet fuel and a regulated, compressed gas source. The tank was outfitted with various fittings for filling the fuel, venting the tank, the fuel outlet, and a liquid level sight gauge. A bottle of compressed nitrogen gas and a pressure regulator are used to maintain a steady fuel pressure. Fuel tank operations are controlled by electronic solenoid valves that can turn the fuel flow, pressurized gas, or venting on or off. The pressurized fuel system schematic is included in appendix A. FUEL TUBE. The fuel tube in the NexGen burner is designed to allow both the fuel nozzle and the airflow to be aligned with the axis of the draft tube. This is accomplished by creating two bends in the section of the fuel tube that enters the back of the burner. The tube is constructed from 1/8-inch steel pipe with an o.d. of 0.405 inch, an i.d. of 0.215 inch, and a wall thickness of 0.095 inch. The pipe is cut to a length of approximately 21.5 inches, then a section of the outer wall is removed on a lathe to fit the pipe through the keyless bushing that holds the tube in place. The outer diameter of the fuel tube is reduced to approximately 0.356 inch for a length of 4 inches at one end. The tube is then shaped with a pipe bender according to the dimensions in the drawing. A die is used to thread both ends of the tube with 0.125-inch pipe threads. Heavy duty 0.004-inch-thick thread seal tape is wrapped on the pipe threads to prevent fuel leakage. A 1.375-inch-long brass fuel nozzle adapter is threaded onto the front end of the fuel tube where the fuel nozzle will be attached. A keyless bushing (Fenner Drives p/n 6202109) is used to hold the back end of the fuel tube in place. A pipe fitting is attached to the back end of the fuel tube to connect the pressurized fuel system to the fuel tube. FUEL NOZZLE. A Monarch F-80 5.5-gallon per hour (gph), 80° “PL” hollow-cone fuel nozzle is used as the fuel nozzle for the NexGen burner. This nozzle is very similar to that specified for the Park burner, only the Park burner specifies the 6.0-gph-rated model. The rated flow rate is provided by the manufacturer and is achieved when applying a 100-psig fuel pressure to the nozzle. If a different flow rate is desired, the pressure can be adjusted accordingly to achieve a wide range of flow rates. Generally speaking, the flow rate is related to the pressure by: [1]
r
drd P
PFF = (1)
Where Fd is the desired flow rate, Fr is the rated flow rate, Pd is the desired pressure, and Pr is the rated pressure, typically 100 psig. It was previously found for the Park burners that if a 6.0-gph-rated nozzle is not available, a 6.5-gph-rated nozzle of the same type will suffice when the applied pressure is reduced to approximately 85 psig. Conversely for the NexGen burner, if a 5.5-gph-rated nozzle is operated at 120 psig, a flow rate of 6.0 gph will be achieved.
8

Previous research has shown that the construction of the Monarch F-80 nozzles has changed over the years, and although a nozzle may be stamped Monarch F-80, there can be two different internal backing screw configurations, which are believed to have an effect on the spray characteristics. The original Park burner was calibrated and tested with the slotted nozzle, and it was determined that this type of nozzle performed better than the hex-head nozzle. The lack of availability of 6.0- and 6.5-gph-rated slotted Monarch F-80 nozzles led to the use of the 5.5-gph-rated slotted Monarch F-80 nozzles for the NexGen burner. IGNITION. The ignition system used for the NexGen burner is identical to that of the Park burner. A high-voltage transformer is used to create an arc between a pair of ceramic insulated electrodes. The igniters have 9/16″ diameter, 5″ long ceramic insulators with 3/32″ diameter electrodes. The electrode tips are positioned at a depth of 5/32″ from the exit plane of the turbulator.
CONTROL
The NexGen burner has less of a measurable calibration procedure than the Park burner, mainly due to the difficulties found with using certain measuring devices and stringent restrictions placed on the inlet parameters of the NexGen burner. The idea is that if the properties of the airflow and the fuel flow and the physical construction of the burner remain constant, then the output of the burner will not vary significantly. Specifically, maintaining the air and fuel temperatures and pressures within a defined range eliminates large fluctuation of critical parameters, resulting in less variability in the flow rates of each. The simplest way to standardize the temperature range is to use ice water to remove heat from the fluids. An ice bath can be constructed to cool the fuel directly and the air indirectly by cooling water to use as a thermally absorbing fluid in a heat exchanger. Details of the construction of the heat exchange system used at the FAA William J. Hughes Technical Center can be found in appendix A. INLET AIR CONDITIONS. When choosing an appropriate inlet air pressure, several factors were considered, most importantly, the mass flow rate and the burner exit air velocity. The Park burner had a specified inlet air flow rate of 80.80 ft3/min, determined by multiplying the measured inlet air velocity by the cross-sectional area of the measuring device. When measuring the exit air flow rate with the same device, a much lower volumetric flow rate was found, possibly due to leaks or frictional losses. Regardless of the cause of the discrepancy, the more critical factor (and the one to emulate with the NexGen burner) is the exit velocity, because flame momentum, among other things, can have a significant impact on material burnthrough time. Since the Park burner is the standard that the NexGen is being designed to, the exit velocity of the NexGen was to be matched closely to the Park burner. The Park burner was found to have an exit velocity of approximately 1300 feet per minute (fpm) when the inlet velocity was maintained at 2000 fpm. The velocity was measured in the same manner on the NexGen burner at 10-psig increments of the inlet air pressure. The correlation between sonic nozzle inlet air pressure and measured exit velocity is shown in figure 9. The inlet
9

pressure that corresponds to approximately 1340-fpm exit velocity is found at 60 psig. Subsequent testing has shown that the 60-psig setting gave very good agreement in burnthrough times when compared to the Park burner. The measurements in figure 6 were recorded at an inlet air temperature of 50°F. Similar measurements were made at an inlet air temperature of 110°F, where the exit velocity was measured 1435 fpm at 60 psig. The exit velocity, as a function of temperature at 60-psig inlet pressure, was interpolated from these measurements, and is shown in figure 10. It is observable that over a range of 100°F, the exit velocity can vary 150 fpm at a fixed inlet pressure. By standardizing the air temperature to within a specified range, the variation in exit velocity is reduced to only 30 fpm. Based on these measurements, the required inlet air pressure for the NexGen burner is 60 ±2.5 psig, with a working air temperature of 50º ±10ºF.
0
500
1000
1500
2000
2500
0 20 40 60 80 100 120
Inlet Pressure, psig
Vel
ocity
, FPM
Figure 9. Measured NexGen Exit Velocity as a Function of Inlet Air Pressure at 50°F
0
500
1000
1500
2000
2500
0 20 40 60 80 100 120
Vel
ocity
, FPM
Inlet Pressure, psig
Figure 10. Exit Velocity as a Function of Temperature at a Fixed Inlet Air Pressure, Indicating the Air Temperature Tolerance
10

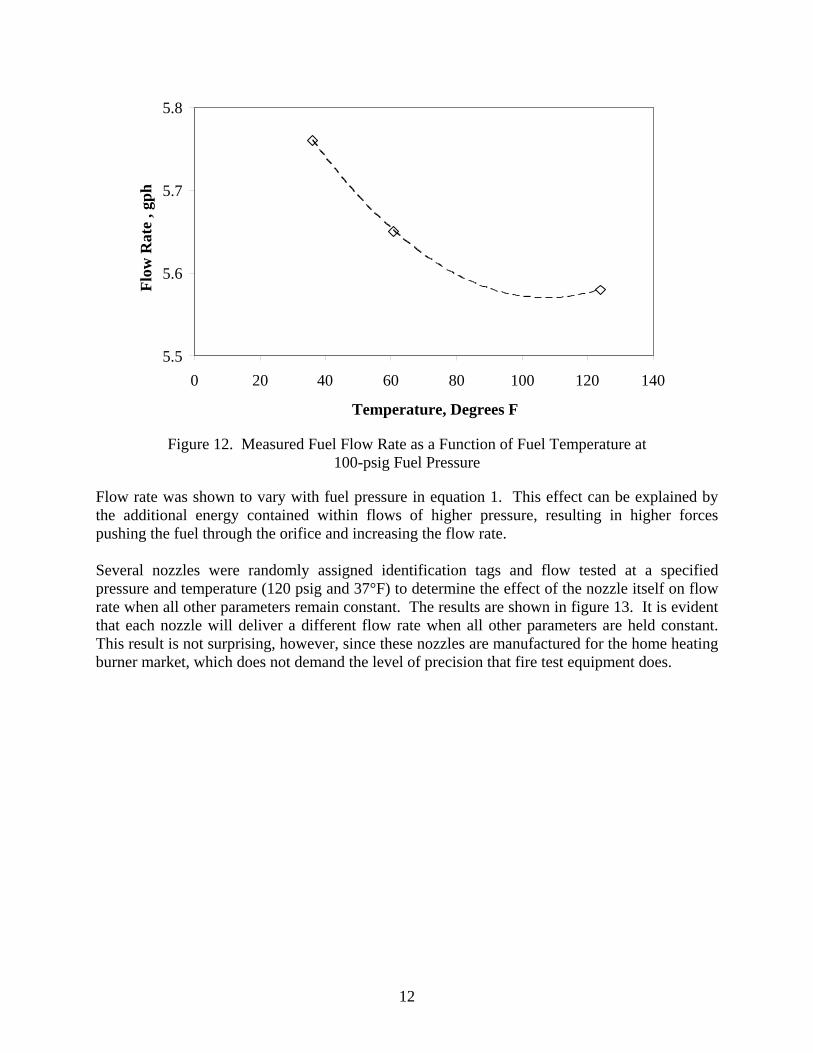
INLET FUEL CONDITIONS. The flow of fuel through oil nozzles is known to be affected by several parameters, including fuel temperature, pressure, nozzle geometry, and fuel type. Fuel density and viscosity vary inversely with temperature; hence, colder fuel will have a higher density and viscosity than warmer fuel. Typically, viscous fluids tend to flow slower than less viscous fluids. In oil nozzles, however, colder fuel results in a higher flow rate than warmer fuel, due to the mechanics of the spray nozzle, as shown in figure 11. When cold fuel exits the nozzle orifice, the walls of the spinning tube of oil are thicker than for warm fuel. Thick walls reduce the air core diameter, resulting in more oil than air in the orifice, thus increasing the flow rate [1]. The flow was measured at different fuel temperatures, as shown in figure 12. The dependence on temperature is clearly shown, and in the range of temperatures typically occurring in the laboratory, there can be as much as 3.1% difference in flow rate.
Figure 11. Schematic of a Burner Nozzle [1]
11
Flow
Rat
e , g
ph
Temperature, Degrees F
120 140100805.5
5.6
5.7
5.8
0 20 40 60
Figure 12. Measured Fuel Flow Rate as a Function of Fuel Temperature at 100-psig Fuel Pressure
Flow rate was shown to vary with fuel pressure in equation 1. This effect can be explained by the additional energy contained within flows of higher pressure, resulting in higher forces pushing the fuel through the orifice and increasing the flow rate. Several nozzles were randomly assigned identification tags and flow tested at a specified pressure and temperature (120 psig and 37°F) to determine the effect of the nozzle itself on flow rate when all other parameters remain constant. The results are shown in figure 13. It is evident that each nozzle will deliver a different flow rate when all other parameters are held constant. This result is not surprising, however, since these nozzles are manufactured for the home heating burner market, which does not demand the level of precision that fire test equipment does.
12

5.4
5.6
5.8
6.0
6.2
6.4
OS5 OS4 OS2 OS11 OS12 OS6 OS8 OS9 OS10 OS7
Nozzle Identification Tag
Flow
rate
, GPH
Figure 13. Measured Flow Rate for Various Monarch Nozzles With Fixed Fuel Pressure and Temperature (120 psig and 37°F)
The density of jet fuel is known to vary for fuel refined in different locations in the world or refined to different specifications (Jet A, JP8, etc.). The density of JP8 jet fuel used in Atlantic City, New Jersey, was measured and compared with the density of Jet A jet fuel used in Seattle, Washington, as displayed in figure 14. It is evident that at a given temperature, the Jet A jet fuel from Seattle has a higher density than the JP8 jet fuel from Atlantic City. The overall effect of the specific batch of fuel on flow rate has not yet been clearly established, but this factor should be considered when defining the constraints to which the burner must comply. Of the parameters discussed, only the fuel temperature and pressure can be varied to adjust the flow rate to the desired value of 6.0 gph. The specific nozzle and fuel batch are parameters that are not easily varied; they can only be substituted with alternatives. Therefore, for a given nozzle and fuel batch, the fuel temperature must be 42° ±10°F, and the fuel pressure must be 120 ±2.5 psig. Increasing or decreasing the fuel pressure beyond these limits will have an effect on the mean droplet size and spray distribution, which may have an effect on the combustion processes. If a flow of 6.0 ±3 gph cannot be achieved with a nozzle under these tolerances, then a different nozzle should be tested.
13

775 780 785 790 795 800 805 810 815 820 825
0 20 40 60 80 100 120 140
Temperature, Degrees F
Den
sity
, kg/
m3
JP8, Atlantic City, NJ Jet A, Seattle, WA
Figure 14. Density of Two Different Fuels at Various Temperatures
BURNER PERFORMANCE FLAME TEMPERATURE MEASUREMENT. The flame temperature of the NexGen burner was measured in accordance with the procedure outlined for the Park burner in chapter 24 of the FAA Aircraft Materials Fire Test Handbook [2]. Figure 15 displays two flame temperature profiles measured at different times, indicating good flame repeatability. All thermocouple (TC) temperatures and the average temperature are within the specified range of 1900° ±100°F.
18001820184018601880190019201940196019802000
TC 1TC 2
TC 3TC 4
TC 5TC 6
TC 7
Averag
e
Tem
pera
ture
, ºF
Thermocouple, Left to Right
Measurement 1Measurement 2
Figure 15. NexGen Burner Temperature Profile and Average Rake Temperature
14

Early in the development of the NexGen burner, there were occasions when the temperature measured on TC 1 was approximately 1720°F, well below the specified tolerance. After the burner was turned off, a soot “jacket” was found on TC 1, insulating the thermocouple and giving false readings. In this situation, it was determined that rotating the nozzle would alter the flame temperature profile and eliminate thermocouple sooting, implying asymmetry of the nozzle spray pattern. Incremental rotation of the nozzle would eventually result in a more suitable flame temperature profile. BURNTHROUGH CALIBRATION MATERIAL. A material was desired with a characteristic burnthrough time to compare burnthrough results between the NexGen and the Park burners. Previous burnthrough research has led to the refinement of a polyacrylonitrile (PAN) material for this use. Tex Tech Industries assisted the FAA in this research by providing PAN materials manufactured under stringent controls to reduce variability in the material. The materials were cut into 36″ by 32″ sheets, measured, weighed, and sent to the FAA for burnthrough testing. Results were discussed amongst the manufacturer and FAA engineers, and the next iteration of materials was manufactured to determine the effect of different manufacturing processes on the consistency of the material. Several iterations were made until two materials that met FAA requirements were chosen, material A (8579) with a density of 8 oz/yd2, and material B (8611) with a density of 14 oz/yd2. These two materials were found to have two different burnthrough times, with material A failing at about three minutes, and material B failing at about four minutes. NEXGEN AND PARK BURNER COMPARATIVE TEST. A comparative test was necessary to determine if the NexGen burner would provide similar results to a properly calibrated Park burner. The NexGen burner was entered into a round-robin burnthrough comparison with six Park burners at various locations throughout the world. The materials chosen to evaluate burnthrough performance were PAN materials from Tex Tech Industries, materials A and B, and a ceramic paper material used to compare back-side heat flux failure times, designated material C. The round-robin test was performed according to the procedures as outlined in chapter 24 of the FAA Aircraft Materials Fire Test Handbook [2]. The overall results from materials A, B, and C are displayed in figures 16, 17, and 18, respectively. In the figures, each bar represents the average burnthrough time out of a set of four tests for a particular laboratory and burner. All burners are Park socket-type burners except for the FAA flanged and the NexGen burners. The figures indicate good agreement between the NexGen burner and the FAA Park flanged burner. The results show that the NexGen burner does not deviate much more than the other properly calibrated Park burners.
15

0
20
40
60
80
100
120
FAAFlanged
FAASocket
FAASocket 2
NexGen Lab C Lab I Lab J
Bur
nthr
ough
Tim
e, se
c.Average = 95.3 sec.
Figure 16. Material A Average Burnthrough Times From Various Laboratories and Burners
0
50
100
150
200
250
300
350
FAA FAA FAA NexGen Lab C Lab I Lab J
Bur
nthr
ough
Tim
e, se
c.
Flanged Socket Socket 2
Average = 265.9 sec.
Figure 17. Material B Average Burnthrough Times From Various Laboratories and Burners
16

0
50
100
150
200
250
FAAFlanged
FAASocket
FAASocket 2
NexGen Lab C Lab I Lab J
Tim
e to
Exc
eed
2.0
BT
U/ft
2 *s, s
ec.
Average = 100.7 sec.
Figure 18. Material C Average Failure Times From Various Laboratories and Burners
The round-robin test was a good exercise in proving the validity of the NexGen burner concept. By matching the fuel flow rate, exit air velocity, and flame temperatures to those of the Park burner, the NexGen burner was able to provide very similar burnthrough results. These studies proved that a NexGen burner could be constructed and provide similar results to the FAA Park burner. Of particular concern following the round-robin test was the consistency of the test results. The relative standard deviation is useful in determining consistency, and can be calculated by: [3] ( )xRSD σ*100(%) = [3] (2)
where RSD is the relative standard deviation, σ is the standard deviation of the sample set, and x is the average value of the sample set. The relative standard deviation is the magnitude of the standard deviation relative to the average; it is useful when comparing individual sample sets with averages of various magnitudes. It is used in this analysis to compare the consistency of the burner itself when measuring burnthrough times of two materials with different average burnthrough times. A lower relative standard deviation indicates good precision and test to test repeatability; a higher one indicates poor repeatability or a possible problem. The average relative standard deviations from the round-robin test for each burner are shown in figure 19.
17

0
5
10
15
20
FAAFlanged
FAASocket
FAASocket 2
NexGen Lab C Lab I Lab J
Rel
ativ
e St
anda
rd D
evia
tion,
%
Figure 19. Relative Standard Deviation for Each Burner Averaged Over all Three Materials
The FAA Park burners and the Laboratory C burner had a repeatability of about 10%, the NexGen and Laboratory J around 12%, and Laboratory I around 15%. Relative standard deviations of this magnitude indicate significant variability from test to test, which can be attributed to the combined effects of the variations of the burner, material, test method, or other unknown effects. For NexGen burner research, it is important to determine how much of the variability is caused by the burner itself and not by other effects. To reduce or eliminate variability caused by the material and the test method, a different method of measuring calibration material burnthrough times was devised. PICTURE FRAME BLANKET HOLDER. Continuous testing of the calibration material resulted in significant warpage of the test frame, causing misalignment of the frame relative to the burner and offsetting the distance between the material and the burner exit plane. It was generally known that when testing relatively thin materials on the test frame, the method and location of placing the clamps had a significant impact on the test results. Considering these problems, a new test method was desired for evaluating burner performance that was free of these and other influences and could accurately measure burner repeatability. The resulting test frame, identified as the picture frame blanket holder, is shown in figure 20.
18

Figure 20. Picture Frame Blanket Holder Schematic
The picture frame blanket holder was designed to securely hold one sample of calibration material measuring 36″ wide by 18″ high. An outer frame, angled at 30° from the vertical, held the blanket parallel to the exit plane of the burner cone. Four vertical support wires keep the material from falling towards the cone with minimal interference. An inner frame with two vertical support wires was placed on the back surface of the sample to hold the material in place. The design of the picture frame eliminated the variability caused by clamping the calibration material, test frame warpage, and alignment. Also, the original test frame required two calibration blankets each measuring 32″ wide by 36″ high, whereas the picture frame required one quarter of the amount of material, resulting in less waste and more data points per material order. The details of the construction and use of the picture frame blanket holder are provided in appendix A. Initial picture frame tests were performed with the FAA Park burner and the two PAN calibration materials. One material was chosen for initial testing, identified as 15948B-8611R, where 15948B is the roll number and 8611R is the material type. Four samples were tested on the picture frame, and the results are shown in figure 21.
19

0
50
100
150
200
250
1 2 3 4
15948B-8611 Samples
Bur
nthr
ough
Tim
e, se
c.
Figure 21. Burnthrough Times of Four Samples of 15948B-8611R on the Picture Frame Blanket Holder Using the FAA Park Burner
The results from the initial tests indicate that the picture frame has much better repeatability, with a relative standard deviation of 0.7%. Compared to the round-robin relative standard deviation of 10.03%, the picture frame is a significant improvement for evaluating burner consistency. It indicates that much of the 10% error from the round-robin tests was caused not by the burner but by the test frame and clamping method. The same material was tested with the NexGen burner, and the comparison of the average burnthrough times is shown in figure 22.
0
50
100
150
200
250
Bur
nthr
ough
Tim
e, se
c.
FAA Flanged Park NexGen
Figure 22. Comparison of Average Burnthrough Times on the Picture Frame Blanket Holder With Material 15948B-8611R
20

Figure 22 shows that the results from the NexGen burner are very close to the FAA Park burner. RSDs of 0.7% for the Park burner and 2.7% for the NexGen burner are a significant improvement over the 10% and above from the original test frame. The initial picture frame test was a successful tool to evaluate burner consistency. The picture frame blanket holder was developed only as a tool to determine if a burner is working properly, by comparing results obtained from testing a specific material with the subject burner and the FAA Park burner. It is not intended, nor is it sufficient, to test the fire penetration resistance of thermal acoustic insulation. NEXGEN BURNER COMPARATIVE TEST. The development of the picture frame blanket holder provided a more accurate tool for evaluating the performance of the NexGen burner. Several additional NexGen burners were constructed following the same design and were tested under the same strict controls to determine the reproducibility of the design. The intention was to test the burners at the FAA on the picture frame blanket holder, ship them to a participating laboratory, and test them in a different environment with a picture frame blanket holder to determine the effects of location. Four rolls of two different materials were chosen for the evaluation: 19391-8579R, 19391A-8579R, 19394-8611R, and 19395-8611R. Each 32″ by 36″ blanket was labeled, measured, and weighed by the manufacturer before shipment to the FAA, where the blankets were cut into 18″ by 36″ samples, sorted, and distributed to each participating laboratory. The results of the FAA Park burner are shown in figure 23.
0
50
100
150
200
250
19391-8579R 19391A-8579R 19394-8611R 19395-8611R
Material
Bur
nthr
ough
Tim
e, se
c.
Figure 23. Average Burnthrough Times for Various Materials Tested on the Picture Frame Blanket Holder With the FAA Park Burner
21

The average burnthrough times were calculated from a sample set of 4 data points for each material. There is a clear difference between the average burnthrough times of the 8579R and 8611R material, and a subtle difference between the two rolls of the same material. Relative standard deviations from this sample set are shown in figure 24. It is evident that the repeatability is good, with all relative standard deviations below 5%.
0.00
0.50
1.00
1.50
2.00
2.50
3.00
19391-8579R 19391A-8579R 19394-8611R 19395-8611R
Material
Rel
ativ
e St
anda
rd D
evia
tion,
%
Figure 24. Relative Standard Deviation for Various Materials Tested on the Picture Frame Blanket Holder With the FAA Park Burner
Five NexGen burners were constructed and tested for comparison with the FAA Park burner. Some burners were tested in only one location; others were tested both at the FAA and another laboratory. The burners are designated by a unique identification tag indicating the location of the burner and the number it was assigned. For example, FAA NG1 is NexGen burner number one tested at the FAA, whereas CEAT NG1 is the same burner tested at Centre D’Essais Aeronautique De Toulouse (CEAT) in Toulouse, France. In these comparison tests, five NexGen burners were tested against the FAA Park burner. The same materials were tested for each burner and location, and in most cases, the tests were witnessed by FAA personnel. The average burnthrough times obtained from this testing are shown in figure 25 and the relative standard deviations for each laboratory and burner are shown in figure 26. Good agreement is found between the NexGen burners and the FAA Park burner. RSDs are found to be below 5% for all but one case, indicating good repeatability for each burner. The reproducibility can be determined by calculating the relative standard deviation over the entire sample set for each material, as shown in figure 27. The reproducibility is below 5% for all materials, with an average reproducibility of 4.06%. Figure 27 represents all burners, laboratories, and materials tested, and considering all aspects of each test, this indicates very good test reproducibility.
22

0
50
100
150
200
250
19391-8579R
19391A-8579R
19394-8611R
19395-8611R
Material
Bur
nthr
ough
Tim
e, se
c. FAA-ParkFAA-NG1CEAT-NG1FAA-NG2FAA-NG4FAA-NG5Boeing-NG6
Figure 25. Average Burnthrough Times for Various Materials Tested on the Picture Frame Blanket Holder, Various Laboratories and Burners
0.00
1.00
2.00
3.00
4.00
5.00
6.00
19391-8579R
19391A-8579R
19394-8611R
19395-8611R
Rel
ativ
e St
anda
rd D
evia
tion,
%
Material
FAA-ParkFAA-NG1CEAT-NG1FAA-NG2FAA-NG4FAA-NG5Boeing-NG6
Figure 26. Relative Standard Deviation for Each Laboratory, Burner, and Material Tested With the Picture Frame Blanket Holder
23

0
1
2
3
4
5
6
19391-8579R 19391A-8579R 19394-8611R 19395-8611R
Material
Rel
ativ
e St
anda
rd D
evia
tion,
%
Figure 27. Relative Standard Deviation of all Burners and Laboratories for Each Material Tested With the Picture Frame Blanket Holder
THERMAL ACOUSTIC INSULATION COMPARISON TEST. Although the results from the comparative tests indicate that the NexGen burner performance is in good agreement with that of the Park burner, one question remained. The picture frame blanket holder was developed as a tool to accurately measure the burnthrough performance of a burner and compare it to others. This test method implied that the original test frame and clamping method were the cause of much of the inconsistency in the earlier test results. The question is, does the original test frame cause the same amount of inconsistency for all materials, including thermal acoustic insulation blankets, or only for thin materials, like the Tex Tech PAN calibration material? To test this, three different thermal acoustic insulation blanket assemblies (designated A, B, and C) were tested on three different burners for both burnthrough and heat flux failures. Each assembly consisted of different types of film, fire-blocking layer, and insulation batting. Three samples of each material were tested on each burner, for a total of nine tests. The test burners were the FAA flanged Park, the FAA NexGen 4, and The Boeing Company’s NexGen 6. Of the three material types tested, only one (material A) failed the burnthrough test. Material A had sporadic behavior, and could last over 6 minutes or fail in 20 seconds. This behavior was observed at Boeing’s fire test laboratory and on both FAA burners. Materials B and C were good performers, withstanding the burner flame for 5 1/2 to 6 minutes without burning through or achieving a back-side heat flux over 2.0 Btu/ft2*s on all burners. An example of a test of material A that did not fail for burnthrough or back-side heat flux is shown in figure 28 for the FAA Park burner, figure 29 for the FAA NG4, and figure 30 for the Boeing NG6. Material B is shown in figure 31 for the FAA Park burner, figure 32 for the FAA
24

NG4, and figure 33 for the Boeing NG6. Material C is shown in figure 34 for the FAA Park burner, figure 35 for the FAA NG4, and figure 36 for the Boeing NG6.
0
20
40
60
80
100
120
140
0 100 200 300 400 500Time, sec.
Tem
pera
ture
, °F
0.0
0.2
0.4
0.6
0.8
1.0
1.2
Bac
ksid
e H
eat F
lux,
BT
U/ft
2 s
AirTempFuelTempCal1Cal2
Warm-up
Figure 28. Test Results From Material A at the FAA Laboratory With the Park Burner
0
20
40
60
80
100
120
140
0 100 200 300 400 500
Pres
sure
, psig
and
Tem
pera
ture
, °F
0.0
0.2
0.4
0.6
0.8
1.0
1.2
Bac
ksid
e H
eat F
lux,
BT
U/ft
2 s
Time, sec.
AirPresFuelPresAirTempFuelTempCal1Cal2
Warm-up
Figure 29. Test Results From Material A at the FAA Laboratory With Burner NG4
25

0
20
40
60
80
100
120
140
0 100 200 300 400 500Time, sec.
Pres
sure
, psig
and
Tem
pera
ture
°F
0.0
0.2
0.4
0.6
0.8
1.0
1.2
Bac
ksid
e H
eat F
lux
BT
U/ft
2s
AirPresFuelPresAirTempFuelTempCal1Cal2
Warm-up
Figure 30. Test Results From Material A at the Boeing Laboratory With Burner NG6
0
20
40
60
80
100
120
140
0 100 200 300 400 500
Tem
pera
ture
, °
Time, sec.
F
0.0
0.2
0.4
0.6
0.8
1.0
1.2
Bac
ksid
e H
eat F
lux,
BT
U/ft
2 s
AirTempFuelTempCal1Cal2
Warm-up
Figure 31. Test Results From Material B at the FAA Laboratory With the Park Burner
26

0
20
40
60
80
100
120
140
0 100 200 300 400 500
Time, sec.
Pres
sure
, psig
and
Tem
pera
ture
, °F
0.0
0.2
0.4
0.6
0.8
1.0
1.2
Bac
ksid
e H
eat F
lux,
BT
U/ft
2 s
AirPresFuelPresAirTempFuelTempCal1Cal2
Warm-up
Figure 32. Test Results From Material B at the FAA Laboratory With Burner NG4
0
20
40
60
80
100
120
140
0 100 200 300 400 500
Pres
sure
, psig
and
Tem
pera
ture
°F
0.0
0.2
0.4
0.6
0.8
1.0
1.2
Bac
ksid
e H
eat F
lux
BT
U/ft
2 s
Time, sec.
AirPresFuelPresAirTempFuelTempCal1Cal2
Warm-up
Figure 33. Test Results From Material B at the Boeing Laboratory With Burner NG6
27

0
20
40
60
80
100
120
140
0 100 200 300 400 500
Time, sec.
Tem
pera
ture
, °F
0.00.20.40.60.81.01.21.41.61.82.0
Bac
ksid
e H
eat F
lux,
BT
U/ft
2 s
AirTempFuelTempCal1Cal2
Warm-up
Figure 34. Test Results From Material C at the FAA Laboratory With the Park Burner
0
20
40
60
80
100
120
140
0 100 200 300 400 500
Pres
sure
, psig
and
Tem
pera
ture
, °F
0.00.20.40.60.81.01.21.41.61.82.0
Bac
ksid
e H
eat F
lux,
BT
U/ft
2 s
Time, sec.
AirPresFuelPresAirTempFuelTempCal1Cal2
Warm-up
Figure 35. Test Results From Material C at the FAA Laboratory With Burner NG4
28

0
20
40
60
80
100
120
140
0 100 200 300 400 500
Time, sec.
Pres
sure
, psig
and
Tem
pera
ture
, °F
0.00.20.40.60.81.01.21.41.61.82.0
Bac
ksid
e H
eat F
lux,
BT
U/ft
2 s
AirPresFuelPresAirTempFuelTempCal1Cal2
Warm-up
Figure 36. Test Results From Material C at the Boeing Laboratory With Burner NG6
All figures indicate that the burner input parameters were steady during the tests, consistently repeatable from test to test, and reproducible from laboratory to laboratory. The results from each burner also show that the materials and the burners behaved almost identically at each location; for a given material, similar heat flux profiles were obtained at different laboratories, showing the reproducibility of the burner. This series of testing demonstrated that the original test frame is more than sufficient for providing a sound test method with repeatable and reproducible results. The primary cause of the error observed in the round-robin test was the combined effect of a thin calibration material, the warping of the test frame, and various clamping locations and tensions.
SUMMARY A NexGen burner was constructed to test the fire penetration resistance of thermal acoustic insulation on passenger aircraft in accordance with 14 CFR 25.856(b). The NexGen burner was designed to replace the currently accepted burnthrough test apparatus, the Park burner. The NexGen burner was constructed from readily available materials and components so that a NexGen burner could be built now or at any time in the future. The fundamental operation of the burner closely matches the FAA Park burner so the overall character of the flame is not drastically different. Several key parameters of the NexGen burner are tightly regulated so that all NexGen burners around the world will be operated with identical input conditions, eliminating the need for complicated calibration measurements. A picture frame sample holder was constructed to ensure that all burners performed similarly. The picture frame proved to be a very useful tool in demonstrating the reproducibility of the NexGen burner design, as all of the NexGen burners tested provided similar results. Several thermal acoustic insulation samples were tested on the original test frame to determine if the NexGen burners perform like the FAA Park burner in an actual test scenario. Test results from two NexGen burners were in very good agreement with each other and with the FAA Park burner, proving that the NexGen burner is
29

30
adequate for testing the fire penetration resistance of thermal acoustic insulation in accordance with 14 CFR 25.856(b).
REFERENCES 1. Danfoss Hago, Inc., Hago Manufacturing Co., “A Technician’s Guide to Oil Burner
Nozzles.” http://hago.danfoss.com, last visited March, 2009. 2. Federal Aviation Administration, “Aircraft Materials Fire Test Handbook,” Chapter 24,
Federal Register, Vol. 68, No. 147, July 2003, also found in http://www.fire.tc.faa.gov/handbook.stm.
3. Figliola, R. and Beasley, D., Theory and Design for Mechanical Measurements, 3rd ed.,
John Wiley & Sons, Inc., New York, 2000.

APPENDIX A—NEXT-GENERATION BURNER DRAWINGS Figures A-1 through A-9 show the schematics and drawings for the next-generation (NexGen) burner, figure A-10 shows the pressurized fuel system, figures A-11 and A-12 show the heat exchange system, and figures A-13 through A-27 show the picture frame blanket holder. All dimensions are in inches, and a tolerance of ±1% is allowed for all measurements. Any modifications or improvements made to the design of the NexGen burner by the Federal Aviation Administration (FAA) will be posted on the FAA Fire Safety website:
http://www.fire.tc.faa.gov/materials/burnthru/nexgen.stm
A-1

A-2
Figure A-1. Exploded View of the NexGen Burner
1. Steel tubing, mild seam, 4″ inner diameter (i.d.), 4.25″ outer diameter (o.d.) 2. Steel tubing, mild seam, 4.25″ i.d., 4.75″ o.d. 3. Pressure regulator, ARO (Ingersoll-Rand) p/n 27364-000 4. Sonic nozzle, Fox Valve p/n 612021-8 5. Muffler, McMaster-Carr p/n 5889K73 6. Stator, Monarch H215 replicate modified with metal-filling epoxy 7. Fuel tube, steel tubing, 0.215″ i.d., 0.405″ o.d. 8. Igniters, Westwood Products part number E5-2M5, insulator diameter 9/16″, length 5″, 3/32″ electrode diameter 9. Fuel nozzle, Monarch 5.5 gph 80° PL F-80 nozzle 10. Turbulator, Monarch F124 4″ x 2 ¾″ 11. Cone, built as described in FAA Aircraft Materials Fire Test Handbook chapter 24 12. Keyless bushing, Fenner® Drives Trantorque® GT, p/n 6202109

A-3
Figure A-2. Dimensions of the Back Section

A-4
Figure A-3. Dimensions of the Coupling

A-5
Figure A-4. Back Section and Coupling Welded Together

A-6
Figure A-5. Dimensions of the Draft Tube

A-7
Figure A-6. Dimensions of the Fuel Tube

A-8
Figure A-7. Assembled Burner With Stator Orientation

A-9
Figure A-8. Photograph of the Igniter Wires From Above

A-10
Figure A-9. Photograph of the Igniter Wires From Below

A-11
Solenoid or manual ball valve
Pressure Regulator (in the range of 0-150 psig) e.g., Bellofram Type 70 Pressure Regulator, 2-150 psig, max 250 psig inlet, approx $79
Fuel
Air/N2 @ ~120 psig
Solenoid or manual ball valve
Compressed gas (from bottled Nitrogen or Air, or air compressor, if it is capable
Vent Pressurized Air Inlet
Vent to lab or outdoors
Pressure Vessel (for example, McMaster-Carr p/n 1584K7, ASME-Code Vertical Pressure Tank W/O Top Plate, 15 Gallon Capacity, 12" Dia X 33" L, $278.69) or any suitable pressure vessel that can withstand pressures of around 150 psig.
Fuel Fill
Fuel Outlet
Solenoid or manual ball valve
High pressure liquid level sight gauge (We use McMaster Carr p/n: 3706K23)
Needle valve to control venting
Ice Bath
Nozzle 5.5 GPH 80 deg-PL
Figure A-10. Schematic of the Pressurized Fuel System

Fuel Tank
Water Pump
Air From Compressor
Condensate Separator McMaster-Carr p/n 43775K55
Burner Cooler
Blue = Water Lines Orange = Fuel Lines Black = Air Lines
Heat Exchanger McMaster-Carr p/n 43865K78
A-12
Figure A-11. Schematic of the Heat Exchange System

A-13
3/8” copper tubing 5” circles, 15 circles per coil 30 circles total + 25” additional length Approximate cooling surface area = 585 in2
1/4” copper tubing 5” circles, 15 circles per coil 30 circles total + 25” additional length Approximate cooling surface area = 390 in2
Air Cooling Water in/out
Ice / Water Mixture Water pump flowrate approximately 2.25 LPM
Fuel Cooling Fuel in/out
Insulated Beverage Cooler 72 qt. capacity
Figure A-12. Ice Bath With Copper Coils

SUPPORTS
OUTER FRAME
INNER FRAME
A-14
Figure A-13. Component View of the Picture Frame Blanket Holder

A-15
WIRES
BOTTOM
TOP
SIDE
SIDE
Figure A-14. Exploded View of the Inner Frame

A-16
Figure A-15. Dimensions of the Vertical Inner Frame Members

A-17
Figure A-16. Dimensions of the Horizontal Inner Frame Members

A-18
Figure A-17. Assembled Inner Frame

WIRES
BOTTOM
TOP
SIDE SIDE
A-19
Figure A-18. Exploded View of the Outer Frame

A-20
Figure A-19. Dimensions of the Vertical Outer Frame Members (All dimensions are inches.)

A-21
Figure A-20. Dimensions of the Horizontal Outer Frame Members (All dimensions are inches.)

A-22
Figure A-21. Assembled Outer Frame (All dimensions are inches.)

A-23
Figure A-22. Dimensions of the Support Members (All dimensions are inches.)

A-24
Figure A-23. Dimensions of the Fully Assembled Picture Frame (All dimensions are inches.)

Start from the top, align the top edge of the blanket with the inner top edge of the frame
Holding the top in place, work the blanket into the holder from left to right
A-25
Figure A-24. Sample Installation

Two dead weights, about 5 lbs each, are used to put additional force on the retainer frame to keep the bottom edge of the blanket from shrinking up.
Roll the retainer frame in from the bottom to the top
A-26
Figure A-25. Inner Frame Placement

Centerline of picture frame (9.125”) is aligned with centerline of cone
CL
CL
4” from cone face to blanket surface
A-27
Figure A-26. Frame Alignment—Side View

A-28
CL
Centerline of picture frame aligned with centerline of burner cone
Figure A-27. Frame Alignment—Rear View