development of a laboratory scale test - faa fire safety of a laboratory-scale test for ... cocl2...
TRANSCRIPT
Louise C. Speitel/ Timothy MarkerFire Safety Branch
FAA William J. Hughes Technical CenterAtlantic City International Airport, NJ 08405 USA
Development of a Laboratory-Scale Test for Evaluating the Decomposition Products Generated
Inside an Intact Fuselage During a Simulated Postcrash Fuel Fire
The Fifth Triennial International Fire & Cabin Safety Research Conference
Atlantic City, New JerseyOctober 29- November 1, 2007
2
Outline
• Purpose
• Background
• Laboratory Scale Test Rig for Evaluation of Buildup of:
Toxic Gases
Flammable Gases
• Insulation Systems Tested
• Gas Sampling Methodology
• Gases Measured
• Methods of Analysis
• Results
• Coclusions
3
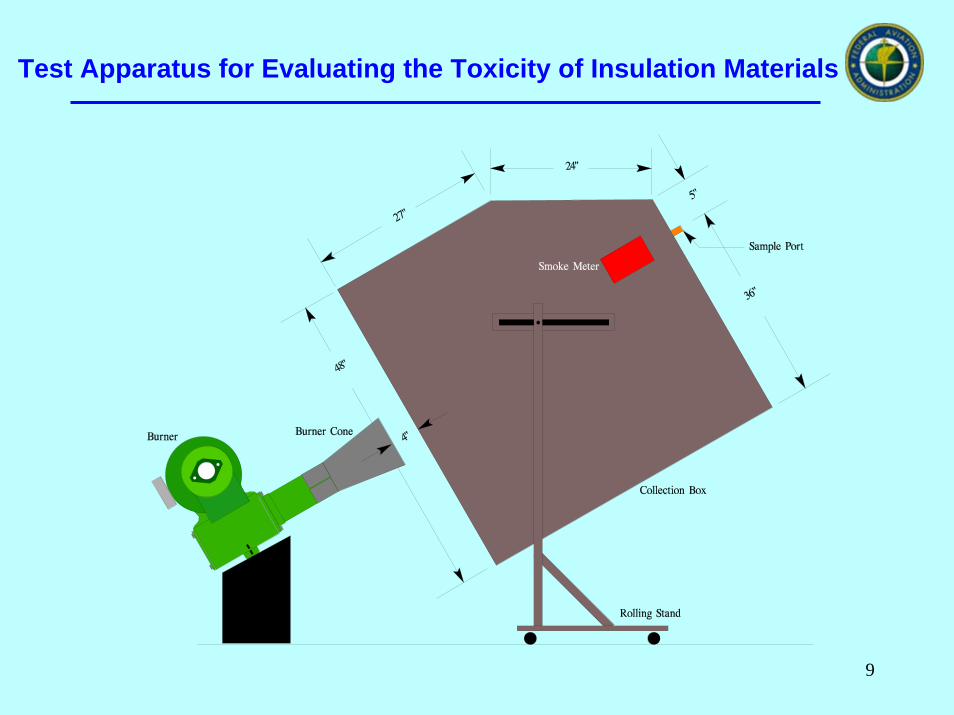
Purpose
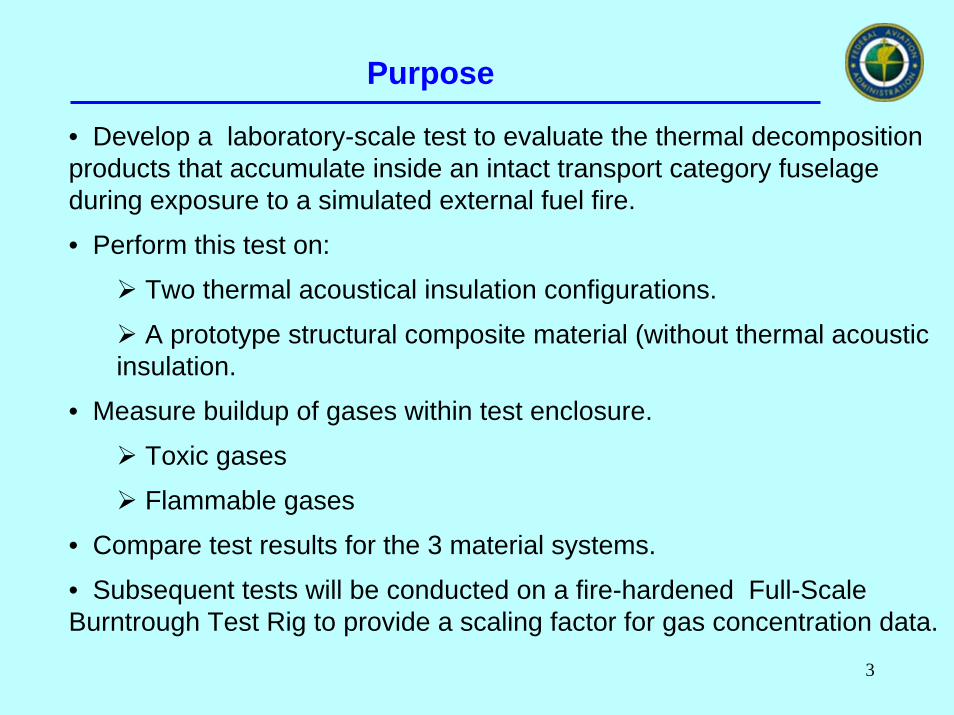
• Develop a laboratory-scale test to evaluate the thermal decomposition products that accumulate inside an intact transport category fuselage during exposure to a simulated external fuel fire.
• Perform this test on:
Two thermal acoustical insulation configurations.
A prototype structural composite material (without thermal acoustic insulation.
• Measure buildup of gases within test enclosure.
Toxic gases
Flammable gases
• Compare test results for the 3 material systems.
• Subsequent tests will be conducted on a fire-hardened Full-Scale Burntrough Test Rig to provide a scaling factor for gas concentration data.
4
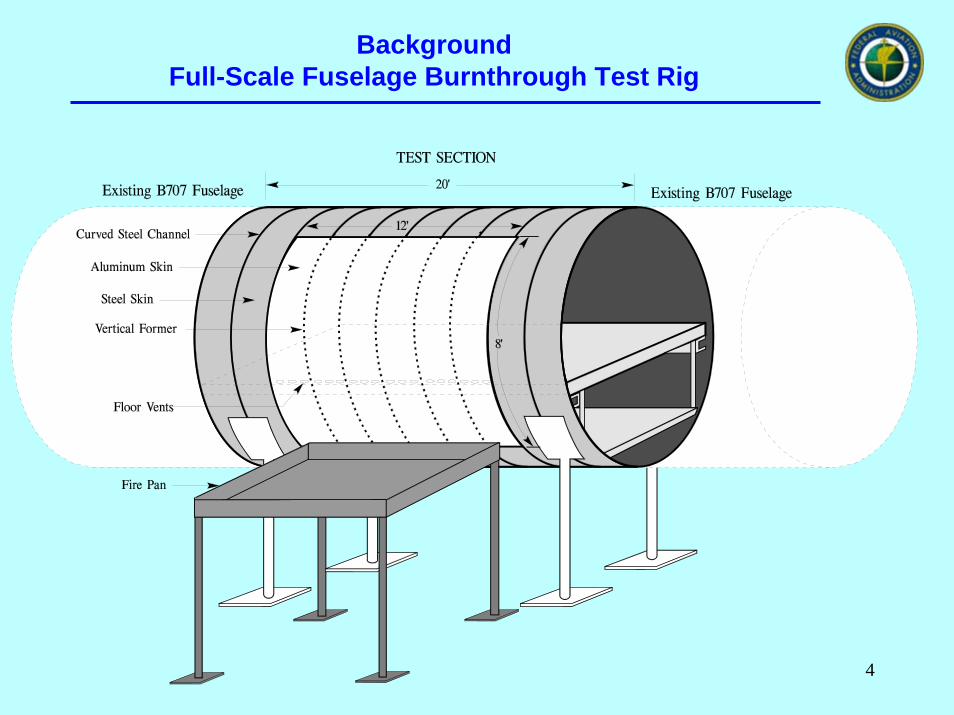
BackgroundFull-Scale Fuselage Burnthrough Test Rig
5
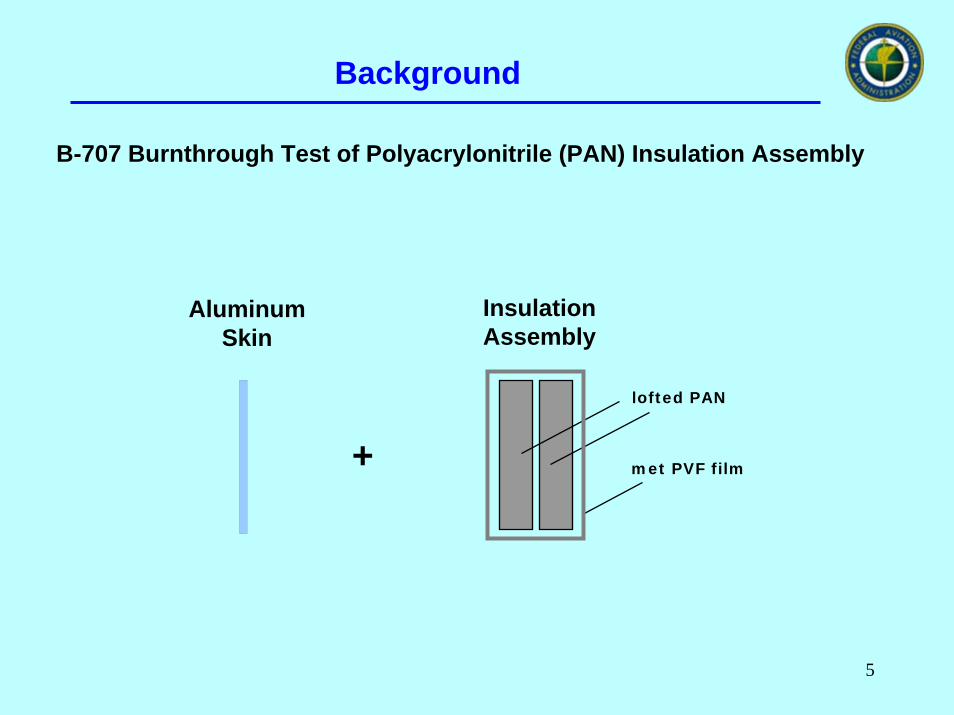
Background
B-707 Burnthrough Test of Polyacrylonitrile (PAN) Insulation Assembly
Aluminum Skin
Insulation Assembly
lofted PAN
met PVF film+
6
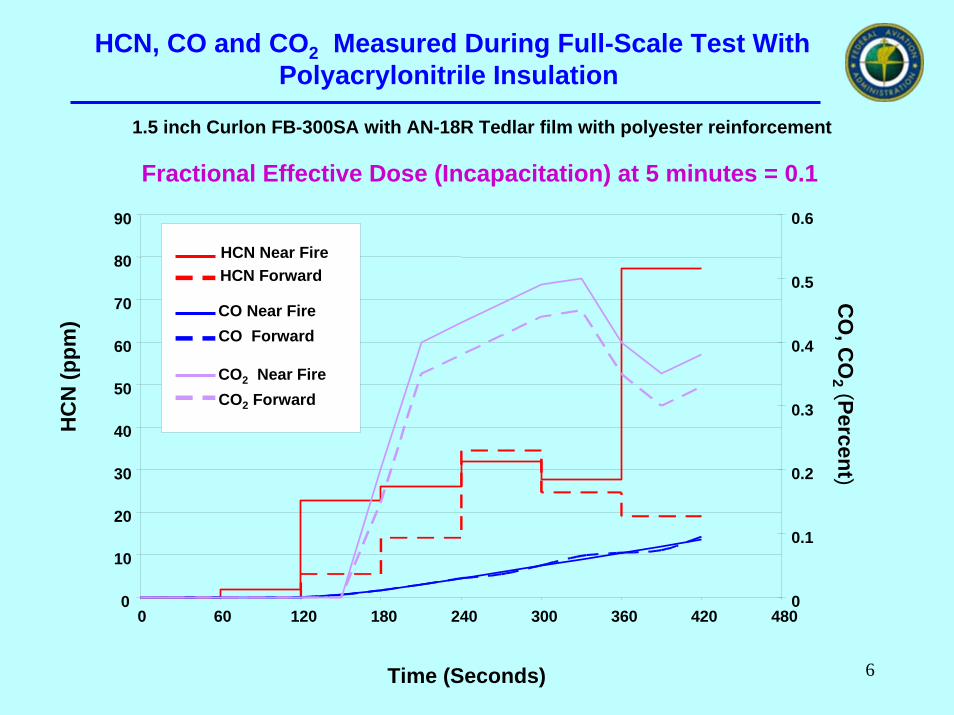
HCN, CO and CO2 Measured During Full-Scale Test With Polyacrylonitrile Insulation
1.5 inch Curlon FB-300SA with AN-18R Tedlar film with polyester reinforcement
0
10
20
30
40
50
60
70
80
90
HC
N (p
pm)
CO
, CO
2 (Percent)
0 60 120 180 240 300 360 420 4800
0.1
0.2
0.3
0.4
0.5
0.6
HCN Near FireHCN Forward
CO Near FireCO Forward
CO2 Near FireCO2 Forward
Time (Seconds)
Fractional Effective Dose (Incapacitation) at 5 minutes = 0.1
7
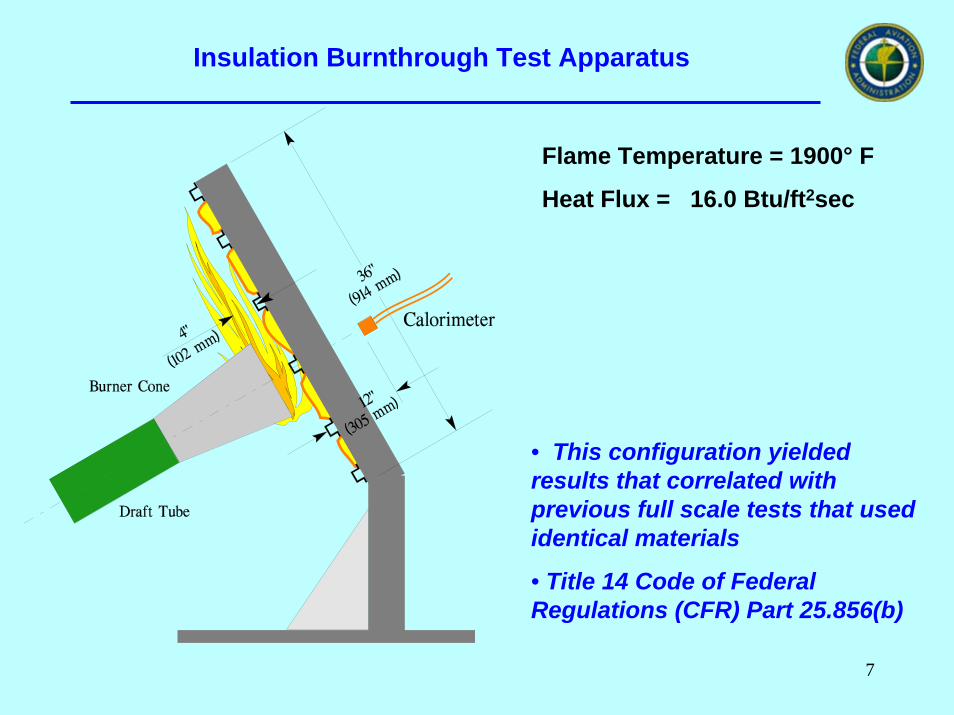
Insulation Burnthrough Test Apparatus
Flame Temperature = 1900° F
Heat Flux = 16.0 Btu/ft2sec
• This configuration yielded results that correlated with previous full scale tests that used identical materials
• Title 14 Code of Federal Regulations (CFR) Part 25.856(b)
8
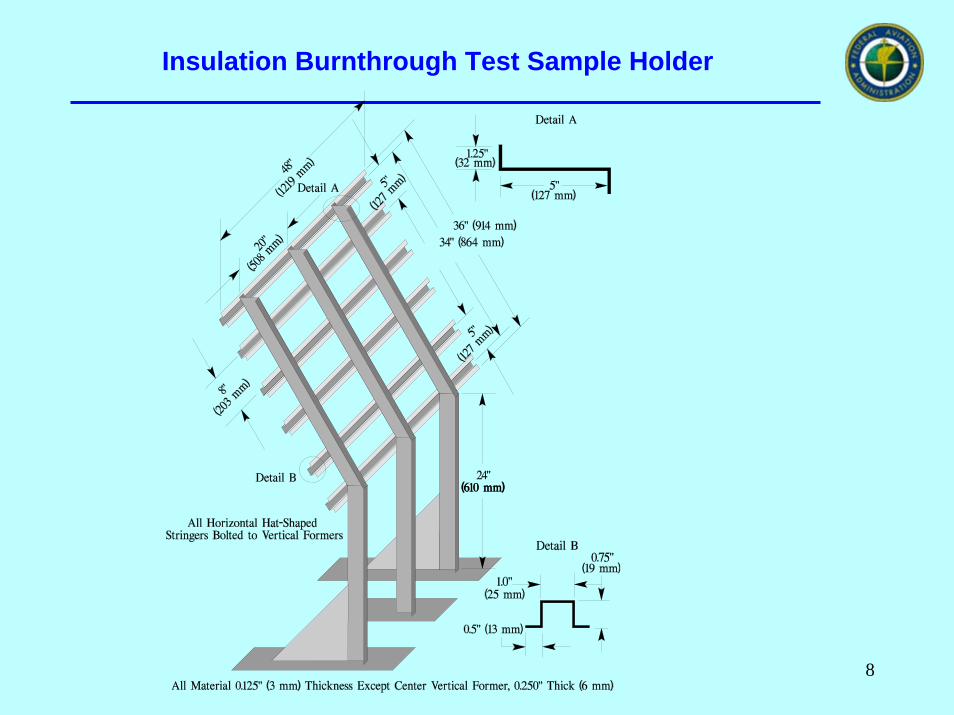
Insulation Burnthrough Test Sample Holder
9
Test Apparatus for Evaluating the Toxicity of Insulation Materials
10
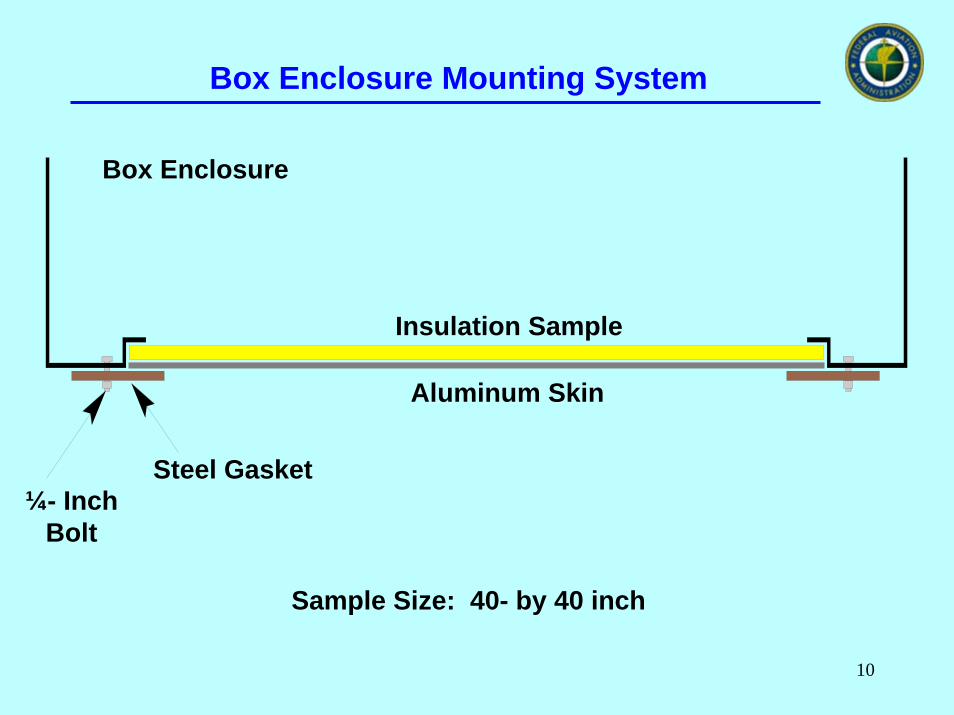
Box Enclosure Mounting System
Sample Size: 40- by 40 inch
Box Enclosure
Steel Gasket¼- Inch
Bolt
Insulation Sample
Aluminum Skin
11
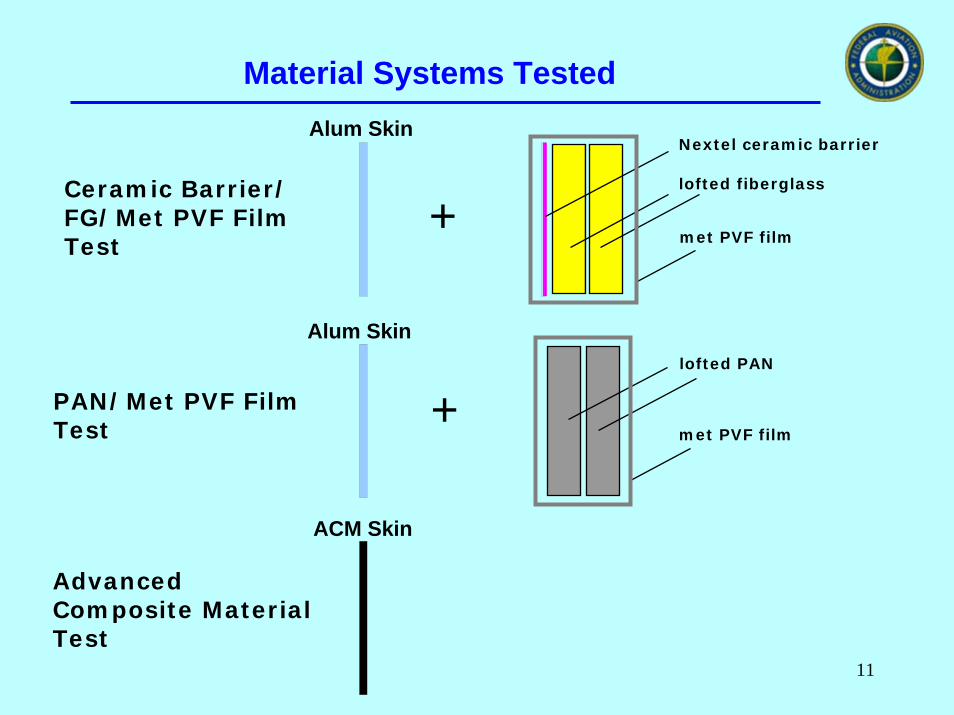
Material Systems Tested
Nextel ceramic barrier
lofted fiberglass
met PVF film
lofted PAN
met PVF film
Ceramic Barrier/ FG/Met PVF Film Test
PAN/Met PVF Film Test
Advanced Composite Material Test
Alum Skin
Alum Skin
ACM Skin
+
+
12
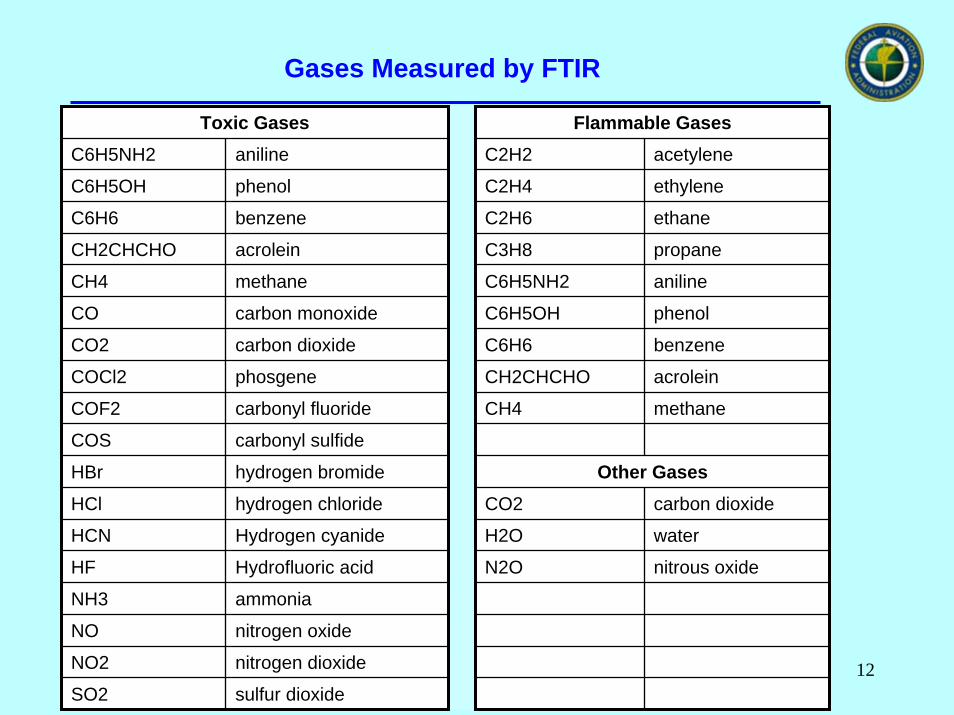
Gases Measured by FTIR
Toxic Gases Flammable GasesC6H5NH2 aniline C2H2 acetylene
C6H5OH phenol C2H4 ethylene
CO2 carbon dioxide C6H6 benzene
carbon dioxide
water
C6H6 benzene C2H6 ethane
CH2CHCHO acrolein C3H8 propane
CH4 methane C6H5NH2 aniline
CO carbon monoxide C6H5OH phenol
COCl2 phosgene CH2CHCHO acrolein
COF2 carbonyl fluoride CH4 methane
COS carbonyl sulfide
HBr hydrogen bromide Other GasesHCl hydrogen chloride CO2
HCN Hydrogen cyanide H2O
HF Hydrofluoric acid N2O nitrous oxide
NH3 ammonia
NO nitrogen oxide
NO2 nitrogen dioxide
SO2 sulfur dioxide
13
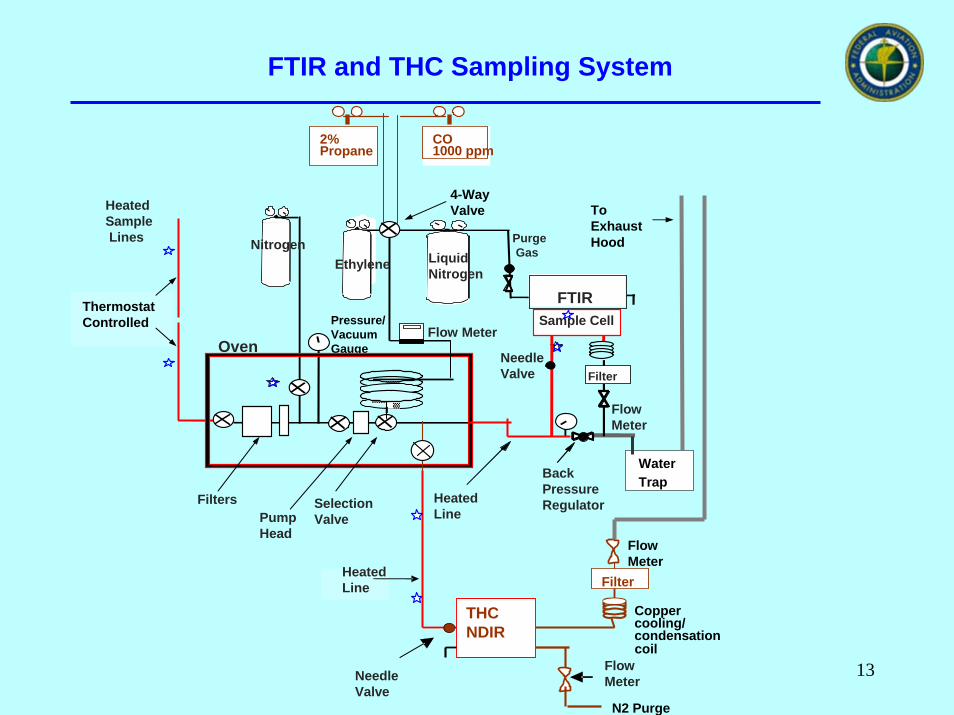
FTIR and THC Sampling System
N2 Purge
Thermostat Controlled
FlowMeter
Copper cooling/condensationcoil
NeedleValve
THC NDIR
Filter
FlowMeter
HeatedLine
PumpHead
2%Propane
CO1000 ppm
4-Way ValveHeated
SampleLines
LiquidNitrogen
SelectionValve
Sample Cell
Filter
Flow MeterPressure/ VacuumGauge
NeedleValve
BackPressureRegulator
FlowMeter
HeatedLine
PurgeGas
FTIR
Nitrogen
WaterTrap
ToExhaustHood
Filters
Ethylene
Oven
14
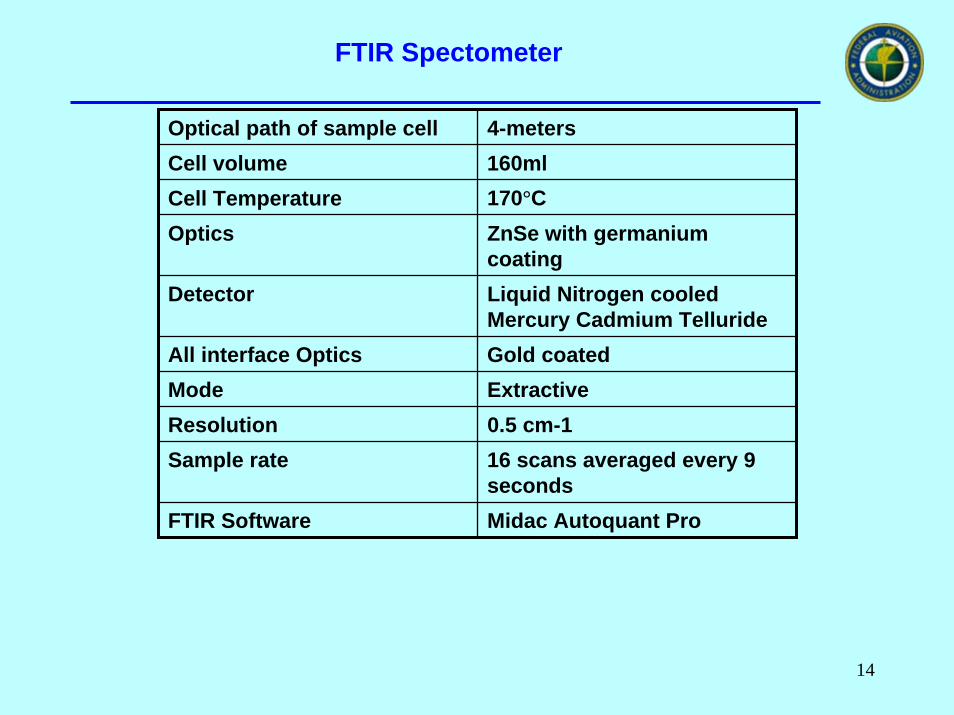
FTIR Spectometer
Optical path of sample cell 4-metersCell volume 160mlCell Temperature 170°COptics ZnSe with germanium
coatingDetector Liquid Nitrogen cooled
Mercury Cadmium TellurideAll interface Optics Gold coatedMode ExtractiveResolution 0.5 cm-1Sample rate 16 scans averaged every 9
secondsFTIR Software Midac Autoquant Pro
15
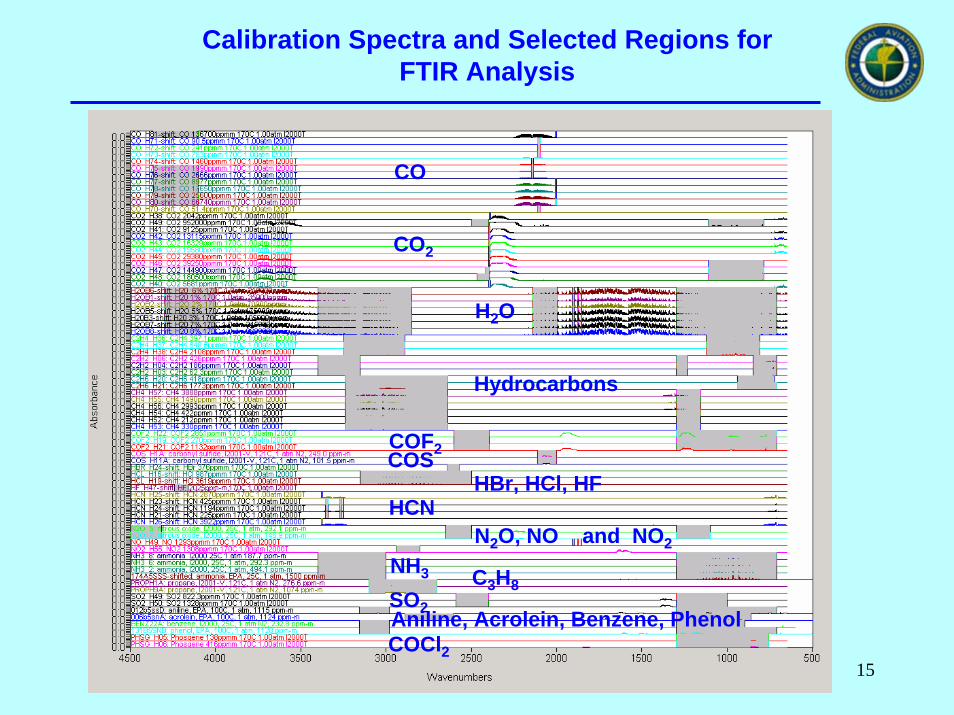
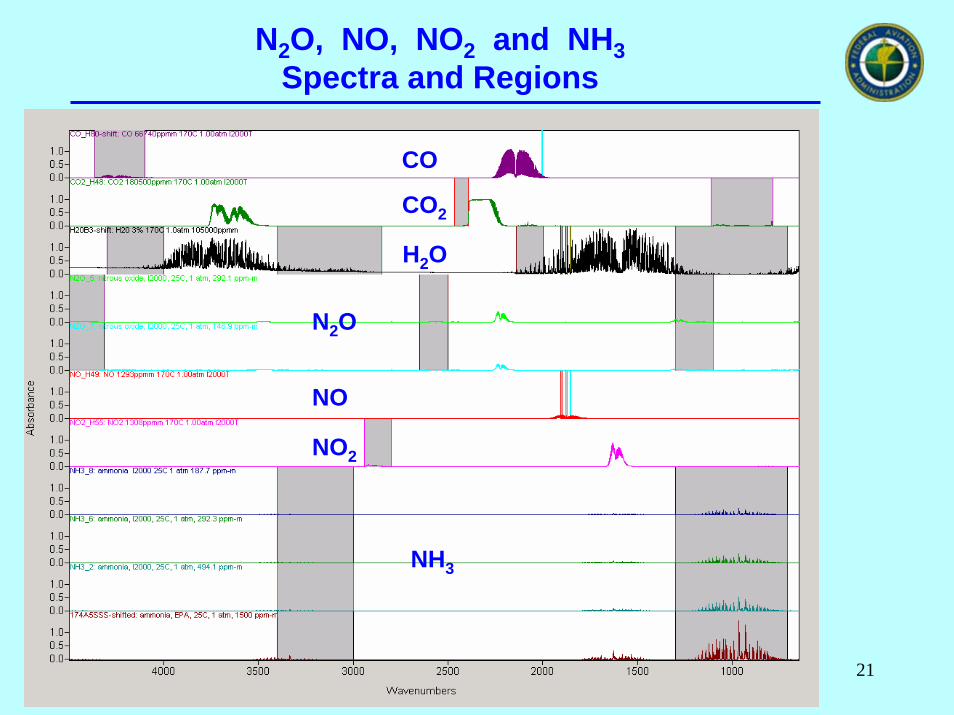
Calibration Spectra and Selected Regions for FTIR Analysis
CO
CO2
H2O
Hydrocarbons
COF2COS
C3H8
HBr, HCl, HFHCN
NH3
Aniline, Acrolein, Benzene, Phenol
N2O, NO and NO2
COCl2
SO2
16
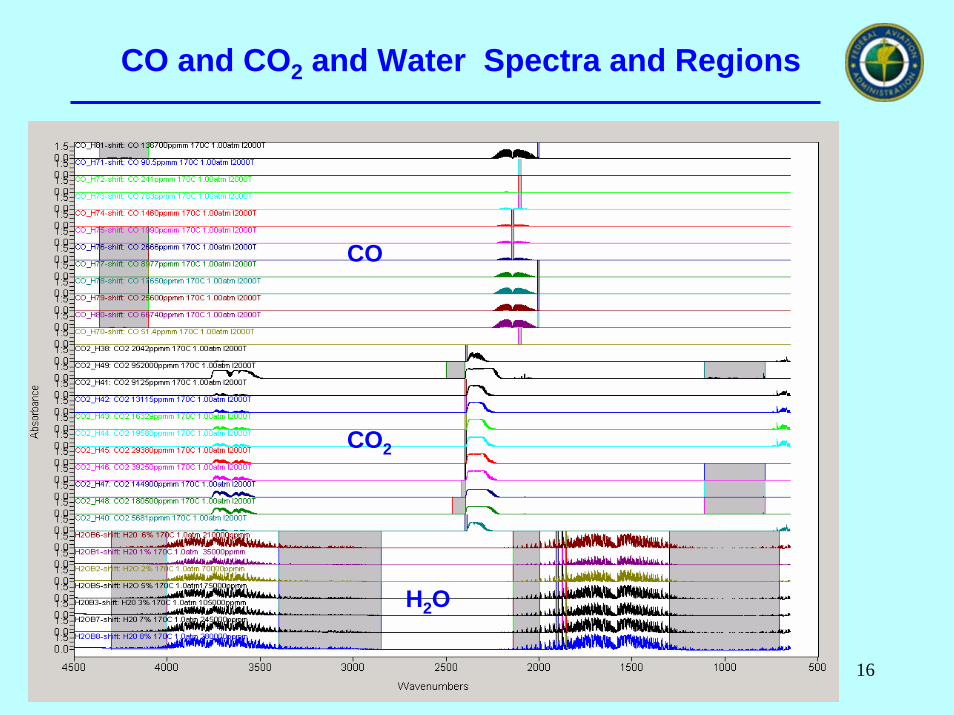
CO and CO2 and Water Spectra and Regions
CO
CO2
H2O
17
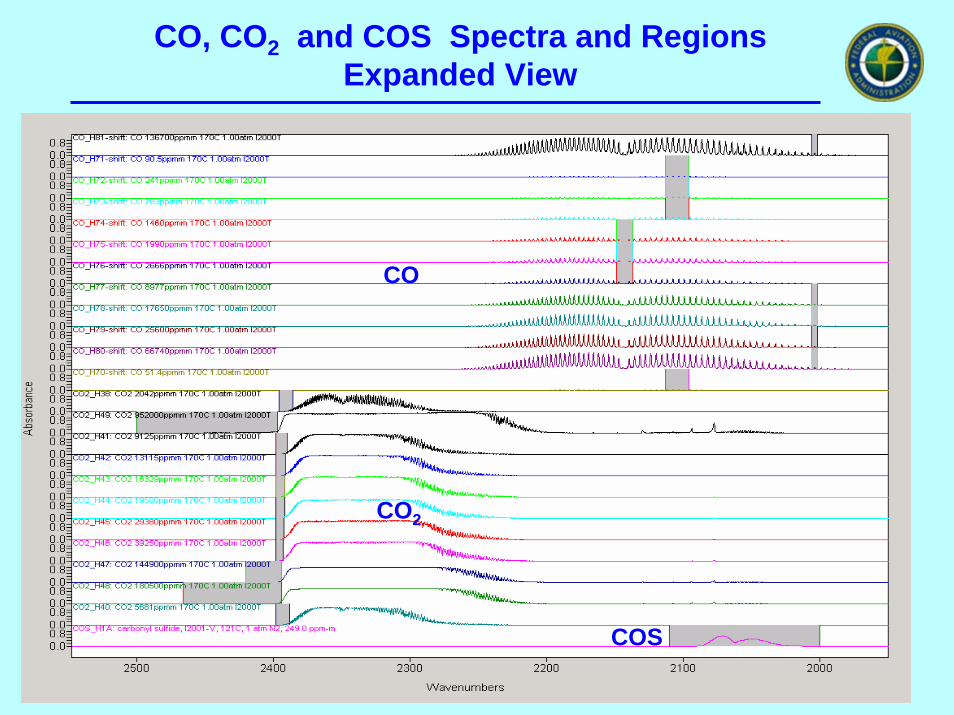
CO, CO2 and COS Spectra and RegionsExpanded View
CO
CO2
COS
18
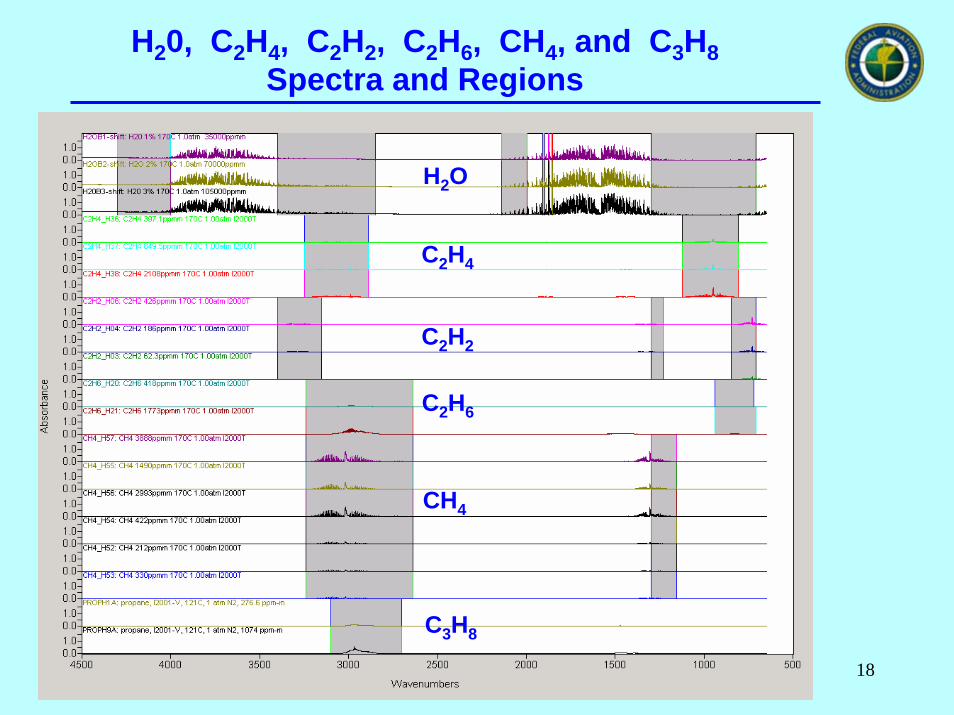
H20, C2H4, C2H2, C2H6, CH4, and C3H8Spectra and Regions
H2O
C2H4
C2H2
C2H6
CH4
C3H8
19
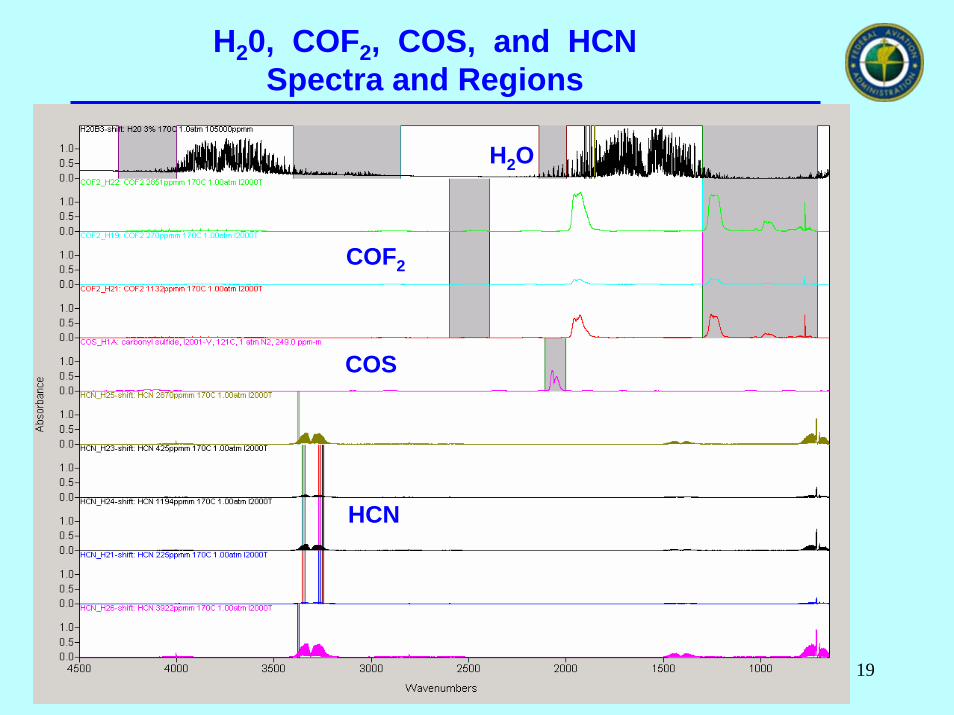
H20, COF2, COS, and HCNSpectra and Regions
COF2
COS
HCN
H2O
20
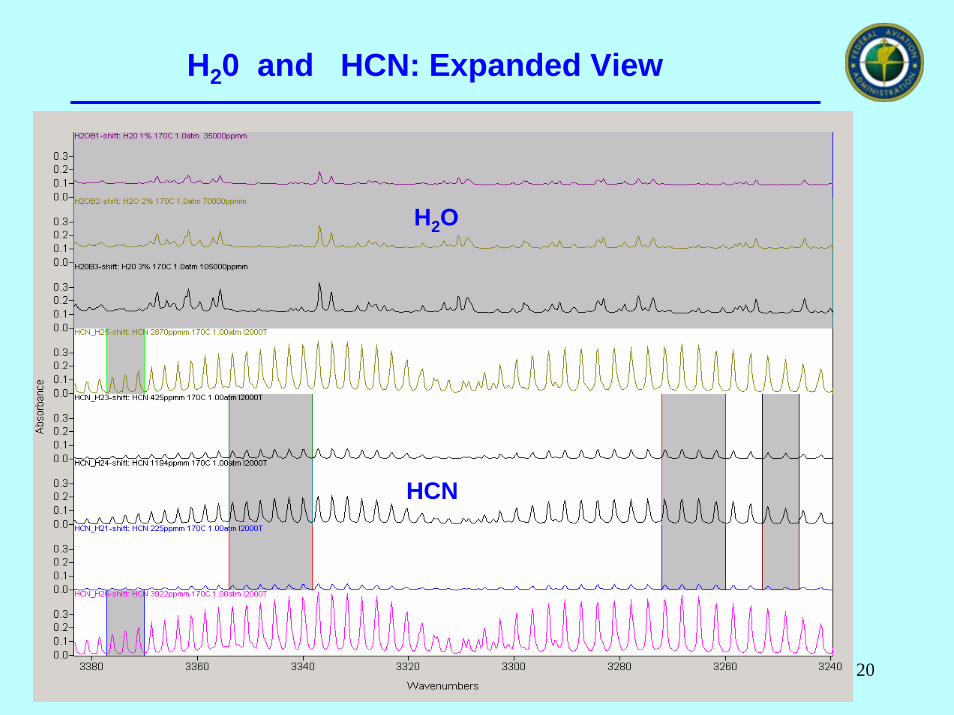
H20 and HCN: Expanded View
H2O
HCN
21
N2O, NO, NO2 and NH3Spectra and Regions
H2O
CO
CO2
NO2
N2O
NO
NH3
22
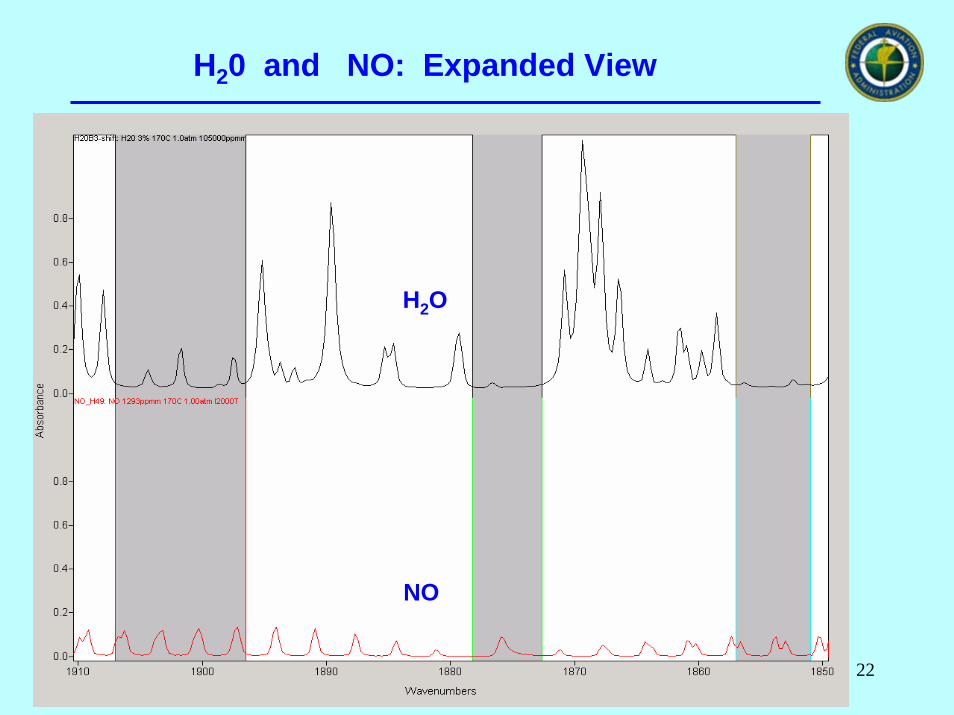
H20 and NO: Expanded View
H2O
NO
23
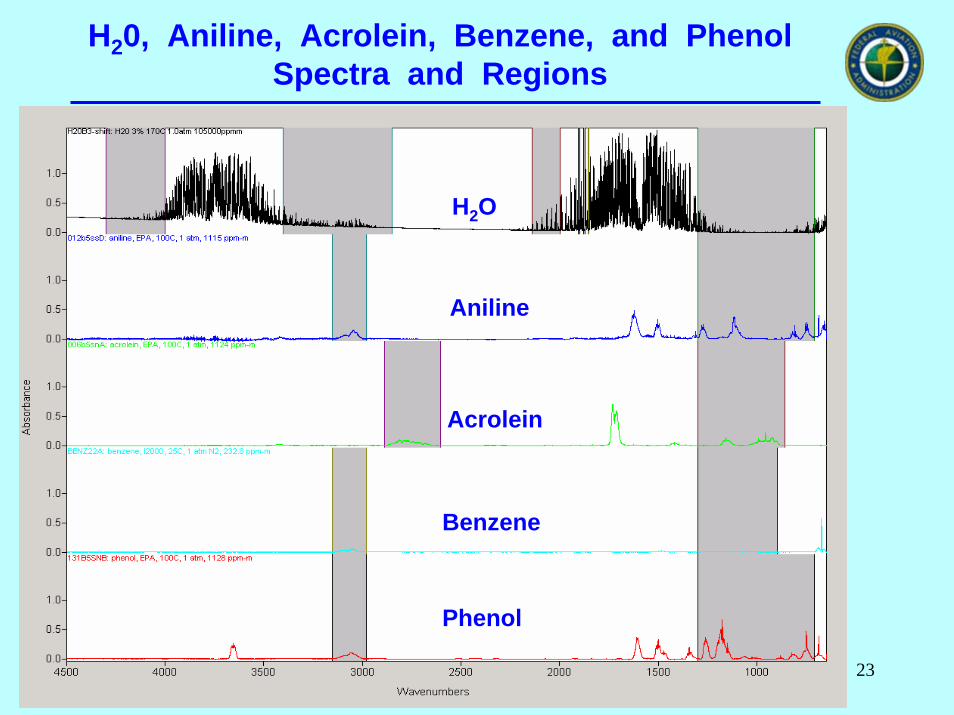
H20, Aniline, Acrolein, Benzene, and PhenolSpectra and Regions
H2O
Aniline
Acrolein
Benzene
Phenol
24
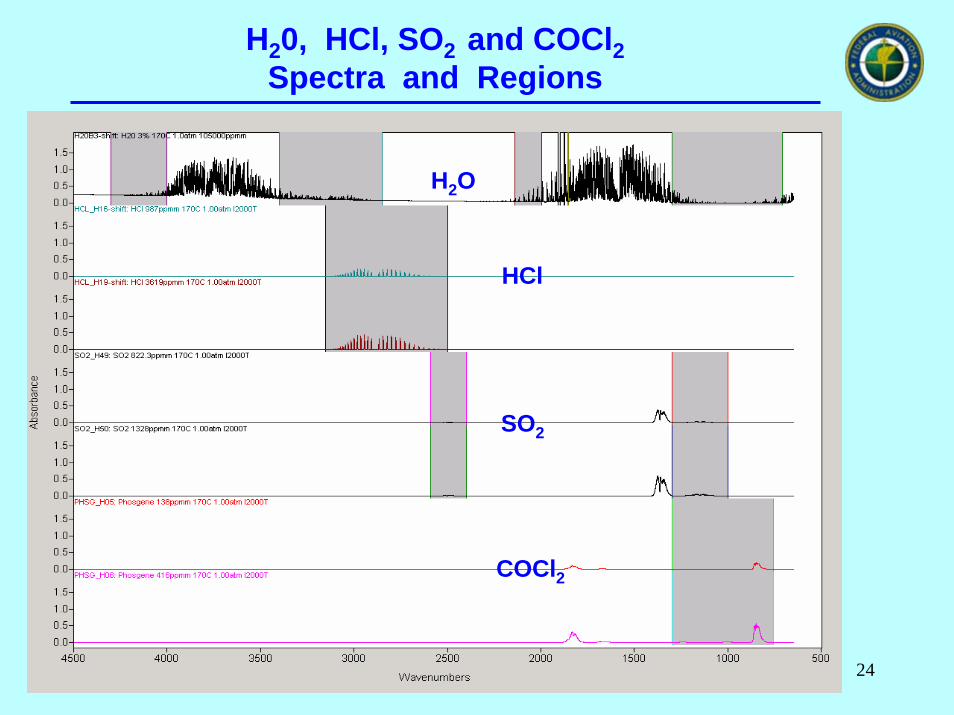
H20, HCl, SO2 and COCl2Spectra and Regions
H2O
HCl
COCl2
SO2
25
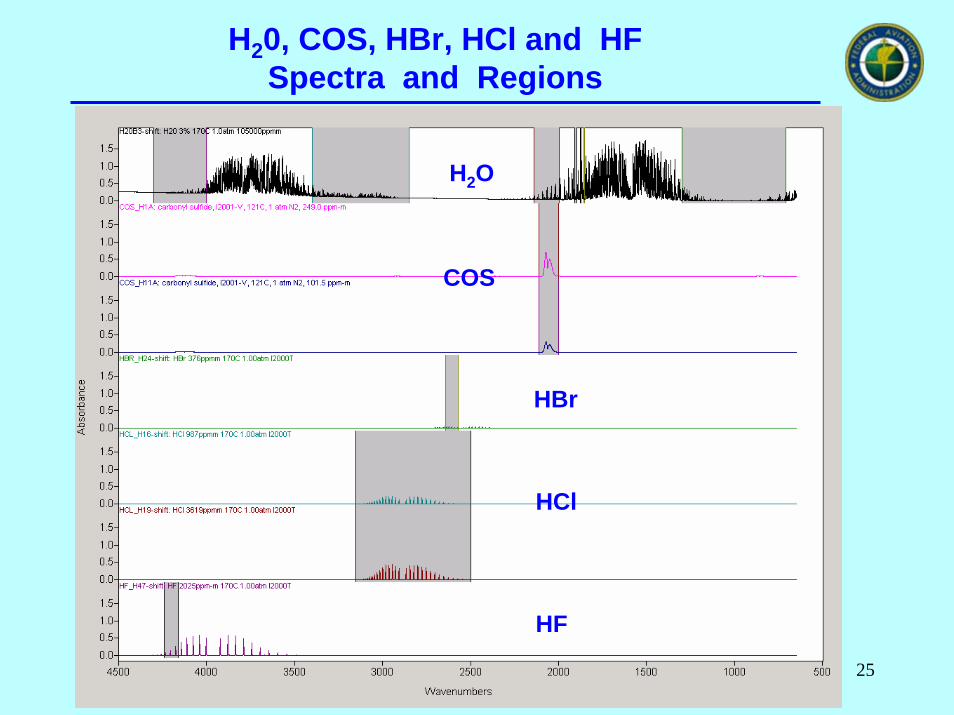
H20, COS, HBr, HCl and HF Spectra and Regions
HCl
HBr
HF
COS
H2O

26
Material Systems Tested
Ceramic Barrier/ FG/Met PVF Film Test
PAN/Met PVF Film Test
Advanced Composite Material Test
Alum Skin
Alum Skin
ACM Skin
Nextel ceramic barrier
lofted fiberglass
met PVF film
lofted PAN
met PVF film
+
+
27
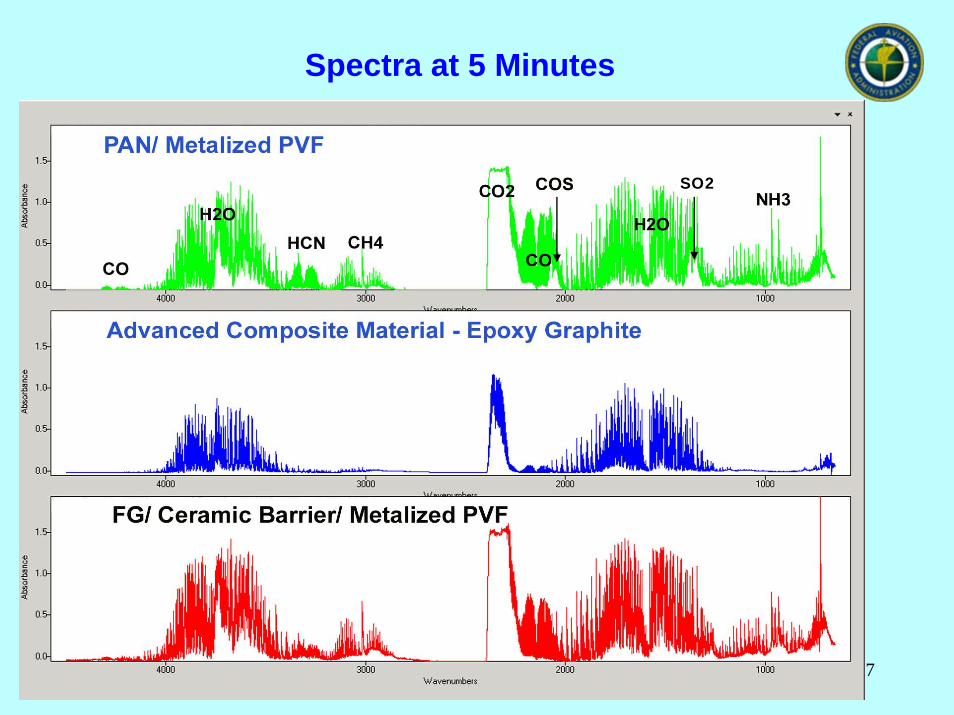
Spectra at 5 Minutes
SO2
28
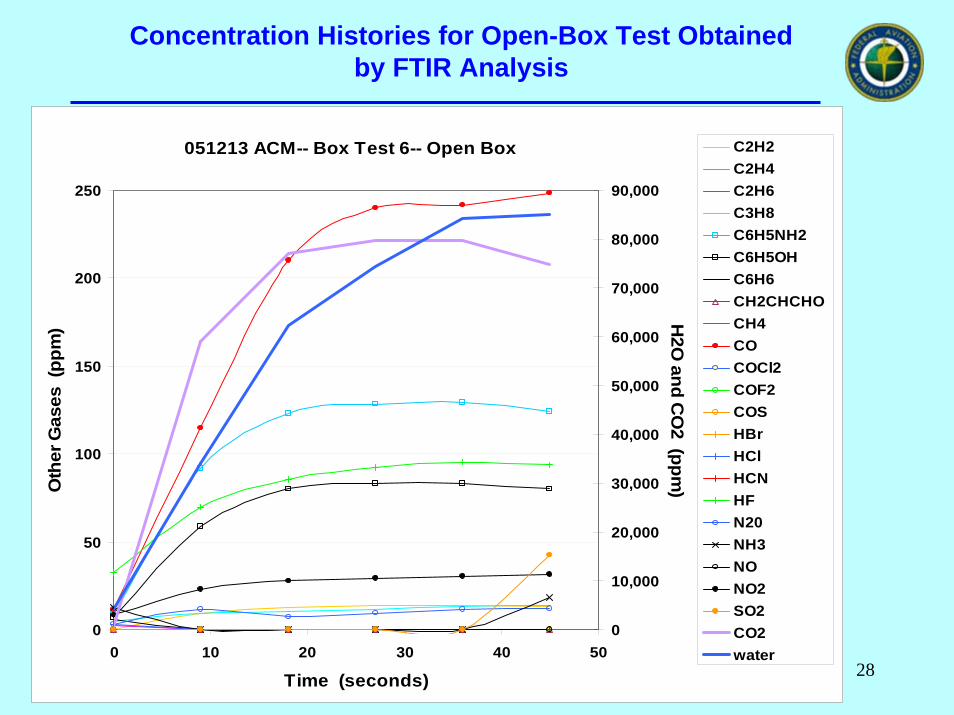
Concentration Histories for Open-Box Test Obtained by FTIR Analysis
051213 ACM-- Box Test 6-- Open Box
0
50
100
150
200
250
0 10 20 30 40 50
Time (seconds)
Oth
er G
ases
(pp
m)
0
10,000
20,000
30,000
40,000
50,000
60,000
70,000
80,000
90,000
H2O
and CO
2 (ppm)
C2H2 C2H4 C2H6 C3H8 C6H5NH2 C6H5OH C6H6 CH2CHCHO CH4 CO COCl2 COF2 COS HBr HClHCN HF N20 NH3 NO NO2 SO2 CO2 water
29
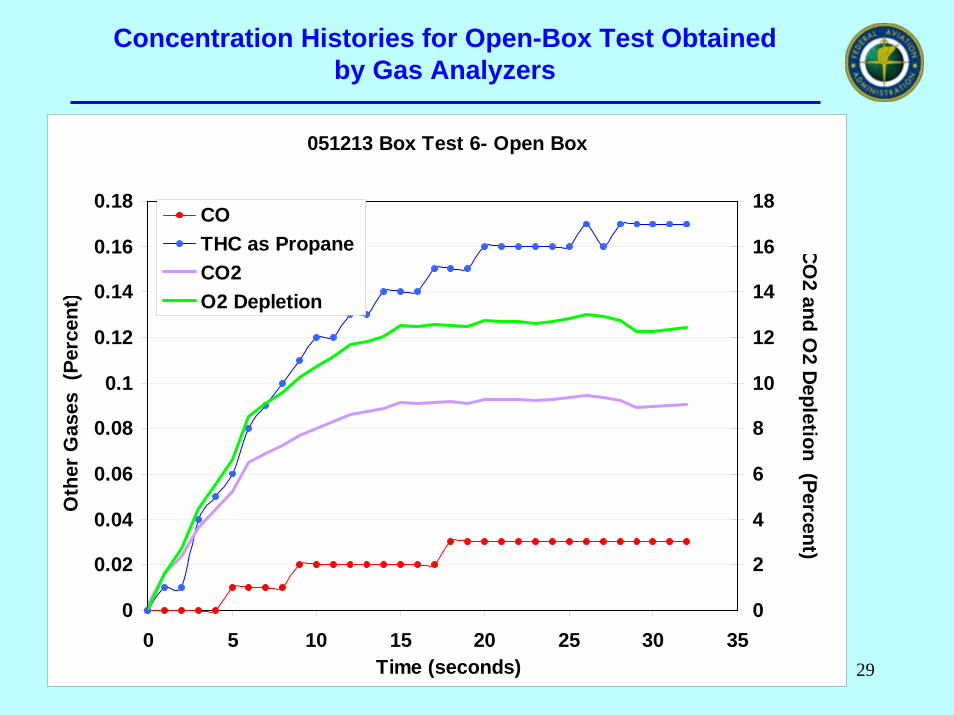
Concentration Histories for Open-Box Test Obtained by Gas Analyzers
051213 Box Test 6- Open Box
0
0.02
0.04
0.06
0.08
0.1
0.12
0.14
0.16
0.18
0 5 10 15 20 25 30 35Time (seconds)
Oth
er G
ases
(Pe
rcen
t)
0
2
4
6
8
10
12
14
16
18
CO
2 and O2 D
epletion (Percent)
COTHC as Propane CO2O2 Depletion
30
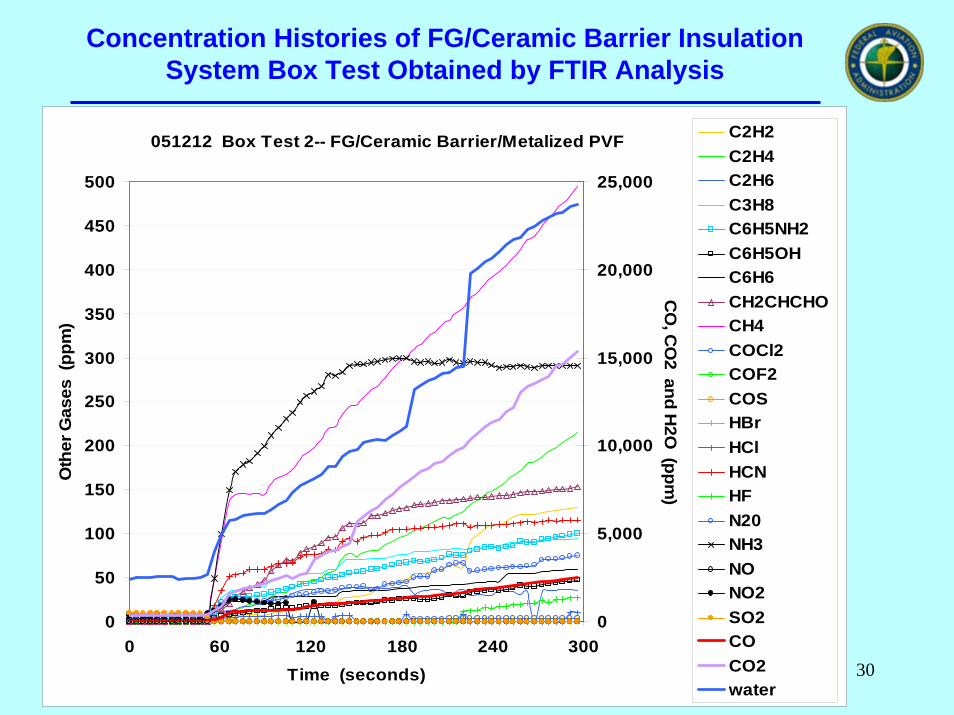
Concentration Histories of FG/Ceramic Barrier Insulation System Box Test Obtained by FTIR Analysis
051212 Box Test 2-- FG/Ceramic Barrier/Metalized PVF
0
50
100
150
200
250
300
350
400
450
500
0 60 120 180 240 300Time (seconds)
Oth
er G
ases
(pp
m)
0
5,000
10,000
15,000
20,000
25,000
CO
, CO
2 and H2O
(ppm)
C2H2 C2H4 C2H6 C3H8 C6H5NH2 C6H5OH C6H6 CH2CHCHO CH4 COCl2 COF2 COS HBr HClHCN HF N20 NH3 NO NO2 SO2 CO CO2 water
31
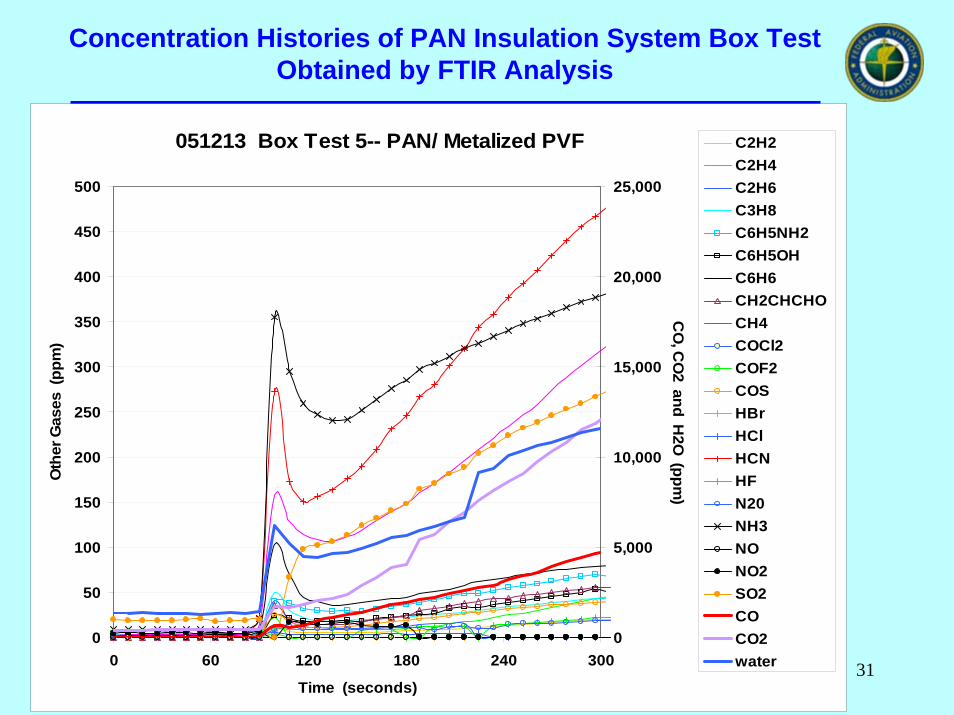
Concentration Histories of PAN Insulation System Box Test Obtained by FTIR Analysis
051213 Box Test 5-- PAN/ Metalized PVF
0
50
100
150
200
250
300
350
400
450
500
0 60 120 180 240 300
Time (seconds)
Oth
er G
ases
(pp
m)
0
5,000
10,000
15,000
20,000
25,000
CO
, CO
2 and H2O
(ppm)
C2H2 C2H4 C2H6 C3H8 C6H5NH2 C6H5OH C6H6 CH2CHCHO CH4 COCl2 COF2 COS HBr HClHCN HF N20 NH3 NO NO2 SO2 CO CO2 water
32
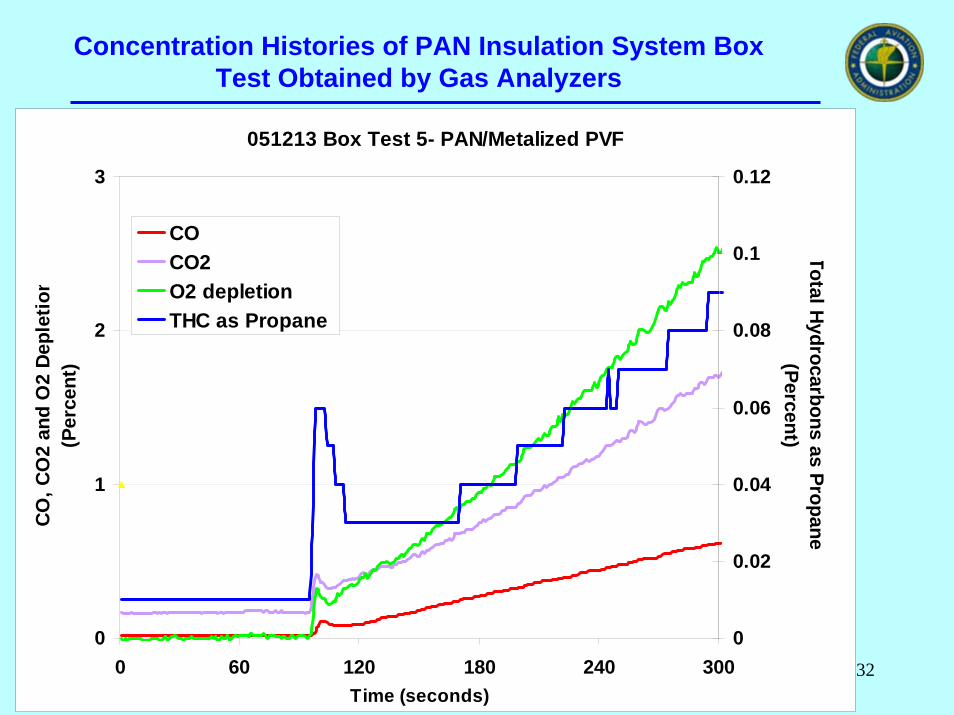
Concentration Histories of PAN Insulation System Box Test Obtained by Gas Analyzers
051213 Box Test 5- PAN/Metalized PVF
0
1
2
3
0 60 120 180 240 300Time (seconds)
CO
, CO
2 an
d O
2 D
eple
tion
(Per
cent
)
0
0.02
0.04
0.06
0.08
0.1
0.12
Total Hydrocarbons as Propane
(Percent)
CO CO2 O2 depletion THC as Propane
33
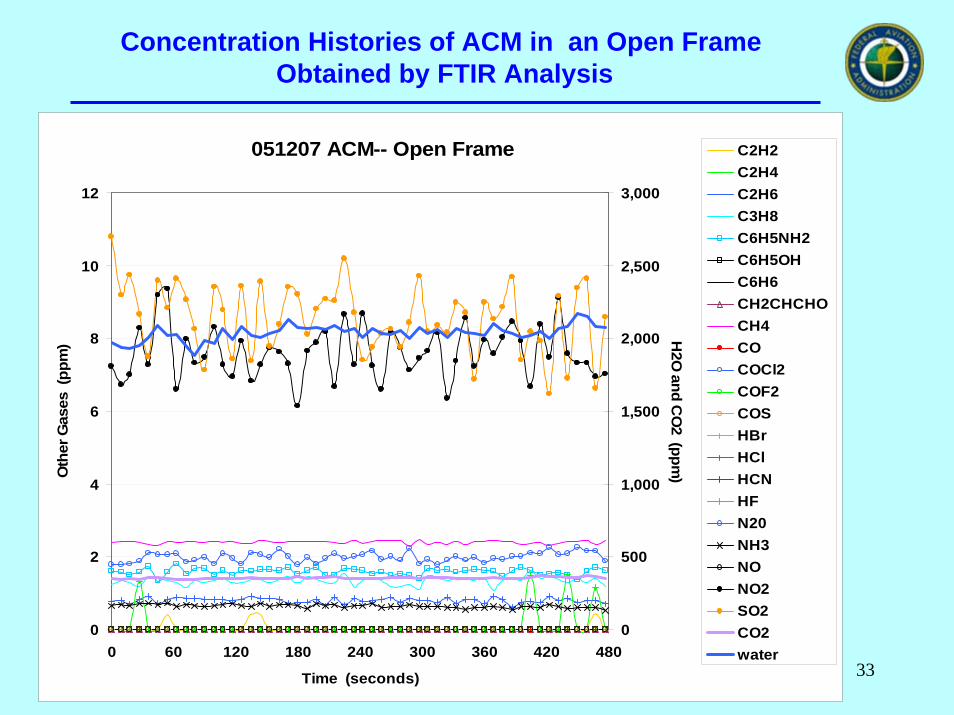
Concentration Histories of ACM in an Open FrameObtained by FTIR Analysis
051207 ACM-- Open Frame
0
2
4
6
8
10
12
0 60 120 180 240 300 360 420 480
Time (seconds)
Oth
er G
ases
(pp
m)
0
500
1,000
1,500
2,000
2,500
3,000
H2O
and CO
2 (ppm)
C2H2 C2H4 C2H6 C3H8 C6H5NH2 C6H5OH C6H6 CH2CHCHO CH4 CO COCl2 COF2 COS HBr HClHCN HF N20 NH3 NO NO2 SO2 CO2 water
34
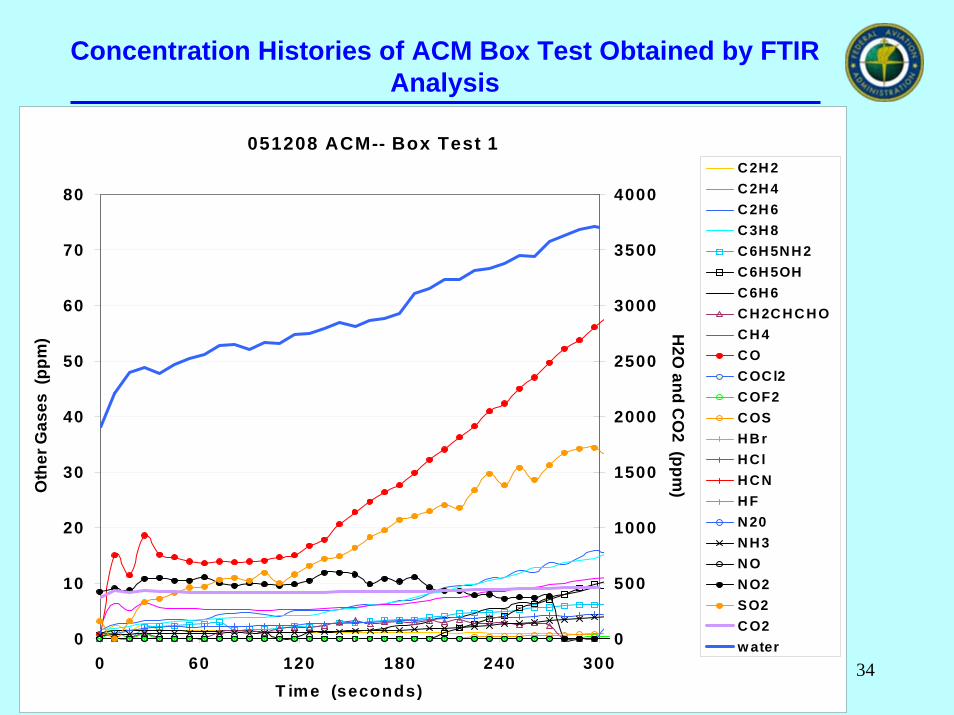
Concentration Histories of ACM Box Test Obtained by FTIR Analysis
051208 ACM-- Box Test 1
0
10
20
30
40
50
60
70
80
0 60 120 180 240 300T ime (seconds)
Oth
er G
ases
(pp
m)
0
500
1000
1500
2000
2500
3000
3500
4000
H2O
and CO
2 (ppm)
C 2H 2 C 2H 4 C 2H 6 C 3H 8 C 6H 5NH 2 C 6H 5OH C 6H 6 C H 2C H C H O C H 4 C O C OC l2 C OF2 C OS H B r H C lH C N H F N 20 N H 3 N O N O2 SO2 C O2 w ater
35
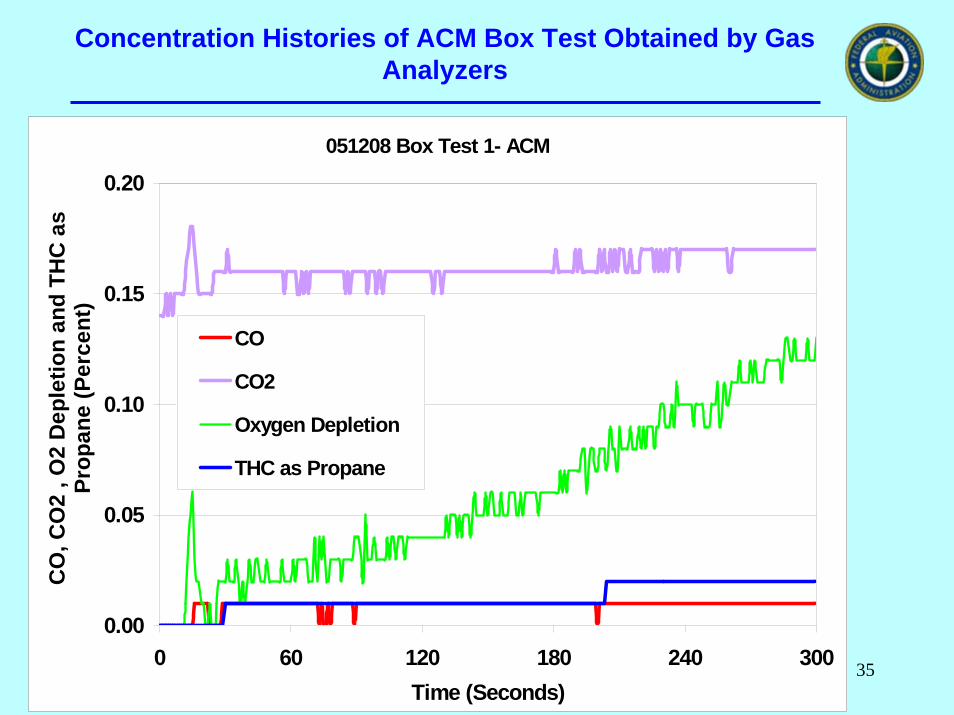
Concentration Histories of ACM Box Test Obtained by Gas Analyzers
051208 Box Test 1- ACM
0.00
0.05
0.10
0.15
0.20
0 60 120 180 240 300Time (Seconds)
CO
, CO
2 , O
2 D
eple
tion
and
THC
as
Prop
ane
(Per
cent
)
CO
CO2
Oxygen Depletion
THC as Propane
36
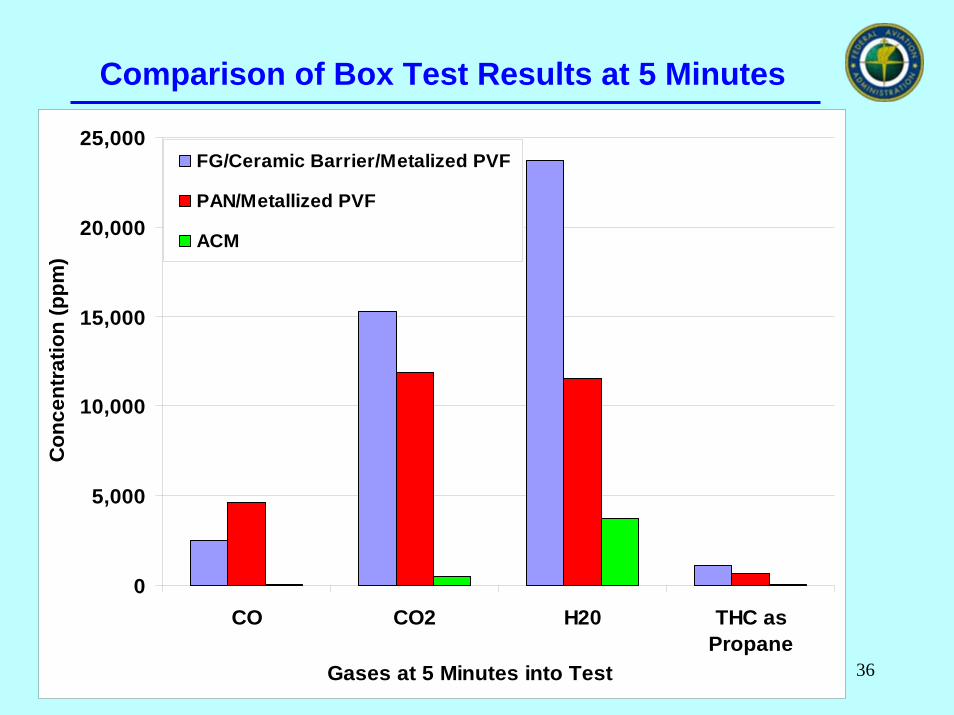
Comparison of Box Test Results at 5 Minutes
0
5,000
10,000
15,000
20,000
25,000
CO CO2 H20 THC asPropane
Gases at 5 Minutes into Test
Con
cent
ratio
n (p
pm)
FG/Ceramic Barrier/Metalized PVF
PAN/Metallized PVF
ACM
37
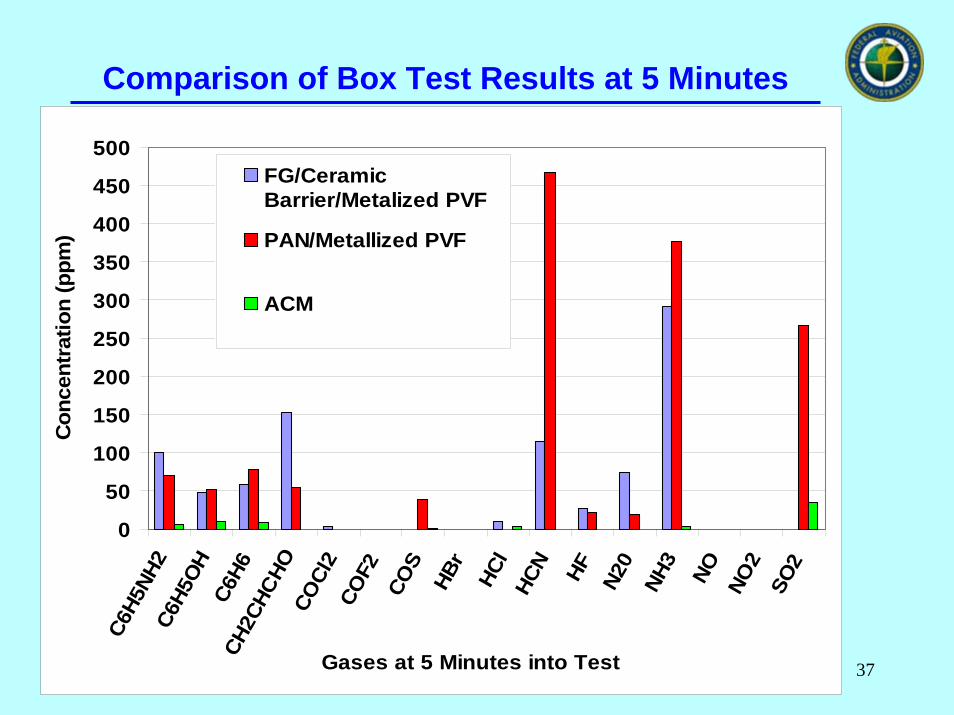
Comparison of Box Test Results at 5 Minutes
0
50
100
150
200
250
300
350
400
450
500C6
H5NH
2 C6
H5OH
C6
H6
CH2C
HCHO
CO
Cl2
COF2
CO
S HB
r HC
lHC
N HF
N20
NH3
NO
NO
2 SO
2
Gases at 5 Minutes into Test
Con
cent
ratio
n (p
pm)
FG/CeramicBarrier/Metalized PVF
PAN/Metallized PVF
ACM
38
Full Scale Tests
• Upcoming full-scale tests will provide a scaling factor.
• Scaling factor will be applied to future box tests to predict full scale gas concentration histories.
39
Conclusion
• A prototype multi-ply structural composite material produced minimal toxic and flammable gases during a 5-minute fire exposure.
• The aluminum skin/insulation configurations generated much higher gas concentrations .
• 7 plies of the 13-ply composite panel were damaged by the fire