development of a gis fiber optics asset management systemdocs.trb.org/prp/12-2916.pdf ·...
TRANSCRIPT

Development of a GIS Fiber Optics Asset Management System
Carlos M. Chang-Albitres1, Ph.D., P.E.
Luis Quintana2 and
Raed K. Aldouri3, Ph.D.
November 01, 2011
Submitted for consideration for presentation and publication at the 91st Annual Meeting of the Transportation Research Board, Washington, D.C., January 2012.
Abstract: 243 Paper length Text + 2 Tables + 8 Figures = 3962 + (10 x 250 = 2500) = 6571 words Total 6814
¹ Assistant Professor, Department of Civil Engineering, The University of Texas at El Paso, El Paso, TX 79968, (915) 747-8301. E-mail: [email protected]
2 Graduate Research Assistant, Department of Civil Engineering, The University of Texas at El Paso, El Paso, TX 79968, (915) 747-7870, E-mail: [email protected]
3 Assistant Professor, Regional Geospatial Service Center, The University of Texas at El Paso, El Paso, TX 79968, (915) 747-8019, E-mail: [email protected]
TRB 2012 Annual Meeting Paper revised from original submittal.

C. Chang-Albitres, L. Quintana, and R. Aldouri 1
Development of a GIS Fiber Optics Asset Management System
ABSTRACT
This paper describes a GIS Fiber Optics Asset Management System (GFOAMS) developed for the City of El Paso, Texas. The objectives of GFOAMS are to provide managers and maintenance crews with easy access to fiber optics detailed information, conduct proximity infrastructure buffer analysis, and generate what-if “smart maps” to support decision analysis. GFOAMS uses a GIS map-driven interface composed of three main modules: inventory, documents, and images, interacting with a multilayer data structure containing the information for junction boxes, conduit runs, and cables for thirteen fiber optic systems across the city that connect police departments, fire departments, municipal courts, health administration, building, public transportation facilities, libraries and others. GFOAMS has been used for planning daily operations, managing leasable fiber optics conduits, and developing new fiber optics subsystems to the existing networks; saving time and money for the City of El Paso. The GFOAMS project received an Engineering Award from the National Council of Examiners for Engineering and Surveying (NCEES) for its benefits to public health, safety, and welfare while connecting professional practice and education during its development.. Having a broad and well managed fiber optics system in El Paso has become a priority to the municipality as it will enhance the reaction to public safety hazards and immediate responses to any security breach due to its strategic location on the border with Mexico.
.
Keywords: Asset Management, Geographic Information Systems, Fiber Optics, smart maps, Infrastructure, Decision Making, Junction Boxes, Conduit Runs, Cables.
TRB 2012 Annual Meeting Paper revised from original submittal.

C. Chang-Albitres, L. Quintana, and R. Aldouri 2
INTRODUCTION
From our perspective, asset management is a decision-making framework based on business and engineering principles to make cost-effective investments on infrastructure assets. Asset management faces the challenge to preserve, operate, maintain, repair, and renew aging infrastructure assets with limited funding. This is particularly true for public agencies with sizeable infrastructure portfolios. Infrastructure asset portfolios usually include: roads, bridges, transit systems, railroads, ports, airports, water and waste water service facilities, buildings, parks, energy production and distribution facilities, and communication networks.
Public agencies are dealing with increased budget needs for infrastructure assets, and complex administrative processes to justify funding allocation. With limited funds and staff, public agencies are still expected to satisfy high public expectations for the infrastructure performance. The potential repercussions for inadequate management of the public assets range from increased safety risks and health threats due to poor performance of infrastructure systems to reduced overall economic competitiveness. Reliable information based on updated data transferred through an efficient communication system is vital for quick responses in case of emergency repairs as well as for planning routine maintenance of the infrastructure assets.
Fiber optics networks are effective data-intensive communication systems able to provide the information needed to respond quickly minimizing the negative impacts of the emergency. The importance of fiber optics is due to the data-intensive nature of the telecommunications, and an undergoing transition from narrow-band to broadband. Applications of fiber optics technology are widespread and involve the transmission of voice, data, and video over distances of a few feet to hundreds of miles. In public local agencies, fiber optics is crucial to the operations of Intelligent Transportation Systems (ITS), and efficient telecommunications between departments located in different buildings. (1, 2)
This paper describes the GIS Fiber Optic Asset Management System (GFOAMS) developed for the City of El Paso, Texas to manage their fiber optics network system across the city. The communication network system connects department inner networks, city buildings, and main facilities such as police and fire departments, among others. Besides, being the City of El Paso located on the border with Ciudad Juarez in Mexico, some officials have raised their concerns about illegal immigration and potential sprouts of violence due to drug traffic, demanding the need for the El Paso Police Office to implement Closed-Circuit Television (CCTV) systems running through fiber optics.
The purpose of the paper is to describe the development, functionalities of GFOAMS as a well-structured and robust system that can be used by a City as a model to efficiently manage non-traditional assets like fiber optics.
Asset Management Systems
Asset management systems are goal driven and data oriented and include components for data collection, inventory, condition assessment, needs analysis, future performance, technical and economical evaluation of what-if scenarios, budget preparation, and prioritization of maintenance and rehabilitation interventions when funds are constrained. Through asset management systems, governmental agencies can improve infrastructure information
TRB 2012 Annual Meeting Paper revised from original submittal.
C. Chang-Albitres, L. Quintana, and R. Aldouri 3
accessibility, enhance and sharpen decision-making, make more effective investments, and decrease overall operating costs (3, 4).
In the context of infrastructure asset management, reliable information is the key to better decision making processes. According to Vanier (3), the answers to the following six questions are the basis of asset management:
1. What do you own? 2. What is it worth? 3. What is the deferred maintenance? 4. What is its condition? 5. What is the remaining service life? 6. What do you fix first?
Most public agencies are able to respond fairly well to the first two questions but fail when trying to tackle the remaining four. Tools integrated in an Asset Management System are required by agencies to handle the asset inventory, analyze their condition, and develop maintenance and rehabilitation programs to preserve the network performance at the expected level of service.
Asset management practices are currently enhanced with the implementation of an integrated system due to the vast amount of data collected, stored, and maintained up-to-date. This system should also consider the complexity of the analysis when making decisions. The latest advances in the technology provide tools for asset managers to efficiently tackle the complexities of the process. In the last two decades, the use of computer-based asset management systems has significantly improved the operational efficiency for preserving infrastructure assets (6). Multiple computational tools have been incorporated in asset management systems. The most popular tools are Computer Aided Design (CAD), CAD Facilities Management (CADFM); and relational databases such as the Computerized Maintenance Management Systems (CMMS), and Geographical Information Systems (GIS).
Geographical Information Systems for Asset Management
Geographical Information Systems (GIS) stands out as a great tool for asset management. . GIS is used for geospatial data storage and exchange, mapping, and what-if scenario analysis. GIS integrates all forms of geographically referenced information allowing the user to display and query data, revealing patterns and trends through maps, charts, and reports. GIS relates database records and their associated attribute data to a geospatial location, creating “smart maps” to visualize the assets in a what-if scenario context to analyze the relationships and potential impacts of the decisions, Visualization of the generated smart maps is enhanced by the data layering capabilities (7).
GIS can assist in managing spatial data and modeling applications that would otherwise be compromised or impossible to store in aspatial databases. The interactive character of GIS leads to the discovery of spatial relationships among parameters which become tangible to the user. This capability allows public agencies:
To improve communication among departments when working in multidisciplinary team projects,
TRB 2012 Annual Meeting Paper revised from original submittal.

C. Chang-Albitres, L. Quintana, and R. Aldouri 4
To enhance the decision making process when developing management plans due to better communication and analysis tools
To maximize cost savings resulting from greater efficiency in management and operations.
In spite of the GIS advantages, Pryzbyla mentioned seven major obstacles to successfully implement GIS in public works (8):
1. Clear and quantitative definition of financial payback at the beginning of the project, 2. Lack of vision for GIS implementation and advantages, 3. Treatment of GIS as a mere technology without considering people’s concerns, 4. Internal bureaucratic barriers, 5. Balancing whether projects will be developed in-house or outsourced, 6. Budgeting and financial aspects, and 7. Treatment of GIS as a capital expenditure, as opposed to an operating expense.
Once these obstacles have been overcome, and the system is fully implemented, GIS constitutes a versatile tool for its ability to capture, store, and manage spatially referenced data. GIS also serves as a platform to establish multiple relationships across the data records, including other related documents and photos (9).
GIS FIBER OPTICS ASSET MANAGEMENT SYSTEM (GFOAMS) FOR THE CITY OF EL PASO
In the last five years, there has been an increasing interest from private companies in investing in the telecommunication system that the City of El Paso uses to operate. A pivotal element of the telecommunication system is the fiber optics network which has been gradually developed over a period of 20 years. During the last 20 years, the City of El Paso has been developing a fiber optics network to connect main facilities, such as police and fire departments, municipal courts, transportation or municipal service facilities, across the city. Due to the large span of time in which installations, additions, and repairs to the fiber optics network have been made, many department heads and technicians involved in their development either retired or were transferred to other departments. As a consequence, fiber optics data for the multiple network systems was dispersed or lost.
In 2006, the City of El Paso started unification efforts to centralize the management of the fiber optics network, thereby enhancing the efficiency of the process. According to managers and maintenance crews, it soon became evident that it was necessary to have a reliable database of their assets with a user-friendly interactive interface.
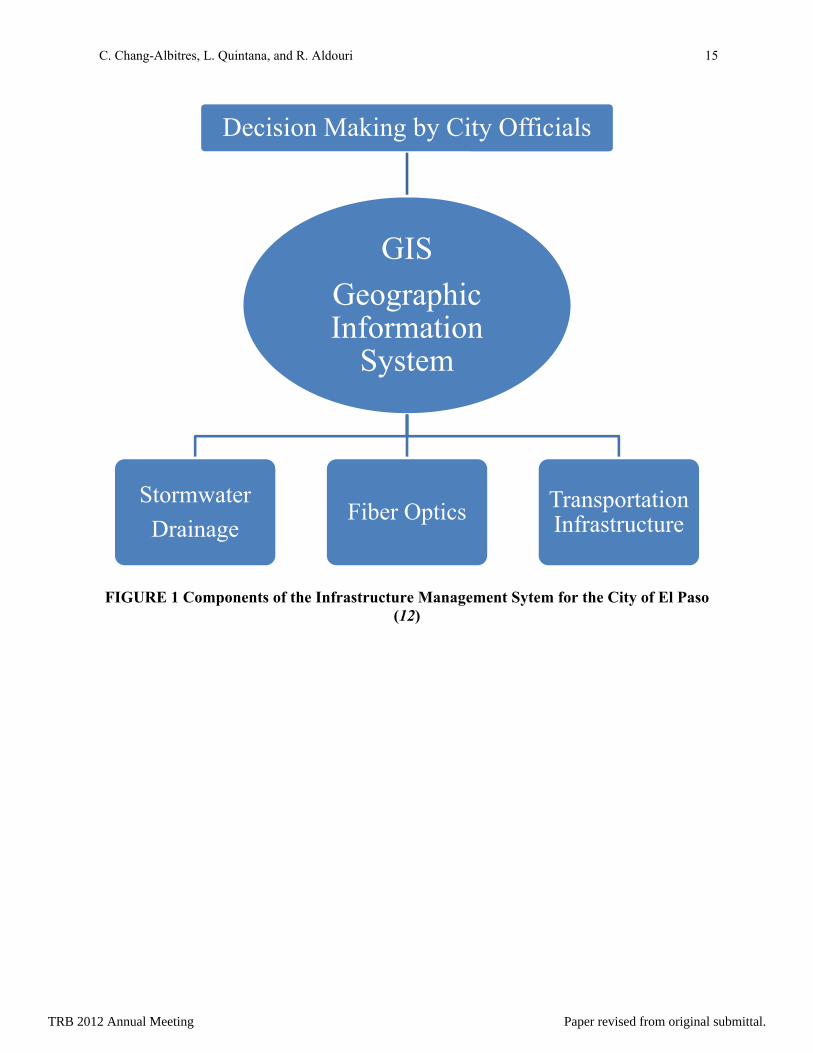
GFOAMS is part of an overall ongoing cooperative project between the University of Texas at El Paso (UTEP) and the City of El Paso to develop a Sustainable Infrastructure Management System. The project focuses on critical infrastructure components for the City and includes: drainage, communications, and transportation as shown in Figure 1. The first component of the integrated infrastructure management system is the “Storm Water Drainage Infrastructure System” (SWAD) (10). The development of this component started in May 2007 and was fully implemented in June 2009. The second component is the “GIS Fiber Optics Asset Management System” (GFOAMS) and was completed in April 2011. The third component is the
TRB 2012 Annual Meeting Paper revised from original submittal.

C. Chang-Albitres, L. Quintana, and R. Aldouri 5
“Transportation Infrastructure System”. Its planning stage started in November 2010. All these components are integrated through a Geographic Information System (GIS).
The GFOAMS project started in 2009 and involved: (a) reviewing existing records to extract data for the fiber optics network, (b) performing field surveys to verify and collect data for the fiber optics network, (c) integrating fiber optics data into GIS and adding attribute information, (d) developing the GFOAMS platform, and (e) recommending practical applications for the system
GFOAMS is currently not only used by managers for planning purposes to determine what to fix first but also by maintenance crews who conduct daily inspections to assess fiber optics condition, and avoid deferred maintenance. In order to fully address Vanier’s asset management questions, the next frontier for GFOAMS is to integrate performance models to predict future fiber optics condition as well as their remaining life.
The seven obstacles mentioned by Pyzbyla to successfully implement GIS technologies were not faced during the development of GFOAMS. The City of El Paso was already a strong advocate of new technologies and convinced of the benefits of using an interactive GIS system. The support for the development of GFOAMS was across all management levels. GFOAMS was the tool needed to reduce outsourcing and conduct maintenance operations with in-house resources. Concerns from the inspectors, and maintenance crews where addressed by having their members participate in the project. This approach proved to be successful and ensured that the final product delivered to the City of El Paso met their expectations.
The major challenge during the development of the GFOAMS project was to locate fiber optic conduits in the field and identify their routes. Visual inspections on the field were conducted to map the fiber optics network. These surveys were guided by senior maintenance personnel from the City of El Paso. Graduate and undergraduate students from the University of Texas at El Paso (UTEP) participated in the surveys. The cooperation between the City of El Paso and UTEP reduced the cost of field data collection and provided a unique experience to the students. For this reason, GFOAMS received the Engineering Award for Connecting Professional Practice and Education by the NCEES in June 2011. This award recognizes the uniqueness of the project and the collaborative effort between licensed professional engineers, students, and faculty during its development (11).
Existing fiber optics information from current maps was reviewed prior to the surveys. These maps did not always match with what was found in the field. Elements of the fiber optics network were physically located in the field and registered using a Global Positioning System (GPS). Data from junction boxes, conduit runs and fiber optic cables was manually collected with Portable Digital Assistants (PDAs) and incorporated directly into GIS, minimizing the risk of errors in data transcription. GFOAMS includes more than 330,000 feet of underground conduit that house fiber running through twelve fiber optic network systems across the city. They are called Backbone, North Doniphan, Downtown, Fonseca, Redd Road, Doniphan, Piedras, Hawkins/Airport, TMC-1 (Airway Boulevard), TMC-2 (George Dieter Drive), TMC-3 (Sunland Park), Yarbrough, and Zaragoza as shown in Table 1.
Table 1 provides information about each system including location, general direction, and number of junction boxes, conduit runs, and cables.
TRB 2012 Annual Meeting Paper revised from original submittal.

C. Chang-Albitres, L. Quintana, and R. Aldouri 6
For each system, the three most important components of the fiber optics network were recorded:
a. Junction Boxes housing the splices (connection points within a two fiber strands joined together) and allowing the handling of the cable.
b. Conduit Runs connecting point A to point B through longitudinal stretches of underground conduits.
c. Cables carrying the information.
Figure 2 shows a descriptive image of the interior of the junction box.
GFOAMS Framework Structure
The GFOAMS framework structure is composed of three modules: inventory, documents, and images. The data is stored in three main layers: Junction Boxes, Conduit Runs, and Cables using a GIS map-driven interface to display the information and results of the analyses as shown in Table 2. Figure 3 shows the GFOAMS framework structure. GFOAMS structure design is flexible enough to be modified and expanded with new modules. A description of GFOAM modules follows.
Inventory module
The inventory module consists of three tables that represent a component of the fiber optics infrastructure system for the City of El Paso Each table stores information on the main attributes of a type of asset (e.g. a conduit run, a single cable or a traffic management cabinet). The attributes are related to inspection date, material, depth and others. The layers are interrelated and contain hyperlinks that connect the inventory with the other modules for a user friendly access while browsing the information on a map.
The information presented in Table 2 represents the chosen attributes for the JunctionBoxes, ConduitRun, and Cables layers respectively.
Documents module
The documents module consists of drawings and maps, design and as-built plans, schematics, and any other documents relevant to the features spatially represented in GFOAMS. Before the implementation of the GFOAMS, the established system was structured in paper records and isolated electronic files. GFOAMS provides the ability to spatially relate all features and attributes in an interactive map, giving the user the capability to link all the relevant files. This is a great improvement from the paper document system (or its electronic equivalent, with files and folders) piled up in storage rooms, where relevant documents are out of hand obstructing effective retrieval for management and planning purposes.
Images module
The images module is the database repository where all the photos relevant to the fiber optics network system are stored. The layout of the cables can be so cumbersome that photos are needed to provide further details for repair, renewal, or replacement. Photos complement the data stored in the tables, and are accessed through Hyperlinks defined in the Junction Box table. GFOAMS contains photos for junction boxes, cables, and conduit runs connecting through them.
TRB 2012 Annual Meeting Paper revised from original submittal.

C. Chang-Albitres, L. Quintana, and R. Aldouri 7
GFOAMS APPLICATIONS
The main purpose of GFOAMS is to assist the City of El Paso managing the fiber optics network system. GFOAMS is currently fully implemented by the City of El Paso. GFOAMS includes tools to facilitate access to the inventory and visualize any specific details of the fiber optics conduit network. These tools allow the generation of smart maps of specific fiber optics elements in the sub-system network. GFOAMS allows the City quick access to reliable information, enhancing their maintenance program to avoid any telecommunication disruptions as these would have an adverse impact not only in the emergency relief programs to mitigate disasters but also in daily operations such as planning and maintenance. Another major application that is currently migrating to the fiber optics network is the Intelligent Transportation System (ITS) for traffic management control and camera activated signal timing. Four different sample applications are described here.
Accessing Key Fiber Optics Information through Hyperlinks
One of the most important resources that an asset manager can have is to get quick access to the documents relevant to features of interest. In the past, asset managers had to rely solely on huge paper records to access information for the diverse systems that they managed; cabinets and map drawers would fill up document rooms to the point of being unpractical and problematic to retrieve documents. With the advent of computing systems and electronic versions of the documents, the task became in a sense easier, but still accessing documents could be a daunting task as the information was dispersed in the different computers, servers and databases used for this purpose.
The documents module deals specifically with the need to access documents while browsing features in the map. Figure 4 shows access to fiber optics information stored in an external document e which was accessed directly through GFOAMS.
GFOAMS has the capability to store and access photos from fiber optics taken by field inspectors. Costly mobilizations to the field can be minimized to swiftly make decisions on-the-fly from the office. For instance, in the case of a rupture of the conduits and/or fiber optic cables inside, the asset manager can dispatch an emergency repair team with all the necessary tools to open the nearby junction boxes, and repair the damage and reestablish the service. An example of such scenario is shown in Figure 5, where it can be seen a malfunction in the lid opening system of a Junction Box, quite possible due to soil displacements. This malfunction was detected in the field by an inspector, and automatically uploaded to the system for immediate action.
Planning Fiber Optics New Developments
In order to better coordinate with the stakeholders involved in new fiber optics developments, asset managers need to discuss the alternatives. With GFOAMS all planning documents, drawings, and, specifically, paths for future fiber optics networks are rendered much simpler and more efficient. Moreover, the visualization of the georeferenced new system, allows for analyzing the interactivity between the existing network system and the proposed additions. In Figure 6, the path of a proposed new fiber optics conduit is shown in what-if scenario smart map generated for further evaluation , using the GFOAMS’ capability of showing detailed, in-site
TRB 2012 Annual Meeting Paper revised from original submittal.

C. Chang-Albitres, L. Quintana, and R. Aldouri 8
information. This functionality not only makes the process swifter, but also ensures cost-effective investments.
Managing Leasable Fiber Optics Fiber Conduits and Strands
Another advantage of a fiber optics asset management system is that it can help municipal agencies to lease their assets. In the case of fiber optics, extra space in city-owned conduits can be leased to install additional cables. Also, unused or ‘dark’ fiber strands, which are the individual fiber optics strands bundled in a cable containing up to 576 strands in some cables in El Paso, can be leased to third parties.
The City of El Paso is currently reviewing the right-of-way leasing scheme for new installation of fiber optics by telecommunication companies. With the usage of GFOAMS, and through a better management of the fiber optics asset, a new leasing process could enable the city to increase revenues by leasing existing conduits and cables. An improved knowledge about the fiber optics infrastructure will certainly aid the Financial Departments to establish adequate fees within the new leasing scheme.
To illustrate the possibilities what if analysis for different scenarios can be conducted by GFOAMS, Figure 7 shows a stretch of city-owned fiber optics assets with a length of almost 20,000 feet. According to a study by Atalah et al. in Bowling Green State University (13), the construction cost per 1,000 feet ranges from $20,000-$25,000 using Horizontal Directional Drilling (HDD), or in-sewer installation using the Sewer Telecommunication Access by Robot (STAR), and up to $60,000 using open trench methods. Based on these estimates, a telecommunications company would invest between $400,000 and $1,200,000, in addition to the right-of-way fees that must be paid to the City. These numbers show that there can be a large amount of increased revenues for the City due to the incomes generated with the new leasing scheme. At the same time, this leasing scheme can save money for the telecommunications company by using the existing fiber optics network owned by the City instead of building their own.
Proximity Infrastructure Buffer Analysis
Using ArcMap’s built-in functions, GFOAMS can be used to identify zones located 100, 500, 1,000 and 2,500 feet from the existing conduit runs as shown in Figure 8. Different buffer zones can be established for analyzing alternative scenarios when planning new routes.
Smart maps generated from buffering analysis allow the user to visualize the facilities located within certain ranges of the existing fiber optics system and see if they are connected to the network. This type of analysis helps the planning of new additions to the fiber optics network.
According to the City of El Paso, the public’s safety is the current focus. The priority for extending the fiber optics network to remaining unconnected buildings is, in the order presented: police departments, fire departments, municipal courts, health administration building, public transportation facilities/Sun Metro, and libraries.
TRB 2012 Annual Meeting Paper revised from original submittal.

C. Chang-Albitres, L. Quintana, and R. Aldouri 9
CONCLUDING REMARKS
The asset management paradigm, which is critical for efficient funding allocation within any organization, is evolving. Computational tools have become a must for asset managers as they allow for better storage, access, and management of asset data. GIS stands out as one of the leading technologies in this evolution of management schemes, giving the users the capability to generate smart maps to relate attributes and documents with georelated assets in an interactive manner. GIS empowers asset management systems and allows managers to face the day to day operations more efficiently. It also facilitates long term planning. GFOAMS framework structure and project development with the participation of managers, maintenance crews, and GIS-based asset management experts is a model that can be used by other Cities to effectively managed non-traditional assets like fiber optics.
Currently, fiber optics is the preferred method for large data transmissions due to its broadband capacity, safety of information transfer, and non-disturbance by external signals. These characteristics make fiber optics an essential element not only for day to day operations but when dealing with emergencies due to extreme events. The City of El Paso’s interest in maintaining and expanding the fiber optics network for telecommunications, and the Intelligent Transportation Systems operations recognizes the importance of having a reliable fiber optics asset management system leading to the development of GFOAMS. GFOAMS has up-to-date reliable information of the existing fiber optics networks across the city. It has numerous interactive tools to perform complex analyses useful for short-term and long-term planning. By displaying smart maps with the results of what-if scenarios analyses, GFOAMS’ multiple capabilities has allowed the City of El Paso to implement a more efficient management system saving time and money.
ACKNOWLEDGEMENTS
The authors are thankful to the City of El Paso for funding the project and providing continuous support and feedback during the development of GFOAMS.
TRB 2012 Annual Meeting Paper revised from original submittal.
C. Chang-Albitres, L. Quintana, and R. Aldouri 10
REFERENCES
1. Hecht, J. Understanding Fiber Optics. 5th Ed. Pearson Prentice Hall, Upper Saddle River, 2006.
2. Alwayn, V. Fiber-Optic Technologies. Cisco Press, April 2004. http://www.ciscopress.com/articles/article.asp?p=170740&seqNum=7 Accessed July . 1, 2011.
3. Blueprint for Developing and Implementing an Asset Management System. Asset Management Task Force Report. New York State Department of Transportation, 1998.
4. Asset Management Systems – Project Description. Organization for Economic Co-operation and Development, 1999
5. Vanier, D. J. Why Industry Needs Asset Management Tools. Journal of Computing in Civil Engineering, Vol. 1, No. 1, 2001, pp. 35-43.
6. Halfawy, M. R., D. J. Vanier, and T. M. Froose. Standard data model for interoperability of municipal infrastructure asset management systems. Canadian Journal of Civil Engineering, Vol. 33, 2006, pp. 1459-1469.
7. Vanier, D. J. Geographic information systems (GIS) as an integrated decision support tool for municipal infrastructure asset management. CIB Triennial Congress Proceedings, Toronto, Canada, 2004.
8. Pryzbyla, J. What stops folks cold from pursuing GIS? Public Works, Vol. April 4, 2002, pp. 35-42,
9. Miles, S.B., and Carlton L. Ho. Applications and Issues of GIS as Tool for Civil Engineering Modeling.” Journal of Computing in Civil Engineering, Vol. 13, No.3, 1999.
10. Garaibeh, N. ,,G. Camacho, M.Elgendy, and I.D. Ramirez, Geographic Information System Framework for Stormwater Drainage Asset Management. Transportation Research Record, Vol. 2121, 2009, pp. 1-12.
11. 2011 NCEES Engineering Award Winners. National Council of Examiners for Engineering and Surveying (NCEES). http://www.ncees.org/Licensure/Engineering_Award/2011_Award_winners.php Accessed June 15, 2011.
12. Quintana, L., M. Light, C. Chang-Albitres,, and R. Aldouri. GIS Fiber Optics Asset Management System. Final Report. University of Texas at El Paso, TX, 2011.
13. Atalah, A., C. Chang-Jin, and, K. Osburn. Comparison study of installing fiber optic cable in university campuses using trenchless techniques relative to open cut. In Proceedings of the Pipeline Division Specialty Conference 2002. ASCE, Cleveland, Ohio, 2002.
TRB 2012 Annual Meeting Paper revised from original submittal.

C. Chang-Albitres, L. Quintana, and R. Aldouri 11
LIST OF TABLES
TABLE 1 Fiber Optics Systems in GFOAMS .............................................................................. 12
TABLE 2 Data Dictionary Summary ........................................................................................... 13
TRB 2012 Annual Meeting Paper revised from original submittal.

C. Chang-Albitres, L. Quintana, and R. Aldouri 12
TABLE 1 Fiber Optics Systems in GFOAMS
System Name Location Direction From To Junction
Boxes Conduits Cables
Backbone City-wide East-West (Misc.)
N/A N/A 88 99 15
N. Doniphan Westside North-South
Mesa Borderland 31 30 19
Downtown Downtown Misc. N/A N/A 128 163 43
Fonseca Eastside North-South
Cesar Chavez Delta 14 13 1
Redd Rd. Westside East-West I-10 Mesa 14 13 3
Doniphan Westside North-South
Osborne/ Sunset
Doniphan P. 23 24 3
Piedras Central North-South
Montana Wyoming 6 5 2
Hawkins/Airport Eastside Northwest- Southeast
Stinson L. Term Lot 45 43 4
TMC-1 Eastside North-South
1-10 Founders 43 42 19
TMC-2 Eastside North-South
Vista del Sol Montana 35 34 16
TMC-3 Westside East-West Mesa Doniphan/ Frontera
49 49 30
Yarbrough Eastside North-South
Vista Del Sol San Paulo 21 27 6
Zaragoza Eastside North-South
Rojas Cesar Chavez
80 80 30
TRB 2012 Annual Meeting Paper revised from original submittal.

C. Chang-Albitres, L. Quintana, and R. Aldouri 13
TABLE 2 Data Dictionary Summary
Junction Boxes Layer Conduit Runs Layer Cables Layer Comments Application Actual Db Loss Conduit 1 Cable ID 1 Calculated Db Loss Conduit 2 Cable ID 2 Cable Size Conduit 3 Cable ID 3 Comments Conduit 4 Cable ID 4 Conduit ID Conduit 5 Cable ID 5 Construction Year Conduit 6 Cable ID 6 Cumulative Db Loss Depth Cable ID 7 Cumulative Length Document Link 1 Cable ID 8 Dark Fiber Strand(s) Document Link 2 Color Input Date Document Link 3 Comments Editor Name Input Date Conduit Location Fiber Count Editor Name Conduit Size Fiber Owner Grantee Conduit System Identification Number Identification Number Conduit Type Lit Fiber Strand(s) Images Input Date Maintenance Image Link Editor Name Manufacturer Image Link 2 Fiber User Mode Junction Location Grantee Object Identification Number Junction Type Identification Number Shape* Length Image Link Shape Length Maintenance Maintenance Sheath Number Object Identification Number Material Subsystem Online Link Object Identification Number System Shape* Service Area Type Splice Shape* Subsystem Shape Length System Street(s) Width
TRB 2012 Annual Meeting Paper revised from original submittal.
C. Chang-Albitres, L. Quintana, and R. Aldouri 14
LIST OF FIGURES
FIGURE 1 Components of the Infrastructure Management Sytem for the City of El Paso (12) . 15
FIGURE 2 Example of a Junction Box Interior (GFOAMS) ....................................................... 16
FIGURE 3 GFOAMS Framework Structure ................................................................................ 17
FIGURE 4 Accessing Fiber Optics Documents and Photos ......................................................... 18
FIGURE 5 Jammed Junction Box Lid Observed through GFOAMS ........................................... 19
FIGURE 6 Planning Fiber Optics New Developments with GFOAMS....................................... 20
FIGURE 7 Estimating Leasing Revenues Using GFOAMS to Determine Conduits Length ....... 21
FIGURE 8 Proximity Infrastructure Buffer Analysis of the Conduit Runs.................................. 22
TRB 2012 Annual Meeting Paper revised from original submittal.
C. Chang-Albitres, L. Quintana, and R. Aldouri 15
FIGURE 1 Components of the Infrastructure Management Sytem for the City of El Paso (12)
Decision Making by City Officials
GIS
Geographic Information
System
Stormwater
Drainage Fiber Optics Transportation
Infrastructure
TRB 2012 Annual Meeting Paper revised from original submittal.

C. Chang-Albitres, L. Quintana, and R. Aldouri 16
FIGURE 2 Example of a Junction Box Interior (GFOAMS)
PVC Conduit
Cable and Slack
Splice Case
TRB 2012 Annual Meeting Paper revised from original submittal.

C. Chang-Albitres, L. Quintana, and R. Aldouri 17
FIGURE 3 GFOAMS Framework Structure
GFOAMS
GIS Map-Driven Interface
Inventory Module
Images Module
Documents Module
TRB 2012 Annual Meeting Paper revised from original submittal.

C. Chang-Albitres, L. Quintana, and R. Aldouri 18
FIGURE 4 Accessing Fiber Optics Documents and Photos
TRB 2012 Annual Meeting Paper revised from original submittal.

C. Chang-Albitres, L. Quintana, and R. Aldouri 19
FIGURE 5 Jammed Junction Box Lid Observed through GFOAMS
TRB 2012 Annual Meeting Paper revised from original submittal.

C. Chang-Albitres, L. Quintana, and R. Aldouri 20
FIGURE 6 Planning Fiber Optics New Developments with GFOAMS
TRB 2012 Annual Meeting Paper revised from original submittal.

C. Chang-Albitres, L. Quintana, and R. Aldouri 21
FIGURE 7 Estimating Leasing Revenues Using GFOAMS to Determine Conduit Length
TRB 2012 Annual Meeting Paper revised from original submittal.

C. Chang-Albitres, L. Quintana, and R. Aldouri 22
FIGURE 8 Proximity Infrastructure Buffer Analysis of the Conduit Runs
TRB 2012 Annual Meeting Paper revised from original submittal.