development of a flight simulation training device and
TRANSCRIPT

Development of a Flight Simulation Training
Device and Remote Pilot Station: The URBLOG Unmanned Hybrid Airship
Vehicle Case
Laura Sofia Nobre Martins
Dissertação para obtenção do Grau de Mestre em
Engenharia Aeronáutica (mestrado integrado)
Orientador: Professor Doutor Jorge Miguel dos Reis Silva
junho de 2020

ii

iii

iv

v
Dedicatory
Alzira Borges Coelho
Salvador Vieira Nobre
Maria Castela Pereira Martins
Ulisses Lopes Ferreira Martins
Diogo Valério Brito
Pintas Tobias Boby
You are dearly missed
“Those who pass by us, do not go alone, and do not leave us alone;
they leave a bit of themselves, and take a little of us.”
Aviator and Writer Antoine de Saint-Exupéry

vi

vii
Acknowledgements
The development and conclusion of this dissertation mark the end of a chapter that has been
filled with many adventures and special moments. This work represents the fulfilment of
many dreams and projects that could not have been possible without the extraordinary
people by my side. Their support had a major impact on me and how, why and when this
dissertation was performed. Therefore, I would like to express my greatest gratitude to:
Miguel and Tiago, for their friendship from the very first moment, standing with me side by
side during all my successfulness and downfalls. Thank you for bearing with me closely for
the last nine years!
All the Academic and teaching personnel, at all the stages of my educational path: schools
and university. Their teachings made me who I am today.
NIT - Núcleo de Investigação em Transportes, where I met wonderful people that allowed
me to explore my areas of interest and embrace new opportunities, in a family-like
environment. A research group that made me grow not only as a researcher but also as a
person. A special thank you to Maria Emília Baltazar for her directness and honesty, and
Luís Trindade, for the mutual support in the URBLOG project.
All the institutions that gave me the conditions and the opportunity to learn and fulfil my
curiosity, particularly in flight simulation: Universidade da Beira Interior, Cranfield
University and Politechnika Rzeszowska im. Ignacego Łukasiewicza. My dearest and written
appreciation to the people of the International Relation offices that guided me through my
Erasmus + experience in Rzeszów: Sofia Lemos, Joanna Ruszel, Monika Mistur-Góral and
Monika Stanisz. During that year in Poland, not only I had an excellent time expanding my
academic and personal skills with an outstanding university program, but also the
opportunity to fulfil a lifelong dream of learning to fly. Being in such Aviation related city,
allowed me to take that chance, which I will always be grateful.
My course and university colleagues, nationally and internationally, that shared with me
the most amazing adventures and moments, including in my Erasmus + experience. Some
have stayed in my close circle, others followed different paths, but those moments will last
forever. Dziękuję bardzo to Joanna Kulczycka for all the friendship and support as my
buddy during my stay in Rzeszów.

viii
People I met abroad in conferences and courses, sharing their insights and challenges,
making me realize the different perspectives and ideas on so many different topics in
Aviation. Some keep in touch; distance is only a number.
My present/current and former work colleagues that happily share their knowledge and
show me how vast and complex Aviation is.
The available to perform the Human In the Loop study included in this dissertation.
Without them, that study would not be possible.
My friends, that during the last few years accepted and understood my non-availability and
gave me strength to carry on.
My family, that is always supportive and interested.
My parents, Ana and Paulo, that gave me wings to fly, but keep the nest open for my return
with the most loving heart.
Professor Jorge Silva, that made the last 6 academic years possible the way they were,
leading to the conclusion of this work. With his mentorship and competence in different
roles, I outgrew myself, reaching objectives I had never thought, accepting unimaginable
challenges. His support, trust and guidance led me to join NIT, pursue my interests and
fight my difficulties as a student and researcher. His attention to detail and patience made
me a more thoughtful professional. His friendship and inspiration kept me going beyond
the higher skies and surpass myself.
João, for all the love, friendship, patience, and support. You are my co-pilot.
Thank you

ix

x

xi
Abstract
With the growing number of passengers and technological advancements, the Aeronautical
industry is keen on new and reinvented types of transportation. New interest in airship
technology has grown in the past few years to enhance its flight capabilities.
A new solution for urban mobility appeared, with new airship design. This airship, named
URBLOG, combines the traditional airship concept with rotorcraft technology. Being a new
concept, it requires methods and solutions to reach its new goals.
Simulation emerges as a solution to design, test and validate methods at a low cost when
developing a new vehicle prototype. Concepts can be optimized and improve their time to
the market. In addition to simulation of the vehicle for design proposes, it is also possible
to apply it on Flight Simulator software to understand its flying characteristics and to design
its synthetic environment, as a flight simulation training device (FSTD).
In this work, an unmanned version of the URBLOG is firstly designed on the CAD software
Blender® and is later implemented in flight simulation software Lockheed Martin
Prepar3D®, reflecting the main purpose and characteristics of the vehicle. A virtual cockpit
is designed, and the flight simulation training device (FSTD) is defined, which can be
integrated into the remote pilot station (RPS) of the URBLOG’s remote piloted aircraft
system (RPAS). This is developed considering the operator’s point of view and the human
factors considerations applicable to cockpit design and remote pilot stations (RPS). A basic
training programme is then produced to train the unmanned vehicle operator of that
station. To verify and validate the programme and that synthetic environment, a human in
the loop study is conducted.
Keywords: Airship; Synthetic Environments; Flight Simulation; Unmanned Vehicle
Operator; Flight Simulators; Flight Training Devices; Flight Simulation Training Devices
Remote Pilot Station; Remotely Piloted Aircraft Systems; Virtual Cockpit; Training; Human
in the Loop; Simulation; Human Factors

xii

xiii
Resumo
Com o crescente número de passageiros e avanços tecnológicos, a indústria aeronáutica está
atualmente interessada em novos tipos de transporte. Nos últimos anos surgiu um novo
interesse em dirigíveis, combinando novas tecnologias para aprimorar as suas capacidades
de voo. Baseado nesta necessidade, surgiu uma nova solução para a mobilidade urbana, com
um novo tipo de dirigível. Este dirigível, de nome URBLOG, combina o modo de voo
tradicional de um dirigível com a tecnologia de aeronaves de asa rotativa, e sendo um novo
conceito, requer métodos e soluções para atingir os seus novos objetivos.
A simulação do voo aplica-se como uma solução de baixo custo para desenvolver o novo
protótipo do veículo, de modo a projetar, testar e validar os métodos e soluções em questão.
Estes conceitos podem ser otimizados e melhorados, agilizando a sua implementação no
mercado. Além da simulação do veículo para o desenvolvimento do projeto proposto, ao
aplicá-lo em software de simulação de voo, é possível igualmente entender as suas
características de voo e projetar o seu ambiente sintético de treino, como um dispositivo de
treino de simulação de voo (FSTD).
Neste trabalho, um protótipo não tripulado do URBLOG é primeiramente projetado no
software de desenho assistido (CAD) por computador Blender® e posteriormente
implementado no software de simulação de voo Lockheed Martin Prepar3D®, onde é criado
o seu modelo de voo refletindo o seu principal objetivo e características do veículo. É
projetado um cockpit virtual bem como o seu FSTD, podendo estes ser integrados numa
estação de piloto remoto (RPS) do sistema de aeronave pilotada remotamente (RPAS) onde
o URBLOG se inclui. Este desenvolvimento é focado no ponto de vista do operador bem
como os fatores humanos aplicáveis ao design de cockpits e das estações de piloto remoto
(RPS). Um programa básico de treino é produzido de modo a treinar os operadores do
veículo não tripulado nesse ambiente sintético e validar as suas funcionalidades. Para
validar e verificar também esse programa, é criado um teste onde a componente humana,
por via de vários utilizadores de teste, é incluída nesse mesmo ambiente sintético,
simulando uma possível operação do URBLOG.
Palavras-Chave: Dirigível; Ambiente Sintético; Simulação de Voo; Operador de Veículo
Não Tripulado; Simulador de Voo; Estação de Piloto Remoto; Sistemas de Aeronaves
Pilotadas Remotamente; Cockpit Virtual; Treino; Simulação; Fatores Humanos

xiv

xv
Resumo Alargado
Esta secção resume, em língua portuguesa, o trabalho desenvolvido nesta dissertação de
mestrado. É primeiramente efetuado um enquadramento sendo depois abordados os seus
objetos e objetivos. No final serão apresentadas as principais conclusões e perspetivas de
investigação futura.
Com os crescentes avanços tecnológicos, novos tipos de transportes estão a ser estudados
como possíveis soluções para problemas de mobilidade urbana. Devido a essa necessidade
emergente, foi iniciado em 2014 um projeto de um dirigível na Covilhã, Portugal. Este
projeto, chamado de URBLOG, evoluiu para um Sistema de Transporte Aéreo
Multifuncional, sujeito a pedidos de patente nacional (PT 108532 A) e internacional (WO
2016/195520 A). Este dirigível combina o modo de voo tradicional de um dirigível com a
tecnologia de aeronaves de asa rotativa, tornando-se um sistema híbrido que pode efectuar
voo estacionário e realizar descolagens e aterragens na vertical. Apresentando-se este como
um novo conceito, tornou-se necessário realizar um estudo de métodos e soluções para
atingir os seus novos objetivos.
A simulação do voo aplica-se como uma solução de baixo custo para desenvolver um
protótipo deste veículo, de modo a projetar, testar e validar os métodos e soluções em
questão. Estes conceitos podem ser otimizados e melhorados, agilizando a sua
implementação no mercado. A simulação de voo aplicada ao veículo no desenvolvimento do
projeto torna igualmente possível entender não só as suas características de voo, bem como
projetar o seu ambiente sintético de treino de simulação de voo (FSTD). Assim,
considerando um protótipo não tripulado do URBLOG, com um comprimento de 8,5
metros, esta dissertação aborda o desenvolvimento e a implementação deste veículo num
dispositivo de treino de simulação de voo (FSTD), refletindo o seu principal objetivo e
características. Por ser uma aeronave pilotada remotamente (RPA), parte de um sistema de
aeronave remotamente pilotado (RPAS), o dispositivo de treino torna-se relevante não só
no teste de sistemas, treino do operador do veículo e desenvolvimento do seu cockpit virtual,
como também por poder ser parte integrante da sua estação de piloto remoto (RPS).
Este trabalho terá então dois objetivos específicos: o primeiro será a implementação do
dirigível num software de simulação de voo, com a consequente criação do seu cockpit
virtual e implementação do ambiente sintético; e o segundo, a definição de um programa
básico de treino para os operadores desse ambiente, permitindo também a validação e

xvi
verificação dos mesmos. Em ambos os objetivos, o foco é a operabilidade do sistema do
ponto de vista do operador bem como os fatores humanos aplicáveis ao design de cockpits
e das estações de piloto remoto (RPS), que podem contribuir para um acidente ou incidente.
Este trabalho interconecta, portanto, os ambientes sintéticos, com os dispositivos de treino
de simulação de voo (FSTD), as estações de piloto remoto (RPS), o treino dos operadores
destas estações, e os fatores humanos aplicáveis.
O protótipo não tripulado do URBLOG foi assim primeiramente projetado no software de
desenho assistido por computador Blender® e posteriormente implementado no software
de simulação de voo Lockheed Martin Prepar3D®, onde é criado o seu modelo de voo
refletindo o seu principal objetivo e características do veículo. A escolha deste software é
feita através de um estudo comparativo com outros softwares, sendo justificada pelas
possibilidades que este oferece bem como a informação conhecida do protótipo.
Para o desenvolvimento do cockpit virtual e do seu FSTD, vários tipos de instrumentos de
voo são analisados, assim como os fatores humanos aplicáveis aos cockpits e estações de
piloto remoto (RPS). O foco do desenvolvimento foi direcionado aos elementos essenciais
de controlo do veículo na perspetiva do seu operador, incluindo as interfaces virtuais, como
o cockpit virtual e as interfaces físicas. Dois tipos principais de instrumentos de voo foram
escolhidos e um head up display (HUD) foi adaptado para uma constante monitorização
dos dados de voo numa visão para fora do veículo. Como os requisitos de vários sistemas do
URBLOG não estão definidos, as interfaces físicas escolhidas são produtos comerciais
de uso genérico (COTS), embora assegurando um certo número de preceitos e
recomendações. Juntas perfazem uma certa configuração, composta por um computador
portátil, com o software de simulação de voo Prepar3D® instalado, juntamente com uma
interface de controlo de voo, onde as duas mãos estão sobre os comandos (HOTAS), um
dispositivo de head-tracking e um ecrã adicional. Essa configuração foi posteriormente
implementada, definindo assim o ambiente sintético.
No entanto, devido à pouca informação disponível sobre os vários sistemas do veículo,
foram feitas diferentes suposições para ilustrar o seu conceito no software de simulação de
voo. Por esse motivo, caso mais dados estivessem disponíveis, outras opções poderiam ter
sido selecionadas nesta dissertação. Isso afetaria não só o cockpit virtual, como também as
interfaces físicas do próprio ambiente sintético, os procedimentos, e limitações de operação
do veículo. De igual forma, certas características do URBLOG não puderam ser
implementadas, como a propulsão dos rotores instalados nas suas superfícies (tecnologia

xvii
de aeronaves de asa rotativa), assim como a acoplagem a uma estação, pois o veículo é
controlável apenas acima do nível do solo com o motor ligado.
Foi de seguida definido um programa de treino para que o ambiente sintético do URBLOG
pudesse ser efetivamente usado. Um estudo de componente humana, por via de vários
utilizadores de teste é incluído nesse mesmo ambiente sintético, de modo a verificar e
validar tanto a disposição das suas várias interfaces como também esse mesmo programa
de treino. Este estudo, realizado por diferentes utilizadores, chamados de operadores, com
diferentes níveis de conhecimento, consistiu no efetuar e concluir de uma missão com
diferentes tarefas, no programa de simulação de voo onde o URBLOG foi implementado.
Para isso, os operadores foram convidados a seguir o manual de operação do veículo,
também desenvolvido no âmbito desta dissertação, contendo as suas características,
limitações e procedimentos operacionais. Os dados e os parâmetros de voo deste estudo
foram registados e comparados com uma referência ótima relativa obtida por um operador
externo, mais experiente. Os desvios padrão e medianas de e entre operadores foram
calculados, originando 91 gráficos para uma melhor analise.
O programa de treino desenvolvido foi bem-sucedido, levando à verificação e validação não
só desse mesmo programa, assim como também do ambiente sintético definido. O manual
de operação do URBLOG revelou-se muito eficaz, fornecendo não só informações
suficientes para a correta interpretação das características e controlo do veículo, como
também do ambiente sintético. O nível de conforto designado pelos operadores durante a
execução da missão indica que o ambiente sintético projetado foi adequado.
Os resultados do estudo sugerem que indivíduos com mais experiência de voo virtual podem
reagir melhor a esse ambiente sintético do que os pilotos da vida real. Adicionalmente,
verificou-se que indivíduos sem experiência de voo, seja ela virtual ou real, conseguem, num
curto espaço de tempo, adequar-se e realizar esta missão com sucesso sem treino. Mas,
reconheceu-se que com um estudo com um número reduzido de utilizadores de teste, assim
como de uma amostra de dados de um único operador externo experiente para a
comparação de dados é limitado, e pode induzir resultados menos corretos.
Quanto às recomendações e sugestões, todos os operadores sugeriram melhorias na fase de
aproximação e aterragem em relação aos flaps. O valor relativo ao seu nível de posição deve
ser visível no cockpit virtual, devendo igualmente ocorrer a inibição de certas posições
durante determinadas fases do voo, especialmente durante a fase de aterragem. Essas
sugestões são pertinentes e podem levar de facto a uma melhoria no controlo do veículo,

xviii
mas dado que a sua implementação seria demorada pois exigiria uma nova análise das
interfaces e um novo estudo de componente humana de modo a validar e verificar o seu uso,
a sua implementação não foi incluída neste trabalho.
Como os ambientes sintéticos podem ser facilmente adequados para diferentes tipos de
alterações, sejam elas virtuais, físicas ou processuais, os seguintes itens podem ser
considerados possíveis desenvolvimentos futuros deste trabalho:
• Implementar as sugestões propostas no estudo de componente humana realizado;
• Melhorar o modelo do URBLOG de modo simular a propulsão dos rotores em todas as
fases do voo, permitindo o voo estacionário para uma melhor decolagem e aterragem
vertical. Incluir igualmente o controlo do leme de direcção, e os compensadores das
superfícies de voo nesse modelo;
• Desenvolver um sistema de trem de aterragem ou incluir suportes para a aterragem
neste protótipo do URBLOG, de forma a permitir a acoplagem do veículo a uma estação;
• Implementar este ambiente sintético num computador de mesa, com mais
possibilidades gráficas para incluir ecrãs adicionais, de preferência permitindo uma
visão de 180º. Para isso, é recomendável que o HUD permaneça numa posição fixa em
vez de se mover com a visão do operador;
• Reunir dados de pilotos e operadores proficientes de veículos não tripulados neste
mesmo ambiente sintético e apresentá-los nas comparações de dados de voo do estudo
de componente humana, incluindo também um número maior de operadores de teste
na amostra;
• Implementar o URBLOG num outro programa de simulação de voo assim que hajam
mais dados disponíveis e comparar resultados, usando o mesmo ambiente sintético e
programa de treino, com as devidas alterações operacionais;
• Desenvolver um estudo adicional sobre o impacto do dispositivo de head-tracking e
ecrãs sensíveis ao toque neste ambiente sintético;
• Incluir outras funcionalidades de automação, como o piloto automático, permitindo
analisar o seu efeito no operador, assim como os requisitos necessários à navegação por
instrumentos num espaço aéreo;
• Aplicar as noções obtidas no sistema remoto real do URBLOG.

xix

xx

xxi
Table of Contents
Dedicatory...............................................................................................................................v
Acknowledgements ............................................................................................................. vii
Abstract ................................................................................................................................. xi
Resumo ............................................................................................................................... xiii
Resumo Alargado ................................................................................................................. xv
Table of Contents ............................................................................................................... xxi
List of Figures ..................................................................................................................... xxv
List of Tables .....................................................................................................................xxxi
List of Acronyms ............................................................................................................ xxxiii
Introduction ........................................................................................................ 1
1.1 Motivation ........................................................................................................... 1
1.2 Object and Objectives ........................................................................................ 2
1.3 Methodology ...................................................................................................... 2
1.4 Dissertation Structure ....................................................................................... 3
State of the Art ................................................................................................... 5
2.1 Introduction ........................................................................................................5
2.2 Systems Modelling and Simulation ...................................................................5
2.3 Flight Simulation and Flight Simulation Devices ........................................... 6
2.3.1 Flight Simulation Training Devices ................................................................ 7
2.3.2 Flight Simulation Training Devices according to CS-FSTD(A) Regulation 9
Full Flight Simulator (FFS) ..................................................................... 9
Flight Training Device (FTD) ................................................................10
Flight and Navigation Procedures Trainer (FNPT) ..............................10
Basic Instrument Training Device (BITD) ............................................10
2.3.3 Flight Simulation Training Devices Classification according to ICAO
Qualification Levels ................................................................................................. 11
2.3.4 Flight Simulation Training Devices Classification according to FAA ........ 11
2.4 Airship Cockpits ............................................................................................... 13
2.5 Remotely Piloted Aircraft System (RPAS) ...................................................... 14

xxii
2.5.1 Remote Pilot Stations (RPS) ......................................................................... 15
2.5.2 Remote Pilot Licensing and Training ........................................................... 17
2.6 Human Factors in Cockpits, Simulators and Remote Pilot Aircraft Systems17
2.6.1 The Remote Pilot Aircraft Systems Case ...................................................... 18
2.6.2 Responsibilities of the RPA Pilot and Associated Implications ................. 19
2.7 Conclusion ....................................................................................................... 22
Case Study I: Development of the Synthetic Environment for URBLOG ... 23
3.1 Introduction ..................................................................................................... 23
3.2 URBLOG Vehicle Specifications ..................................................................... 23
3.3 Simulation and Implementation of the Vehicle on Flight Simulator Software 26
3.4 Development and Implementation of the Virtual Cockpit and Remote Pilot
Station ...................................................................................................................... 31
3.4.1 Instruments ................................................................................................... 32
Flight Instruments.................................................................................. 32
Navigation Instruments......................................................................... 33
Engine Instruments ............................................................................... 33
3.4.2 Glass Cockpit................................................................................................. 34
3.4.3 Remote Pilot Station (RPS)........................................................................... 37
3.4.4 Implementation ............................................................................................ 42
3.5 Conclusion ....................................................................................................... 45
Case Study II: Operator’s Training Programme for URBLOG ..................... 47
4.1 Introduction ......................................................................................................47
4.2 Training Programme Development and Process ...........................................47
4.3 Human In the Loop (HITL) Study ................................................................. 49
4.3.1 Setup .............................................................................................................. 50
4.3.2 Pilot Questionnaire ....................................................................................... 50
4.3.3 Mission and Tasks .........................................................................................53
4.3.4 Data Collection and Mission Accomplishment Definition ........................ 56
4.3.5 Post Flight Questionnaire ............................................................................. 57
4.3.6 Data Analysis ................................................................................................ 58

xxiii
Flight Comparison ................................................................................. 63
Task Comparison ................................................................................... 72
4.3.7 Results ........................................................................................................... 87
4.4 Conclusions ...................................................................................................... 88
Conclusions ....................................................................................................... 91
5.1 Dissertation Synthesis ...................................................................................... 91
5.2 Concluding Remarks ....................................................................................... 93
5.3 Prospects for Future Work .............................................................................. 93
References............................................................................................................................ 95
Appendix A - URBLOG OPERATING MANUAL Version 1.0 ......................................... 101
Appendix B - Flight Comparison Data ..............................................................................123
Appendix C - Task Comparison Data ................................................................................ 135
Appendix D - Outputs ........................................................................................................ 157

xxiv

xxv
List of Figures
Figure 1.1 - Methodology Overview ........................................................................................... 3
Figure 2.1 - Airbus A350 Iron-Bird ........................................................................................... 6
Figure 2.2 - Virtual techniques in the development of the Airbus A380 ................................7
Figure 2.3 - Training Devices, Present to Future ..................................................................... 8
Figure 2.4 - Systems on an FFS ................................................................................................. 9
Figure 2.5 - A320 Full Flight Simulator (FFS), outside (left), and inside (right) ................ 10
Figure 2.6 - PCATD by ELITE Company ................................................................................. 12
Figure 2.7 - Zeppelin’s Flight Instruments .............................................................................. 13
Figure 2.8 - Zeppelin’s Glass Cockpit ...................................................................................... 14
Figure 2.9 - Remote Pilot Station prototype with a panoramic screen ................................. 15
Figure 2.10 - Portable Ground Station by UAV Factory ......................................................... 16
Figure 2.11 - Advanced Cockpit Ground Control Station (GCS) ............................................ 16
Figure 2.12 - RPS Solution developed by Airbus .................................................................... 16
Figure 2.13 - ParagonC2 developed by S-Plane ...................................................................... 17
Figure 2.14 - Remote Pilot Responsibilities ........................................................................... 20
Figure 3.1 - URBLOG Proposed Design .................................................................................. 24
Figure 3.2 - URBLOG Views .................................................................................................... 25
Figure 3.3 - URBLOG 3D Model View .................................................................................... 26
Figure 3.4 - URBLOG Simulation outline .............................................................................. 30
Figure 3.5 – URBLOG on P3D Software ................................................................................. 31
Figure 3.6 - Attitude Indicator (or Artificial Horizon), in several indications..................... 32
Figure 3.7 - Traditional Six Pack ............................................................................................. 33
Figure 3.8 - Glass Cockpit........................................................................................................ 34
Figure 3.9 - Analogue Gauges related to PFD instruments................................................... 35
Figure 3.10 - PFD ..................................................................................................................... 36
Figure 3.11 - Cockpit Display Content..................................................................................... 37
Figure 3.12 - HUD .................................................................................................................... 39
Figure 3.13 - Schematic of the URBLOG Remote Pilot Station Synthetic Environment ..... 41
Figure 3.14 - Layout ................................................................................................................. 44
Figure 3.15 - Physical Setup..................................................................................................... 44
Figure 4.1 - Mission Gates ....................................................................................................... 53
Figure 4.2 - Sim Director URBLOG Mission Overview ......................................................... 55
Figure 4.3 - Mission Scenario .................................................................................................. 56
Figure 4.4 - Operator 1 missions comparison and median values of vertical speed ........... 63
Figure 4.5 - Operator 1 missions comparison and median values of indicated airspeed .... 64

xxvi
Figure 4.6 - Operator 1 missions comparison and median values of altitude ..................... 65
Figure 4.7 - Operator 1 missions comparison and median values of pitch angle ................ 65
Figure 4.8 - Operator 1 missions comparison and median values of magnetic heading .... 66
Figure 4.9 - Operator 1 missions comparison and median values of bank angle ................ 67
Figure 4.10 - Operator 1 missions comparison and median values of lever position .......... 67
Figure 4.11 - Comparison of vertical speed median values for all operators ....................... 68
Figure 4.12 - Comparison of airspeed median values for all operators ................................ 69
Figure 4.13 - Comparison of altitude median values for all operators ................................. 69
Figure 4.14 - Comparison of pitch angle median values for all operators ........................... 70
Figure 4.15 - Comparison of bank angle median values for all operators ............................. 71
Figure 4.16 - Comparison of magnetic heading median values for all operators ................. 71
Figure 4.17 - Comparison of lever position median values for all operators ....................... 72
Figure 4.18 - Operator 1 missions comparison and median values of vertical speed per task
................................................................................................................................................... 74
Figure 4.19 - Operator 1 missions comparison and median values of indicated airspeed per
task ............................................................................................................................................ 74
Figure 4.20 - Operator 1 missions comparison and median values of altitude per task ...... 75
Figure 4.21 - Operator 1 missions comparison and median values of pitch angle per task . 75
Figure 4.22 - Operator 1 missions comparison and median values of bank angle per task 76
Figure 4.23 - Operator 1 missions comparison and median values of magnetic heading per
task ............................................................................................................................................ 76
Figure 4.24 - Operator 1 missions comparison and median values of lever position per task
.................................................................................................................................................... 77
Figure 4.25 - Operator X vs Operator 1 missions comparison and standard deviation
values of vertical speed per task .............................................................................................. 78
Figure 4.26 - Operator X vs Operator 1 missions comparison and standard deviation
values of indicated airspeed per task ...................................................................................... 78
Figure 4.27 - Operator X vs Operator 1 missions comparison and standard deviation
values of altitude per task ........................................................................................................ 79
Figure 4.28 - Operator X vs Operator 1 missions comparison and standard deviation
values of pitch angle per task .................................................................................................. 80
Figure 4.29 - Operator X vs Operator 1 missions comparison and standard deviation
values of bank angle per task .................................................................................................. 80
Figure 4.30 - Operator X vs Operator 1 missions comparison and standard deviation
values of magnetic heading per task ........................................................................................ 81
Figure 4.31 - Operator X vs Operator 1 missions comparison and standard deviation values
of lever position per task ......................................................................................................... 82

xxvii
Figure 4.32 - Comparison of vertical speed median values for all Operators per task ....... 83
Figure 4.33 - Comparison of airspeed median values for all Operators per task ................ 83
Figure 4.34 - Comparison of altitude median values for all Operators per task ................. 84
Figure 4.35 - Comparison of pitch angle median values for all Operators per task ............ 85
Figure 4.36 - Comparison of bank angle median values for all Operators per task ............ 85
Figure 4.37 - Comparison of magnetic heading median values for all Operators per task . 86
Figure 4.38 - Comparison of lever position median values for all Operators per task ....... 86
Figure A.1 - Panels.................................................................................................................. 106
Figure A.2 - URBLOG’s PFD and MFD .................................................................................107
Figure A.3 - URBLOG’s HUD ..................................................................................................111
Figure A.4 - HUD Activation Button ..................................................................................... 112
Figure A.5 - Setup .................................................................................................................... 113
Figure A.6 - Joystick and Throttle Inputs ............................................................................. 113
Figure A.7 - OTW View Inputs ............................................................................................... 114
Figure A.8 - Tracking Curves Configuration ......................................................................... 119
Figure A.9 - Green Square as Mission Gate.......................................................................... 120
Figure A.10 - Position of the Next Gate ................................................................................ 120
Figure A.11 - Mission Route ....................................................................................................122
Figure B.1- Operator 2 missions comparison and median values of vertical speed ...........123
Figure B.2 - Operator 2 missions comparison and median values of indicated airspeed ..124
Figure B.3 - Operator 2 missions comparison and median values of altitude ....................124
Figure B.4 - Operator 2 missions comparison and median values of pitch angle .............. 125
Figure B.5 - Operator 2 missions comparison and median values of bank angle ..............126
Figure B.6 - Operator 2 missions comparison and median values of magnetic heading ...126
Figure B.7 - Operator 2 missions comparison and median values of lever position .......... 127
Figure B.8 - Operator 3 missions comparison and median values of vertical speed ......... 127
Figure B.9 - Operator 3 missions comparison and median values of indicated airspeed . 128
Figure B.10 - Operator 3 missions comparison and median values of altitude ................. 128
Figure B.11 - Operator 3 missions comparison and median values of pitch angle .............129
Figure B.12 - Operator 3 missions comparison and median values of bank angle ............ 130
Figure B.13 - Operator 3 missions comparison and median values of magnetic heading 130
Figure B.14 - Operator 3 missions comparison and median values of lever position ........ 131
Figure B.15 - Operator X missions comparison and median values of vertical speed ....... 131
Figure B.16 - Operator X missions comparison and median values of indicated airspeed132
Figure B.17 - Operator X missions comparison and median values of altitude ..................132
Figure B.18 - Operator X missions comparison and median values of pitch angle ............ 133
Figure B.19 - Operator X missions comparison and median values of bank angle ............ 133

xxviii
Figure B.20 - Operator X missions comparison and median values of magnetic heading 134
Figure B.21 - Operator X missions comparison and median values of lever position ....... 134
Figure C.1 - Operator 2 missions comparison and median values of vertical speed per task
.................................................................................................................................................. 135
Figure C.2 - Operator 2 missions comparison and median values of indicated airspeed per
task ........................................................................................................................................... 135
Figure C.3 - Operator 2 missions comparison and median values of altitude per task ..... 136
Figure C.4 - Operator 2 missions comparison and median values of pitch angle per task 136
Figure C.5 - Operator 2 missions comparison and median values of bank angle per task 137
Figure C.6 - Operator 2 missions comparison and median values of magnetic heading per
task ........................................................................................................................................... 137
Figure C.7 - Operator 2 missions comparison and median values of lever position per task
..................................................................................................................................................138
Figure C.8 - Operator 3 missions comparison and median values of vertical speed per task
..................................................................................................................................................138
Figure C.9 - Operator 3 missions comparison and median values of indicated airspeed per
task ........................................................................................................................................... 139
Figure C.10 - Operator 3 missions comparison and median values of altitude per task ... 139
Figure C.11 - Operator 3 missions comparison and median values of pitch angle per task
................................................................................................................................................. 140
Figure C.12 - Operator 3 missions comparison and median values of bank angle per task
................................................................................................................................................. 140
Figure C.13 - Operator 3 missions comparison and median values of magnetic heading per
task ........................................................................................................................................... 141
Figure C.14 - Operator 3 missions comparison and median values of lever position per task
.................................................................................................................................................. 141
Figure C.15 - Operator X missions comparison and median values of vertical speed per
task ........................................................................................................................................... 142
Figure C.16 - Operator X missions comparison and median values of indicated airspeed
per task..................................................................................................................................... 142
Figure C.17 - Operator X missions comparison and median values of altitude per task ... 143
Figure C.18 - Operator X missions comparison and median values of pitch angle per task
.................................................................................................................................................. 143
Figure C.19 - Operator X missions comparison and median values of bank angle per task
.................................................................................................................................................. 144
Figure C.20 - Operator X missions comparison and median values of magnetic heading
per task..................................................................................................................................... 144

xxix
Figure C.21 - Operator X missions comparison and median values of lever position per
task ........................................................................................................................................... 145
Figure C.22 - Operator X vs Operator 2 missions comparison and standard deviation
values of vertical speed per task ............................................................................................. 145
Figure C.23 - Operator X vs Operator 2 missions comparison and standard deviation
values of indicated airspeed per task .................................................................................... 146
Figure C.24 - Operator X vs Operator 2 missions comparison and standard deviation
values of altitude per task ....................................................................................................... 147
Figure C.25 - Operator X vs Operator 2 missions comparison and standard deviation
values of pitch angle per task ................................................................................................. 147
Figure C.26 - Operator X vs Operator 2 missions comparison and standard deviation
values of bank angle per task................................................................................................. 148
Figure C.27 - Operator X vs Operator 2 missions comparison and standard deviation
values of magnetic heading per task ..................................................................................... 149
Figure C.28 - Operator X vs Operator 2 missions comparison and standard deviation
values of lever position per task ............................................................................................ 150
Figure C.29 - Operator X vs Operator 3 missions comparison and standard deviation
values of vertical speed per task ............................................................................................ 150
Figure C.30 - Operator X vs Operator 3 missions comparison and standard deviation
values of indicated airspeed per task ..................................................................................... 151
Figure C.31 - Operator X vs Operator 3 missions comparison and standard deviation
values of altitude per task ....................................................................................................... 152
Figure C.32 - Operator X vs Operator 3 missions comparison and standard deviation
values of pitch angle per task ................................................................................................. 152
Figure C.33 - Operator X vs Operator 3 missions comparison and standard deviation
values of bank angle per task.................................................................................................. 153
Figure C.34 - Operator X vs Operator 3 missions comparison and standard deviation
values of magnetic heading per task ...................................................................................... 154
Figure C.35 - Operator X vs Operator 3 missions comparison and standard deviation
values of lever position per task ............................................................................................. 154

xxx

xxxi
List of Tables
Table 2.1 - Qualification levels of Flight Simulation Training Devices (FSTDs) according to
ICAO 9625 ................................................................................................................................. 11
Table 3.1 - Dimensions of the smaller version of URBLOG .................................................. 24
Table 4.1 - Pilot Questionnaire ................................................................................................ 52
Table 4.2 - Mission Tasks ........................................................................................................ 54
Table 4.3 - Post Flight Questionnaire Answers ...................................................................... 58
Table 4.4 - Flight Times Recorded .......................................................................................... 59
Table 4.5 - Flight Routes Recorded for Operator 1 ................................................................ 59
Table 4.6 - Flight Routes Recorded for Operator 2 ............................................................... 60
Table 4.7 - Flight Routes Recorded for Operator 3 ............................................................... 60
Table 4.8 - Flight Routes Recorded for Operator X ............................................................... 60
Table 4.9 - Number of Representative Instances per Task ................................................... 73
Table 4.10 - Gate Position ........................................................................................................ 73
Table 4.11 - Mission Success per Operator and per Attempt ................................................ 87
Table 4.12 - Flight Stabilization per Operator and per Attempt ........................................... 87
Table 4.13 - Standard Deviation Maximum per Variable and per Operator in relation to
Operator X ................................................................................................................................ 88
Table A.1 - URBLOG Specifications ...................................................................................... 104
Table A.2 - Normal Procedures .............................................................................................. 115
Table A.3 - Mission Outline .................................................................................................... 121

xxxii

xxxiii
List of Acronyms
AGL - Above Ground Level
ANAC - Autoridade Nacional da Aviação Civil
ATC - Air Traffic Control
ATD - Aviation Training Devices
ATO - Approved Training Organization
BITD - Basic Instrument Training Device
CAD - Computer-Aided Design
CFD - Computational Fluid Dynamics
CG - Center of Gravity
COTS - Commercial Off-The-Shelf
COVID19 - Coronavirus Disease 2019
CPU - Central Process Unit
CRM - Crew Resource Management
CS-FSTD(A) - Certification Specification Aeroplane Flight Simulation Training Devices
DG -Directional Gyro
DME - Distance Measurement Equipment
DOF - Degrees of Freedom
EASA - European Aviation Safety Agency
FAA - Federal Aviation Administration
FCOM - Flight Crew Operation Manual
FCTM - Flight Crew Techniques Manual
FFS - Full Flight Simulator
FNPT - Flight and Navigation Procedures Trainer
FSQAR - Flight Simulator Quick Access Recorder and Analyzer
FSTD - Flight Simulation Training Devices
FSX - Flight Simulator X
FTD - Flight Training Device
GA - General Aviation
GCS - Ground Control Station
GPS - Global Positioning System
HF - Human Factors
HITL - Human In the Loop
HMI - Human Machine Interface
HP - Human Performance
HUD - Head-Up Display

xxxiv
IAS - Indicated Airspeed
ICAO - International Civil Aviation Organization
ILS - Instrument Landing System
IVAO - International Virtual Aviation organization
IWG - International Working Group
JAA - Joint Aviation Authorities
KIAS - Knots-Indicated Air Speed
LCD - Liquid-Crystal Display
LTA - Lighter than Air
MFD - Multifunction Display
NAA - National Aviation Authority
NASA - National Aeronautics and Space Administration
NAV1 - Radio Navigation Receiver 1
OAT - Outside Air Temperature
OBS - Omnidirectional Bearing Selector
OTW - Out-The-Window
PC - Personal Computer
PCATD - Personal Computer-Based Aviation Training Device
PF - Pilot Flying
PFD - Primary Flight Display
PM - Pilot Monitoring
RAeS FSG - Royal Aeronautical Society Flight Simulation Group
RPA - Remotely Piloted Aircraft
RPAS - Remotely Piloted Aircraft Systems
RPS - Remote Pilot Stations
SOPs - Standard Operating Procedures
SPD - Speed
SSD - Solid State Drive
UA - Unmanned Aircraft
UAV - Unmanned Aircraft Vehicle
VOR - Very high-frequency Omnidirectional Range
VR - Virtual Reality
VRAM - Virtual Random-Access Memory
VTOL - Vertical Takeoff and Landing
ZFTT - Zero Flight Time Training

xxxv

xxxvi

1
Introduction
1.1 Motivation
The Aeronautical industry is growing as the number of air passengers increases year by year
and new ideas for transportation appear. With more eco-friendly and cutting-edge
technology, different types of aerospace vehicles are now developed and subjected to
accurate studies. Ideas from the past, are now reinvented with new objectives. Mainly used
at the beginning of Aviation, airships are now studied, and projects are being carried further
to enhance their flight capabilities.
Airships predate traditional aircraft by 50 years and were found most useful in the 1920’s
and 1930’s. Its speed, cutting the travel time with luxurious cabins, where passengers could
enjoy fine meals but also combining aerodynamic and aerostatic lift characteristics given by
the buoyancy provided by a lighter than air gas, made them a preferable mean of
transportation for long distances. With the improvements of fixed-wing aircraft, that
evolved to a fast, efficient, and cheaper transportation, together with unfortunate accidents
like the Hindenburg disaster, the airship technology became obsolete. But, by combining
the traditional concept of an Airship with nowadays technology, new propulsion systems to
increase its lifting capabilities, new materials and new avionics, a new opportunity for this
type of aircraft is now possible. With operational advantages like hovering and vertical
takeoff and landing (VTOL) operation, with consequent reduced ground support and
facilities, airships can provide a reduced transport time, particularly relevant in urban areas,
often with ground transportation constraints [1].
With the emergent necessity of finding new solutions for mobility issues in urban areas, an
airship project was born in 2014 in Covilhã, Portugal. Then called URBLOG project, it
evolved to a Multifunctional Air Transport System, subject to national (PT 108532 A) [2]
and international patent (WO 2016/195520 A) [3]. This airship, named URBLOG,
combines the concept of the traditional airfoil and buoyancy of this type of vehicles with
rotorcraft technology applied in its control surfaces, becoming a hybrid system that can
perform hovering and VTOL operations. This type of airship, characterized by its ability to
land and takeoff without a ground crew of rope-holders, reduces the ground support and
consequently the flight duration. This can lead to vast applications, including air
surveillance and cargo transportation. Within such a project, it is intrinsic to the application
of simulation in several stages. Why Simulation? The industry is constantly developing
products and those products require designing and testing. With modelling and simulation

2
lower development cost, it is possible to design, test and validate the product, improving its
time to market. Development of a flight simulation training device for a new aircraft enables
then the validation and verification of concepts, optimizing cockpit designs and
furthermore, the development and enhancement of flying techniques. Flight simulator
software together with a physical reproduction of the designed cockpit, flight simulation
training device, can be used for flight training. These devices have dramatically reduced the
cost of training by providing cheaper, effective alternatives to training on a real aircraft.
1.2 Object and Objectives
Considering an unmanned 8.5 meters long airship prototype in development, the URBLOG
of the Multifunctional Air Transport System, the main object of this dissertation will be the
development and implementation of this airship model on flight simulator software where
the purpose and characteristics of the vehicle are represented, which will allow the
development of a flight simulation training device (FSTD). By being a remotely piloted
aircraft (RPA), part of a Remotely Piloted Aircraft System (RPAS), this FSTD will be, not
only relevant on system’s testing, cockpit design and operator training, but it can also be
further used as part of the Remote Pilot Station (RPS) once the vehicle is produced.
Therefore, this work will have two specific objectives. The first will be the implementation
of the airship on flight simulator software, leading to the definition of its virtual cockpit and
the setup of a FSTD that can be further used as part of the remote pilot station (RPS). This
study will take in consideration the current software that is necessary to simulate the airship
reflecting its purpose, the cockpit layout and instruments needed, the several types of
simulation fidelity, lessons learned from other systems and the human factors applicable in
cockpit and RPS design. The second objective is the development of the operator’s training
programme. A basic self-study training programme curriculum will be developed to train
the operator to fly the simulated URBLOG in such RPS. A human in the loop (HITL) study
will be developed to assess and obtain feedback from test users to verify and validate the
training programme and the RPS. Nevertheless, on both objectives, the focus will be the
system’s operability from the operator’s point of view, considering design-related human
factors (HFs) errors that may lead or contribute to an accident or incident.
1.3 Methodology
To develop a system, the task should be divided into several steps, which will progressively
fulfil all its requirements. But to establish those, the main objective shall be identified so a

3
practical solution can be found and be taken into consideration in every step. In this case,
where a new type of vehicle is in development, the requirements are not well defined.
Experience and requirements of previous vehicles, including what failed shall be taken into
consideration. To be manageable, complex problems must be broken into parts and
incrementally addressed. Any change in a system can have extensive implications, and a
control station must assure continued adequate situational awareness for crews, so the
vehicle is properly and safely controlled. The design should be human-centred to the extent
possible. Thus, for this system to be implemented, a broken-down structure will be followed
so all the constraints and requirements for each step are put into consideration in Figure
1.1.
Figure 1.1 - Methodology Overview
1.4 Dissertation Structure
This dissertation is divided into five chapters.
URBLOG Remote Pilot Station and
Flight Simulation Training Device
Operator’s Training Programme for URBLOG
Human in the Loop Test Verification and Validation
Development of the Virtual Cockpit and Remote Pilot Station
Requirements and Constrains Previous Experiences
Simulation and Implementation on Flight Simulation Software
Requirements and Constrains
URBLOG Vehicle Specifications

4
The first chapter is the work Introduction and presents the motivation, the main object and
the specific objectives, the methodology and the dissertation structure that will be followed.
In chapter two a state-of-the-art review concerning flight simulation and flight simulation
training devices, including how they are defined and regulated by civil authorities. Secondly,
an overview regarding Remotely Piloted Aircraft Systems (RPAS), Remote Pilot Stations
(RPS) of these systems and the operator’s training, including Human Factors aspects
relevant to these systems, are performed. The URBLOG is then contextualized as part of a
RPAS.
The third chapter includes the implementation of the airship on flight simulator software
realised according to its purpose. Processes are described and the software’s strengths and
limitations are explained to support final choices. Flight instruments required are analysed,
as well as the hardware interfaces necessary. It concludes with the interfaces chosen and the
layout to be implemented in the RPS.
Chapter four consists of the development of the training programme that will provide the
procedures to fly the simulated vehicle in the virtual cockpit layout implemented and in the
RPS setup defined. This will consist of validation and verification via human in the loop
(HITL) studies by the completion of a virtual mission also developed on the flight simulator
software. The test subjects will be inquired before and after the mission, and their
performance will be recorded. From this recording, an analysis will be made. The study
conclusions will be considered and if possible, implemented in the system.
The fifth chapter is the work conclusions and presents the dissertation synthesis, a few
concluding remarks, and some insights and challenges for future research.

5
State of the Art
2.1 Introduction
Towards the development of a new concept, it is necessary to contextualise the objectives of
that particular study with what had been already developed in that field.
This chapter will firstly focus on a broad vision of Systems Modelling and Simulation, and
then on a literature review of Flight Simulation and Flight Simulation Devices. On a
different topic, the most recent airship’s cockpits will be analysed as well Remotely Pilot
Aircraft Systems (RPAS), in order to define Remote Pilot Stations (RPS), Remote Pilot
Licensing and Training and related Human Factors in this type of devices. The conclusion
of the chapter will associate the different topics towards the main objectives of this
dissertation.
2.2 Systems Modelling and Simulation
When building a new product or finding a solution to a problem, the resolution is supported
by a set of elements grouped for a particular reason to achieve a certain objective. This
comprises elements and its interconnections, limited by a boundary, which consists of a
system. A model will represent the characteristics or behaviours of that system. To
implement the final product, Simulation appears as the operation of the system over time,
by testing and validating its model, improving its time to market.
The simulation was first applied in the Industrial field through mathematical models to
verify and improve either their products or their method of production. During World War
II, with the appearance of the first computers, it was particularly used to design and develop
the hydrogen bomb. Since then, simulation has been evolving as fast as technology and is a
very important tool of management, design, engineering, and training in different kind of
fields. Nevertheless, it is important to understand the capabilities and limitations of the
simulated model, on the premise that it is necessary to evaluate the level of reliability that
is required to achieve the correct balance between fidelity and cost before the
implementation of the simulation. Fidelity is the degree to which a model or simulation
reproduces the state and behaviour of the real world. It is the measure of the realism of a
model or simulation. Simulators are then the hardware or software response to simulate a
certain environmental or conditions with the purposes of training or experimentation.
Design parameters can be changed quickly and easily while running repeated tests and any

6
dynamic physical system can be modelled mathematically. Virtual physical values can be
tweaked while performance is tested [4].
2.3 Flight Simulation and Flight Simulation Devices
Simulation has made a major contribution to the Aeronautical sector. From being applied
to Aeronautical engineering to flight training, flight simulation is today a field of aviation.
Aeronautical engineering uses simulation mainly to design and evaluate aircraft systems,
allowing a full reproduction of the designed aircraft on flight simulator software. This will
not only confirm any design problem, but it will also allow manoeuvring studies to verify
the flying capabilities. Applying modern technology carefully and scientifically, together
with incorporating human-factors evaluations in the early stages of development, on virtual
systems, using qualified pilots for the intended use will provide valuable insights [4].
Towards the certification of systems in the development of a new aircraft, flight simulator
software and hardware can be combined with a full-scale reproduction or even actual
onboard systems of electrics, hydraulics, flight controls and many others in a giant test rig
named Iron-Bird, shown on Figure 2.1.
Figure 2.1 - Airbus A350 Iron-Bird [5]
Advanced flight training devices offer advanced high-fidelity performance, thus the results
of this simulation where several flight conditions are tested are essential to test and validate
the aircraft’s systems. For example, for Airbus, even in the age of advanced computer
simulations, the Iron Bird maintains a vital role in their testing protocols. Every Airbus
aircraft has Iron-Bird as its precursor [5] and several virtual techniques are applied until
the final aircraft implementation and its test flight, as seen below on Figure 2.2 for the
Airbus A380.

7
Figure 2.2 - Virtual techniques in the development of the Airbus A380 [5]
2.3.1 Flight Simulation Training Devices
For training purposes, Flight Training Devices (FTD) or Flight Simulation Training Devices
(FSTD), are a type of synthetic training devices or environments that allow the visualization
and immersion of the environment being simulated. FSTDs appear as a combination of
flight simulator software together with a partial or integral physical reproduction of the
designed cockpit to be used for flight training.
According to the European Union Aviation Safety Agency (EASA), “FSTDs represent a state-
of-the-art pilot training tool which is capable of representing almost any flight and
environmental condition. This allows pilots to be trained in very realistic scenarios without
compromising safety and ensuring the economic efficiency of the training. (…) Currently,
more than 450 FSTDs are qualified by EASA ranging from basic flight procedure trainer
(flight and navigation procedures trainer (FNPT)) up to full flight simulator (Level D FFS)
under the EASA oversight” [6:05].
Like every activity in the Aeronautical sector, flight training is strictly regulated, especially
when it comes to FSTDs. The National Aviation Authorities and each airline that uses this
type of devices must ensure that all FSTDs meet certain standards. Differences between
each country have been translated to different regulation, and although a process of
combining standards, the major Aviation Authorities, US Federal Aviation Administration

8
(FAA) and the European Joint Aviation Authorities (JAA) - now EASA - ended using
different terms for similar FSTDs.
In March 2006, the Royal Aeronautical Society Flight Simulation Group (RAeS FSG)
established an International Working Group (IWG) intending to harmonize flight
simulation regulation. The results of the IWG meetings was the development of new
qualification criteria for the complete suite of Flight Simulation Training Devices (FSTD).
This new classification covers the 26 types of Training Devices to 7 types of devices as shown
in Figure 2.3.
Figure 2.3 - Training Devices, Present to Future [7]
The classification mentioned above was published in ICAO Doc 9625 Manual of Criteria
for the Qualification of Flight Simulation Training Devices Volume 1 - Aeroplanes, Third
Edition published in July 2009 [7].
Although many efforts are being conducted, not every authority has adopted these
standards. In 2015, the 4th edition of ICAO doc 9625 was released [8].

9
2.3.2 Flight Simulation Training Devices according to CS-FSTD(A)
Regulation
According to the Certification Specifications for Aeroplane Flight Simulation Training
Devices (CS-FSTD(A)) [9], the FSTD are divided by level of fidelity. The Portuguese
Aeronautical Authority, Autoridade Nacional da Aviação Civil (ANAC) complies with this
regulation [10], that states the following:
Full Flight Simulator (FFS)
An FFS is a full-size replica of a specific type or make, model and series aeroplane flight
deck, including the assemblage of all equipment and computer programs necessary to
represent the aeroplane in ground and flight operations, a visual system providing an out of
the flight deck view, and a force cueing motion system. Below, in Figure 2.4, is shown the
several systems implemented on an FFS.
Figure 2.4 - Systems on an FFS [11]
This type of simulator is used to qualify pilots in Type-Rating of a specific aircraft like Airbus
A320 or Boeing 737. In this type of FSTD, a pilot can fly a new type of aircraft without having
flown that aircraft in real World (Zero Flight Time Training (ZFTT)) and train upset
situations. It has four levels of fidelity A, B, C and D, where A has the lowest capabilities and

10
the D has the highest level of fidelity which includes a motion system with six degrees of
freedom, providing effects like turbulence, wind shear, engine failure and other abnormal
situations [11]. As an example, below in Figure 2.5, one FFS for the Airbus A320 model it is
shown.
Figure 2.5 - A320 Full Flight Simulator (FFS), outside (left), and inside (right) [12]
Flight Training Device (FTD)
A full-size replica of a specific aeroplane type’s instruments, equipment, panels and controls
in an open flight deck area or an enclosed aeroplane flight deck, including the assemblage
of equipment and computer software necessary to represent the aeroplane in ground and
flight conditions to the extent of the systems installed in the device [11].
Flight and Navigation Procedures Trainer (FNPT)
A training device which represents the flight deck or cockpit environment including the
assemblage of equipment and computer programs necessary to represent an aircraft or its
in-flight operations to the extent that the systems appear to function as in the aircraft [11].
Basic Instrument Training Device (BITD)
A ground-based training device which represents the student pilot‘s station of a class of
aeroplanes. It may use screen-based instrument panels and spring-loaded flight controls,
providing a training platform for at least the procedural aspects of instrument flight. This
type of classification is primarily used by EASA. In FAA this type of device can be classified
as Basic Aviation Training Device (ATD) or Advanced ATD [11].

11
2.3.3 Flight Simulation Training Devices Classification according to
ICAO Qualification Levels
The qualifications referred in the ICAO Doc. 9625 “Manual of Criteria for the Qualification
of Flight Simulation Training Devices” Volume I, Aeroplanes and Volume II Helicopters
divide the FSTD into seven categories, as in Table 2.1, with a fidelity level defining its type.
Table 2.1 - Qualification levels of Flight Simulation Training Devices (FSTDs) according to ICAO 9625 [11]
Type of FSTD
Characteristics of requirements
I
The first level would contain an enclosed or perceived cockpit/flight deck, excluding distraction, which will represent that of the aeroplane derived from, and appropriate to class, to support the approved use; lighting environment for panels and instruments should be sufficient for the operation being conducted; modelling of aerodynamics and engines (thrust, temperature, mass); aircraft systems; sound system; visual system. The ATC environment simulation is not required.
II Meets the same requirements as of 1st level, but also to include the simulation of ATC environment as messages, visual environment, airport movements, weather reports and others.
III Meets the previous requirements, but also uses, for example, the simulation of runway condition, including information on pavement condition (wet, dry). The ATC environment simulation is not required.
IV This level meets the same requirements as previous levels. It is added for example on ATC environment simulation; sounds of outside environment (weather, meteoric water); voice control.
V
This level meets the same requirements as level IV, but is added for example on runway conditions simulation (dry, wet, icings, water holes); aircraft systems simulation (communication, navigation, warning device); dynamic feeling of control; failure of brakes dynamics and tires; degradation of brakes efficiency.
VI
This level meets the same requirements as level V, but is added for example on ATC extended environment simulation; the motion system includes the acceleration feeling, Buffet in the air due to flap and spoiler/speed brake extension; Buffet due to atmospheric disturbances, e.g. turbulence in three linear axes (isotropic), In-flight vibrations A motion system (force cueing) should produce cues at least equivalent to those of a 6 DOF platform motion system (i.e., pitch, roll, yaw, heave, sway, and surge). Weather environment contains e.g. simulation of turbulence.
VII The highest approved level. It has to meet all previous requirements with their details and authentic realization as in the real aircraft.
2.3.4 Flight Simulation Training Devices Classification according to
FAA
The FAA categorizes aviation ground trainers into categories as full flight simulators or as
flight training devices, in similarity to what is defined by both EASA and ICAO.

12
Nevertheless, they implemented the aviation training devices (ATDs). As a result of the
continuing development in computer technology, flight simulation and visual displays, it
led to the popular use of FSTDs and ATDs in General Aviation (GA). The GA community is
using this evolving simulation technology to provide increasingly effective pilot training at
a reduced cost. These devices can provide an adequate training platform for both procedural
and operational performance tasks specific to the ground and flight training requirements
for several pilot certificates, depending on their certification. This type of device is called
Personal Computer-Based Aviation Training Device (PCATD).
The PCATD consists of three main parts, as seen in Figure 2.6: the PCATD software which
provides a partial or comprehensive flight simulation environment on screen; the approved
flight controls configuration; and a Personal Computer (PCATD Hardware). It is important
to refer that for that certification; the FAA must certify all the number of parts.
Figure 2.6 - PCATD by ELITE Company [13]
These devices are a viable alternative for flight schools wishing to use a flight simulation
training device but are not able to afford a more advanced FSTD. PCATDs can provide a
controllable environment where the pilot can train and review its performance instantly, by
either pausing the equipment or by recording its training. The flight situation can be easily
changed, with no risks associated. Flight instructors can effectively teach many operational
skills (e.g., instrument flying, traffic patterns, stabilized approaches, emergency procedures,
etc.) using ATDs. These procedural and operational skills can then be positively transferred
to successful operations in the real aircraft [14].
PC-based simulators can also be a valuable research tool, especially for the studies of human
factors and pilot performance, a platform for instrumentation testing and development of
new aircraft technologies, crew resource management (CRM) research, crew coordination
and training research [15].

13
In some cases, virtual reality (VR) devices are being associated with these training devices
to enhance the immersion of the simulation. Nevertheless, this implementation is yet to be
certified for flight training [16].
2.4 Airship Cockpits
Airship cockpits are similar to those of other manned air vehicles. A cockpit is composed of
several types of flight instruments and controls that enable the pilot to control the aircraft’s
attitude, performance and configuration. There is a control column (a yoke) or a joystick
that make possible the control of the vehicle, as well of throttles that control the engine’s
thrust. Other controls can be found as the landing gear level, controlling the landing gear
position, or the flaps handle, controlling the flaps position.
Nevertheless, airship control surfaces are generally very large aiming to provide good
control response due to its very low flying airspeeds. Combining this with the very long
control cables usually required, the forces applied by the pilot can be quite high. The use of
fly by wire systems, with electric action on the control surfaces, can improve the control
loads as well as possible delays in the response [17].
Recent airship cockpits, as the Zeppelin NT, are highly electronic, with digital glass cockpit
panels and fly by wire systems for assisted and precise control [18], as shown in Figure 2.7
and Figure 2.8.
Figure 2.7 - Zeppelin’s Flight Instruments [18]

14
Figure 2.8 - Zeppelin’s Glass Cockpit [18]
2.5 Remotely Piloted Aircraft System (RPAS)
A Remotely Piloted Aircraft System (RPAS) is according to ICAO, a remotely piloted aircraft
(RPA), associated with one or more remote pilot stations (RPS), together with the command
and control links associated and any additional subsystem necessary for that particular
system. In general, they are constituted by highly complex unmanned aircraft, piloted from
remote locations due to highly reliable communication links, by licensed aviation
professionals. The Convention on International Civil Aviation signed at Chicago on 7
December 1944 and amended by the ICAO, defined that any aircraft intended to be flown
without a pilot on board was a pilotless, unmanned aircraft. These aircraft include a broad
spectrum of devices, from meteorological balloons to RPAS. RPAS are subject to the same
requirements and certification standards as manned aircraft operating in an airspace. In
other words, RPAS are handled like manned aircraft. In similarity, its remotely piloted
aircraft (RPA) can be a fixed-wing or rotary-wing vehicle. Evolving rapidly, these systems
are creating a new industry, with large economic potential as they offer a vast range of
capabilities, where different types of technologies and designs can be applied, leading to
different operational concepts. They have demonstrated their importance in recent military
operations, particularly for surveillance and information gathering, but on the civil
applications as well. For infrastructure surveillance, firefighting, disaster or environmental
monitoring, as in border control and management, they have been proven as an important
tool. With the increase of use of these systems, standards are being developed and applied
to integrate them safely and efficiently in the highly regulated manned aircraft industry [19].

15
The URBLOG prototype studied in this dissertation is within the RPAS concept, being a
remotely piloted fixed-wing aircraft.
2.5.1 Remote Pilot Stations (RPS)
The remote pilot stations (RPS) consist of the equipment used to command, control and
monitor flight of a remotely piloted aircraft (RPA). According to ICAO, designs can range
from simple hand-held devices to complex, networked, multi-console configurations. The
RPS may be located inside or outside of a building and may be stationary or mobile
(installed in a vehicle/ship/aircraft). Whichever type, security, both physical and cyber,
must be assured. The RPA is only to be controlled from one RPS at a time, but for
international operations—especially those involving long haul flights—multiple, distributed
RPS may be employed. The European Defence Agency is now developing a programme
towards the standardisation of RPS, taking into account the EASA’s certified operations
category [19], [20].
RPS range from commercial off-the-shelf (COTS) laptops, to sophisticated purpose-built
interfaces housed in shelter trailers or control facilities. Although some RPS possess
aviation interfaces (such as joystick or sidestick controllers), most also include interfaces
based on consumer electronic devices such as screen-based displays, with pull-down menus
and “point-and-click” input devices [21]. Below, from Figure 2.9 to Figure 2.13, different
types of RPS are presented.
Figure 2.9 - Remote Pilot Station prototype with a panoramic screen [22]

16
Figure 2.10 - Portable Ground Station by UAV Factory [23]
Figure 2.11 - Advanced Cockpit Ground Control Station (GCS) [24]
Figure 2.12 - RPS Solution developed by Airbus [25]

17
Figure 2.13 - ParagonC2 developed by S-Plane [26]
2.5.2 Remote Pilot Licensing and Training
Being a remote pilot can require training and medical certification, as similar to the
requirements of a flying pilot license. Although in some countries, only flying zones are
regulated (as is the case for Portugal in civil aviation), in some others, remote pilots are
required to receive medical certification, complete training, and demonstrate competency
before being licensed to fly an RPA. The training requirements and degree of competency
required depend upon the complexity of the RPA being flown and the purpose of flight. All
remote pilots should possess knowledge of aviation rules, regulations, and procedures, as
well of radio-telephony in case of air operations in controlled airspace. Training is given at
an Approved Training Organization (ATO) and the National Aviation Authority (NAA)
where the RPS is located will issue, renew, or validate remote pilot licences for qualified
applicants. The holder of a remote pilot licence and associated ratings and endorsements
must not exercise the privileges beyond those issued and must maintain the validity of their
licence as required by the issuing authority (in similarity to other pilot licenses) [27].
2.6 Human Factors in Cockpits, Simulators and Remote
Pilot Aircraft Systems
With efficient pilot training, comes system familiarization. Nevertheless, no system is fail-
proof. There will always be mistakes, either by the system controller or within the system’s
design, which was created by a human. With the advances in technology, it is possible to

18
improve human performance to some extent with training and experience, but basic human
performance remains fixed. In the understanding of the human characteristics and
limitations, cockpit and control stations designs have been improved. The human factors
engineering principles define how Human-Machine Interaction (HMI) is conducted in a
particular system. HMI covers both physical and cognitive interface with the machine. In
aviation, this approach has been implemented from the very first steps, where it was
necessary to verify stick and rudder positioning and functioning arrangements. Nowadays,
it is much more complex, as pilots and aircraft operate near the limits of performance. The
pilots must react in ways that are dependent on memory and training for proper responses,
and aircraft are allowed small margins of error. Pilot workload has been managed by the
use of the newest products in advanced avionics and automation.
Automation can be defined as the execution by a machine agent (usually a computer) of a
function that was previously carried out by a human. Automation can either enhance or
diminish situational awareness, and there is a need for the designers, operators, and
management to understand the risks associated with its use. For automation to truly
enhance the task of a pilot, the design must be predictable, consistent, contextually correct,
and provide adequate feedback for the pilot to maintain situational awareness at all times
[21].
2.6.1 The Remote Pilot Aircraft Systems Case
RPAS are largely automated, nevertheless, they have generally experienced a higher
accident rate than manned aircraft. Many of these accidents appear to reflect the unique
human challenges associated with piloting an aircraft remotely, in combination with RPS
that were designed with insufficient regard for human factors engineering principles.
Widespread problems have been identified with control station interfaces. Examples
include error-provoking control placement, nonintuitive automation interfaces, reliance on
text displays, and complicated sequences of menu selection to perform minor or routine
tasks. Some of these problems may have been prevented had an existing regulation or
cockpit design principle been applied. In other cases, the design problem reflected emerging
issues unique to RPAS that are not covered by existing regulatory or advisory material [21].
While operating an aircraft remotely, where no motion sense is present, it is essential that
the pilot can clearly notice aircraft’s attitude within six-degrees of freedom of movement as
this movement is a function of pilot control inputs. All aural alerting and visual information
must be clear and concise, otherwise, the pilot’s senses can become overloaded with

19
information. The information must be displayed in a manner that avoids this overloading
condition.
In the case of RPAS, personnel tasked with initiating, managing, maintaining and operating
the RPAS must have sufficient information to make safe, accurate, and timely decisions to
take appropriate actions. They must be suitably qualified and experienced in performing
their duties. When necessary, remote pilots must be able to override or modify automated
functions, except where such actions cannot be executed safely due to immediacy of the
situation (such as an imminent collision avoidance manoeuvre) or where task complexity
makes human intervention unreasonable [19] [28] [29].
Error tolerant systems can recognize and correct inadvertent errors by the human operator,
and allow easy correction of mistakes. [21]
2.6.2 Responsibilities of the RPA Pilot and Associated Implications
The remote pilot of an RPA can be responsible for conventional aviation duties as also with
special challenges that RPAS represent. This can be monitoring and controlling the status
of radio links, control hand-offs, flight termination and guidelines to avoid a collision, both
with the ground and other aircraft. Since it is a single pilot operation, the role of Pilot Flying
(PF) and Pilot Monitoring (PM) are combined. Hence the need to monitor the flight profile,
flight instruments, fuel state, engines, radio, etc. constantly. The instrument scan must be
carried out very frequently, especially during departure and approach in order to monitor
the aircraft state and planned profile. Since it is a light aircraft environment, it requires
additional external notion and monitoring [30].
Figure 2.14 below includes most remote pilots’ responsibilities that shall be considered
while studying the HMI of an RPAS. These are divided into the three main principles of
decision making in flying: aviate, navigate and communicate.

20
Figure 2.14 - Remote Pilot Responsibilities [20]
The above responsibilities can be associated with several implications that lead to error. The
Human Factors Guidelines for Remotely Piloted Aircraft System Remote Pilot Stations’
document [21] define special considerations regarding its implications. In this dissertation,
it will be focused on human factors related implications, as below:
Loss of Natural Sensing
The loss of natural sensing is due to reduced awareness of the aircraft state as the pilot does
not have access to the rich sensory clues or sensations, as visual or auditory, making it more
difficult to the pilot to have awareness of the state of the aircraft or recognize his/her input.
In the absence of an out-the-window view, the pilot must rely on alternative sources of
information. Operations that may appear to be conducted identically to those performed by
manned aircraft, are often operated under significant limitations by the RPAS pilots. Text-
based displays are normally implemented on RPS intending to compensate for the lack of
sensory clues, but then it reduces the focus of the foveal vision. Heavy reliance on textual
information, complicated sequences of menu selection required to perform a task, and
screen displays that can be obscured behind pop-up windows or dialogue boxes can easily
be critical on a high workload phase. The pilots must be able to see and hear the information
relating to the monitoring tasks. Even if no sound from the remote vehicle is received, sound
from aural warnings shall be loudly heard.
21
The Unique Environment of the Remote Pilot Stations
The advanced RPS is likely to resemble an office rather than a cockpit. The physical
environment of the RPS, including noise levels, access controls, temperature control, and
lighting should be controlled and studied as it should be a comfortable work environment,
with intuitive operation. Nevertheless, the relative spaciousness of the RPS compared to a
traditional cockpit of manned aircraft enables additional screens to be added easily for
instance. The proliferation of information on several displays can affect the pilot’s
performance, in this way it is necessary to determine whether the addition of a display to
the RPS is, in fact, relevant and if operationality is compromised.
Reliance on Automation
Generally, on a conventional aircraft, automated systems control the aircraft’s movements
during most of the flight. Nevertheless, the pilot has the ability to turn-off or minimize the
use of the automated systems and apply manual control of the aircraft. Most advanced RPA
relies entirely on automated systems for basic flight control and do not provide options for
pilot manual control. Flying an RPA has some resemblance to the Pilot Monitoring
functions in a conventional aircraft. In the context of flight operations, monitoring is
defined as the observation and interpretation of the flight path data, configuration status,
automation modes and on-board systems appropriate to the phase of flight. It involves a
cognitive comparison against the expected values, modes, and procedures. As the RPA pilot
is most of the time monitoring the automation, makes it of critical management importance.
Widespread Use of Interfaces based on Consumer Products
Most RPS work with diverse commercial off the shelf devices (COTS), as keyboards, mouse,
and displays based on computer screens. These interfaces have not been designed according
to aviation regulations or standards. In some cases, the interfaces operate on consumer
computer software. By having this type of equipment, the RPS is likely to suffer from a lack
of consistency and other integration issues. This may result in increased crew training
requirements, reduced efficiency, and an increased potential for operator errors. The
similarity of either physical or virtual control can lead to delayed response or inadvertently
misuse. Levers or buttons of similar shape situated close to each other should be avoided,
by having a different appearance and mode of action. The seating position must be adjusted
to the eye position of the pilot, enabling the pilot to view the internal displays and controls
whilst maintaining an adequate view of the external conditions.

22
2.7 Conclusion
By using simulation, it is possible to have a system’s behaviour tested before it is built. This
avoids costly redesigning in case of possible errors that would otherwise only be found when
operating the system. It also allows training, developing, strengthening, and reinforcing
habits which are conducive to the increased safety of the operation, making it possible for
operators to incorporate these habits naturally when carrying out their daily work. Because
of that, flight simulation is used nowadays to teach, learn and research by the use of
synthetic environments like flight simulation training devices.
A flight simulator training device is economical when compared with the advantages it
provides: it allows the verification and testing of prototypes’ design, it is safer than training
on a real aircraft; it is cheaper to maintain and it can be used more frequently. With the
right devices, simulators allow the correct training and the instruction of recovery
techniques, with a decent amount of feelings without great risk. Depending on its fidelity, a
flight simulation training device does not necessarily require an extensive replication of a
certain aircraft. Believability can come exclusively from a visual system, completed with
basic hardware. Training can be adjusted to fit different skill levels, from beginner to
advanced. For verification and validation of new concepts, it can be adapted for different
types of virtual, physical, or procedural changes.
Technologies and innovations emerging in the aviation industry are noticeable on aerial
vehicles like airships and RPAS, with high levels of digitalisation and automation. RPAS,
where remotely piloted aircraft are controlled remotely by an operator, the controls range
from complex systems to commercial off the shelf interfaces. Mainly relying on automation
for the completion of their purposes, it can pose new questions on the interactions between
humans and automation. Operators shall manage the interfaces and interdependencies of
the system’s components having in consideration the total aviation system, being it the
RPAS and the surrounding environment. Thus, it is important to understand the remote
pilot responsibilities and major liabilities to train the operators accordingly while taking
into account the applicable human factors when designing a synthetic environment or a
RPS. As the URBLOG prototype studied in this dissertation is within the RPAS concept, the
concepts reviewed will be taken into consideration towards the objectives of this work.

23
Case Study I: Development of the
Synthetic Environment for URBLOG
3.1 Introduction
Once contextualized in the industry and academia, it is possible to start the development of
our particular case study, which is firstly the Development of the Synthetic Environment for
URBLOG.
In this chapter, the implementation of the airship on flight simulator software is realised
according to the airship purpose. Actions to achieve such are described and the software’s
strengths and limitations are explained to support a final choice. Instruments required for
a safe and controlled flight are analysed and selected, as well as the hardware necessary to
create a synthetic environment, in the form of a flight simulation device similar to a PCATD,
that can be further used in the remote pilot station. It culminates with the hardware
equipment chosen for that purpose and the layout to be implemented in the remote pilot
station.
3.2 URBLOG Vehicle Specifications
The URBLOG vehicle is the airship to serve as the Multifunctional Air Transport System
vehicle [3]. The first design, represented in Figure 3.1, features a rigid structure with a
sustaining fuselage and a gondola. With a length of 75 meters, 30 meters of wingspan, 15
meters of height, and 5 electric engines, its dynamic control in cruise flight is achieved by
deflection 4 main surfaces (wings) and vertical stabilizers, propelled by an engine of large
diameter on the rear of the aircraft. Static control is achieved by using 4 rotors located on
the wings, plus the deflection of the rear engine.

24
Figure 3.1 - URBLOG Proposed Design [31]
As one of the purposes of this aircraft is to serve as a cargo vehicle, the major challenge to
face is to maintain the buoyancy balance between empty and full load. Thus, it relays on
what is called a hybrid concept, as it applies to aircraft that is lifted simultaneously by
conventional means (heavier than air systems such as helicopters and aeroplanes) and by
Lighter than Air (LTA) methods, by gaining their lift from a lifting gas less dense than the
surrounding air, as in the case of balloons and blimps. This translates the possibility of
vertical takeoff and landing (VTOL).
As the project evolved, it was decided to conduct this study on a smaller version of the
vehicle and as unmanned. Thus, new dimensions were considered below in Table 3.1.
Table 3.1 - Dimensions of the smaller version of URBLOG
Dimensions
Length 8.5 meters
Wingspan 5.4 meters
Height 2.4 meters
A new version of the URBLOG, based on the design above, had then to be modelled to be
further implemented. This URBLOG rigid body design version was modelled through the
computer-aided design (CAD) software Blender®, that is a free and open-source 3D
computer graphics software toolset used for creating animated films, visual effects, art, 3D

25
printed models, motion graphics, interactive 3D applications, and computer games [32].
Blender®'s features include 3D modelling, UV unwrapping and texturing, making it a useful
modelling tool to create objects for flight simulation. Although being free, it has a steep
learning curve. Books, like the Virtual Aircraft Volume II by Witold Jaworski [33] and
Youtube tutorial videos “How To Use Blender For Making Flight Simulator X Models (FSX)
Blender2FSX” by kpgamemods [34] were used as a guide to develop URBLOG model on
Blender®.
Based on blueprints, and as the design was being developed, each file version was saved.
The version of Blender® used was 2.77.1a. The final version of the model was file number
54. The final result is shown in Figure 3.2 and Figure 3.3.
Figure 3.2 - URBLOG Views

26
Figure 3.3 - URBLOG 3D Model View
3.3 Simulation and Implementation of the Vehicle on Flight
Simulator Software
Over the years, simulation has appeared as a cost-benefit method for both validation and
training method, as mentioned in Chapter 2 - State of the Art. The software has been
developed to simplify and accommodate the different requirements of the Aeronautical
industry and academy. There, it is possible to conduct experiments on new and advanced
concepts, research on human factors and new training techniques.
As PCATD devices appeared, with personal computers as its main hardware, the cost of the
software for these devices was vastly reduced. With the improvement of processing
capabilities, either graphic and speed-related, as well with the easy access to modelling
software, the implementation of scenarios, airports and aircraft on flight simulator software
became accessible to the interested user. Nevertheless, to proceed with the simulation of an
aircraft model, the availability of its aerodynamic behaviour defines the best flight simulator
software to implement the model. In this case, being an ongoing academic project, this data
is studied through several master dissertation, for instance, “Simulação Numérica de um
Veículo Aéreo: Determinação dos Coeficientes de Sustentanção, Resistência Aerodinâmica
e de Momento de Arfagem” dissertation [35], developed in 2017, with a model created on
Blender®. Although that thesis has already been finished, the topic shall be further
developed to validate data and together with other aerodynamics, propulsion and systems
studies, it will enable the full simulation of the vehicle. The complete implementation of

27
URBLOG on simulation relies on these different studies, since in simulation, as in reality,
every aspect is inter-connected. However, as currently few data are available, and
considering the objectives of this dissertation, the simulation will rely on data available from
other vehicles already implemented on simulation software, providing the opportunity of
exposing the purposes of the operation of the URBLOG vehicle. Nevertheless, once all
URBLOG theoretical studies are completed, data integration with the simulation and the
RPS developed within this dissertation will then provide a mean of evaluating URBLOG’s
likely behaviour, its exposure to abnormal situations and the possibility of training.
As mentioned previously, the aerodynamic behaviour defines, in large scale, the flight
simulator software where the air vehicle shall be implemented. This can change depending
on the stage of the project as different software implements the aircraft differently,
especially as aerodynamics that can rely mainly on two methods: the Newtonian model or
the Computational Fluid Dynamics (CFD) model. The Newtonian model has the advantage
of being easier to implement but less realistic in stall attitudes, tight turns and other
abnormal situations of flying. The Newtonian Model uses steady-state derivatives [36], as
below:
CD = 𝐶𝐷0 + 𝐶𝐷𝛼𝛼 + 𝐶𝐷𝑖ℎ𝑖ℎ + 𝐶𝐷𝛿𝑒
𝛿𝑒 + Δ𝐶𝐷𝑓𝑙𝑎𝑝 + Δ𝐶𝐷𝑆𝑝𝑜𝑖𝑙𝑒𝑟 (1)
CL = 𝐶𝐿 0 + 𝐶𝐿𝛼𝛼 + 𝐶𝐿 𝑖ℎ𝑖ℎ + 𝐶𝐿 𝛿𝑒
𝛿𝑒 + Δ𝐶𝐿𝑓𝑙𝑎𝑝 + Δ𝐶𝐿𝑆𝑝𝑜𝑖𝑙𝑒𝑟 (2)
CM = 𝐶𝑀 0 + 𝐶𝑀 𝛼𝛼 + 𝐶𝑀 𝑖ℎ𝑖ℎ + 𝐶𝑀𝛿𝑒
𝛿𝑒 + Δ𝐶𝑀𝑓𝑙𝑎𝑝 + Δ𝐶𝑀𝑆𝑝𝑜𝑖𝑙𝑒𝑟 (3)
Cl = 𝐶𝑙0 + 𝐶𝑙𝛽𝛽 + 𝐶𝑙 𝑎𝑒𝛿𝑎 + 𝐶𝑙𝑒𝑟𝛿𝑟 (4)
CY = 𝐶𝑌0 + 𝐶𝑌𝛽 𝛽 + 𝐶𝑌𝑎𝑒𝛿𝑎 + 𝐶𝑌 𝑒𝑟𝛿𝑟 (5)
CN = 𝐶𝑁0 + 𝐶𝑁𝛽 𝛽 + 𝐶𝑁 𝑎𝑒𝛿𝑎 + 𝐶𝑁𝑒𝑟𝛿𝑟 (6)
Where:
𝐶𝐷 = 𝐴𝑖𝑟𝑝𝑙𝑎𝑛𝑒 𝑑𝑟𝑎𝑔 𝑐𝑜𝑒𝑓𝑓𝑖𝑐𝑖𝑒𝑛𝑡
𝐶𝐿 = 𝐴𝑖𝑟𝑝𝑙𝑎𝑛𝑒 𝑙𝑖𝑓𝑡 𝑐𝑜𝑒𝑓𝑓𝑖𝑐𝑖𝑒𝑛𝑡
𝐶𝑀 = 𝐴𝑖𝑟𝑝𝑙𝑎𝑛𝑒 𝑝𝑖𝑡𝑐ℎ𝑖𝑛𝑔 𝑚𝑜𝑚𝑒𝑛𝑡 𝑐𝑜𝑒𝑓𝑓𝑖𝑐𝑖𝑒𝑛𝑡
𝐶𝑙 = 𝐴𝑖𝑟𝑝𝑙𝑎𝑛𝑒 𝑟𝑜𝑙𝑙𝑖𝑛𝑔 𝑚𝑜𝑚𝑒𝑛𝑡 𝑐𝑜𝑒𝑓𝑓𝑖𝑐𝑖𝑒𝑛𝑡
𝐶𝑌 = 𝐴𝑖𝑟𝑝𝑙𝑎𝑛𝑒 𝑠𝑖𝑑𝑒 𝑓𝑜𝑟𝑐𝑒 𝑐𝑜𝑒𝑓𝑓𝑖𝑐𝑖𝑒𝑛𝑡
𝐶𝑁 = 𝐴𝑖𝑟𝑝𝑙𝑎𝑛𝑒 𝑦𝑎𝑤𝑖𝑛𝑔 𝑚𝑜𝑚𝑒𝑛𝑡 𝑐𝑜𝑒𝑓𝑓𝑖𝑐𝑖𝑒𝑛𝑡
𝛽 = 𝑆𝑖𝑑𝑒𝑠𝑙𝑖𝑝 𝑎𝑛𝑔𝑙𝑒
𝐶𝐷𝛼 =𝜕𝐶𝐷
𝜕𝛼
0 = 𝐴𝑡 𝑧𝑒𝑟𝑜 − 𝑙𝑖𝑓𝑡 𝑠𝑡𝑎𝑡𝑒
𝛼 = 𝐴𝑛𝑔𝑙𝑒 𝑜𝑓 𝑎𝑡𝑡𝑎𝑐𝑘
𝑖ℎ = 𝐻𝑜𝑟𝑖𝑧𝑜𝑛𝑡𝑎𝑙 𝑡𝑎𝑖𝑙 𝑖𝑛𝑐𝑖𝑑𝑒𝑛𝑐𝑒 𝑎𝑛𝑔𝑙𝑒
𝛿𝑒 = 𝐸𝑙𝑒𝑣𝑎𝑡𝑜𝑟 𝑑𝑒𝑓𝑙𝑒𝑐𝑡𝑖𝑜𝑛
𝑓𝑙𝑎𝑝𝑠 = 𝐷𝑢𝑒 𝑡𝑜 𝑓𝑙𝑎𝑝𝑠
𝑠𝑝𝑜𝑖𝑙𝑒𝑟 = 𝐷𝑢𝑒 𝑡𝑜 𝑠𝑝𝑜𝑖𝑙𝑒𝑟
𝛿𝑎 = 𝐴𝑖𝑙𝑒𝑟𝑜𝑛 𝑑𝑒𝑓𝑙𝑒𝑐𝑡𝑖𝑜𝑛
𝛿𝑟 = 𝑅𝑢𝑑𝑑𝑒𝑟 𝑑𝑒𝑓𝑙𝑒𝑐𝑡𝑖𝑜𝑛
𝐶𝐷𝛿𝑒=
𝜕𝐶𝐷
𝜕𝛿𝑒

28
This method is present on Lockheed Martin Prepar3D® (P3D) software, (pronounced
“prepared”) [37], which is a commercial product used for simulation and training. It has
many vehicles implemented, together with complete World scenery environment, simulated
weather, navigation aids database and simulated air communications. Pilots, organizations,
and academia use Prepar3D® for immersive, experiential learning as it allows users to
create training scenarios across aviation, maritime, and ground domains. It provides pilot-
like experience with vivid and lively graphical scenarios in different weather conditions and
seasons. The implementation of an aircraft in this software can be easier than in other flight
simulator software as there is a wide number of open source systems that can be either be
used or based on if authorised. Some of these systems, either air vehicles or add-ons, are
already inbuilt in the software, others were developed by users or by the simulation
industry, which is proactively supported by Lockheed Martin. A good degree of realism can
then be achieved in a rather user-friendly approach. Once the aircraft rigid body model (mdl
file) is created on CAD software compatible with P3D, the aircraft configuration (cfg file)
and flight model (air file) can be arranged either by text editor software or by external
software that can illustrate those configurations, for instance, the Center of Gravity (CG) or
where the landing gear is located.
As for the Computational Fluid Dynamics (CFD) model, it uses the blade element theory.
The blade element theory implies breaking the aircraft into small elements and then
calculating the forces and moments on each of these elements many times per second. With
𝐶𝐷𝑖ℎ=
𝜕𝐶𝐷
𝜕𝑖ℎ
𝐶𝐿 𝛼 =𝜕𝐶𝐿
𝜕𝛼
𝐶𝑀 𝛼 =𝜕𝐶𝑀
𝜕𝛼
𝐶𝑀 𝛿𝑒=
𝜕𝐶𝑀
𝜕𝛿𝑒
𝐶𝑙𝑎𝑒=
𝜕𝐶𝑙
𝜕𝑎𝑒
𝐶𝑌𝛽 =𝜕𝐶𝑌
𝜕𝛽
𝐶𝑌𝑒𝑟 =𝜕𝐶𝑌
𝜕𝑒𝑟
𝐶𝑁 𝑎𝑒=
𝜕𝐶𝑁
𝜕𝑎𝑒
𝐶𝐿 𝑖ℎ=
𝜕𝐶𝐿
𝜕𝑖ℎ
𝐶𝐿 𝛿𝑒=
𝜕𝐶𝐿
𝜕𝛿𝑒
𝐶𝑀 𝑖ℎ=
𝜕𝐶𝑀
𝜕𝑖ℎ
𝐶𝑙𝛽 =𝜕𝐶𝑙
𝜕𝛽
𝐶𝑙𝑒𝑟 =𝜕𝐶𝑙
𝜕𝑒𝑟
𝐶𝑌𝑎𝑒=
𝜕𝐶𝑌
𝜕𝑎𝑒
𝐶𝑁𝛽 =𝜕𝐶𝑁
𝜕𝛽
𝐶𝑁 𝑒𝑟 =𝜕𝐶𝑁
𝜕𝑒𝑟

29
this method, the flight simulator software, like X-Plane [38] can compute the forces applied
to the aeroplane in a more detailed method. This offers the possibility to investigate the
approximate flying behaviour of a newly developed aircraft without having to build and test
a prototype. Nevertheless, at this point, the advantages of using this software would not be
relevant as we do not possess any information regarding URBLOG’s systems and
aerodynamics. Also, as X-Plane has its own in-house software for CAD model developing, it
does not enable the use of the model in other CAD software to develop the model.
Considering that using a 3rd party software as Blender® for the development of the CAD
model enables its application on other software, for instance, on CFD analysis, which is not
particularly related to flight simulation itself but which was the case on the dissertation
concluded last year [35], this would be a limitation. Being so, this software was excluded.
On the other hand, there is FlightGear [39], which is vastly used by academics as it is open
source, being freeware, and its connection to simulation software as MATLAB/Simulink®.
This software uses different flight dynamics models, depending on the aircraft and user
choice. The most recent dynamic model and the default one is JSBSim, based on nonlinear
equations of motion. The YASim model relies on geometric information and not in
aerodynamic coefficients, providing the best results when it comes to the modelling of new
aircraft design, especially for rotorcrafts and helicopters. As already mentioned, to resemble
the simulation with the real or expected configuration, aircraft systems shall be already
defined, or at least its coefficients. On the URBLOG case, as reduced information is available
at this stage, and the Flight Gear implies a steep learning curve, this software was
unconsidered. [40] However, it is recognized that its capacities can be of help once URBLOG
systems are further studied, especially the use of MATLAB/Simulink®.
Considering the above, the URBLOG airship development was decided to be executed on
the Lockheed Martin Prepar3D®. With the addon Blender2FSX/P3D Toolset, it is possible
to export Blender® files settled for P3D software. By using external software, it is also
possible to adequate its dynamics and translate the URBLOG purpose. Four types of flight
dynamics editor software are available for this purpose: two freeware, AirEd and Aircraft
Airfile Manager [41], and two payware as a package, AirWrench and AirWizEd [42]. The
flight dynamics, performance, engine definitions and all physical specifications of the
vehicle can be changed through these programmes, in which the payware versions have
better visualisation and calculation of the specifications, offering a more detailed approach.
As they differ on presentation and detail, they shall be used all together to achieve the
conditions required, especially when following specifications from other vehicles, which is
the case.
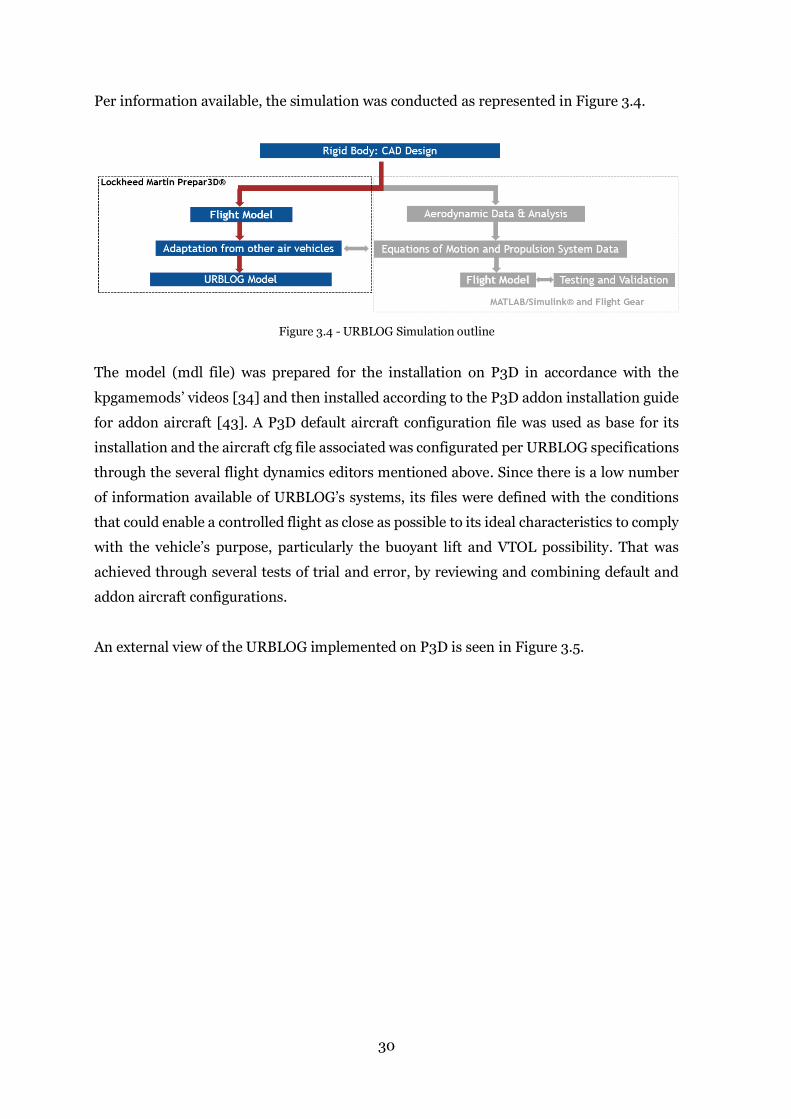
30
Per information available, the simulation was conducted as represented in Figure 3.4.
Figure 3.4 - URBLOG Simulation outline
The model (mdl file) was prepared for the installation on P3D in accordance with the
kpgamemods’ videos [34] and then installed according to the P3D addon installation guide
for addon aircraft [43]. A P3D default aircraft configuration file was used as base for its
installation and the aircraft cfg file associated was configurated per URBLOG specifications
through the several flight dynamics editors mentioned above. Since there is a low number
of information available of URBLOG’s systems, its files were defined with the conditions
that could enable a controlled flight as close as possible to its ideal characteristics to comply
with the vehicle’s purpose, particularly the buoyant lift and VTOL possibility. That was
achieved through several tests of trial and error, by reviewing and combining default and
addon aircraft configurations.
An external view of the URBLOG implemented on P3D is seen in Figure 3.5.

31
Figure 3.5 – URBLOG on P3D Software
At this point, URBLOG simulation will not permit the docking of the vehicle. Any simulation
will then be done above ground level (AGL), with the vehicle powered up.
The electrical propulsion rotors installed on the wings are not simulated in this version. The
rear propulsion system is the only source of thrust.
3.4 Development and Implementation of the Virtual
Cockpit and Remote Pilot Station
A virtual cockpit is essential on a synthetic environment as a flight training device. It is the
visual element that enables the realisation of the tasks in a controlled environment, where
the user can perceive information of the system, in this case, from the RPAS, and control it
adequately. Once the virtual cockpit is designed in this kind of systems, it can be either used
for training purposes, together with hardware interfaces or be also integrated on the actual
remote pilot station. Having that in consideration, those two possible uses are taken into
account and it is developed a layout of a remote pilot station to be included in this synthetic
environment.

32
3.4.1 Instruments
In similarity to what is present on manned flew aircraft, the flying characteristics as the
aircraft’s speed need to be available to the person flying the vehicle. A variety of instruments
have been developed to inform the flight crews regarding the flight and environment
parameters. The condition of the aircraft, engine, components, the aircraft’s attitude,
weather, cabin environment, navigation, and communication are the main topics reflected
on the instruments that are present on a cockpit to assure safe operation. For flying, there
are three basic types of instruments, classified by the job they perform: flight instruments,
engine instruments, and navigation instruments [44].
Flight Instruments The main function of the flight instruments is to show current information on aircraft speed,
altitude, vertical speed, attitude, heading, and turning/banking. Traditionally, they are
analogue cockpit gauges arranged in T configuration and they are essential to a controlled
flight. There is an altimeter that displays aircraft’s height regarding a barometric pressure;
the airspeed indicator, indicating the airspeed usually in knots; and heading indicator, a
form of a compass that indicates the aircraft’s direction in relation to the magnetic North;
and an attitude indicator, that transmits the aircraft’s attitude towards the ground and the
sky by its position in relation to an artificial horizon. The different types of attitude are
shown in Figure 3.6.
Figure 3.6 - Attitude Indicator (or Artificial Horizon), in several indications [45]
Additionally, a turn coordinator providing information about the direction and rate of a
turn, and whether the turn is being flown coordinated; and a vertical speed indicator that

33
measures the rate of climb or descent, transforms this so-called “Basic T”, into on a “Six
Pack” as in Figure 3.7 These instruments are normally arranged so the top centre position
directly in front of the pilot is the artificial horizon [44].
Figure 3.7 - Traditional Six Pack [Adapted from 46]
Navigation Instruments This type of instruments contributes with information so pilots can guide the aircraft along
a defined course. This group of instruments includes compasses of various kinds, some of
which incorporate the use of radio signal to provide navigational aid while flying the aircraft
from one airport to another. Other navigational instruments are designed specifically to
direct the pilot’s approach to landing at an airport. Some traditional navigation instruments
have been progressively replaced in modern aircraft. Global position systems (GPS) use
satellites to pinpoint the location of the aircraft via geometric triangulation [44].
Engine Instruments Engine instruments are those designed to measure operating parameters of the aircraft’s
engine(s). These are usually quantity, pressure, rotation speed and temperature indications.
They are often placed in the centre of the cockpit where it is easily visible for all the flight
crew.

34
3.4.2 Glass Cockpit
With advancements in technology, the traditional cockpit gauges were replaced by electrical
substitutes in glass cockpits, like in Figure 3.8. Normally, within two large liquid crystal
display (LCD) screens, all the information provided by the traditional individual gauges are
now displayed in the primary flight display (PFD) and the multifunction display (MFD).
These panels have a collection of buttons, keys, and knobs used to operate each unit. The
controls allow the pilot to enter information and program the avionics panels
to accomplish the desired operations or tasks.
Figure 3.8 - Glass Cockpit [44]
PFD present the basic flight instruments, such as the airspeed indicator, the
altimeter, the attitude indicator, heading indicator and vertical speed indicator, dynamically
combining much information. This makes possible the addition of enhancements as trend
indicators and symbols to assist in the case of an upset situation, which can be defined as a
visual warning system as well. In Figure 3.9, the relation between the analogue gauges and
the instruments shown on a PFD.

35
Figure 3.9 - Analogue Gauges related to PFD instruments [47]
Another important feature of the PFD is its ability to gather information from other aircraft
systems and present it to the pilot in the integrated display. For example, the PFD in Figure
3.10 presents many useful items about flight status. The top bar shows the next waypoint in
the planned flight route, the distance and bearing to the waypoint, and the current ground
track. The outside air temperature (OAT) is shown in the lower-left corner and the
transponder code and its status are shown with the current time in the lower right corner.

36
This PFD also allows the pilot to tune and identify communication and navigation radio
frequencies at the top of the display [48].
Figure 3.10 - PFD [48]
The MFD presents a moving map display on the right side and engine instrumentation on
the left It can also show other traffic, the route in place, weather and terrain avoidance. The
navigation is based on the navigation receivers installed on the aircraft, as the global
positioning system (GPS) and the Very high-frequency Omnidirectional Range (VOR).
With all these functionalities available, it is possible the use of autopilot to complete a
certain route and altitude. Depending on the configured navigation, the aircraft will
progress into the next waypoint in the programmed flight route. Although pilots are
required to be comfortable with all information needed to complete a flight (being it
regarding the aircraft, systems, route or weather), this type of system can reduce workload.
Previous control inputs are now automated when configurated correctly and monitoring is
in place at all times [48].
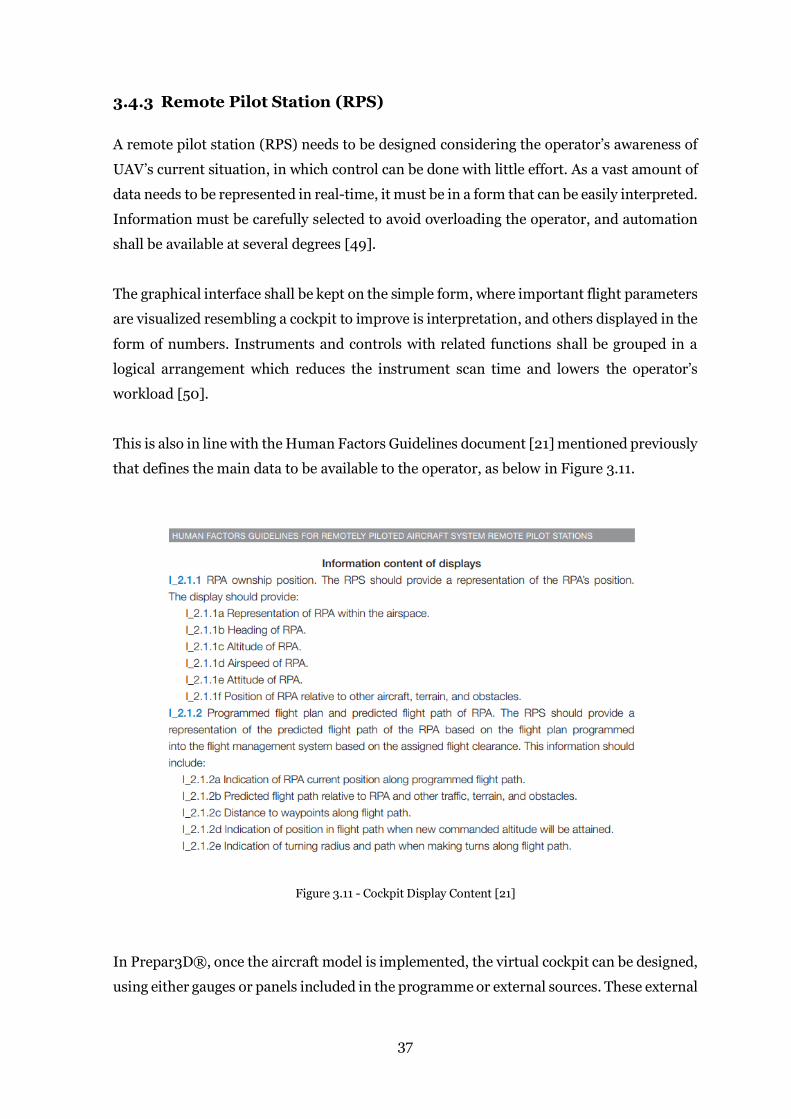
37
3.4.3 Remote Pilot Station (RPS)
A remote pilot station (RPS) needs to be designed considering the operator’s awareness of
UAV’s current situation, in which control can be done with little effort. As a vast amount of
data needs to be represented in real-time, it must be in a form that can be easily interpreted.
Information must be carefully selected to avoid overloading the operator, and automation
shall be available at several degrees [49].
The graphical interface shall be kept on the simple form, where important flight parameters
are visualized resembling a cockpit to improve is interpretation, and others displayed in the
form of numbers. Instruments and controls with related functions shall be grouped in a
logical arrangement which reduces the instrument scan time and lowers the operator’s
workload [50].
This is also in line with the Human Factors Guidelines document [21] mentioned previously
that defines the main data to be available to the operator, as below in Figure 3.11.
Figure 3.11 - Cockpit Display Content [21]
In Prepar3D®, once the aircraft model is implemented, the virtual cockpit can be designed,
using either gauges or panels included in the programme or external sources. These external

38
elements can be developed in house or be open-sourced, available to download from an
addons provider.
For the actual stage of URBLOG, where no engine parameters or communication interfaces
are defined, the main elements that are relevant in this study, are the flight and navigation
instruments, essential to the control of the vehicle.
For both flight and navigation instruments, due to the clear graphic interface and by being
inbuilt on the P3D software, the PFD and MFD are defined as the main cockpit instruments
to assess the flight status data. These instruments are in line with the recommended content
of figure 3.10 and with the automation management that might be present in an advanced
phase of the RPAS. Although during this study the P3D software and its instruments are not
subject to any validation studies, its training capabilities and replication of the real
functionalities and limitations are widely recognized, making it an appropriate choice.
Besides the instruments in the virtual cockpit display of the RPS, a constant outside view
has to be integrated into this system. Within this display, the imagery of the out-the-window
(OTW) world is shown and controlled by the operator so that the current orientation and
position of the monitored aircraft and future overflying areas are constantly visualized. Its
control can be achieved by either a manual input on a hat switch on the joystick, an
increased number of physical displays, a virtual reality headset or by head tracking devices.
An additional Head-Up Display (HUD) with a classical artificial horizon level shall be
integrated into the OTW view, by being overlap in this view. This allows the operator to
receive information while looking straight ahead, instead of looking to the main
instruments, improving the sensing of the operator.
For the URBLOG case, it will show the orientation the vehicle concerning the artificial
horizon, altitude, heading, speed, vertical speed and thrust applied.
This HUD was adapted from the freeware gaHUD gauge developed by Bob Kellogg,
available on FlightSim.com [51]. Being possible to modify it, which is allowed by its
developer, minor changes were done to add description next to each data, i.e., word SPD
next to the speed values. The opportunity to change its configuration can be beneficial
during the evolution of this project, including the adding of additional functions. At this
point, no change of its functions was required and all additional functionalities remain as
the original version, which is the following:

39
“An indicator bug for the Nav1 OBS setting will appear on the DG strip. If you set the
localizer course on the OBS, this will help to see the effect of crosswinds on an approach. It
is also the reminder of what course you should be flying, unless on backcourse.
The vector bars for airspeed and altitude are intuitive. They turn clockwise when
airspeed/altitude is increasing, and counter-clockwise when decreasing. And the speed of
rotation suggests the magnitude of change. (…)
When the winds exceed 5 knots, the wind information will appear near the upper right
corner. When your Nav1 is receiving a localizer, the appropriate ILS bars will appear, along
with the nav ident and dme if available, and the outer and middle marker beacons will light
up.” [51].
The final look of the HUD is shown in Figure 3.12.
Figure 3.12 - HUD
As for the manual control of the vehicle, since URBLOG systems are still not defined and no
regulated interfaces are available, COTS products are considered effective to achieve the
expected results in this RPS development. The COTS interfaces must be consistent, with a
small number of configurations required, and be composed with distinctive functions.
The control of an aircraft is usually performed by either a joystick or a control yoke. The
control yoke is usually similar to the one on a light or Boeing aircraft. Its base is a box that
40
supports a column where is yoke is installed. It is in front of instruments and inputs are
permitted on both forward, aft and side of the yoke, to adjust both pitch and bank attitude
of the aircraft, respectively. These inputs are usually given by both hands on the yoke.
A joystick is a vertical grip like the sidesticks on Airbus aircraft or fly-by-wire aircraft
systems. The grip is attached to a base, with the same functions as the control yoke, but it is
controlled with only one hand. It is usually located in one of the sides related to the
instruments, not obstructing its view, requiring much less space.
In terms of controllability, the joystick is more sensitive but at the same time, it provides
apparent neutral stability compared to the yoke as it requires less movement from the user,
only depending on the movement of the wrist. The yoke requires arm movement to control
it, which can lead to poorer control feel. A larger area of neutral stability makes the pitch
and bank control easier [52]. In COTS equipment, both these devices can have additional
switches and control wheels to substitute keyboard inputs. However, a joystick or a yoke
shall have a reduced number of active buttons to diminish the inadvertent selection of
modes but it shall include a 'Point Of View' hat switch that will allow the manual control of
the OTW view.
The thrust is set on a COTS throttle interface usually within the base of either the joystick
or control yoke, although it can sometimes be separated by a cable or even be an individual
system. The thrust of each engine is controlled by an individual throttle, but if no or little
information is known regarding the propulsion system a single throttle can control the total
number of engines.
A COTS joystick and throttle shall be of high precision, ergonomically-designed and with a
weighted base for greater stability. This base will allow the correct movements both
forwards and aft, as well as to the sides in order to control both pitch and bank attitude
respectively. The drift can be controlled by joystick vertical axis, that will avoid the need of
rudder pedals to control the aircraft’s yaw. The resistance and feel of the joystick shall be
adjustable.
Any other input shall be given through a computer mouse, keyboard and if available, touch
functionalities in displays. Any joystick or yoke button that is assigned a function should be
spaced from other buttons, in order to avoid inadvertent pressing.
By taking in consideration design features of the flight decks on cockpits, the RPS should
ensure that [53]:

41
• it provides a safe working environment for its operator (no sharp edges or the risk
of a short circuit, for example), with an adequate level of comfort (external noises,
lights and vibrations shall be reduced to the minimum possible);
• space is available to store charts and checklists required to fulfil the flight mission;
• equipment is installed in its desired position for the duration of the flight;
• seats should provide comfortable support for the body, which can include lumbar
support, armrests and headrests.
These are complemented by the good posture recommendations on how to sit properly at a
computer [54]:
• The chair height shall be adjusted so feet are flat on the floor and knees are in line
(or slightly lower) with the hips;
• When sitting, sit up straight, with hips far back in the chair;
• The keyboard and mouse shall be close and directly in front of the person operating
the computer;
• The monitor should be directly in front, with the top of the screen roughly at eye
level, if possible;
• Sit at least with an arm’s length away from the computer screen.
By gathering all these instruments, constraints and characteristics into the RPS for the
URBLOG case, a final system is defined as the one presented in Figure 3.13.
Figure 3.13 - Schematic of the URBLOG Remote Pilot Station Synthetic Environment

42
3.4.4 Implementation
In order to comply with the RPS system previously studied and to take into consideration
all the factors mentioned in both Chapter 2 - State of the Art and the precedent subchapters,
a low-cost COTS equipment was chosen for the main implementation of this synthetic
environment.
For the PCATD, a laptop with the following specifications:
Processing Unit: Intel Core i7-7700HQ, 8 threads - 2.8 GHz
Graphics Card: NVIDIA: GeForce GTX 1050 Ti, 2 GB VRAM
Memory: 16 GB
Hard Drive: 500GB SSD
Display Resolution: 1920 x 1080 x 60 hertz, 15.6 inches screen
Operating System: Windows 10 Home, Version 1903
The flight simulator software:
Lockheed Martin Prepar3D® v4 Professional
Version 4.3.29.25520
SimConnect Version 4.3.0.0
License ID: 3140707
License Status: Licensed
To control the aircraft:
Thrustmaster T-Flight Hotas X Flight Stick (right-handed) - Compatible with PC and
gaming devices, this joystick has programmable buttons and a hat switch for panoramic
view; enables high-precision inputs with adjustable resistance; has a detachable, real-size,
ergonomically-designed throttle control; and has a weighted base for increased stability.
In order to see both OTW view and the instruments, an additional display was needed. To
enhance the visualization of this system, it was decided to include an iPad as external
monitor and a head tracking device.
The head tracking device recognizes the operator’s head in the different axis by its optical
tracking system. Then these inputs are converted into the local coordinate system of the
flight simulator software by addon software, which will allow changes in the view
perspective by a head tilt. This is possible with the software FaceTrackNoIR V200 [55],

43
together with a web camera, which has payware drivers. As better results are seen with the
PlayStation® PS3 Eye camera because it records up to a maximum of 120fps, it was also
included in this system and adapted for PC. As result of the higher framerate, achieving
better results, it requires a higher processing power from the computers’ CPU, which in this
case, was adequate.
Nevertheless, to provide good results, some recommendations are given:
• Lighting should be indirect from a source above and behind the monitor;
• The cable should be directly connected to the computer and not by a hub;
• Webcam should be ideally placed below the monitor.
In the need of an additional screen for the visualization of the instruments, the iPad with its
touching facilities provides additional functionalities to this system.
With the payware software Duet [56], available online on the Apple Store, together with the
free Duet desktop app, the iPad recognises the computer through the cable and extends the
Windows screen, transforming it into a high-performance touchscreen display with no lag.
This software, together with the Prepar3D®, allows the touch functionalities of the
instruments, i.e. inputs and changes can be given directly on the screen.
The Duet version on Windows for this tests is the v1.8.2.1 and iPad version is v2.2.5.
The iPad is a 6th generation, with IOS version 13.3.1. The cover that supports the tablet in
the horizontal position is the Targus THZ737GL-50, with several angle positions available.
All this equipment shall be installed above a table, displayed according to Figure 3.14. The
iPad is positioned in front of the laptop, and both iPad and laptop screen angle shall be
adjusted to the operator’s perspective. The camera shall be centred to the operator and
placed above the screen due to the physical characteristics of a laptop.

44
Figure 3.14 - Layout
The physical setup is shown below, in Figure 3.15.
Figure 3.15 - Physical Setup

45
3.5 Conclusion
In this case study, the URBLOG vehicle was presented, with all its available characteristics.
Being an ongoing project, with few data available, the development of a synthetic
environment as a flight simulation training device (FSTD) of this vehicle relies on the
experience of other cases to represent its objectives. This indicates that a series of
assumptions and tests were needed to be able to illustrate its concept. Several flight
simulator software options were equated, with their advantages and disadvantages
weighted, and an option was chosen. A model of the URBLOG was firstly designed on CAD
software, later implemented on Prepar3D® software, with certain limitations. The vehicle
can only be used above ground level powered on, not simulating the docking of the device.
Rotors installed on its control surfaces are also not simulated.
For the development of the virtual cockpit and station, several types of instruments were
reviewed and human factors applicable to both cockpits and remote pilot stations were
considered. As the propulsion system is not fully studied, neither the communication
interfaces needed, the development was focused on the essential elements to control the
vehicle from the perspective of its operator without automation, including both virtual and
hardware interfaces. Two main types of instruments were chosen, and a HUD was adapted
for better interpretation on an OTW view. The adapted HUD and the head-tracking device
to control the OTW view enhance the human sensing of the operator. As the requirements
for the URBLOG systems are no defined, COTS equipment was used for the hardware
interfaces, although assuring a certain number of requirements and recommendations. A
layout was designed, having in consideration the possible environment of a RPS. It is
composed by a personal laptop computer with Prepar3D® installed, together with a HOTAS
flight control system, a head tracking device, and an additional screen. It is then
implemented as synthetic environment, and the final setup is shown.

46

47
Case Study II: Operator’s Training
Programme for URBLOG
4.1 Introduction
In order to develop a training programme, it is important to have in consideration how the
pilot training is developed and how it is validated. In this chapter, training concepts are
introduced, leading to the specific case of the URBLOG. A training programme is defined so
the setup defined in Chapter 3 - Case Study I: Development of the Synthetic Environment
for URBLOG can be effectively used. A human in the loop (HITL) study is then used to verify
and validate both programme and the setup. This study consists in the accomplishment of
a mission with different tasks on flight simulator software performed by different operators,
in which flight data information and parameters are recorded.
Data from this study is treated in spreadsheets and results are displayed graphically. The
results include: the comparison of the median against optimum-relative results, in which
its difference will be defined by the standard deviation; the comparison of the medians
obtained of all operators; and finally, flight data from all operators is compared in particular
mission’ tasks.
4.2 Training Programme Development and Process
Pilot training is normally divided into two phases: initial and advanced training.
The initial training is when pilots are instructed to become pilots, understanding topics as
flying techniques, aircraft specifications, airspace rules and meteorology, either on single-
engine or multi-engine aircraft, based on either visual flying or aircraft instruments.
The advanced training is when the pilot is directed to a specific model, normally for
professional use [57]. For both stages of tuition, pilots are required to act according to a set
of procedures. These procedures reflect the best practices, manoeuvres and handling
techniques between the aircraft and the pilot. It shall reflect the actions needed for both
normal flight when all systems operate normally, and abnormal situations, i.e. system
failure; and are normally performed using “READ & DO” principle [58].
Introduction of new technology, a new type of operation or a new type of pilots (for example,
former military-trained pilots), often call for a change in the procedures. That is why the

48
procedure design program shall be as accurate as possible, to take in consideration five
points [59]:
• what the procedure is designed to accomplish;
• when and/or under what conditions the procedure should be executed;
• who is responsible for executing each step in the procedure;
• how, in detail, the procedure is to be performed;
• how to confirm that the procedure has been accomplished properly.
Every procedure has a primary requirement - if the procedure is followed, the specified goal
will be achieved. That is why it is important to have a clear and easy training practice.
For instance, a learning procedure that includes several simple steps is easier to train than
a procedure that includes fewer, complicated steps. The same with procedural sequences
heading to a logical progression of steps as they are easier to teach than arbitrary sequences.
If a procedure is difficult to learn, training the procedure will put a strain on the individuals
tasked with performing the procedure, which can put at risk the real accomplishment of the
task and the consequent safety of the flight [60].
To standardize the procedural methodology, the procedures that are performed frequently
assuring the normal operation of the aircraft are stated as the Standard Operating
Procedures (SOPs). These procedures are defined per flight phase and described in
chronological order. Their actions are easily memorized and easy to apply. Nevertheless,
they are checked against checklists [58].
Checklists assure that these procedures are done correctly and can also include how the
checklist is to be executed (e.g., silent, challenge-and-response). Like any plan of action,
once a prototype checklist has been developed, it must be analysed and tested for feasibility
and practicality by training [60].
When developing an instructional or training process, it is necessary the following [61]:
1. characterize the training populations, identifying specific training needs;
2. determine training objectives - the goal of the training;
3. determining course content and the training methods to meet training objectives;
4. develop an assessment methodology.
5. ensure that instructor qualification is ideal and can successfully comply with the
training implementation;

49
6. assure a proof of concept by verification and validation of the training, followed by
a detailed course outline based on the results, where changes can be incorporated.
The URBLOG, being a new type of device, requires that the provided training is according
to the above. At this stage, procedures shall reflect the basic control of the vehicle and basic
system functions, not requiring advanced flying skills. Being so, the training process is
defined as the following:
1. Training Population: Real pilots, virtual pilots and non-pilots with Aeronautical
knowledge. Population with different flying experience will provide inputs regarding
its relevance for flying the URBLOG;
2. Training Objectives: Fly the URBLOG successfully, in a defined path, according to
SOPs, in a stable flight;
3. Course Content and Training Method: An operating manual, including a checklist,
was developed to assure that the current SOPs can be followed by the operator to fly
the URBLOG by its best practices. This document will provide complete information
and will be the basic curriculum necessary to train the operator in order to perform
an assessment in simulation by a Human in the Loop (HITL) study. This study
consists of a mission, that the operator is asked to comply with;
4. Assessment Methodology: The time used to perform the mission will be recorded,
as well as several parameters of the simulated flight. The analysis and the
assessment results will be detailed later on the next subchapter, 4.3 - Human In the
Loop (HITL) Study;
5. The instructor will be the developer of this training and study, knowledgeable of the
vehicle, flying and technical aspects;
6. The proof of the concept will be based on the results of the mission by the different
population, which can provide outputs for a detailed course outline.
By having the training process defined, the study can now be conducted.
4.3 Human In the Loop (HITL) Study
Model testing is essential to validate if the system implemented fulfils its purpose. This can
be achieved by using a variety of methods, one of those being the Human In the Loop (HITL)
studies, where people are part of a system. This type of studies is complex as the need to
collect many different types of data has to be adequate, so the integrity of the simulation is
maintained. Interferences should be minimal, or inexistent, to avoid changing how the
human, the operator, performs its actions. Achieving the necessary balance between

50
gathering the necessary data and maintaining the fidelity of the simulation requires careful
planning and execution [62].
In order to conduct this study, it was necessary to divide it and define the main measures
and requirements that could successfully provide results. In every step of the process, the
presence of the instructor is needed, constantly available to provide support and coordinate
the study.
4.3.1 Setup
In Chapter 3 - Case Study I: Development of the Synthetic Environment for URBLOG, an
RPS was defined for the operation of this vehicle. However, during this HITL study,
Worldwide contingencies were in place due to a virus outbreak (COVID19), thus there was
a limitation of performing the study in the same location, conditions, and setup. To accept
possible remote participants, they had to ensure they were familiar with the software and
had the following interfaces available for the study:
• Personal Computer (PC), with Windows 10;
• Lockheed Martin Prepar3D® v4;
• Joystick, ergonomically designed and stable;
• Availability of install complementing software for data recording, screen sharing
and voice conference.
The head tracking device and the iPad for extended functionalities and viewing had to be
excluded for these cases, as they imply the purchase of both hardware and software.
Therefore, it was decided that only the HUD will be used as a panel during those cases.
For the cases where physical testing is possible, the setup used is the one implemented in
the previous subchapter 3.4.4 - Implementation.
4.3.2 Pilot Questionnaire
A questionnaire was developed to collect information about the target population to assure
that the test subject population was homogeneous and unbiased. The study has to be
adequate for the population in which the training is oriented. The participants of this study
need to be chosen based on their Aeronautical know-how and different real and virtual flight
experience. Demographic information can also be relevant thus it shall be taken into
consideration. The following questions were asked:

51
1. Age Range
2. Sex
3. Real-life pilot?
4. If yes, which license(s)?
5. Total Flight Hours (approximate)
6. In which type of controls do you have more experience - yoke or joystick?
7. Have you flown with Glass Cockpit displays?
8. Are you a flight simmer?
9. If yes, how much do you fly every month?
10. Which is the type of controls used - yoke (1) or joystick (2)?
11. Do/did you fly Aero Models?
12. Have you ever used a joystick or yoke to control an aircraft on flight simulator
software?
As a result of the Worldwide contingencies (COVID19), the number of participants had to
be reduced but reassured that would be representative of several types of background. With
the intention of contacting possible remote participants, members of a flight simulation
community, the International Virtual Aviation Organisation (IVAO), were asked to
individually answer to the above questionnaire. This flight simulation community is an “(…)
online platform for flight simulation enthusiasts to enjoy their hobby in a simulated real-
world environment, in company of other people, flying or providing Air Traffic Control
services.” [63]. Based on the answers obtained during the first quarter of April 2020, the
proficiency and know-how required of IVAO members, together with the interfaces
available to perform the study remotely, two members of IVAO were selected as
participants. They performed the study in the second quarter of that month. As the
COVID19 measures enabled physical proximity within safeguards, one of the chosen
subjects was available to perform it physically.
Nevertheless, to include the case of an operator without either real or virtual flight
experience, but with Aeronautical knowledge, an external participant was invited to
physically complete the study.
Each participant was defined as “Operator” and is associated with a number. The answers
to the questionnaire can be found below, in Table 4.1.
Additionally, it was requested that a subject familiarized with these studies, with both
virtual (as an IVAO member) and real flight experience would perform the mission. It is

52
defined as Operator X to distinguish from unfamiliarised subjects and the results of the
missions attempts performed will be used as an optimum-relative reference during flight
comparisons.
Table 4.1 - Pilot Questionnaire
Questions Operator
1
Operator
2
Operator
3
Operator
X
1. Age Range 50-60 20-30 30-40 20-30
2. Sex F M M F
3. Real-life pilot? No Yes No Yes
4. If yes, which license(s)? - PPL - PPL
5. Total Flight Hours (approximate) - 70 - 60
6. In which type of controls do you have more
experience - yoke (1) or joystick (2)? - 1 - 1
7. Have you flown with Glass Cockpit displays? - No - Yes
8. Are you a flight simmer? No Yes Yes Yes
9. If yes, how much do you fly every month? - 5h 20h 5h
10. Which is the type of controls used - yoke (1) or
joystick (2)? - 2 2 2
11. Do/did you fly Aero Models? No No No Yes
12. Have you ever used a joystick or yoke to control an
aircraft on flight simulator software? No Yes Yes Yes
These operators were given the URBLOG operating manual, as included therein in
Appendix A - URBLOG OPERATING MANUAL Version 1.0 to draw their attention to the
characteristics and limits of the vehicle, as well the procedures to be followed. This
operating manual was developed to provide all the information and procedures necessary
to fly the simulated URBLOG in this study, including the configuration of the head tracking
device, on Appendix A.1. The structure of this manual is based on the Airbus Flight Crew
Techniques Manual (FCTM) [58], the Airbus Flight Crew Operation Manual (FCOM) [64]
and a guide for RQ-4A Global Hawk simulator, developed within a dissertation [65]. The
standard operation procedures (SOPs) checklist follows the design of the procedures
included in P3D default aircraft. The glass cockpit information is extracted from Garmin’s
G1000 Integrated Flight Deck Pilot’s Guide [66].
After their interpretation of this operating manual, the operators shall read Appendix A.2,
included in such document, that presents the URBLOG mission and its tasks. During this
period and throughout the mission, constant communication is present between the
operator and the instructor, which is the person overviewing and setting the study.

53
4.3.3 Mission and Tasks
A mission was developed to include several tasks that simulate the objectives of URBLOG
during air surveillance. It has an approximate duration of 8 minutes and 30 seconds, and
the operator is asked to perform it three times. This is done to avoid a surprise effect and to
verify if an improvement is achieved after repeating the tasks. The initial training in every
aircraft consists of the adaptation of the operator or pilot to its controls and systems, which
will be analysed within this study. No Air Traffic Control (ATC) instructions are simulated
in this mission.
The mission was designed having the purpose of creating a relatively short visual flight rules
(VFR) flight, where the operator shall follow a nearby road to the airport, by complying with
the gates implemented, like the one represented on Figure 4.1. These gates define the flight
path required for this mission. They are approximately 500 feet in height per 500 feet in
length.
Figure 4.1 - Mission Gates
The flight includes a departure and arrival at a civil airport available on the Prepar3D®
software, in this case, from and to Oporto airport (ICAO: LPPR) in Portugal. Initial flight
parameters are equal in all mission attempts. These parameters include weather conditions,
geographic location, altitude, heading, power setting and speed. The initial weather
conditions are clear skies with no wind, and the vehicle’s engines are powered.
The main tasks to be completed are in Table 4.2.

54
Table 4.2 - Mission Tasks
URBLOG Mission
Vertical Takeoff from runway 35 LPPR
Transition from vertical flight to horizontal flight
Climb for 1st gate interception
Climb for 2nd gate interception
Cruise flight for 3rd gate interception, visually following the road
Descend for 4th gate interception
Visual approach to runway 35 LPPR
Transition from horizontal flight to vertical flight
Landing on runway 35 LPPR
The mission was configured on Prepar3D® inbuilt mission designer, SimDirector. This
software is defined as following: “SimDirector is Prepar3D®'s scenario creation tool
designed to provide a premiere scenario creation experience from start to finish.” [67].
Several objects were configured to define each task, as well as the definition of gates. In
total, 82 objects were necessary to establish this mission, as seen in Figure 4.2.

55
Figure 4.2 - Sim Director URBLOG Mission Overview
The final mission scenario resembles a traffic pattern, although with deviations in order to
simulate the air surveillance over a main road. It is shown in Figure 4.3. Short turns are
purposely required during this mission, increasing its difficulty.

56
Figure 4.3 - Mission Scenario
4.3.4 Data Collection and Mission Accomplishment Definition
To analyse the performance of each operator, for each mission, flight parameters are
recorded. This is accomplished by a standalone software called Flight Simulator Quick
Access Recorder and Analyzer (FSQAR) [68], and it shall be initiated by the instructor
shortly before the start of each mission and ended after landing. According to its definitions,
it records data four times per second when the aircraft is below 100 feet above ground level
(AGL) and once per second when below 2000 feet AGL. This allows a more detailed analysis
of the takeoff and landing. For the clarity of this study, each moment recorded is defined as
an instance, regardless of the frequency of the recording. At the end of each mission, the
data will be available for post-analysis on a spreadsheet file on Microsoft® Excel® for
graphical analysis.

57
90 parameters are recorded in the spreadsheet. The parameters used for this study present
in the spreadsheet, with each unit, are the following:
• OnGround - 1 or 0, depending if the aircraft is touching the ground, or not,
respectively;
• VSpeed - Vertical Speed, in Feet per Minute;
• IAS - Indicated Airspeed, in Knots;
• Alt - Indicated Altitude, in Feet;
• Pitch - Pitch Angle, in Degrees, in which positive values represent positive attitude
in relation to the aircraft’s centre of gravity (CG);
• Bank - Bank Angle, in Degrees, in which positive values represent bank to the left,
in relation to the aircraft’s centre of gravity (CG);
• HMag - Magnetic Heading, in Degrees;
• Lever - Throttle Level, in Percentage;
• Lat - Latitude, in decimal Degrees;
• Lon - Longitude, in decimal Degrees.
Additionally, a snapshot with the route performed on each flight will be taken from P3D
Flight Analysis’ Map.
From these files, it will be possible to analyse and compare the flight parameters for each
recorded flight. Particular flight instances can be defined for a detailed analysis. Based on
these data, the assessment of missions is performed.
The accomplishment of the mission translates that all the Aeronautical s are followed, a
stable flight is conducted, and that the operator can comply with all the tasks. The SOPs
deviations and unstable situations as crash, stall or failure to land will lead to a negative
assessment and the consequent failure of the mission.
For the remote participation of operators of the mission, it is necessary to use screen sharing
and voice conference. By using both, it is possible to control the operator’s remote station
to configure both mission and FSQAR configuration, while voice communicating.
4.3.5 Post Flight Questionnaire
At the end of the test, operators are asked to answer the following questions, including an
open-answer question:

58
1. Are the pitch and bank adjustments difficult to perform?
2. Is the airspeed difficult to maintain?
3. Is the airspeed difficult to set?
4. Were you able to understand the attitude of the aircraft?
5. Is the head tracking distracting (if applicable)?
6. Do you believe you conducted a stable flight?
7. What was the overall comfort level of using this simulator? From 1 to 5, being 1 bad
and 5 great.
8. Do you have any other comments, thoughts, or suggestions you would like to make
regarding this simulation?
If the participants are not comfortable with the simulator, it can indicate that there might
have been decision-making errors due to the discomfort level, instead of their full
capabilities of operating it.
Once all participants had their setup defined and after having read all documentation,
including the clarification of any possible doubts, the tests of this study were performed.
4.3.6 Data Analysis
After the conclusion of the tests included in this study, the instructor retained the recorded
flight data, together with the routes performed and the duration of each mission attempt.
The post flight questionnaire answers were saved.
Firstly, direct quantitative data was analysed.
The answers to the questionnaire can be found below, in Table 4.3. However, Operator X is
not included in this Post Flight Questionnaire as its answers can be interpreted as biased.
Table 4.3 - Post Flight Questionnaire Answers
Questions Operator
1
Operator
2
Operator
3
1. Are the pitch and bank adjustments difficult to perform? No No No
2. Is the airspeed difficult to maintain? No No No
3. Is the airspeed difficult to set? No No No
4. Were you able to understand the attitude of the aircraft? Yes Yes Yes
5. Is the head tracking distracting (if applicable)? No - No
6. Do you believe you conducted a stable flight? No Yes Yes
7. What was the overall comfort level of using this simulator?
From 1 to 5, being 1 bad and 5 great. 4 4 4

59
8. Do you have any other comments, thoughts, or suggestions you
would like to make regarding this simulation? A B C
Answer A Difficult landing process as it is not possible to verify the at which level the flaps are. Only a certain number of flaps shall be available.
Answer B Flaps position should be visible on the instruments and inhibited when not allowed.
Answer C As it is not possible to identify the flap position, it can lead to inadvertent selection. Flap information shall be visible and if possible, certain positions inhibited during the approach phase.
For each operator, flight times were recorded, as below in Table 4.4.
Table 4.4 - Flight Times Recorded
Operator 1 Operator 2 Operator 3 Operator X
Mission 1 6 minutes 8 minutes and
13 seconds 9 minutes
8 minutes and 32 seconds
Mission 2 10 minutes and
31 seconds 7 minutes and
50 seconds 8 minutes and
43 seconds 8 minutes and
36 seconds
Mission 3 8 minutes and
16 seconds 7 minutes and
38 seconds 8 minutes and
37 seconds 9 minutes and
10 seconds
Operator 3 and Operator X perform the missions with alike durations. Operator 2
accomplishes the missions with a shorter duration, which can be associated with a higher
airspeed verified in the values of the recorded parameter. Operator 1 has a variety of
durations that shall be analysed in detail having in consideration all the recorded
information for those mission attempts.
The recorded routes for each Operator are represented below, from Table 4.5 to Table 4.8.
Table 4.5 - Flight Routes Recorded for Operator 1
Operator 1
Mission 1 Mission 2 Mission 3
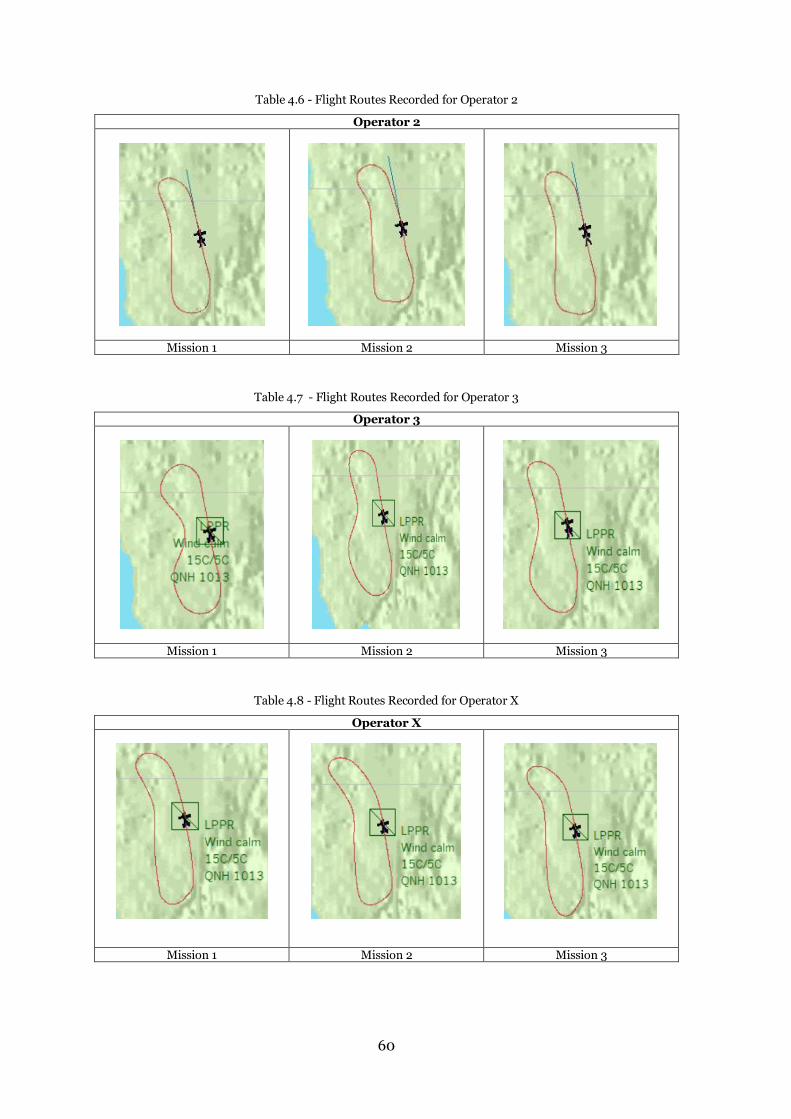
60
Table 4.6 - Flight Routes Recorded for Operator 2
Operator 2
Mission 1 Mission 2 Mission 3
Table 4.7 - Flight Routes Recorded for Operator 3
Operator 3
Mission 1 Mission 2 Mission 3
Table 4.8 - Flight Routes Recorded for Operator X
Operator X
Mission 1 Mission 2 Mission 3

61
From these recorded routes, it is already possible to identify that at least one mission
attempt of Operator 1 was not accomplished, having crashed in-flight, which is compatible
with the duration recorded for that particular attempt, shown on Table 4.4. Operator 2 and
Operator 3 have a similar flight route, while Operator 1 and Operator X also share some
similarities.
It is also relevant to mention that every attempt was considered valid, despite the level of
success. It is acknowledged that the first attempt to fly the URLOG may show some surprise
effect and the last flight may already show more proficiency. However, the last and third
flight could not be considered exclusively for this study as it might not represent the several
attempts since the flying and operational techniques were not corrected during the study.
Any incorrect technique will prevail, and the operator can grow complacent. Complacency
translates that the person conducting routine activities outside SOPs is not aware of actual
dangers or deficiencies of acting outside those standards. Such normalized loss of awareness
of potential dangers on routine operations places safety at risk. [69]
For the analysis of the recorded flight data on spreadsheets, and as each operator’s mission
attempt had a different duration, a common starting and ending point was defined. The
starting point for this analysis corresponds to the anterior instance where the lever position
changes from its initial location. The ending point is the first instance where the indicated
airspeed corresponds to zero knots, as this occurs when the URBLOG stops on the runway.
Each flight was also trimmed: the initial instances with no inputs given and final instances
on the ground where the speed is equal to zero were deleted.
The analysis was divided into two different categories and depending on the category, two
or three different subcategories:
• Flight - where the flight is analysed as a whole, providing information on how stable
it was, if SOPs were followed and if the operator was able to perform the mission
successfully. In this analysis, it is possible to verify the success of the mission;
• Task - where certain mission tasks are analysed in detail and provide more detailed
information on how they were performed.
Two calculations methods used in statistics were used to perform this analysis: the median
and the standard deviation.

62
The median is, according to Eurostat, “(…) the middle value in a group of numbers ranked
by size. It is the number which is exactly in the middle so that 50% of the ranked numbers
are above and 50% are below the median.” [70]. The decision of using the median method
instead of the mean is justified by the mean being the exact average between the numbers
and would not show the tendency between the three flights. The median measures the
central tendency. Two flights towards to a higher number and one flight towards a lower
number will have together a median towards the higher number as it was the most frequent.
The median is calculated as follows:
𝑀𝑑 = 𝑙𝑖 + (𝐸𝑀𝑑−𝐹𝑎𝑛𝑡_𝑎𝑐𝑢𝑚
𝑓𝑀𝑑) ℎ (7)
𝑙𝑖 = 𝑡ℎ𝑒 𝑙𝑜𝑤𝑒𝑟 𝑐𝑙𝑎𝑠𝑠 𝑐𝑜𝑛𝑡𝑎𝑖𝑛𝑖𝑛𝑔 𝑡ℎ𝑒 𝑚𝑒𝑑𝑖𝑎𝑛
𝑓𝑀𝑑 = 𝑓𝑟𝑒𝑞𝑢𝑒𝑛𝑐𝑦 𝑜𝑓 𝑡ℎ𝑒 𝑐𝑙𝑎𝑠𝑠 𝑐𝑜𝑛𝑡𝑎𝑖𝑛𝑖𝑛𝑔 𝑚𝑒𝑑𝑖𝑎𝑛
𝐸𝑀𝑑=
𝑛2
𝑖𝑠 𝑡ℎ𝑒 𝑚𝑒𝑑𝑖𝑎𝑛 𝑒𝑙𝑒𝑚𝑒𝑛𝑡
ℎ = 𝑤𝑖𝑑𝑡ℎ 𝑜𝑓 𝑡ℎ𝑒 𝑐𝑙𝑎𝑠𝑠
𝐹𝑎𝑛𝑡_𝑎𝑐𝑢𝑚 = 𝑙𝑒𝑠𝑠 𝑡ℎ𝑎𝑛 𝑐𝑜𝑚𝑢𝑙𝑎𝑡𝑖𝑣𝑒 𝑓𝑟𝑒𝑞𝑢𝑒𝑛𝑐𝑦
The standard deviation (σ) measures the dispersion of the data around the mean. The more
concentrated, the smaller the standard deviation [71]. It is calculated as below:
𝜎 = √∑(𝑥𝑖−�̅�)2
𝑛−1 (8)
𝑥𝑖 = 𝑖𝑛𝑑𝑖𝑣𝑖𝑑𝑢𝑎𝑙 𝑣𝑎𝑙𝑢𝑒
�̅� = 𝑚𝑒𝑎𝑛 𝑜𝑓 𝑣𝑎𝑙𝑢𝑒𝑠
𝑛 = 𝑛𝑢𝑚𝑏𝑒𝑟 𝑜𝑓 𝑣𝑎𝑙𝑢𝑒𝑠
Having those calculations into consideration, the subcategories of the analysis correspond
to the following:
1. Comparison of the three flights performed by each operator and the consequent
calculation of the median;
2. Comparison of the calculated median of each operator versus the calculated median
of the operator X, including their standard deviation;
3. Comparison of the median of each operator versus the median of the operator X.

63
For the Flight category, only subcategory 1 and 3 are used. For the Task category, all three
subcategories are calculated.
To be recognizable during the analyses, next to each parameter recorded name or
calculation it was added the number correspondent to the mission attempt. Then, following
the same principle, the operator number was added in the name of the median and in the
calculated standard deviation.
Flight Comparison The objective of flight comparison analysis is to verify how stable was the flight, if SOPs
were followed, and if the operator was able to perform the mission successfully.
From Figure 4.4 to Figure 4.10 it is possible to verify the Operator 1 data per mission, that
originated a calculated median value. The same data for other operators is present in
Appendix B - Flight Comparison Data.
Figure 4.4 - Operator 1 missions comparison and median values of vertical speed
Operator 1 has a great amplitude of vertical speed values during each mission (Figure 4.4),
however on the 3rd mission, the values remain between -2000 and 2000 feet per minute,
which can indicate familiarization with the operational and flying technique for this vehicle.
However, it is also possible to identify that on the 1st and 2nd mission attempt, following a

64
peak value, zero value is achieved. This indicates that the vehicle crashed, failing the
mission. Only the 3rd attempt of the mission was successfully performed.
Figure 4.5 - Operator 1 missions comparison and median values of indicated airspeed
During the 1st and 2nd mission attempt, Operator 1 conducts more speed changes in relation
to the 3rd attempt (Figure 4.5). There are 2 peaks on the 1st attempt, the last one
correspondent to a crash as no more speed instances are recorded. On the 2nd attempt, the
last recorded instances are represented by peaks, that lead also to a crash. The 3rd attempt
of the mission was successfully performed, with adequate speeds. The Operator 1 mainly
flies the cruise below or at the recommended cruise airspeed (65 Knots of Indicated Air
Speed, KIAS).
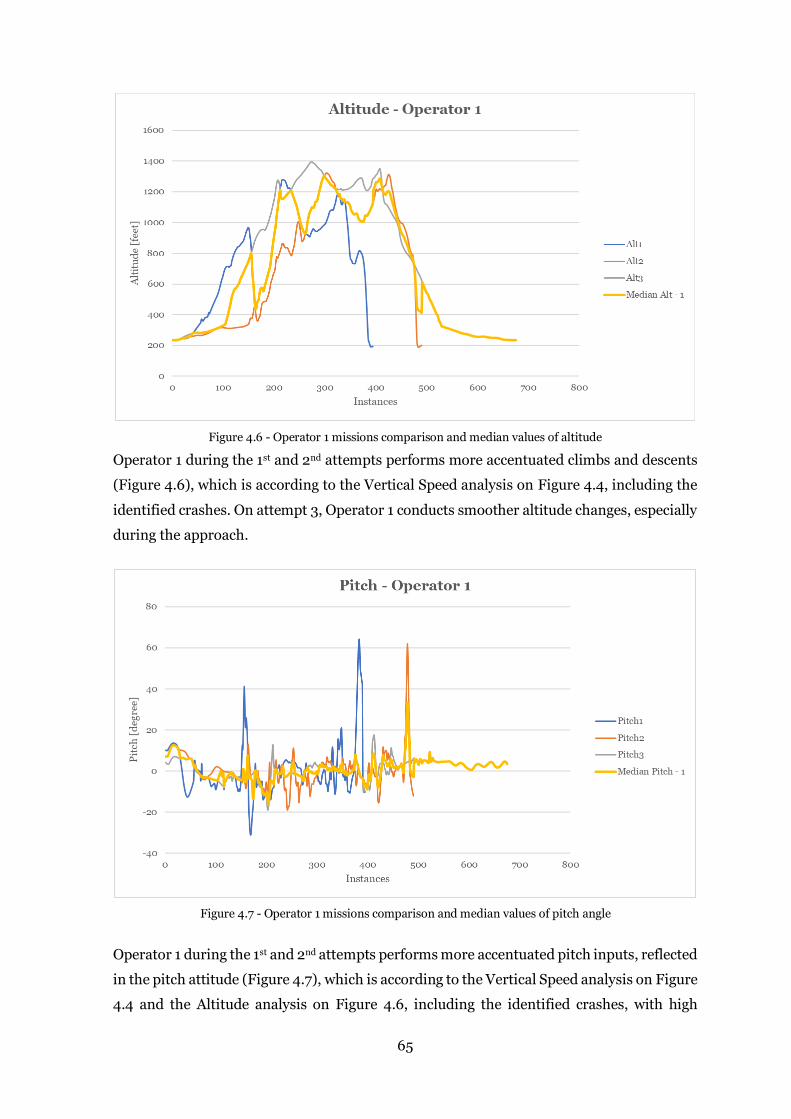
65
Figure 4.6 - Operator 1 missions comparison and median values of altitude
Operator 1 during the 1st and 2nd attempts performs more accentuated climbs and descents
(Figure 4.6), which is according to the Vertical Speed analysis on Figure 4.4, including the
identified crashes. On attempt 3, Operator 1 conducts smoother altitude changes, especially
during the approach.
Figure 4.7 - Operator 1 missions comparison and median values of pitch angle
Operator 1 during the 1st and 2nd attempts performs more accentuated pitch inputs, reflected
in the pitch attitude (Figure 4.7), which is according to the Vertical Speed analysis on Figure
4.4 and the Altitude analysis on Figure 4.6, including the identified crashes, with high

66
maximum values reached on those moments. On attempt 3, Operator 1 performs smoother
pitch changes.
Figure 4.8 - Operator 1 missions comparison and median values of magnetic heading
Operator 1 during the 1st attempts performs a quick heading change (Figure 4.8), that can
be associated with the instances precedent of a crash. On the 2nd and 3rd attempt, the
heading values reached identify that the mission route was followed, but on mission attempt
2, the final approach heading is not maintained for the following instances inputs. This
shows that, although the final approach heading was reached, it was not possible to
maintain, causing a crash during the approach.

67
Figure 4.9 - Operator 1 missions comparison and median values of bank angle
Operator 1 reaches accentuated banks during the 1st and 2nd attempts, representing unstable
flights (Figure 4.9): on the 1st attempt is visible several bank changes during initial climb,
indicating unstable takeoff. Maximum values reached on the attempt 2 represent the crash,
which is can be interpreted as a consequence of the performed unstable flight. On attempt
3 however, the Operator 1 performs smoother bank changes, particularly during the
approach.
Figure 4.10 - Operator 1 missions comparison and median values of lever position

68
Operator 1 performs several lever position adjustments during cruise flight (Figure 4.10):
on the 1st attempt, several quick and extreme changes are performed, one leading to a crash;
on the 2nd attempt, the crash is preceded by a maximum level position, which can indicate
a tentative plan of recovering from an unstable state. On attempt 3 however, the Operator 1
lever inputs are smoother and in line with the SOPs defined. In every attempt, the lever
position for takeoff is correct.
From Figure 4.11 to Figure 4.17 it is possible to verify and compare the median for each
operator.
Figure 4.11 - Comparison of vertical speed median values for all operators
Operator 1 median shows a great amplitude of values, which can be related to the crashes of
the two mission attempts of that Operator (Figure 4.11). Operator 2 has also some variations
when compared to Operator X, especially during initial climb where it is performed with
higher values of vertical speed. Operator 3 median is the most comparable to the Operator
X median.
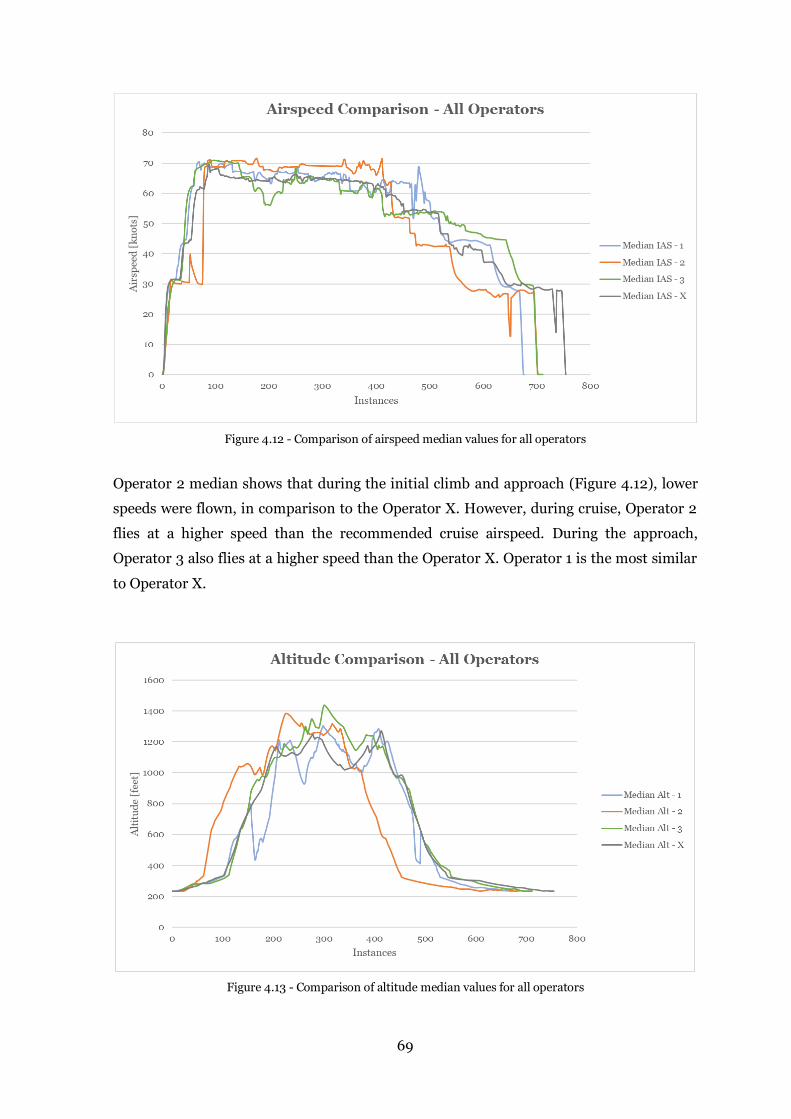
69
Figure 4.12 - Comparison of airspeed median values for all operators
Operator 2 median shows that during the initial climb and approach (Figure 4.12), lower
speeds were flown, in comparison to the Operator X. However, during cruise, Operator 2
flies at a higher speed than the recommended cruise airspeed. During the approach,
Operator 3 also flies at a higher speed than the Operator X. Operator 1 is the most similar
to Operator X.
Figure 4.13 - Comparison of altitude median values for all operators
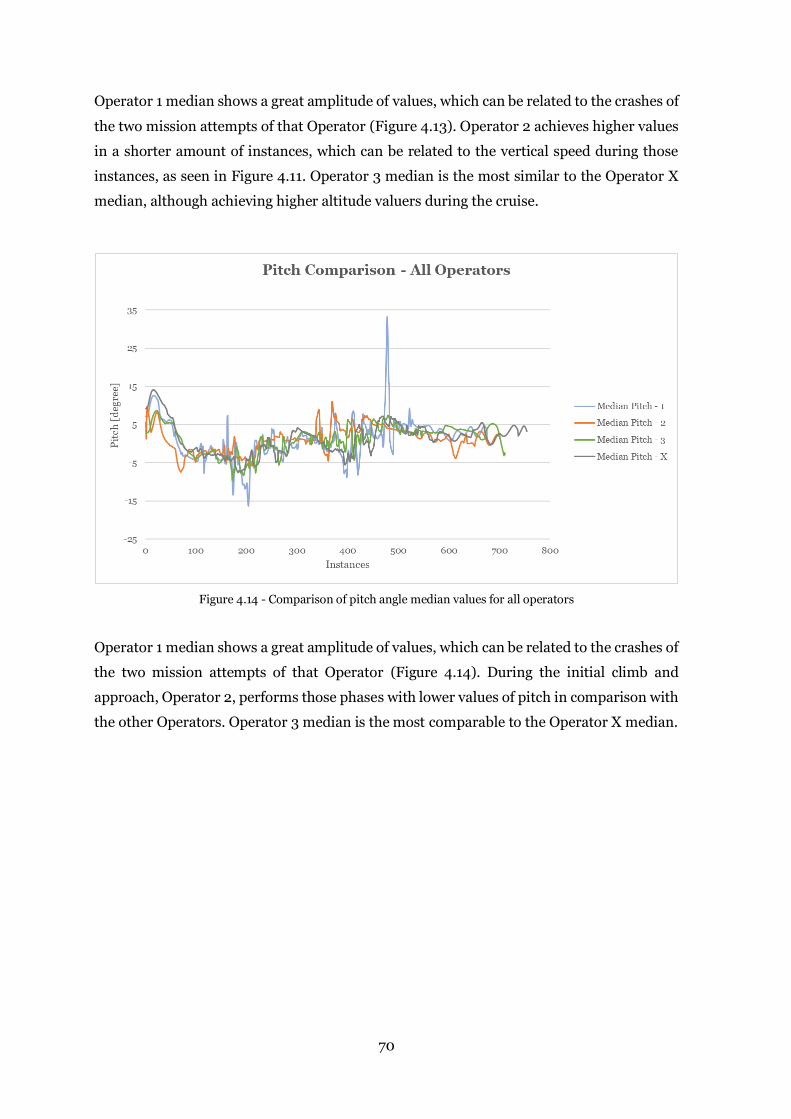
70
Operator 1 median shows a great amplitude of values, which can be related to the crashes of
the two mission attempts of that Operator (Figure 4.13). Operator 2 achieves higher values
in a shorter amount of instances, which can be related to the vertical speed during those
instances, as seen in Figure 4.11. Operator 3 median is the most similar to the Operator X
median, although achieving higher altitude valuers during the cruise.
Figure 4.14 - Comparison of pitch angle median values for all operators
Operator 1 median shows a great amplitude of values, which can be related to the crashes of
the two mission attempts of that Operator (Figure 4.14). During the initial climb and
approach, Operator 2, performs those phases with lower values of pitch in comparison with
the other Operators. Operator 3 median is the most comparable to the Operator X median.

71
Figure 4.15 - Comparison of bank angle median values for all operators
Operator 1 median shows a great amplitude of values of bank, which can be related to the
unstable flights, precedent to crashes (Figure 4.15). During the initial climb and approach,
Operator 2, performs those phases with accentuated values of bank in comparison with the
other Operators. Operator 3 median is the most similar to the Operator X median.
Figure 4.16 - Comparison of magnetic heading median values for all operators
Operator 2 median shows that headings are achieved earlier than other Operator’s medians
(Figure 4.16). This can be associated with the higher cruise speed in which the Operator 2

72
flies, as shown in Figure 4.12, meaning that the heading was achieved more rapidly due the
accentuated banks. Both Operator 1 and Operator 3 medians are similar to the Operator X
median.
Figure 4.17 - Comparison of lever position median values for all operators
Operator 1 median show peaks of lever positions that are precedent to the crashes (Figure
4.17). Operator 2 performs small variations of lever positions trough the flights, with
reduced lever position during the approach. This can be associated with the fact that this
Operator flies the cruise at a higher speed, as seen in Figure 4.12, than the other Operators,
meaning that to reduce speed, the Operator reduced the lever position earlier than the other
Operators. Operator 3 median shows more changes of lever position during cruise than the
Operator X, approaching with higher lever position during the approach. All Operators, set
the takeoff lever position correctly, accordingly to the SOPs. The initial value of 10% can be
related to the sensitivity of the throttle device used.
Task Comparison The objective of task comparison is to analyse it in detail and provide more information on
how they were performed. For such, it is first necessary to define which tasks are of interest
for such and how many instances are necessary to define their period of analysis. Having
into consideration the frequency of the QAR recording and the objectives of the study, the
tasks and instances were defined according to Table 4.9.

73
Table 4.9 - Number of Representative Instances per Task
Mission Task Number of Instances
Vertical Takeoff from runway 35 LPPR 50, from the first recorded instance
1st Gate interception 30 [-15;+15]
2nd Gate interception 30 [-15;+15]
3rd Gate interception 30 [-15;+15]
4th Gate interception 30 [-15;+15]
Landing on runway 35 LPPR 50, from the last recorded instance
To compare the flight data in specific points of the mission, the data from each flight had to
be equally set for the analysis. As a reference, the data was equally spread according to
recorded instances of Operator X, regardless of the number and position of instances in the
recording in each mission attempt.
To analyse the gate interceptions, the Lat and Long recorded values were used. The
coordinates of each flight were compared with the gate’s coordinates, present in Table 4.10,
to find the interception of the gate.
Table 4.10 - Gate Position
GATE 1 GATE 2 GATE 3 GATE 4
Latitude (Decimal Degrees) 41,25955 N 41,24126 N 41,20683 N 41,20768 N
Longitude (Decimal Degrees) 8,69511 W 8,69442 W 8,69074 W 8,67416 W
Minimum Altitude (Feet) 500 1000 1000 700
Heading (Degrees) 259 168 136 017
Although it is understood that for graphic comparison, graphics shall have the same scale
limits, using that visualisation on these analyses would difficult its survey as different
maximum values are reached with variable extreme points.
From Figure 4.18 to Figure 4.24 it is possible to verify the Operator 1 data per mission task,
that originated a calculated median value. The same data for other operators is present in
Appendix C - Task Comparison Data. Tasks were highlighted in the first figure for better
understanding.
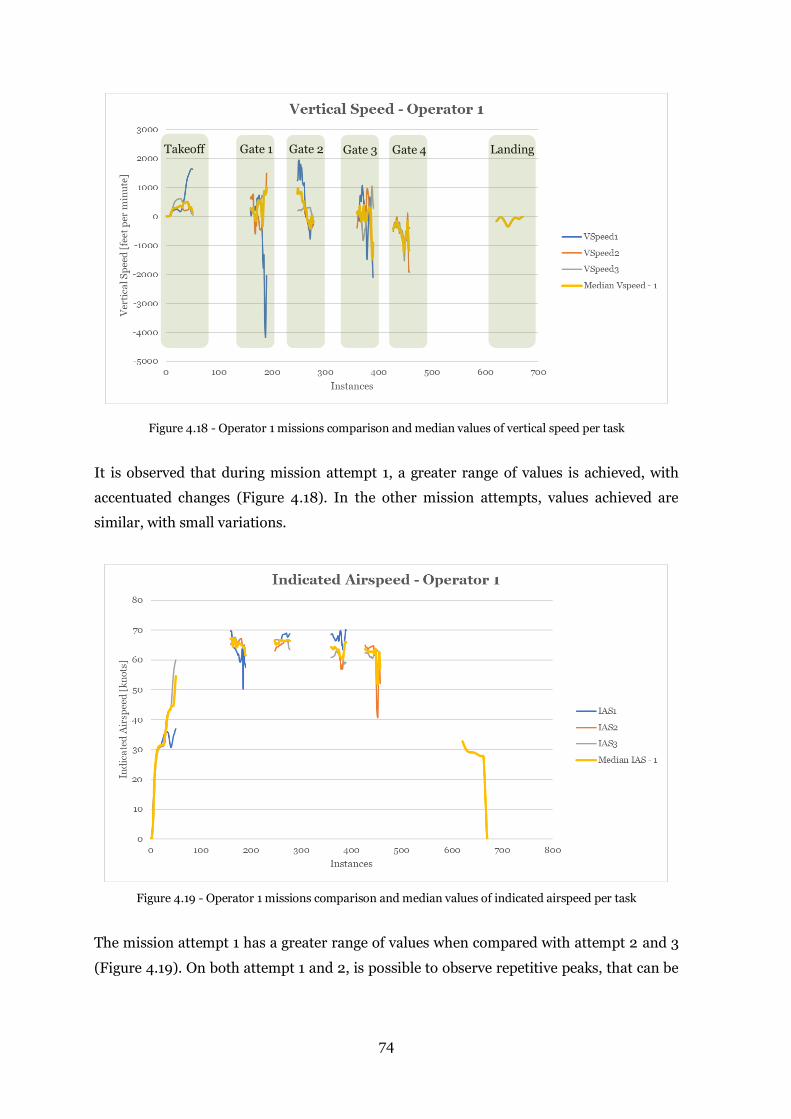
74
Figure 4.18 - Operator 1 missions comparison and median values of vertical speed per task
It is observed that during mission attempt 1, a greater range of values is achieved, with
accentuated changes (Figure 4.18). In the other mission attempts, values achieved are
similar, with small variations.
Figure 4.19 - Operator 1 missions comparison and median values of indicated airspeed per task
The mission attempt 1 has a greater range of values when compared with attempt 2 and 3
(Figure 4.19). On both attempt 1 and 2, is possible to observe repetitive peaks, that can be
Takeoff Gate 1 Gate 2 Gate 3 Gate 4 Landing
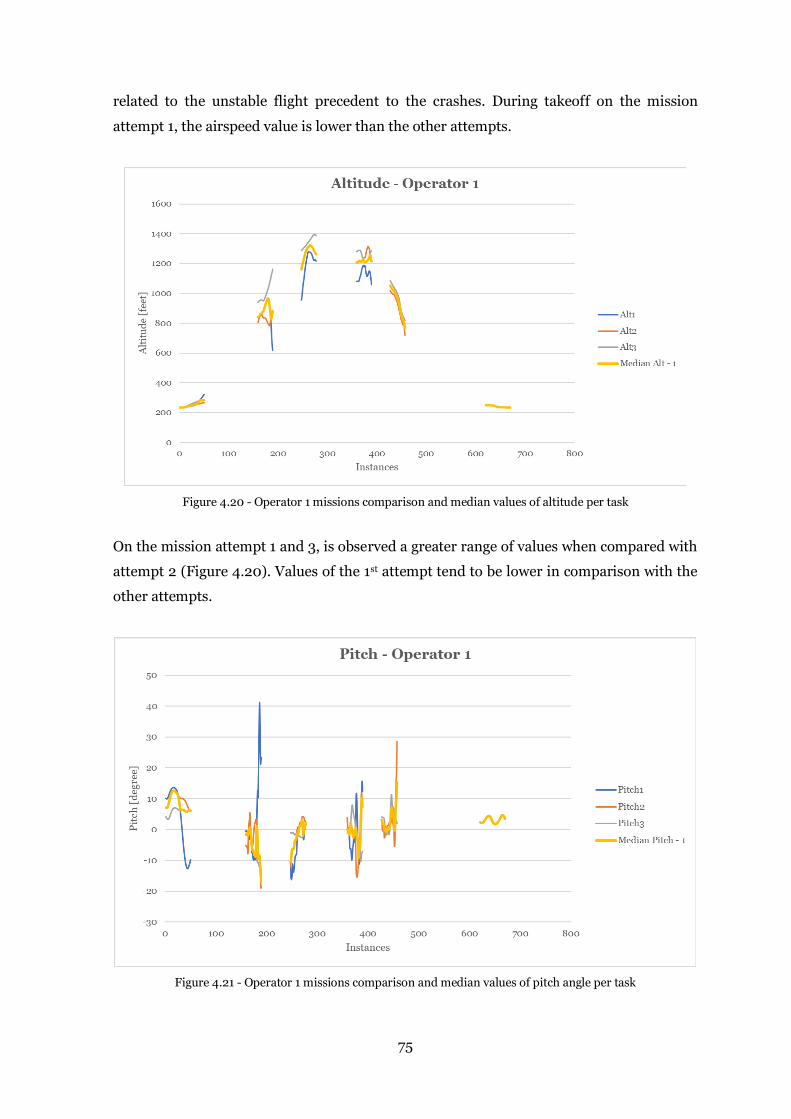
75
related to the unstable flight precedent to the crashes. During takeoff on the mission
attempt 1, the airspeed value is lower than the other attempts.
Figure 4.20 - Operator 1 missions comparison and median values of altitude per task
On the mission attempt 1 and 3, is observed a greater range of values when compared with
attempt 2 (Figure 4.20). Values of the 1st attempt tend to be lower in comparison with the
other attempts.
Figure 4.21 - Operator 1 missions comparison and median values of pitch angle per task

76
On the mission attempt 1 and 2, is observed a greater range of values when compared with
attempt 3, with accentuated peaks (Figure 4.21). This translates an unstable flight on those
two attempts.
Figure 4.22 - Operator 1 missions comparison and median values of bank angle per task
Commonly to Figure 4.21, on the mission attempt 1 and 2, is observed a greater range of
values when compared with attempt 3, with accentuated peaks (Figure 4.22). This translates
an unstable flight on those two attempts.
Figure 4.23 - Operator 1 missions comparison and median values of magnetic heading per task

77
Although in every attempt, the heading gates are reached, on mission 3, is observed a greater
range of values when compared with attempt 1 and 2 (Figure 4.23). This can be related to
the bank attitude observed in Figure 4.22, in which the mission attempt 3 is flown.
Figure 4.24 - Operator 1 missions comparison and median values of lever position per task
On mission attempt 1, it is observed that higher lever positions were set (Figure 4.24).
However, on the interception of gate 1, the values of the 1st attempt vary abruptly, coincident
with an unstable flight. On takeoff, the level position set is according to the SOPs in all
attempts.
From Figure 4.25 to Figure 4.31 it is possible to verify the Operator 1 median data compared
with Operator X for each task, including its calculated standard deviation. The same data
for other operators is present in Appendix C - Task Comparison Data. Tasks were
highlighted in the first figure for better understanding.

78
Figure 4.25 - Operator X vs Operator 1 missions comparison and standard deviation values of vertical speed per task
It is observed that during the interception of the gates, the Operator 1 median, shows a
greater range of values when compared with the median of the Operator X (Figure 4.25).
Thus in those instances, a larger standard deviation is seen. During both takeoff and
landing, the medians show approximate values.
Figure 4.26 - Operator X vs Operator 1 missions comparison and standard deviation values of indicated airspeed per task
Takeoff Gate 1 Gate 2 Gate 3 Gate 4 Landing

79
It is noticed that during the interception of the gate 3 and 4 (Figure 4.26), the Operator 1
median, shows a greater range of values when compared with the median of the Operator
X, because of that, a larger standard deviation is seen. During both takeoff and landing, the
medians show approximate values.
Figure 4.27 - Operator X vs Operator 1 missions comparison and standard deviation values of altitude per task
It is observed that during the interception of the gates 1, 2 and 3 (Figure 4.27), the Operator
1 altitude median, shows accentuated differences when compared with the median of the
Operator X, thus in those instances, a larger standard deviation is seen. During both takeoff
and landing, the medians show approximate values.

80
Figure 4.28 - Operator X vs Operator 1 missions comparison and standard deviation values of pitch angle per task
It is observed that during the interception of the gates (Figure 4.28), the Operator 1 pitch
median shows accentuated differences when compared with the median of the Operator X,
thus in those instances, a larger standard deviation is seen. During both takeoff and landing,
the medians show approximate values.
Figure 4.29 - Operator X vs Operator 1 missions comparison and standard deviation values of bank angle per task

81
It is seen that during the interception of the gates 3 and 4 (Figure 4.29), the Operator 1 bank
median shows accentuated differences when compared with the median of the Operator X,
therefore, a larger standard deviation is noticed. During both takeoff and landing, the
medians show approximate values.
Figure 4.30 - Operator X vs Operator 1 missions comparison and standard deviation values of magnetic heading per task
It is observed that during the interception of the gates 3 and 4 (Figure 4.30), the Operator 1
bank median shows major differences when compared with the median of the Operator X,
thus in those instances, a larger standard deviation is noted. When associated with Figure
4.29, is coherent and shows that the Operator 1 was turning while intercepting the gates.
During both takeoff and landing, the medians show approximate values.

82
Figure 4.31 - Operator X vs Operator 1 missions comparison and standard deviation values of lever position per task
It is observed that during the interception of the gates the Operator 1 has higher values of
lever position when compared with Operator X (Figure 4.31). This is connected to the
indicated airspeed for those particular moments, which is according to Figure 4.26. During
both takeoff and landing, the medians show approximate values.
From Figure 4.32 to Figure 4.38 it is possible to verify and compare the median for each
Operator. Tasks were highlighted in the first figure for better understanding.

83
Figure 4.32 - Comparison of vertical speed median values for all Operators per task
It is observed that the Operator 1 and 2 perform differently from Operator X (Figure 4.32).
Operator 1 performs the interception of gate 1 and 2 reaching high values of vertical speed.
During the takeoff, the Operator 2 reaches accentuated positive values of vertical speed, and
during the interception of gate 3 and 4, the Operator 2 has a great amplitude of values,
reaching accentuated negative values. During the landing, the Operator 2 has an opposite
median when compared with Operator X.
Figure 4.33 - Comparison of airspeed median values for all Operators per task
Takeoff Gate 1 Gate 2 Gate 3 Gate 4 Landing

84
For the airspeed (Figure 4.33), it is possible to observe that in most tasks, Operators perform
in similarity to Operator X. However, it is noticed that Operator 2, has airspeed variations
during takeoff and during cruise, flies at a higher airspeed than the recommended airspeed
for cruise flight.
Figure 4.34 - Comparison of altitude median values for all Operators per task
Regarding altitude (Figure 4.34), it is possible to observe that Operators perform in
similarity to Operator X.
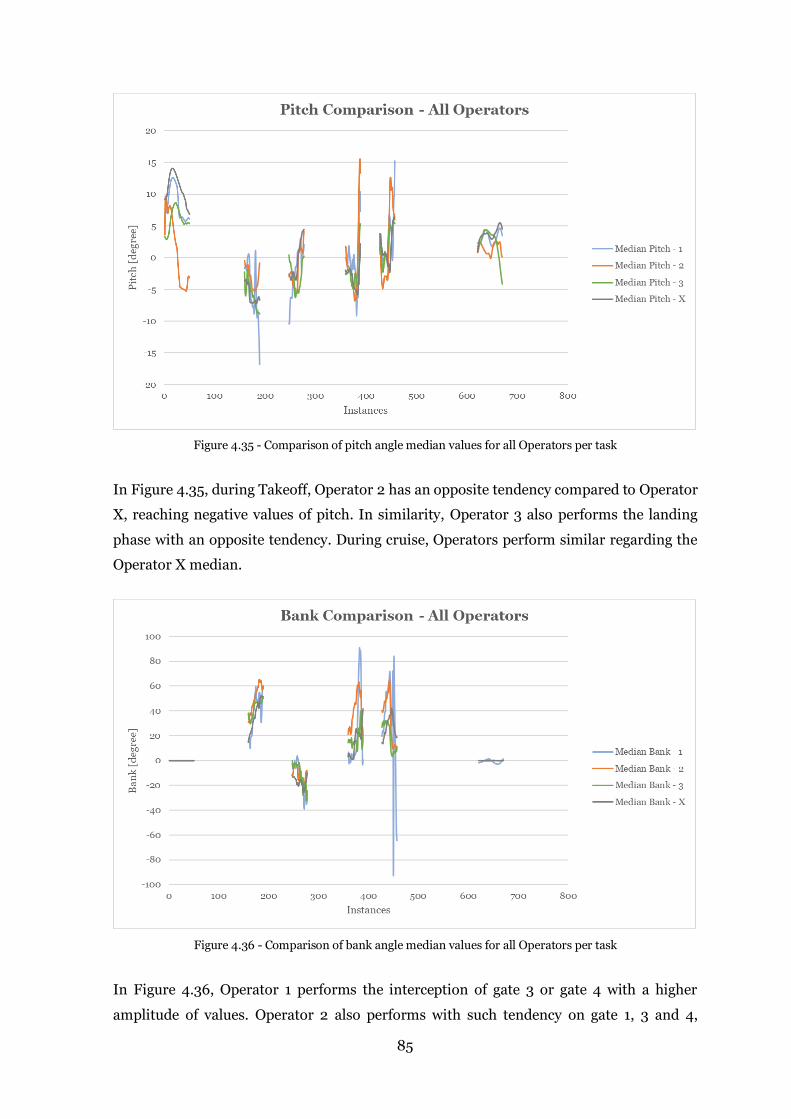
85
Figure 4.35 - Comparison of pitch angle median values for all Operators per task
In Figure 4.35, during Takeoff, Operator 2 has an opposite tendency compared to Operator
X, reaching negative values of pitch. In similarity, Operator 3 also performs the landing
phase with an opposite tendency. During cruise, Operators perform similar regarding the
Operator X median.
Figure 4.36 - Comparison of bank angle median values for all Operators per task
In Figure 4.36, Operator 1 performs the interception of gate 3 or gate 4 with a higher
amplitude of values. Operator 2 also performs with such tendency on gate 1, 3 and 4,

86
although reaching lower values in comparison. The remaining tasks are performed in great
similarity of Operator X.
Figure 4.37 - Comparison of magnetic heading median values for all Operators per task
In Figure 4.37, that on the interception of gate 3, Operators accomplish the missions with
broader variations of heading in comparison with Operator X. However, in all other tasks,
they are in line with the Operator X median values.
Figure 4.38 - Comparison of lever position median values for all Operators per task

87
On Figure 4.38, Operators share the same lever positions values during takeoff and landing,
however, Operator 3 conducts lever changes during the landing. During gate interception,
it is possible to observe that Operator 2 values are higher, which can be connected to the
airspeed flown during cruise, as seen in Figure 4.33. Operator 3 has the closest values to
Operator X, although, on the interception of gate 2, Operator 1 performs closer to Operator
X median.
4.3.7 Results
From the data analysed on the Flight Comparison sub-category, a table translating the
success of the mission and flight stabilization were defined, Table 4.11 and Table 4.12
respectively.
Table 4.11 - Mission Success per Operator and per Attempt
Operator 1 Operator 2 Operator 3 Operator X
Mission Attempt 1 Failed Successful Successful Successful
Mission Attempt 2 Failed Successful Successful Successful
Mission Attempt 3 Successful Successful Successful Successful
Table 4.12 - Flight Stabilization per Operator and per Attempt
Operator 1 Operator 2 Operator 3 Operator X
Mission Attempt 1 Unstable Stable Stable Stable
Mission Attempt 2 Unstable Stable Stable Stable
Mission Attempt 3 Stable Stable Stable Stable
By analysing the tables, together with the examination of the routes in every attempt, it was
concluded that most Operators successfully performed the missions attempts according to
the SOPs. Operator 1 was the one that experienced the most difficulties, with two unstable
flights that lead to a crash. However, on the last mission attempt, Operator 1 successfully
performs the mission, having a similar duration of the mission attempts of Operator X.
Operator 2 tended to fly above the recommended cruise speed, although reducing the
airspeed for approach in an earlier stage than the remaining Operators. The shorter
duration of mission attempts of Operator 2 is thus justified by the higher airspeed during
cruise flight.
Regarding the task comparison analysis of the data collected, by having in consideration the
data shown on the several figures, together with the calculated medians and standard
deviations, a maximum value of deviation was highlighted on Table 4.13.

88
Table 4.13 - Standard Deviation Maximum per Variable and per Operator in relation to Operator X
Operator 1 Operator 2 Operator 3
Vertical Speed 795,133 950,451 373,559
Indicated Airspeed 5,1675 13,4755 14,177
Altitude 141,938 89,5965 114,28
Pitch 5,133 7,9545 4,342
Bank 62,04375 20,823 18,5745
Magnetic Heading 34,7355 25,1645 22,76
Lever Position 24,9985 36,371 45,0545
Here, it is possible to note that Operator 3 had the lower value of standard deviation in
relation to the Operator X in most parameters, achieving the closest median values. Both
Operator 2 and Operator 1 achieve extreme values when compared with both Operator 3
and Operator X.
4.4 Conclusions
Throughout this chapter, techniques for a training programme were explored, including
verification and validation methods for the programme applicable to the synthetic
environment designed on Chapter 3 - Case Study I: Development of the Synthetic
Environment for URBLOG.
This verification and validation were supported by a Human In the Loop (HITL) study,
conducted by three operators with different backgrounds. Operators followed an operating
manual of the vehicle and were asked to conduct and repeat a mission developed in the flight
simulator software were the URBLOG was implemented. This mission was composed by a
flight, intercepting several gates composing a route. Flight parameters, route and duration
were recorded for post-analysis.
Due to COVID19 contingencies, one of the operators was not able to perform the missions
on the synthetic environment designed, therefore using alternative devices within the
requirements defined.
Operators were asked to answer questionnaires regarding their background and specific
questions regarding the mission completion.
Once the missions were performed, data was analysed, including recorded parameters per
flight and task, originating 91 graphics. That data was compared with that of Operator X,
representing the most optimum-relative values for a satisfactory comparison.

89
Having that in consideration, it is concluded that:
• The URBLOG Operating Manual was effective, providing enough information for
the correct interpretation of the vehicle’s characteristics and control, the synthetic
device environment, including the hardware, instruments, and head tracking device,
if applicable;
• As the devices used by Operator were not the same, the mission was performed with
different hardware equipment sensibilities, providing small differences in the
recorded parameters. That is visible on the Lever Position parameter analysed;
• The level of comfort appointed by the operators during the mission execution
indicates that the synthetic environment designed was adequate for the vehicle;
• Only Operator 2 did not use the head tracking device for the control of the OTW of
the vehicle. However, it did not negatively affect the accomplishment of the
missions. Operators that used the device did not find it distracting;
• Operator 1 was the one with the most difficulties in performing the mission. Even
so, the mission attempt 3 was performed according to the SOPs and within expected
parameter amplitude. Tasks were correctly performed, and the duration of the flight
was within the recorded durations of Operator X. It is then possible to assume that
subjects with no flying experience, either real, virtual or from aero models, can, in a
short period, adjust to the devices used and perform the mission’s tasks, according
to the operating manual of the vehicle. This can be enhanced with dedicated training
for unexperienced subjects;
• Although Operator 2 real flight experience was shown on the approach technique,
reducing the speed on an earlier stage, Operator 3, without any real flight experience
but increased virtual experience, achieved better mission results. It is then seen in
the sample of this study that subjects with more virtual experience can react better
on such synthetic environment than real-life pilots;
• In terms of demographics, both male operators successfully performed all mission
attempts, while the only inexperienced female subjects did not. As Operator X is also
female, it is not possible to correlate the gender in terms of aptitude. The oldest
subject was Operator 1, only successfully performing one mission attempt. The
second oldest subject successfully performed all mission attempts. Again, it is not
possible to correlate age with aptitude as only one element of each age range
performed the study;
• As for recommendations and suggestions, all operators suggested improvements on
the approach and landing phase, referring that the flap position should be visible on
the instruments and inhibition of flap positions during certain flight phases should
happen, especially during the landing phase.

90
The training programme developed within this case study provided successful results,
therefore, verifying and validating both programme and the synthetic environment
designed.
As the current instruments chosen for the virtual cockpit do not show the flaps position, a
further study of the possible addition of new instruments in this virtual cockpit or different
hardware interfaces integrating this function need to be considered. Changes to the aircraft
configuration file need to be realised so flap position inhibition can occur. As these changes
would be time-consuming and require a new HITL study to validate and verify their use,
they are not included in this work.

91
Conclusions
5.1 Dissertation Synthesis
As technology evolves, new and better solutions appear in aviation. With a new interest in
airships and their flight characteristics, they can be integrated in remote pilot aircraft
systems (RPAS). For that reason, this work focused on these topics, interconnecting them
with synthetic environments as flight training devices, remote pilot stations, training of
remote operators and applicable human factors. After conducting a review of current
aspects of those topics, two case studies were approached.
The first case study consisted of the development of a synthetic environment for an
unmanned airship prototype, integrated in a mobility solution. This airship, the UBRLOG,
had a small number of information available. To simulate its main characteristics and
purpose, a model of the URBLOG was firstly designed on CAD software, which was followed
by the analysis of several flight simulator software options, with their advantages and
disadvantages taken in consideration. An option was chosen and the URBLOG was then
implemented on Prepar3D® software, with certain limitations.
To allow the simulation of the operation of the vehicle, a virtual cockpit was studied, where
several instruments were applied, together with the necessary hardware interfaces for its
synthetic environment. This was developed considering the operator’s point of view and the
human factors considerations applicable to cockpit design and remote pilot stations (RPS).
Two main types of instruments were chosen, and a HUD was adapted for better
interpretation on an OTW view. The adapted HUD and the head-tracking device to control
the OTW view were chosen to enhance the sensing of the operator. Both instruments and
interfaces were defined to support one of the main principles of flying a RPA, which is
Aviate. A layout was designed, taking into account its use as a flight training device (FTD)
and as part of the remote control station (RPS) of the vehicle. It consists of a personal laptop
computer with Prepar3D® installed, together with a HOTAS flight control system, a head
tracking device, and an additional screen. It was then implemented as synthetic
environment for further application.
On a second case study, a basic training programme was produced to train the unmanned
vehicle operator of that station or device. It was elaborated to allow the appropriate
operation of the synthetic environment and to enable the verification and validation of both
programme and environment. A human in the loop (HITL) study was conducted with

92
subjects from different backgrounds, which consisted of the completion of a virtual mission
according to the operating manual of the vehicle elaborated. This manual included the
characteristics and limitations of the URBLOG, the standard operational procedures (SOPs)
for its correct operation as well as for instructions for the head tracking device configuration
and virtual mission. This mission was developed on the flight simulator software where the
URBLOG was implemented and it was repeated three times. It was composed by a flight,
intercepting several gates composing a route. Due to Worldwide contingencies, only three
test subjects were able to perform the study, one being performed with alternative hardware
interfaces. Operators were asked to answer questionnaires regarding their background and
specific questions regarding the mission completion. Flight parameters, route performed,
and duration were recorded for post-analysis.
The post-analysis comprises the comparison of the recorded data with an optimum-relative
reference from one external experienced operator. Standard deviations and medians of and
between operators were calculated, originating 91 graphics for enhanced analysis.
Conclusions were achieved regarding both training programme, the synthetic environment
and possible background influence when choosing an operator for this system.
The training programme developed provided successful results, therefore, verifying and
validating both programme and the synthetic environment designed. The URBLOG
operating manual was effective, presenting enough information for the correct
interpretation of the vehicle’s characteristics and control on that synthetic environment.
The level of comfort appointed by the operators during the execution of the mission also
indicated that the synthetic environment designed was adequate for the vehicle. The results
of the study suggest that subjects with more virtual experience can react better on such
synthetic environment than real-life pilots, but subjects with no flight experience
whatsoever can in a short period adapt and perform the tasks according to the SOPs.
As for recommendations and suggestions, all operators suggested improvements on the
approach and landing phase, referring that the flap position should be visible on the
instruments and inhibition of flap positions during certain flight phases should happen,
especially during the landing phase. These enhancements are pertinent and might lead to
an improvement in the controllability of the vehicle, but as these changes would be time-
consuming as they require further research regarding interfaces and a new HITL study to
validate and verify their use, they are not included in this dissertation.

93
5.2 Concluding Remarks
During this work, the unmanned URBLOG prototype of the Multifunctional Air Transport
System was successfully developed on flight simulation training device that can also be used
as part of the remote pilot station (RPS) of this Remotely Piloted Aircraft System (RPAS).
This simulation on a synthetic environment was verified and validated in terms of the
operator’s point of view, having in consideration several human factors for these systems,
by a training programme that was also validated for further use. The objectives of this
dissertation were thus clearly achieved. However, due to the few information of the vehicle
itself, a series of assumptions were made to be able to illustrate its concept in simulation.
For that reason, certain software and processes were chosen but if more data were available,
other paths could have been taken. This would not only impact the virtual and hardware
interface of the synthetic environment itself, but also the vehicle operating procedures and
limitations that were considered in the training programme. Certain aspects of the vehicle
could not be implemented as the propulsion of the rotors installed on wings and the docking
of the device, as it is only controllable above ground level (AGL).
The results achieved on the Human In The Loop (HITL) suggest interesting conclusions
regarding the background experience required on an operator of this kind of system,
although further studies on that matter shall be performed. It is also recognized the use of
a sample of data of a single operator (Operator X) for the comparison of data is limited and
might induce misleading results. Enhancements suggested by the test subjects are pertinent
and might lead to an improvement in the controllability of the vehicle.
5.3 Prospects for Future Work
As mentioned at the beginning of this work, synthetic environments like flight training
devices can be easily adequate for different types of virtual, physical, or procedural changes,
when compared with real implementation on the vehicle or system. Being so, future
developments of this work can be focused on the following items:
• Implement the proposed suggestions of the HITL study conducted;
• Improve the URBLOG’s model in order to simulate propulsion from the rotors in all
phases of flight, allowing stationary flight for enhanced vertical takeoff and landing.
Include both rudder and trim control to the model;
• Develop a landing gear system or landing struts within this design prototype to allow
the docking of the vehicle;

94
• Implement this synthetic environment on a desktop computer, with further graphic
possibilities to include additional screens for OTW view, preferably allowing a 180º
view. For this, it is recommended that the HUD stays in a fixed position instead of
moving with the view of the operator;
• Gather data from proficient RPAS pilots on this synthetic environment and
introduce it on the HITL flight data comparisons, including a higher number of test
subjects as well;
• Implement the URBLOG in other flight simulator software once more data is
available and compare results, using the same RPS and training programme, with
adequate operational changes;
• Further study of the impact of the head tracking device and touch screens in this
environment;
• Inclusion of other functionalities for automated flight, as the auto-pilot, analysing
its effect on the operator monitoring skills; and implement navigation-related
requirements;
• Applicate the conceptions achieved on a real-life URBLOG RPAS system.

95
References
[1] C. Neal, ‘Cargo Airships: an opportunity for airports’, International Airport Review,
Jul. 18, 2017. https://www.internationalairportreview.com/article/37170/cargo-
airships/ (accessed Dec. 08, 2019).
[2] R. Macário, V. Reis, J. Silva, P. Gamboa, and J. Neves, ‘SISTEMA DE TRANSPORTE
AÉREO MULTIFUNCIONAL’, PT 108532 A, Dec. 05, 2016.
[3] R. Macário, V. Reis, J. Silva, P. Gamboa, and J. Neves, ‘MULTIFUNCTIONAL AIR
TRANSPORT SYSTEM’, WO 2016/195520 Al, Dec. 08, 2016.
[4] L. N. Martins, L. G. Trindade, J. Neves, J. Silva, and K. Bousson, ‘Insights and
Challenges of Flight Simulation Systems in Air Transportation.pdf’, presented at the
ICEUBI15 International Conference on Engineering, Covilhã, Portugal, Dec. 2015.
[5] C. Benac, ‘A380 SIMULATION MODELS’, Feb. 21, 2003.
[6] EASA, ‘Approved Training Organisations & Flight Simulation Training Devices’.
EASA, 2018, pp5.
[7] I. Strachan, ‘RAeS Simulation Initiative Praised in Montréal’, 2008.
[8] R. Adams, ‘Time for Change’, Civil Aviation Training, Jan. 17, 2019.
https://www.civilaviation.training/regulatory/time-for-change/ (accessed Dec. 18,
2019).
[9] EASA, ‘Certification Specifications for Aeroplane Flight Simulation Training Devices
— Issue 2’. EASA, May 2018.
[10] ‘Circular de Informação Aeronáutica 10/13: Qualificacao FSTDs’. Apr. 08, 2013.
[11] Koblen and Kovacova, Selected Information on Flight Simulators - Main
Requirements, Categories and their Development, Production and using for Flight
Crew Training in the both Slovak Republic and Czech Republic conditions, vol. 4.
2012.
[12] B. & M. www.benes-michl.cz, ‘Airbus A320 Full Flight Simulator | Czech Aviation
Training Centre’. https://www.catc.cz/facilities-anddevices/airbus-a320-full-flight-
simulator/ (accessed Apr. 27, 2020).
[13] ‘ELITE Simulations Solutions AG’. https://www.flyelite.ch/en/ (accessed Apr. 27,
2020).
[14] FAA, ‘FAA Approval of Aviation Training Devices and Their Use for Training and
Experience’. Federal Aviation Administration, Sep. 12, 2018.
[15] N. D’Alessandro, ‘Transference of PC- based simulation to aviation training: issues in
learning’, p. 47.

96
[16] T. Dubois, ‘Virtual Reality, Full-Motion Simulator now in service’, Vertical Magazine,
Oct. 07, 2019. https://www.verticalmag.com/news/virtual-reality-full-motion-
simulator-now-in-service/ (accessed Dec. 18, 2019).
[17] G. A. Khoury and J. David Gillett, Airship Technology. Cambridge University Press,
1999.
[18] Zeppelin, ‘Highest Level of Comfort, with Maximum Safety.’, ZEPPELIN NT Die
Schonste Art zu Fliegen. https://zeppelin-nt.de/en/zeppelin-NT/technology.html
(accessed Dec. 18, 2019).
[19] ‘Remotely Piloted Aircraft system (RPAS) Concept of OperationS (CONOPS) for
InternatIonal IFR Operations’. ICAO.
[20] ‘Remotely Piloted Aircraft Systems - RPAS’, Europeaan Defence Agency, Sep. 30,
2019. https://www.eda.europa.eu/what-we-do/activities/activities-search/remotely-
piloted-aircraft-systems---rpas (accessed Dec. 18, 2019).
[21] A. Hobbs and B. Lyall, ‘Human Factors Guidelines for Remotely Piloted Aircraft
System Remote Pilot Stations’. NASA, Jul. 2016.
[22] ‘Remote Pilot Station’, ZHAW Centre for Aviation ZAV.
https://www.zhaw.ch/en/engineering/institutes-centres/zav/aviation-
operations/human-factors-engineering/remote-pilot-station/ (accessed Dec. 18,
2019).
[23] ‘UAV Factory – Unmanned Platforms and Subsystems’, UAV Factory.
https://www.uavfactory.com/product/16 (accessed Dec. 18, 2019).
[24] ‘Advanced Cockpit GCS’, General Atomics Aeronautical Systems Inc. http://www.ga-
asi.com/advanced-cockpit-gcs (accessed Dec. 18, 2019).
[25] ‘Standarisation of Remote Pilot Stations of RPAS’. AIRBUS, 2019.
[26] S-PLANE, ‘S-PLANE Automation on Twitter’, Twitter.
https://twitter.com/splaneauto/status/1082535764750188544 (accessed Dec. 18,
2019).
[27] ‘RPAS Pilot Training and Certification’, SKYbrary Aviation Safety.
https://www.skybrary.aero/index.php/RPAS_Pilot_Training_and_Certification
(accessed Dec. 26, 2019).
[28] D. A. Vincenzi, ‘Automation and Workload in Aviation Systems’, Embry-Riddle
Aeronaut. Univ., p. 31.
[29] A. E. Dillard, ‘Validation of Advanced Flight Simulators for Human-Factors
Operational Evaluation and Training Programs’. Dec. 09, 2002.
[30] ‘Monitoring Matters: Guidance on the Development of Pilot Monitoring Skills’, CAA.
[31] NIT, ‘Urblog Airship Concept’. 2014.

97
[32] Blender, ‘Blender’, blender.org. https://www.blender.org/about/ (accessed Dec. 18,
2019).
[33] W. Jaworski, ‘Virtual Aircraft: The complete guide’. http://airplanes3d.net/wm-
000_e.xml (accessed Dec. 18, 2019).
[34] kpgamemods, ‘How To Use Blender For Making Flight Simulator X Models (FSX)
Blender2FSX’, Aug. 06, 2014. https://www.youtube.com/watch?v=mJQAmq4tn8w
(accessed Dec. 18, 2019).
[35] L. G. Trindade, ‘Simulação Numérica de um Veículo Aéreo: Determinação dos
Coeficientes de Sustentanção, Resistência Aerodinâmica e de Momento de Arfagem’,
Universidade da Beira Interior, Covilhã, Portugal, 2017.
[36] M. Zyskowski, ‘Aircraft Simulation Techniques Used in Low-Cost, Commercial
Software’, presented at the AIAA Modeling and Simulation Technologies Conference
and Exhibit, Austin, Texas, Aug. 2003, doi: 10.2514/6.2003-5818.
[37] ‘Lockheed Martin - Prepar3D’. https://www.prepar3d.com/ (accessed Dec. 18, 2019).
[38] ‘X-Plane 11 Flight Simulator | More Powerful. Made Usable.’ https://www.x-
plane.com/ (accessed Dec. 18, 2019).
[39] ‘FlightGear Flight Simulator Features’, FlightGear.
https://www.flightgear.org/about/features/ (accessed Dec. 18, 2019).
[40] G. Aschauer, A. Schirrer, and M. Kozek, ‘Co-Simulation of Matlab and FlightGear for
Identification and Control of Aircraft’. Elservier, 2015.
[41] ‘FS model edition and design’. https://www.aero.sors.fr/fsairfile.html (accessed Apr.
13, 2020).
[42] ‘AirWrench for Microsoft Flight Simulator’.
http://www.flight1.com/products.asp?product=airwrench (accessed Dec. 18, 2019).
[43] ‘Add-On Installation – Prepar3D’. https://www.prepar3d.com/add-ons/ (accessed
Apr. 14, 2020).
[44] Federal Aviation Administration (FAA), ‘Aviation Maintenance Technician Handbook
- Airframe’, vol. 2, p. 564, 2018.
[45] kasizn, ‘Gyro instrument (Vacuum / electric)’.
https://blog.naver.com/kasizn/220037994768 (accessed Apr. 26, 2020).
[46] ‘Traditional Six Pack’. http://clayviation.com/2017/01/11/airplane-instrument-
basics-the-six-pack/) (accessed Mar. 15, 2020).
[47] ‘Avionics & Instruments’. https://www.cfinotebook.net/notebook/avionics-and-
instruments/avionics-and-instruments (accessed May 23, 2020).
[48] Advanced Avionics Handbook. Federeal Aviation Administration (FAA), 2009.

98
[49] S. Romaniuk, Z. Gosiewski, and L. Ambroziak, ‘A Ground Control Station for the UAV
Flight Simulator’, Acta Mech. Autom., vol. 10, no. 1, pp. 28–32, Mar. 2016, doi:
10.1515/ama-2016-0005.
[50] D. C. Foyle and B. L. Hooey, Eds., Human Performance Modeling in Aviation. New
York: CRC Press/Taylor & Francis Group, 2008.
[51] B. Kellogg, ‘gaHUD’, Flight Sim.
https://www.flightsim.com/vbfs/fsview.php?do=list&fid=207686 (accessed Mar. 15,
2020).
[52] G. A. Fontaine, ‘Effect of Joystick Versus Control Yoke Use on Personal Computer
(PC) Flight Training: A Comparative Analysis’, 1993.
[53] International Federation of Air Line Pilots’ Associations (IFALPA), ‘Flight Deck
Design’. 2013.
[54] ‘How to Sit at your Desk Correctly’, nhs.uk, Apr. 26, 2018. https://www.nhs.uk/live-
well/healthy-body/how-to-sit-correctly/ (accessed Mar. 15, 2020).
[55] ‘FaceTrackNoIR V200’. http://www.facetracknoir.nl/ (accessed Mar. 15, 2020).
[56] ‘Duet Display’, App Store. https://apps.apple.com/us/app/duet-
display/id935754064 (accessed Mar. 15, 2020).
[57] Douglas Andrew Larson, ‘Multi-Dimensional Assessment Of Professional
Competence During Initial Pilot Training’, University of Colorado, 2017.
[58] Airbus, A330/A340 Flight Crew Training Manual. 2019.
[59] ‘Standard Operating Procedures and Pilot Monitoring Duties for Flight Deck
Crewmembers’. Federal Aviation Administration (FAA), Oct. 01, 2017.
[60] I. Barshi, R. Mauro, A. Degani, and L. Loukopoulou, ‘Designing Flightdeck
Procedures’, p. 81, Oct. 2016.
[61] Simulated Voyages: Using Simulation Technology to Train and License Mariners.
Washington, DC: The National Academies Press, 1996.
[62] K. Williams, ‘Aviation Human-in-the-Loop Simulation Studies: Experimental
Planning, Design, and Data Management’, FAA, p. 86, Jan. 2014.
[63] ‘IVAO - International Virtual Aviation Organization’. https://www.ivao.aero/
(accessed Apr. 20, 2020).
[64] Airbus, A330/A340 Flight Crew Operating Manual. 2020.
[65] María Rodríguez Montes, ‘Guía de Simulador de RQ-4A Global Hawk - Flight
Simulator Version 1.0’. Universidad Politécnica de Madrid, Jul. 2016.
[66] GARMIN, ‘G1000 Integrated Flight Deck Pilot’s Guide - Cessna Nav III’. Oct. 2011.
[67] Lockheed Martin Corporation, ‘Prepar3D SimDirector Overview’, 2015.
http://www.prepar3d.com/SDKv2/LearningCenter/getting_started/mission_creatio
n/simdirector_overview.html (accessed Apr. 24, 2020).

99
[68] Alex Shag, ‘Flight Simulator Quick Access Recorder and Analyzer (FSQAR)’,
FSDeveloper, 2016. https://www.fsdeveloper.com/forum/resources/flight-simulator-
quick-access-recorder-and-analyzer-fsqar.166/ (accessed Apr. 26, 2020).
[69] ‘The Human Factors “Dirty Dozen” - SKYbrary Aviation Safety’, Mar. 21, 2020.
https://www.skybrary.aero/index.php/The_Human_Factors_%22Dirty_Dozen%22#
Complacency (accessed Jun. 09, 2020).
[70] Eurostat, ‘Statistical concept - Mean and median - Statistics Explained’, Jan. 10,
2020. https://ec.europa.eu/eurostat/statistics-
explained/index.php/Beginners:Statistical_concept_-_Mean_and_median (accessed
Jun. 09, 2020).
[71] ‘Standard Deviation - European Commission’.
https://datacollection.jrc.ec.europa.eu/wordef/standard-deviation (accessed Jun. 12,
2020).

100

101
Appendix A - URBLOG OPERATING MANUAL
Version 1.0
URBLOG
OPERATING MANUAL
Version 1.0
For the model implemented in the MSc dissertation:
Development of a Flight Simulation Training Device and Remote Pilot Station:
The URBLOG Unmanned Hybrid Airship Vehicle Case
Universidade da Beira Interior
Integrated MSc in Aeronautical Engineering
Laura Sofia Nobre Martins
Under Supervision of: Jorge Miguel dos Reis Silva
April 2020

102
Contents
1 Introduction ............................................................................................................... 103
2 Aircraft Specifications ............................................................................................... 104
3 Installation ..................................................................................................................105
4 Systems Guide ........................................................................................................... 106
4.1 Airframe.............................................................................................................. 106
4.2 Avionics .............................................................................................................. 106
4.3 Engine .................................................................................................................. 112
4.4 Flap System ......................................................................................................... 112
4.5 Controls ............................................................................................................... 113
5 Normal Procedures Checklist .................................................................................... 115
6 Limitations .................................................................................................................. 118
Appendix A.1 - Head Tracking Configuration .................................................................. 119
Appendix A.2 - URBLOG Mission ................................................................................... 120

103
1. Introduction
The purpose of the operating manual is to support documentation for the Operator of the
URBLOG. It provides all necessary operating procedures and limitations, including
supporting procedures as basic piloting skills and setup related requirements.
The URBLOG is an unmanned aerial vehicle (UAV), characterized by being an airship
designed to have its cruise flight achieved by the deflection of 4 main surfaces (wings) and
vertical stabilizers, propelled by an engine of large diameter on the rear of the aircraft. Its
static control is achieved by using 4 rotors located on the wings, plus the deflection of the
rear engine. This concept combines the traditional airfoil and rotorcraft technology applied
in its control surfaces, becoming a hybrid system that can perform hovering and vertical
takeoff and landing (VTOL) operations.
This vehicle was adapted for flight simulation software to demonstrate its functionalities,
and enable the study of an Operator training programme, in which this operating manual is
included. The flight simulation software where this vehicle is simulated is the Lockheed
Martin Prepar3D® (P3D) V4.
The structure of this manual was based on the Airbus Flight Crew Techniques Manual
(FCTM), the Airbus Flight Crew Operation Manual (FCOM) and the guide for a simulated
RQ-4A Global Hawk, “Guía de Simulador de RQ-4A Global Hawk – Flight Simulator
Version 1.0” developed within a dissertation.
References of these documents are provided in the MSc dissertation related to this URBLOG
simulation and are [58], [64] and [65].
In this manual, it is also included the Head Tracking Configuration on Appendix A.1 and
instructions for the particular mission developed for URBLOG studies in Appendix A.2.
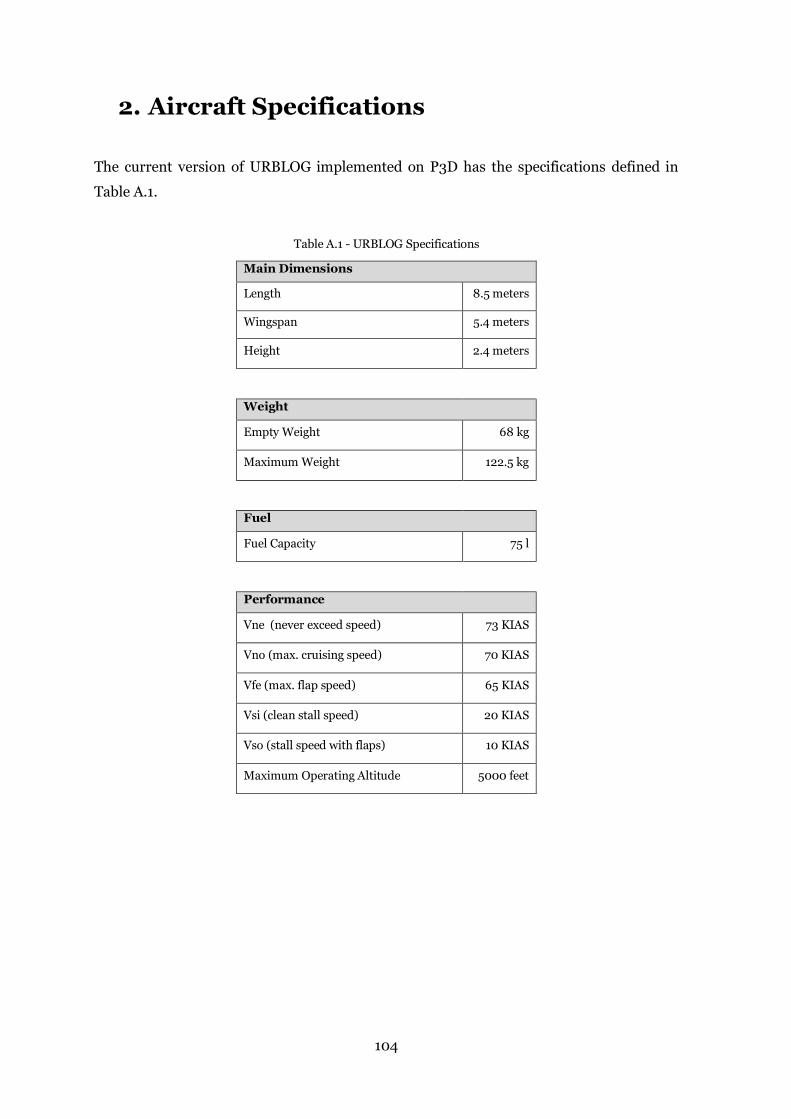
104
2. Aircraft Specifications
The current version of URBLOG implemented on P3D has the specifications defined in
Table A.1.
Table A.1 - URBLOG Specifications
Main Dimensions
Length 8.5 meters
Wingspan 5.4 meters
Height 2.4 meters
Weight
Empty Weight 68 kg
Maximum Weight 122.5 kg
Fuel
Fuel Capacity 75 l
Performance
Vne (never exceed speed) 73 KIAS
Vno (max. cruising speed) 70 KIAS
Vfe (max. flap speed) 65 KIAS
Vsi (clean stall speed) 20 KIAS
Vso (stall speed with flaps) 10 KIAS
Maximum Operating Altitude 5000 feet

105
3. Installation
To install this URBLOG version in P3D software:
1. Extract NIT_UrbLog_UAV to a folder;
2. Copy the whole folder to the Airplanes folder, in the SimObjects P3D directory. The
standard location of this folder is Program Files\Lockheed Martin\Prepar3D
v4\SimObjects\Airplanes.
To access this aircraft in P3D:
1. Click on “Vehicles” in the menu bar;
2. Type “Urblog” into the search bar;
3. Select the aircraft and click “OK”.
To uninstall this URBLOG version, simply erase the “NIT_UrbLog_UAV”, placed on the
Airplanes folder.

106
4. Systems Guide
4.1. Airframe
The URBLOG is a hybrid airship, equipped with a set of controlled surfaces: two pair of
wings with variable angle, equipped with propulsive rotors. The front pair of wings act as
aileron and the aft wings, as elevator. The tail is composed of two vertical stabilizers, both
with rudder deflecting surfaces.
It has a controllable buoyancy system that can provide aerodynamic force for VTOL
operations.
All surfaces contain trim tab actuators, nevertheless, controls are not considered in this
simulation.
4.2. Avionics
Representing the URBLOG’s avionics, there are four panels available on the URBLOG as in
Figure A.1:
• Primary Flight Display (PFD)
• Multi-Function Display (MFD)
• Head-Up Display (HUD)
• Secondary PFD & HUD Activation
Figure A.1 - Panels

107
To access the panels, press the following keys:
PFD SHIFT+1
MFD SHIFT+2
SECONDARY PFD & HUD ACTIVATION SHIFT+3
HUD SHIFT+4
To close the panel, press the same key combination. In order to move the panel, undock the
window. This will enable its movement on the screen, the change of its size and the
possibility of showing an external monitor if installed. Nevertheless, several panels can be
open at the same time.
The avionic system represented in this URBLOG simulation is the Garmin 1000. The main
flight information is in two displays, instead of traditional gauges. The main flying
information is shown on a Primary Flight Display (PFD). The airspeed and altitude
indicators, including the vertical speed indicator, with the rate of climb or descent, are
represented on tape; a large attitude indicator shows the attitude of the aircraft regarding
its pitch and roll, and the horizontal situation indicator (HSI) the heading. Other
information, as engine data, location and weather are shown on the Multi-Function Display
(MFD). Each display has a set of knobs, buttons and softkeys, identically positioned on both
PFD and MFD, as seen in Figure A.2. It also includes autopilot functionalities, the radio set
and navigation configurations.
Figure A.2 - URBLOG’s PFD and MFD
The G1000 has many functionalities which can be explored in detail by reading the Garmin
G1000 Integrated Flight Deck Pilot's Guide - Cessna Nav III. Nevertheless, for the present
version of URBLOG, the objective is only to use the PFD to read the presented flight
information. For that purpose, extracted information from the G1000 guide1 is shown
below:
1 Information extracted from pages 48, 52, 53, 55, 57, 60 and 71 from the Garmin G1000 Integrated Flight Deck
Pilot's Guide - Cessna Nav III

108

109

110
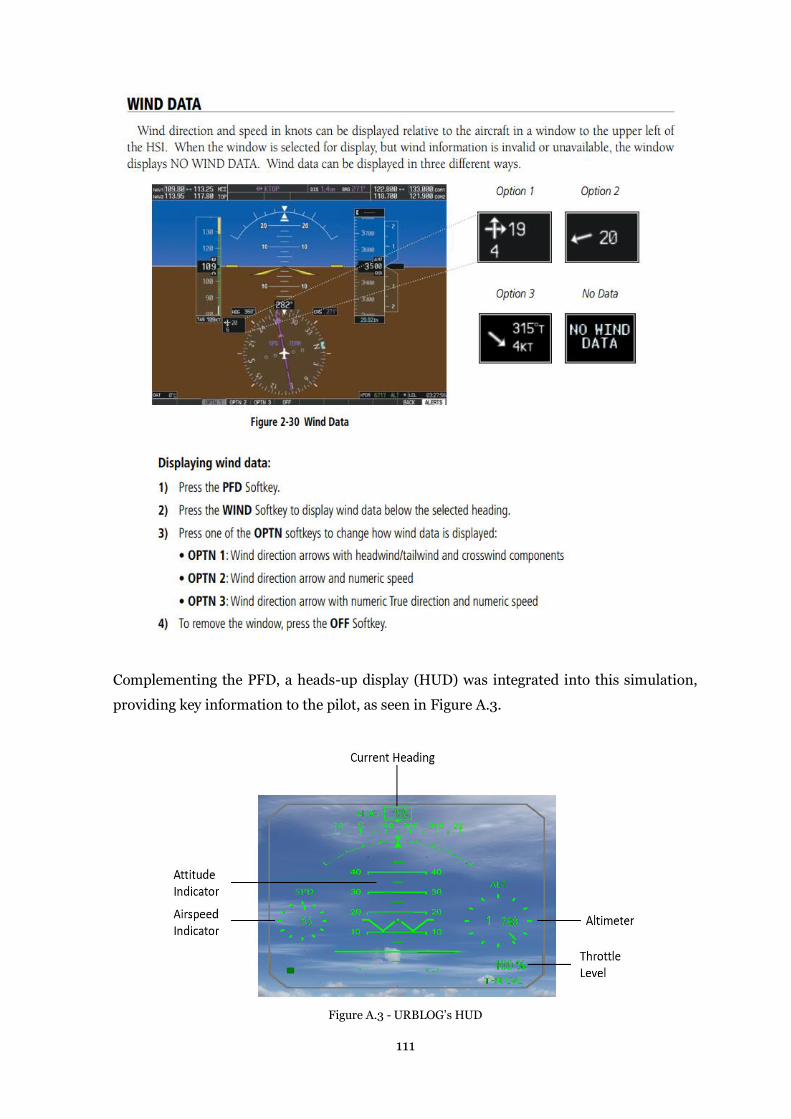
111
Complementing the PFD, a heads-up display (HUD) was integrated into this simulation,
providing key information to the pilot, as seen in Figure A.3.
Figure A.3 - URBLOG’s HUD

112
The vector bars for airspeed and altitude turn clockwise when airspeed or altitude is
increasing, and counter-clockwise when decreasing. The speed of rotation suggests the
magnitude of change.
When wind is present and it exceeds 5 knots, the wind information will appear near the
upper right corner.
To activate or deactivate the HUD, it is necessary to click on the HUD button present on the
secondary PFD & HUD activation, according to Figure A.4. Once the HUD button is active,
the HUD will be available in the HUD panel.
Figure A.4 - HUD Activation Button
4.3. Engine
The engine controls of URBLOG consists of a single throttle control and it will adjust the
engine RPM. The full forward position sets the engine to fully open, and the full aft position
to fully closed. This model initiates with the engine already started.
4.4. Flap System
This version of URBLOG has 9 levels of flaps available. During vertical Takeoff, it is
necessary for the phased retraction of flaps. During approach and vertical landing, a phased
extension is recommended, but the maximum extension of flaps that shall be applied is until
level 6. This is reflected in the normal procedures checklist.

113
4.5. Controls
The minimum required setup to control this URBLOG simulation consists of a laptop or
desktop, connected to a joystick. A hands-on throttle-and-stick (HOTAS) is recommended,
to provide better control of both throttle and joystick inputs.
To see both out-the-window (OTW) view and the instruments, an additional display and a
head tracking device are also recommended to enhance the viewing control.
The recommended setup and devices are shown below in Figure A.5.
Figure A.5 - Setup
The joystick controls the attitude of the URBLOG. The throttle controls the airspeed. These
inputs are represented in Figure A.6.
Figure A.6 - Joystick and Throttle Inputs

114
The URBLOG requires that for a certain attitude to be followed, continuous input shall be
given on the joystick. As an example, for the right roll to be performed, it is necessary to
maintain a continuous right input on the joystick.
A head tracking device enables that Operator’s head is recognized in the different axis by its
optical tracking system. These possibilities the change of direction of the out-the-window
(OTW) view without any physical input. By tilting the head, the view changes towards that
direction. If not used, the OTW view can be changed by pressing the hat switch towards the
pretended direction. Both inputs are represented below in Figure A.7.
Figure A.7 - OTW View Inputs
Before using the head tracking for the OTW view, it is necessary to configure the
FaceTrackNoIR software according to the Operator. How to conduct these configurations
can be found in Appendix A.1.
When using the head tracking device, the HUD display follows the OTW view, which can
reduce situational awareness if not properly anticipated by the Operator. Nevertheless, the
PFD is not affected by any OTW view inputs.

115
5. Normal Procedures Checklist
The procedures contained in this chapter in Table A.2 are presented as the best way to
proceed, from a technical and operational standpoint. However, they are continually
updated based on experience and by any revision of the simulated model.
All items of a given procedure are listed in a sequence that follows a standardized scan of
the panels and implemented functions of the URBLOG, assuring that all actions are
conducted most efficiently.
Buttons can be assigned differently. The standard P3D button configuration is considered
in these procedures.
These procedures assume that all systems are operating normally.
The altitudes expressed are above ground level (AGL) and speed in knots-indicated airspeed
(KIAS).
Table A.2 - Normal Procedures
BEFORE TAKEOFF
[ ] Parking Brake
VERIFY IF SET
(press CTRL+PERIOD)
[ ] Flaps
FULL EXTENSION TO FLAPS 9
(press F8)
[ ] PFD SET
(press SHIFT+1)
[ ] HUD ACTIVATE
(press HUD button)
[ ] Flight Controls FREE AND CORRECT
VERTICAL TAKEOFF
[ ] Parking Brake
RELEASE
(press PERIOD key)
[ ] Throttle
FULL
(press F4 )
[ ] Liftoff Speed 30 KIAS
[ ] First Flap Retraction Altitude ABOVE 20 FEET AGL
[ ] Flaps
RETRACT TO FLAPS 8
(press F6 )

116
[ ] Speed 43 KIAS
[ ] Second Flap Retraction Altitude ABOVE 40 FEET AGL
[ ] Vertical Speed Trend NEUTRAL OR POSITIVE
[ ] Flaps
RETRACT TO FLAPS 7
(press F6)
[ ] Speed 61 KIAS
[ ] Vertical Speed Trend NEUTRAL OR POSITIVE
[ ] Third Flap Retraction Altitude ABOVE 60 FEET AGL
[ ] Flaps
RETRACT TO FLAPS 6
(press F6)
HORIZONTAL CLIMB
[ ] Flaps
FULL RETRACTION TO FLAPS 0
(press F5)
[ ] Throttle
AS DESIRED
(press F2 to decrease and F3 to increase )
[ ] Pitch Attitude POSITIVE
CRUISE
[ ] Recommended Cruise Airspeed 65 KIAS
[ ] Throttle
AS DESIRED
(press F2 to decrease and F3 to increase)
DESCENT
[ ] Pitch Attitude NEGATIVE
[ ] Throttle
REDUCE FROM CRUISE
(press F2)
[ ] Airspeed AS DESIRED
APPROACH FOR VERTICAL LANDING
[ ] Throttle
REDUCE TO MINIMUM
(press F1)
[ ] Flaps
EXTEND TO FLAPS 2
(press F7 TWICE)
[ ] Second Flap Retraction Altitude BELOW 40 FEET AGL
[ ] Flaps
EXTEND TO FLAPS 4
(press F7 TWICE)
[ ] Third Flap Retraction Altitude BELOW 20 FEET AGL
[ ] Flaps
EXTEND TO FLAPS 6
(press F7 TWICE)
SHORT/VERTICAL LANDING
[ ] Airspeed 30 KIAS
[ ] Landing Attitude LOWER NOSE GENTLY

117
[ ] Brakes
APPLY SHORT BEFORE TOUCHDOWN
(press PERIOD key)
TOUCHDOWN
[ ] Parking Brake
SET
(press CTRL+PERIOD)

118
6. Limitations
At this point, URBLOG simulation will not permit the docking of the device.
Any simulation must be done above ground level (AGL), with the vehicle powered up.
The electrical propulsion given by the rotors installed on the wings is not simulated in this
version. The rear propulsion system is the only source of thrust.
Even in simulation, the URBLOG Operator should fly according to the golden rule of Fly,
Navigate and Communicate. It is always essential to maintain situational awareness, by
precepting the actual flight conditions, as well as to predict its future status. It evolves the
perception of the flight information, together with its systems, weather, air traffic control
clearances (when present) and other pertinent elements, while flying the aircraft.

119
Appendix A.1 - Head Tracking Configuration
To use the head tracking device for head tilt control within the flight, it is necessary to
configure its settings on the FaceTrackNoIR software. It is of major importance the
definition of the neutral zone, where movements are not desired and the sensibility of each
tilt, as an input. It can depend on the distance between the Operator and the camera; the
light present on the site; the height of the Operator and its relation to the camera; and the
objectives of the flight. This configuration of the tracking curves in Figure A.8 can be
performed on the Curves button
Figure A.8 - Tracking Curves Configuration
After being defined accordingly, the profile shall be saved, and choose the following settings:
• Tracker Source: faceAPI V3.2.6 (on the settings, it is possible to verify the head
tracking by selecting show videowidget)
• Filter: Accela Filter Mk2
• Game Protocol: FreeTrack 2.1
• Game Protocol (2nd): FSX SimConnect SP2
Shortkeys can also be defined, for instance, to reset the present view. Changes can be made
on the ShortKeys button and saved on the same profile.
Once ready, click on START under the GO! tab. The head tilt function is now active.
To deactivate, click on STOP.

120
Appendix A.2 - URBLOG Mission
A mission was developed to include several tasks that simulate the objectives of URBLOG
during air surveillance. It has an approximate duration of 8 minutes and the Operator is
asked to perform it three times.
The mission consists of a short visual flight rules (VFR) flight, where the Operator shall
follow a nearby road to the airport, by complying with the gates implemented, like the one
on Figure A.9.
Figure A.9 - Green Square as Mission Gate
These gates will define the flight path required for this mission, and their altitude was
defined according to above ground level (AGL). Information regarding the next gate is
provided on the left upper corner of the screen, as below in Figure A.10.
Figure A.10 - Position of the Next Gate

121
The flight includes a departure and arrival at a civil airport available on the flight simulator
software, in this case, Oporto airport (ICAO: LPPR) in Portugal.
Initial flight parameters are equal in all mission attempts. These parameters include
weather conditions, geographic location, altitude, heading, power setting and speed. The
initial weather conditions are clear skies with no wind. No Air Traffic Control (ATC)
instructions are simulated in this mission.
The accomplishment of the mission translates that all the SOPs were followed, a stable flight
is conducted, and that the Operator was able to comply with all the tasks within the time
defined. The SOPs deviations and unstable situations as crash, stall or failure to land will
lead to a negative assessment and the consequent failure of the mission.
On-going textual messages provide instructions to comply with main tasks and the flight
path according to Table A.3:
Table A.3 - Mission Outline
URBLOG Mission
1 Vertical Takeoff from runway 35 LPPR
2 Transition from vertical flight to horizontal flight
3 Climb for 1st gate interception
4 Climb for 2nd gate interception
5 Cruise flight for 3rd gate interception, visually following the
road
6 Descend for 4th gate interception
7 Visual approach to runway 35 LPPR
8 Transition from horizontal flight to vertical flight
9 Short landing on runway 35 LPPR
The mission scenario resembles a traffic pattern, although with deviations to simulate the
air surveillance over a main road. The route is shown in Figure A.11.

122
Figure A.11 - Mission Route

123
Appendix B - Flight Comparison Data
From Figure B.1 to Figure B.21 it is possible to verify the Operator 2, 3 and X data per
mission, that originated a calculated median value.
Figure B.1- Operator 2 missions comparison and median values of vertical speed
Operator 2 had a similar amplitude of vertical speed values during each mission (Figure
B.1), however, on mission attempt 2, there were peak values between -2000 and 1000 feet
per minute.

124
Figure B.2 - Operator 2 missions comparison and median values of indicated airspeed
During the 1st and 2nd mission attempt (Figure B.2), Operator 2 conducts more speed
changes in relation to the 3rd mission attempt. Operator 2 mainly flies the cruise above the
recommended airspeed (65 KIAS).
Figure B.3 - Operator 2 missions comparison and median values of altitude
Operator 2 during the 1st and 2nd attempts performs more accentuated climbs followed by
immediate descents (Figure B.3), which is according to the Vertical Speed analysis on Figure

125
B.1. On attempt 3, Operator 2 conducts smoother altitude changes, especially during
descent and final approach.
Figure B.4 - Operator 2 missions comparison and median values of pitch angle
Operator 2 during the 2nd and 3rd attempts performs more accentuated pitch inputs (Figure
B.4), reflected in the pitch attitude, which is according to the Vertical Speed analysis on
Figure B.1 and the Altitude analysis on Figure B.3. On attempt 3, Operator 2 executes
smoother pitch changes.

126
Figure B.5 - Operator 2 missions comparison and median values of bank angle
Operator 2 reached similar banks levels for all attempts (Figure B.5). Most of the banks were
performed to the left (positive values), as it represents, in fact, the mission trajectory.
Maximum values were reached when turning left on base to initiate final approach.
Figure B.6 - Operator 2 missions comparison and median values of magnetic heading
Operator 2 reached similar heading values accordingly to the mission route for all attempts
(Figure B.6).

127
Figure B.7 - Operator 2 missions comparison and median values of lever position
Operator 2 performs a stable and similar lever position adjustments for all attempts (Figure
B.7). In every attempt, the lever position for takeoff is correct.
Figure B.8 - Operator 3 missions comparison and median values of vertical speed
Operator 3 had a similar amplitude of vertical speed values during missions 2 and 3 (Figure
B.8). However, on attempt 1, peak values between -1000 and 1500 feet per minute were
reached, in disparity of missions 2 and 3.

128
Figure B.9 - Operator 3 missions comparison and median values of indicated airspeed
Operator 3 conducts similar speed changes for all attempts (Figure B.9). The cruise speed
was around the recommended airspeed (65 KIAS). On all cases, the Operator decided to
keep around 45 knots on final approach and then decreased it from 45 knots until final
landing speed.
Figure B.10 - Operator 3 missions comparison and median values of altitude

129
Operator 3 during the 1st and 2nd attempt performed more accentuated climbs followed by
immediate descents (Figure B.10), which is according to the Vertical Speed analysis on
Figure B.8. On attempt 3, Operator 3 conducts smoother altitude changes, especially during
the cruise phase.
Figure B.11 - Operator 3 missions comparison and median values of pitch angle
Operator 3 during the 1st and 2nd attempts performs more accentuated pitch inputs (Figure
B.11), reflected in the pitch attitude, which is according to the Vertical Speed analysis on
Figure B.8 and the Altitude analysis on Figure B.10. On attempt 3, Operator 3 performs
smoother pitch changes.

130
Figure B.12 - Operator 3 missions comparison and median values of bank angle
Operator 3 reached similar banks levels for all attempts (Figure B.12). The maximum value
was reached on mission 1.
Figure B.13 - Operator 3 missions comparison and median values of magnetic heading
Operator 3 reached similar heading values accordingly to the mission route for all attempts
(Figure B.13).

131
Figure B.14 - Operator 3 missions comparison and median values of lever position
Operator 3 performs several lever position adjustments during cruise flight but mainly
precedent to the route turns (Figure B.14). Inputs are in line with the SOPs defined and in
every attempt the lever position for takeoff is correct.
Figure B.15 - Operator X missions comparison and median values of vertical speed

132
Operator X had a similar amplitude of vertical speed values during all missions (Figure
B.15). On attempt 3, there was a peak value around 1000 feet per minute.
Figure B.16 - Operator X missions comparison and median values of indicated airspeed
Operator X conducts similar speed changes for all attempts (Figure B.16). The cruise speed
was around the recommended airspeed (65 knots).
Figure B.17 - Operator X missions comparison and median values of altitude

133
Operator X conducts similar and smooth altitude changes for all attempts (Figure B.17).
Figure B.18 - Operator X missions comparison and median values of pitch angle
Operator X reaches higher values on the 1st and 2nd attempts when compared with the 3rd
attempts (Figure B.18).
Figure B.19 - Operator X missions comparison and median values of bank angle
Operator X reached similar banks levels for all attempts (Figure B.19). Maximum values
were reached on the first attempt.

134
Figure B.20 - Operator X missions comparison and median values of magnetic heading
Operator X reached similar heading values accordingly to the mission route for all attempts
(Figure B.20).
Figure B.21 - Operator X missions comparison and median values of lever position
Operator X performs smooth and similar lever adjustments in the first half of the mission
(Figure B.21). However, several lever position adjustments were done on the second half of
the mission.

135
Appendix C - Task Comparison Data
From Figure C.1 to Figure C.21 it is possible to verify the Operator 2 and 3 data per mission
task, that originated a calculated median value.
Figure C.1 - Operator 2 missions comparison and median values of vertical speed per task
Operator 2 had a similar amplitude of vertical speed values during each mission (Figure
C.1), however, on mission attempt 2, peaks were reached on gate 1 and 4.
Figure C.2 - Operator 2 missions comparison and median values of indicated airspeed per task

136
During the takeoff phase on all missions (Figure C.2), the airspeed value increases and then
immediately decreases due to high pitch values as indicated in Figure C.4. The main
differences are noted on the last gate of mission 1, with some decrease in speed value, and
on approach phase of mission 2, which was made from high-speed values when compared
with mission 1 and 3.
Figure C.3 - Operator 2 missions comparison and median values of altitude per task
On all missions, altitude values by Operator 2 are similar in all phases (Figure C.3).
Figure C.4 - Operator 2 missions comparison and median values of pitch angle per task

137
On the mission attempt 1 and 2, is observed a greater range of values when compared with
attempt 3, with accentuated peaks (Figure C.4).
Figure C.5 - Operator 2 missions comparison and median values of bank angle per task
On all missions, bank values by Operator 2 are very similar in all phases (Figure C.5). Only
on gate 2 in attempt 2, a bigger variation is verified.
Figure C.6 - Operator 2 missions comparison and median values of magnetic heading per task
On all missions, heading values by Operator 2 are very similar on all phases (Figure C.6).
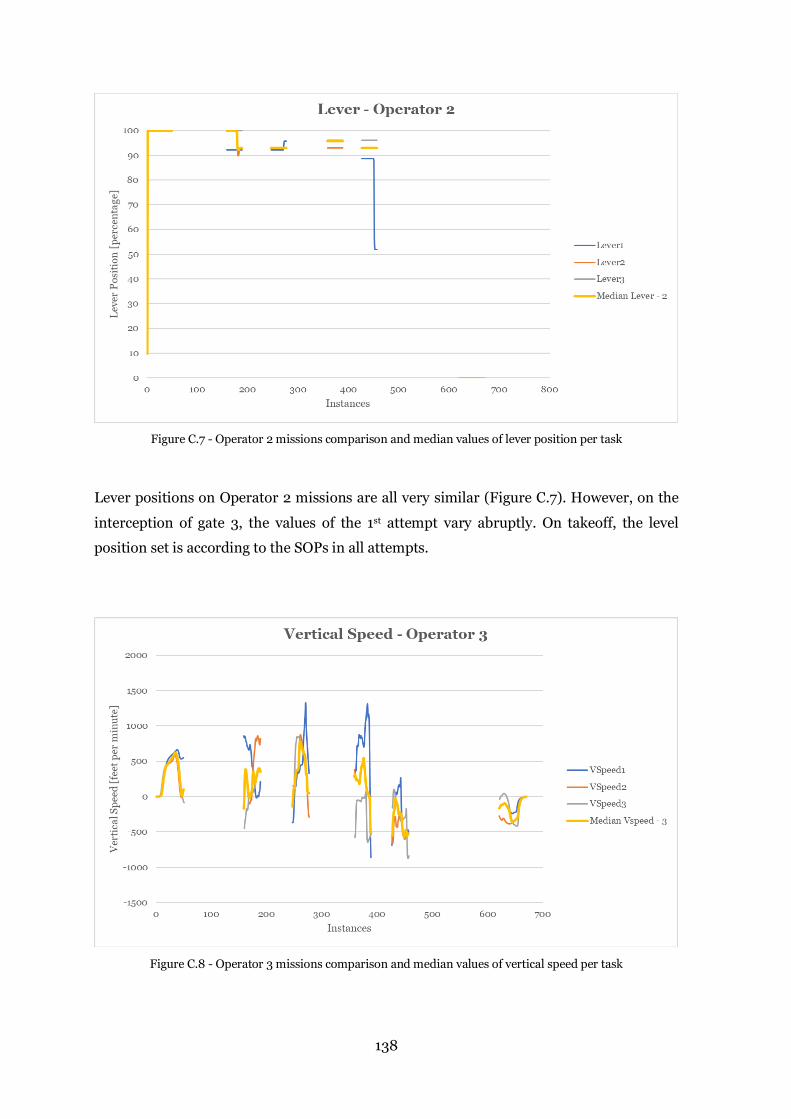
138
Figure C.7 - Operator 2 missions comparison and median values of lever position per task
Lever positions on Operator 2 missions are all very similar (Figure C.7). However, on the
interception of gate 3, the values of the 1st attempt vary abruptly. On takeoff, the level
position set is according to the SOPs in all attempts.
Figure C.8 - Operator 3 missions comparison and median values of vertical speed per task

139
Operator 3 had a similar amplitude of vertical speed values during each mission (Figure
C.8), however, on mission attempt 1, peaks were reached on gate 2 and 3.
Figure C.9 - Operator 3 missions comparison and median values of indicated airspeed per task
On all missions, indicated airspeed values of Operator 3 are very similar on all phases
(Figure C.9).
Figure C.10 - Operator 3 missions comparison and median values of altitude per task
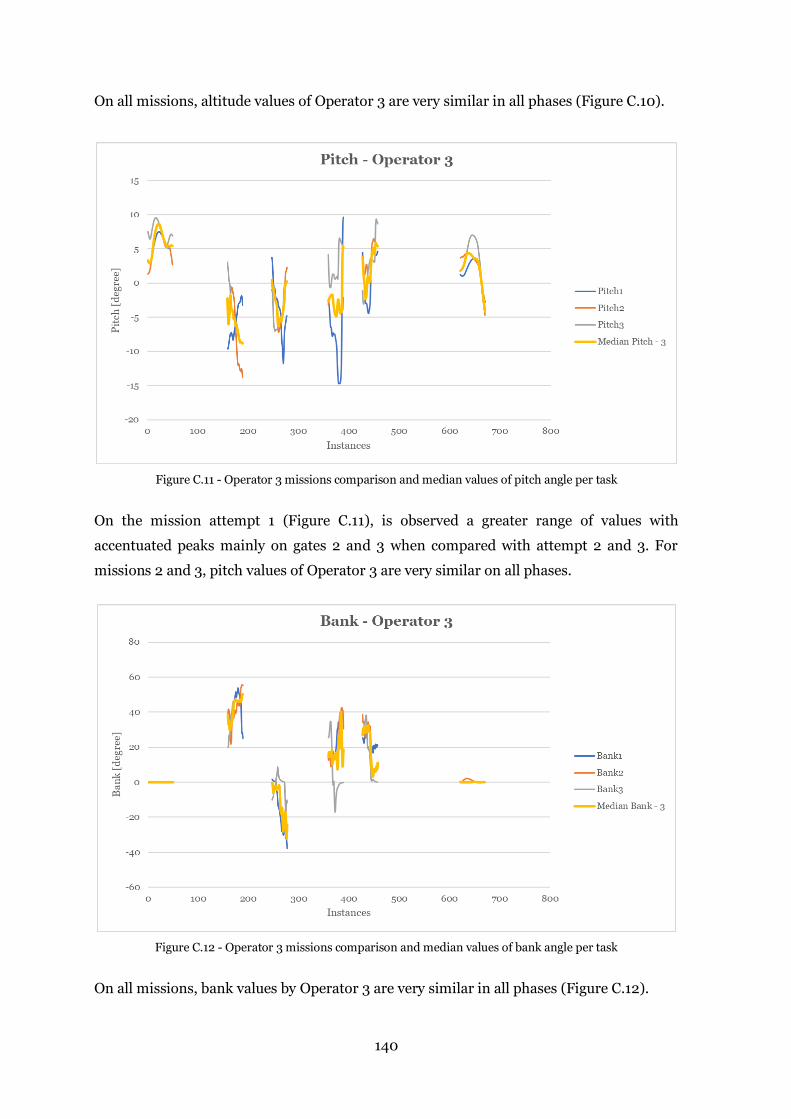
140
On all missions, altitude values of Operator 3 are very similar in all phases (Figure C.10).
Figure C.11 - Operator 3 missions comparison and median values of pitch angle per task
On the mission attempt 1 (Figure C.11), is observed a greater range of values with
accentuated peaks mainly on gates 2 and 3 when compared with attempt 2 and 3. For
missions 2 and 3, pitch values of Operator 3 are very similar on all phases.
Figure C.12 - Operator 3 missions comparison and median values of bank angle per task
On all missions, bank values by Operator 3 are very similar in all phases (Figure C.12).
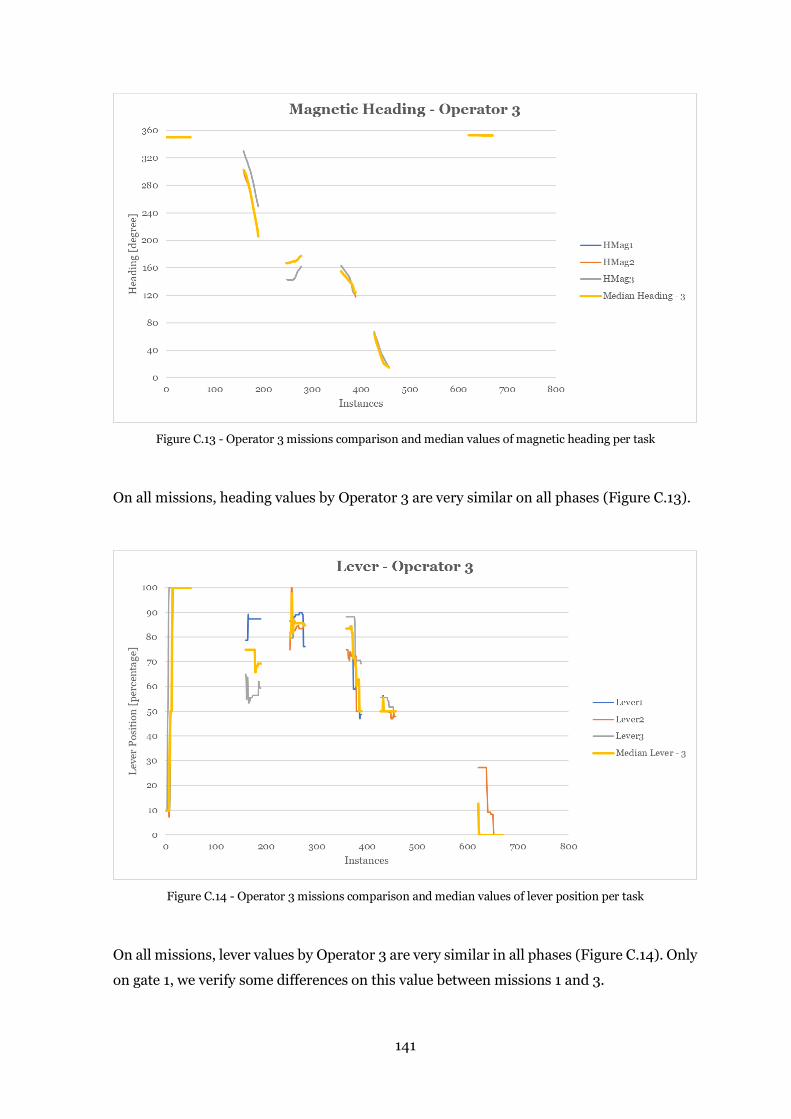
141
Figure C.13 - Operator 3 missions comparison and median values of magnetic heading per task
On all missions, heading values by Operator 3 are very similar on all phases (Figure C.13).
Figure C.14 - Operator 3 missions comparison and median values of lever position per task
On all missions, lever values by Operator 3 are very similar in all phases (Figure C.14). Only
on gate 1, we verify some differences on this value between missions 1 and 3.

142
Figure C.15 - Operator X missions comparison and median values of vertical speed per task
Operator X had a similar amplitude of vertical speed values during each mission (Figure
C.15), however, on mission attempt 3 a peak was reached on gate 1, and on mission 1 on gate
3.
Figure C.16 - Operator X missions comparison and median values of indicated airspeed per task
On all missions and phases, the indicated airspeed values of Operator X are very similar
(Figure C.16).

143
Figure C.17 - Operator X missions comparison and median values of altitude per task
On all missions, altitude values of Operator X are very similar in all phases (Figure C.17).
Figure C.18 - Operator X missions comparison and median values of pitch angle per task
On all missions, the pitch values of Operator X are very similar in all phases (Figure C.18).
Only on gate 3, there are bigger differences in the verified values between missions 1 and 2.

144
Figure C.19 - Operator X missions comparison and median values of bank angle per task
On all missions, bank values of Operator X are very similar in all phases (Figure C.19).
Figure C.20 - Operator X missions comparison and median values of magnetic heading per task
On all missions, heading values of Operator X are very much the same on all phases (Figure
C.20).

145
Figure C.21 - Operator X missions comparison and median values of lever position per task
On all missions, lever values of Operator X are very similar in all phases (Figure C.21 ).
From Figure C.22 to Figure C.35 it is possible to verify the Operator 2 and 3 median data
compared with Operator X for each task, including its calculated standard deviation.
Figure C.22 - Operator X vs Operator 2 missions comparison and standard deviation values of vertical speed per task

146
The Operator 2 median shows a greater range of values when compared with the median of
the Operator X (Figure C.22). During both takeoff and interception of gate 3 and 4, a larger
standard deviation is seen, with a great variation of values. During landing, the medians
show approximate values.
Figure C.23 - Operator X vs Operator 2 missions comparison and standard deviation values of indicated airspeed per task
It is observed that during takeoff and interception of gate 3 and 4, the Operator 2 median is
greater than the median of the Operator X (Figure C.23), thus in those instances, a larger
standard deviation is seen. The airspeed values for those interceptions are higher than the
recommended cruise speed of 65 knots. During landing, the medians show approximate
values.

147
Figure C.24 - Operator X vs Operator 2 missions comparison and standard deviation values of altitude per task
It is observed that during the interception of the gates, the Operator 2 altitude median shows
fewer variations than the Operator X median (Figure C.24). During both takeoff and
landing, the medians show approximate values.
Figure C.25 - Operator X vs Operator 2 missions comparison and standard deviation values of pitch angle per task

148
In the interception of the gates (Figure C.25), the Operator 2 pitch median shows more
accentuated values when compared with the median of the Operator X, corroborated per
Figure C.22. However, during both takeoff and landing, the Operator 2 median show lower
pitch values than the Operator X.
Figure C.26 - Operator X vs Operator 2 missions comparison and standard deviation values of bank angle per task
The interception of the gates 1, 3 and 4 (Figure C.26), the Operator 2 bank median shows
accentuated differences when compared with the median of the Operator X, thus in those
instances, a larger standard deviation is seen. During takeoff, gate 2 interception and
landing, the medians show approximate values.

149
Figure C.27 - Operator X vs Operator 2 missions comparison and standard deviation values of magnetic heading per task
It is observed that during the interception of the gates 1, 3 and 4 (Figure C.27), the Operator
2 median shows accentuated differences when compared with the median of the Operator
X, thus in those instances, a larger standard deviation is seen. When associated with Figure
C.26, is coherent and shows that the Operator 2 was turning while intercepting the gates.
During takeoff, gate 2 interception and landing, the medians show approximate values.

150
Figure C.28 - Operator X vs Operator 2 missions comparison and standard deviation values of lever position per task
It is noticed that during the interception of the gates the Operator 2 has higher values of
lever position when compared with Operator X (Figure C.28). This is associated with the
indicated airspeed for those particular moments, which is according to Figure C.23. During
both takeoff and landing, the medians show approximate values.
Figure C.29 - Operator X vs Operator 3 missions comparison and standard deviation values of vertical speed per task

151
The Operator 3 median, during takeoff and the interception of gate 2 (Figure C.29), shows
a greater range of values when compared with the median of the Operator X, with an
accentuated variation of values. During the interception of gate 2, the Operator 3 median
shows a negative vertical speed, which is the opposite of the Operator X median. During the
interception of gate 3, 4 and landing, the medians show approximate values.
Figure C.30 - Operator X vs Operator 3 missions comparison and standard deviation values of indicated airspeed per task
It is shown that during takeoff, a higher airspeed value is reached when compared with
Operator X (Figure C.30). The interception of gate 1 is performed at a lower airspeed,
although on the following gates, the deviation is minimal. During the landing, is observed
that the airspeed is reduced on a later stage when compared with the Operator X.

152
Figure C.31 - Operator X vs Operator 3 missions comparison and standard deviation values of altitude per task
On gate 2, it is observed that the Operator 3 altitude median shows a great variation than
the Operator X median (Figure C.31). During both takeoff and following gate, the medians
show approximate values, with few deviations.
Figure C.32 - Operator X vs Operator 3 missions comparison and standard deviation values of pitch angle per task

153
During the takeoff (Figure C.32), the Operator 3 median shows lower pitch amplitude when
compared with the Operator X, which is in accordance to the Figure C.29, as the vertical
speed values are more accentuated for a longer number of instances. Other tasks are
performed with approximate values regarding Operator X.
Figure C.33 - Operator X vs Operator 3 missions comparison and standard deviation values of bank angle per task
The interception of the gates 2 and 4 (Figure C.33), the Operator 3 bank median shows
accentuated differences when compared with the median of the Operator X. On gate 2, a
great variation of values is seen, and in gate 4, the median values show a more constant
bank than the Operator X. However, in other tasks, the medians show approximate values.

154
Figure C.34 - Operator X vs Operator 3 missions comparison and standard deviation values of magnetic heading per task
It is observed that during the interception of the gates 1 and 3 (Figure C.34), the Operator 3
median shows the heading values being intercepted earlier when compared with the median
of the Operator X. In other tasks, the medians show approximate values.
Figure C.35 - Operator X vs Operator 3 missions comparison and standard deviation values of lever position per task

155
It is observed that during the interception of the gates 1 and 4 (Figure C.35), the Operator 3
has higher values of lever position when compared with Operator X. On gate 2, the Operator
3 has a greater amplitude of values, although the same values are reached on a later point.
These variations are related to the indicated airspeed for those particular moments, which
is according to Figure C.30. During both takeoff and landing, the medians show
approximate values.

156

157
Appendix D - Outputs
This appendix contains the abstracts of the articles presented at ICEUBI 2015 and at RAeS
Aerodynamics 2019 conference, both produced as a result of this dissertation research.
1. Insights and Challenges of Flight Simulation Systems in
Air Transportation

158
2. Evaluation of a Modular Hybrid Airship Design using CFD
Techniques