development of a chromatographic method for the analysis
TRANSCRIPT
Edith Cowan University Edith Cowan University
Research Online Research Online
Theses : Honours Theses
2002
Development of a chromatographic method for the analysis of Development of a chromatographic method for the analysis of
carbohydrates in Posidonia Coriacea in artificial cultures carbohydrates in Posidonia Coriacea in artificial cultures
Olivia J. Oldfield Edith Cowan University
Follow this and additional works at: https://ro.ecu.edu.au/theses_hons
Part of the Biochemistry Commons
Recommended Citation Recommended Citation Oldfield, O. J. (2002). Development of a chromatographic method for the analysis of carbohydrates in Posidonia Coriacea in artificial cultures. https://ro.ecu.edu.au/theses_hons/131
This Thesis is posted at Research Online. https://ro.ecu.edu.au/theses_hons/131
Edith Cowan University
Copyright Warning
You may print or download ONE copy of this document for the purpose
of your own research or study.
The University does not authorize you to copy, communicate or
otherwise make available electronically to any other person any
copyright material contained on this site.
You are reminded of the following:
Copyright owners are entitled to take legal action against persons
who infringe their copyright.
A reproduction of material that is protected by copyright may be a
copyright infringement.
A court may impose penalties and award damages in relation to
offences and infringements relating to copyright material. Higher
penalties may apply, and higher damages may be awarded, for
offences and infringements involving the conversion of material
into digital or electronic form.
DEVELOPMENT OF A CHROMATOGRAPHIC METHOD
FOR THE ANALYSIS OF CARBOHYDRATES
IN POSIDONIA CORIACEA IN ARTIFICIAL CULTURES.
OLIVIA .JAYNE OLDFIELD
Faculty of Communications, Health and Science
EDITH COWAN UNIVERSITY
December 2002

USE OF THESIS
The Use of Thesis statement is not included in this version of the thesis.

This thesis is dedicated to my father, Douglas Charles Oldfield (1951 - 1995), who
taught me a love of nature and has inspire:! me to make a difference in life.
2
ABSTRACT
Carbohydrates in P. coriacea leaves were analysed to determine if, when in
artificial culture, they were unable to replenish their carbohydrate stores once the seed
starch reserve was consumed. While no evidence was found to suggest that this was
happening, other findings were made.
Soluble carbohydrates determined m P. coriacea were sucrose, fructose,
glucose, trehalose, myo-inositol and mannitol. However, mannitol was only found in in
situ plants sampled in June. This may be due to high epiphyte coverage elevating plant
stress and therefore mannitol levels. P. coriacea grown in tissue culture has soluble
carbohydrate levels up to 20-fold higher than plants maintained in aquaria or grown in
situ. The average concentration(± I.(J SE) of the soluble carbohydrates in P. coriacea
in silu plants were: sucrose 2.54 (0.93) mg g"1 fwt, glucose 0.42 (0.06) mg g"1 fwt,
fructose 0.70 (0.05) mg g·' !Wt, trehalose 0.40 (0.01) mg g·' IWt, myo-inositol 0.05
(0.00) mg g'1 fwt and mannitol 0.31 mg g-1 IWt.
P. coriacea leaves generally had < 40 mg starch g·1 fwt. For the experiment
duration there was no significant variation of starch levels except in seawater tissue
culture seedlings sampled in August and September, where starch levels were higher.
Between environments there was a significant difference in starch levels measured in
June, August and September. In June and August the in situ plants had significantly
higher starch levels than seawater tissue culture plants, but levels were significantly
lower than the seawater tissue culture plants in September.
For the analysis of soluble carbohydrates a chromatographic method was
developed specifically for highly sensitive detection, plus simplicity for routine
analysis. Method development compared a variety of methods used for the extraction,
preparation and chromatographic analysis of soluble carbohydrates. An HPLC method
iii
employing a polyamine column, acetonitrile/water mobile phase and evaporative light
scattering detection, was developed. While this method was simple and robust,
detection limits were not low enough to allow analysis of sugars from limited seagrass
material ofO.l g for each sample.
A GC method was developed for the analysis of soluble carbohydrates in
seagrasses maintained in an artificial culture. It consisted of an 80 %ethanol extraction
at room temperature, derivatisation of carbohydrates with BSTF A and analysis on a BP-
1 column with FID detection. This method was simple, robust and sensitive for the
analysis of plant soluble carbohydrates. This method only required 0.1 g of leaf for
each sample. The detection limits were 90 J..lM L-1 fructose, 40 J..lM L'1 glucose and
sucrose, and 20 J..lM 1'1 trehalose, mannitol and myo-inositol.
IV
DECLARATION
I certify that tlris thesis does not, to tile best of my knowledge and belief:
(1) incorporate without acknowledgment any material previously submitted
for a degree or diploma in any institution of higher education;
(ii) contain any material previously published or written by another person
except where due reference is made in the text; or
(iii) contain any defamatory material
(signature)
6 December 2002
v
ACKNOWLEDGEMENTS
My many thanks go to Mary Boyce and Ian Betu1ett for their continual support
throughout this project. My knowledge, understanding and experience are
certainly the better for it.
To the Centre for Ecosystem Management, for providing funds for purchasing
equipment used for this project.
To Mark Bannister, thank you for your patience with me.
To Colin, my fiance, your support through the last four years has been
wonderful.
To my sister, Tammy, for your encouragement ... or discouragement!
To my mother and family, who remind me of what really matters in life.
And to my uni peers Julia Wilson and Michael Burt for collecting the seagrass
plants for roe, and Bryan Duff and Janelle Atkinson who gave me a reason to
laugh. This year certainly would not have been the same without you.
vi
TABLE OF CONTENTS
Abstract
Declaration
Acknowledgements
Table of Contents
List of Tables
List of Figures
Abbreviations
CHAPTER 1: Introduction
1.1 Posidonia coriacea and Tissue Culture
1.1.1 Ecological Importance of Posidonia coriacea
1.1.2 Changes in Seagrass Cover
1.1.3 Culture Methods
1.1.4 Biology
1.1.5 Factors that Affect Photosynthesis
1.1. 7 Carbohydrate Biosynthesis in Seagrasses
1.2 Methods of Sugar and Starch Analysis
1.2.1 Introduction to Carbohydrate Analysis
1.2.2 Extraction of Carbohydrates from Leaves
1.2.3 High Performance Liquid Chromatography
1.2.3.1 HPLC Detectors
1.2.3.2 HPLC Columns
1.2.4 Gas Chromatography
I. 2. 4.1 Sample Preparation
111
V
Vl
vu
Xl
XU
XIV
1
1
1
2
4
5
6
8
11
11
12
14
15
18
22
22
vu
1.2.4.2 GC Columns 26
1.2.4.3 GC Detectors 27
1.2.5 UV-Vis Spectrophotometry 28
1.3 Project Aims 30
CHAPTER 2: Chromatographic Analysis of Soluble Carbohydrates 31
2.1 Introduction 31
2.2 Materials and Methods 33
2.2.1 Reagents and Solvents 33
2.2.2 Sugar Standard Preparation 33
2.2.3 Extraction of Plant Soluble Carbohydrates 34
2.2.4 HPLC Analysis of Soluble Carbohydrates 34
2.2.4.1 Optimising ELSD Conditions 35
2.2.4.2 Column Conditions 35
2.2.5 GC Analysis of Soluble Carbohydrates 36
2.2.5.1 Derivatisation Conditions Development 37
2.2.5.2 Derivative Degradation 37
2.2.5.3 Sample Concentration 37
2.2.6 Statistics and Calculations 38
2.3 Results and Discussion 39
2.3.1 Extraction of Plant Soluble Carbohydrates 39
2.3.2 HPLC Analysis of Soluble Carbohydrates 40
2.3.2.1 Optimal ELSD Operating Conditions 40
2.3.2.2 Optimal Column Conditions 41
2.3.2.3 Column Comparison 43
2. 3. 2. 4 Detector Comparison 45
Vlll
2.3.3 GC Analysis of Soluble Carbohydrates
2. 3. 3.1 Derivatisation Conditions
2. 3. 3. 2 Derivative Degradation
2. 3. 3. 3 Sample Concentration
2. 3. 3. 4 Internal Standards
2.3.3.5 GC-FID Detection Limits
2. 3. 3. 6 Column Comparison
2.3.4 Sugar analysis methods compared: HPLC-ELSD vs. GC-FID
CHAPTER 3: Analysis of Carbohydrates in Posidonia coriacea
3.1 Introduction
3.2 Materials and Methods
3.2.1 Reagents and Solvents
3 .2.2 Preparation of Standards for GC Analysis
3 .2.3 Plant Material
3. 2. 3.1 Tissue Culture Plants
3.2.3.2 Aquaria Plants
3.2.3.3 Field Plants
3.2.4 Extraction of Carbohydrates
3.2.5 Soluble Carbohydrate Analysis
3 .2.6 Starch Analysis
3 .2. 7 Statistical Analysis
3.3 Results
3. 3 .1 Sea grass Plant Material
3.3.2 Analysis of Soluble Carbohydrates
3. 3. 2.1 Identified Soluble Carbohydrates
47
47
50
5 1
5 1
5 3
5 5
5 5
57
57
59
5 9
5 9
5 9
60
60
61
61
62
62
62
63
63
65
65
lX
3.3.2.2 Variation with Time
3. 3. 2. 3 Variation with Environment
3.3.3 Analysis of Starch
3.3.3.1 Variation with Time
3.3.3.2 Variation with Environment
3.4 Discussion
CHAPTER 4: Concluding Remarks
References
65
70
70
71
72
72
76
78
X
TABLE
2.1
2.2
2.3
2.4
2.5
LIST OF TABLES
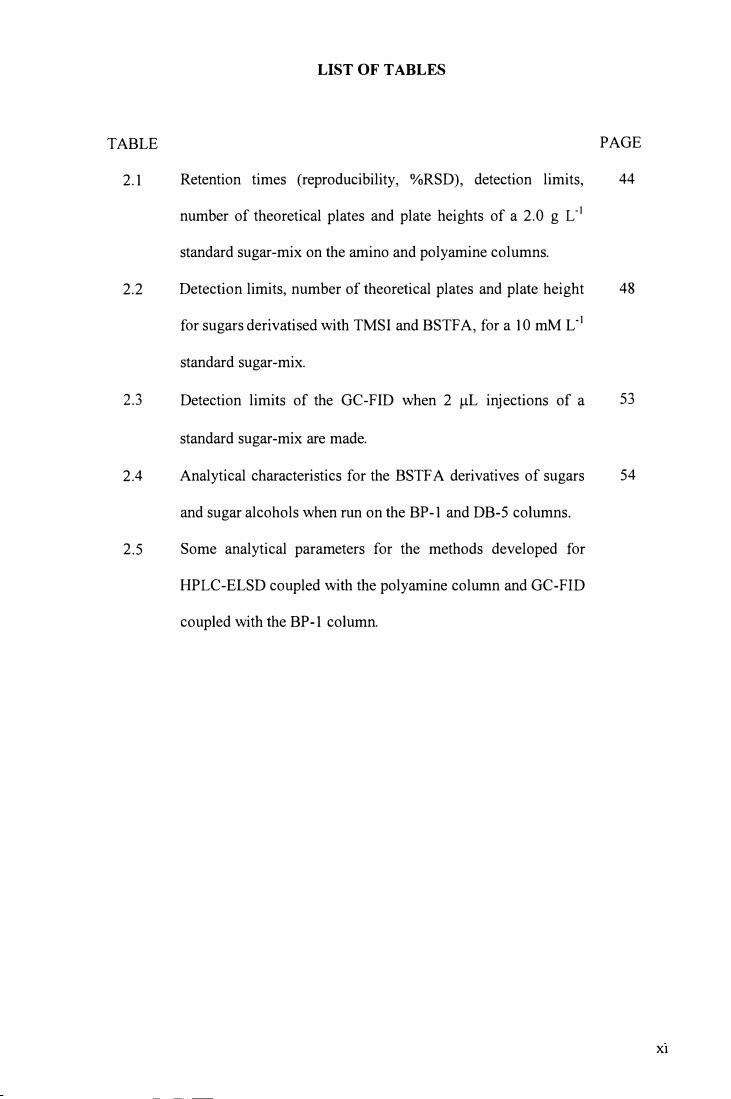
Retention times (reproducibility, %RSD), detection limits,
number of theoretical plates and plate heights of a 2.0 g L- 1
standard sugar-mix on the amino and polyamine columns.
Detection limits, number of theoretical plates and plate height
for sugars derivatised with TMSI and BSTFA, for a 10 mM L- 1
standard sugar-mix.
Detection limits of the GC-FID when 2 µL injections of a
standard sugar-mix are made.
Analytical characteristics for the BSTF A derivatives of sugars
and sugar alcohols when run on the BP-1 and DB-5 columns.
Some analytical parameters for the methods developed for
HPLC-ELSD coupled with the polyamine column and GC-FID
coupled with the BP-1 column.
PAGE
44
48
53
5 4 56 Xl
FIGURE
1.1
1.2
2.1
2.2
2.3
2.4
2.5
2.6
3.1
3.2
3.3
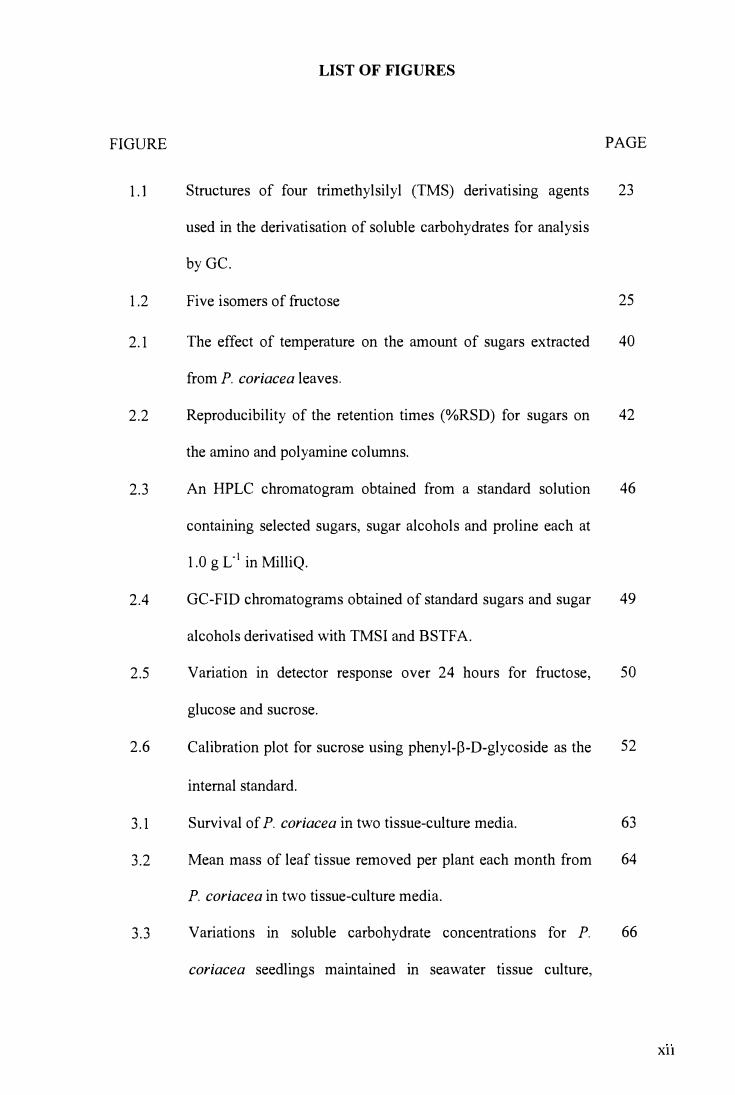
LIST OF FIGURES
Structures of four trimethylsilyl (TMS) derivatising agents
used in the derivatisation of soluble carbohydrates for analysis
by GC.
Five isomers of fructose
The effect of temperature on the amount of sugars extracted
from P. coriacea leaves.
Reproducibility of the retention times (%RSD) for sugars on
the amino and polyamine columns.
An HPLC chromatogram obtained from a standard solution
containing selected sugars, sugar alcohols and proline each at
1.0 g L- 1 in MilliQ.
GC-FID chromatograms obtained of standard sugars and sugar
alcohols derivatised with TMSI and BSTF A.
Variation in detector response over 24 hours for fructose,
glucose and sucrose.
Calibration plot for sucrose using phenyl-�-D-glycoside as the
internal standard.
Survival of P. coriacea in two tissue-culture media.
Mean mass of leaf tissue removed per plant each month from
P. coriacea in two tissue-culture media.
Variations in soluble carbohydrate concentrations for P.
coriacea seedlings maintained in seawater tissue culture,
PAGE
23
25
40
42
46
49
50
52
63
64
66
Xll

3.4
artificial seawater tissue culture, aquaria and grown in situ.
Variations in starch concentration for P. coriacea seedlings
maintained in seawater tissue culture, artificial seawater tissue
culture, aquaria and grown in situ.
71
Xlll
ABBREVIATIONS
ACN: Acetonitrile
ANOVA: Analysis of variance
BSA: N, 0-bis( trimethylsilyl)acetamide
BSTF A: N,0-bis(trimethylsilyl)trifluoroacetamide
Ci: Inorganic carbon
dwt: dry weight
ELSD: Evaporative light scattering detector
FID: Flame Ionisation Detector
fwt: fresh weight
GC: Gas chromatography
h: plate height
HMDS: Hexamethyldisilazane
HPLC: High performance liquid chromatography
h: Point of light saturation
LOD: Limit of detection
MeOH: Methanol
MOPS: 3-(N-morpholino) propanesulfonic acid
MS: Mass spectroscopy
M+S: Murashige and Skoog Basal Medium
n: Number of theoretical plates
Pi: Inorganic phosphate
Pmax: photosynthetic production at saturating irradiance
PAD: Pulsed amperometric detector
PDA: Photodiode array detector
XIV

---
RI: Refractive index detector
%RSD: Relative standard deviation
TMCS: Trimethylchlorosilane
TMS: Trimethylsilyl
TMSI: Trimethylsilylimidazole
tr : Retention time
UV-Vis: Ultra violet - visible light
xv
CHAPTER I: Introduction
I. t Posidmria coriacea and Tissue Culture
"Posidonia scagrasses, are the most important marine angiosperms
in temperate Australian coasts." (Kuo & Kirkman, 1996)
1.1.1 Ecological Importance of Posidonia coriacea
In Australia there are approximately 30 different species of seagrass that reside
in estuaries, island Jees and sheltered marine bays (Kirkman, 1997). P. coriacea is an
Australian Sf!agrass with long leathery leaves measuring approximately 7 x 1000 mm
(Cambridge, 1999; Kuo & Cambridge, 1984). It forms patchy meadows of25- 40%
coverage, compared to P. sinuosa that fonns closely knit meadows with 75 - I 00 %
coverage (Kirkman & Kuo, 1990; MacArthur & Hyndes, 2001). Major stands of P.
coriace!t meadows are found along the Western Australian coastline between Shark Bay
and Geographe Bay, and also along the South Australian coastline between Roe Plain
and Backstairs Passage, including Spencers Gulf and St. Vincent Gulf (Kuo &
Cambridge, 1984). These meadows occupy depths of 1 to 30m, in open ocean or rough
water sublittoral habitats (Campey el a/., 2000). Among their foliage are found a
variety of animals, including eight species of fish from the Odacidae family -
Siphonognathus radialus, S. beddomei, S. argyrophanes, S. attenuatus, S. caninus,
Odax acroptilus, Neoodax balleatus and Halella semifasciata (MacArthur & Hyndes,
2001).
Kirkman and Kuo {1990) found that while P. coriacea grew in disturbed
meadows the seedling and rhizome spread was slow and was often associated with other
seagrasses, particularly Amphibolis species. Unvegetated areas are colonized when
seeds are carried into the area by their positively buoyant fruit, which then releases the
negatively buoyant seed (Orth, 1999). Seeds settling in vegetated areas rarely establish
themselves due to the difficulty in establishing in the dense root mats of Posidonia
meadows and predation from marine organisms (Kirkman & Kuo, 1990; Kuo &
Kirkman, 1996; Orth, 1999). Seeds that do manage to become established often have
problems lasting through the turbulent winter weather (Cambridge, 1975). Growth of
P. coriacea meadows from rhizome extension is estimated to be 0.1 to 0.5 m year" 1
(Kendrick e/ a/., 1999).
1.1 .2 Changes in Seagrass Cover
An area of concern has been the decline of seagrass meadows of Cockburn
Sound, Western Australia, where species such as P. sinuosa, P. australis, P. coriacea,
Amphibolis griffithii and A. antarctica are found (Cambridge & McComb, 1984). P.
coriacea is predominately found on the exposed western side of Parmelia Bank and
Success Bank regions of Cockburn Sound (Cambridge & McComb, 1984; Kendrick et
at., 1999). Since 1955 industrial activity has been prevalent in this area, with the
discharge of cooling waters from an oil refinery, blast furnace and power station,
construction and dredging for an access jetty, and discharges from sewage-treatment,
and nitrogen and phosphorous fertilizer plants (Cambridge & McComb, 1984). Seagrass
meadow loss and growth in Cockburn Sound has been monitored by a number of
researchers since 1954 (Cambridge & McComb, 1984; Kendrick et al., 1999; Kendrick
2
et a/., 2000). Between 1954 and 1978 the meadow area was reduced from
approximately 4,200 to 900 ha (Cambridge & McComb, 1984).
The suggested reason for the original decline in seagrass was that the seawater,
enriched with nutrients from the surrounding activities, provided the appropriate
conditions for elevated growth of epiphytes. This impaired the ability of the sea grasses
to photosynthesise and led to extensive loss of seagrass meadows. While increased
numbers of phytoplankton have allo affected the depth to which seagrasses can occupy,
such blooms did not occur until after the major seagrass loss (Cambridge eta/., 1986).
Studies measuring the effect of epiphytes on photosynthesis have shown their effect on
seagrass decline to be possible (Silberstein et a/., 1986). Additionally, localized loss in
Cockburn Sound has been brought about by altered temperature, salinity, sedimentation
and water movement, oil refinery effluent and grazing by sea urchins (Cambridge et al.,
1986).
The major loss of seagrass, in areas such as Cockburn Sound, has led to interest
in developing protocols for revegetation. In Cockburn Sound this has included the
mechanical transfer of plants, harvested from established meadows, to revegetation sites
using a specially designed seagrass planting machine (Paling et al., 2001). Recently, a
method has been developed for sterilizing the fruits of Posidonia sp., which has
subsequently opened up an avenue for the multiplication of these species using tissue
culture (Henry, 1998). By producing plantlets on mass through tissue culture, there is an
greater possibility of developing a procedure with less impact on existing meadows
(Bird eta/., 1993).
3
1.1.3 Culture Methods
Attempts at culturing seagrasses started in the 1950's. Initial trials were
unsuccessful but further attempts were more fruitful (McMillan, 1980). At first planlets
survived less than a year, but with growing knowledge of the optimum culture
conditions seagrass longevity increased to over two years (McMillan, 1980). In 1988
Balestri et al. (1998) reported the first instance of in vitro germination and seedling
development of a Posidoniaceae member, P. oceanica, a species endemic to the
Mediterranean Sea. However, seedling survival after I 0 months was less than 75 % and
all plants eventually died (Balestri et a/., 1998).
Initially seagrass cultures used natural seawater as their starting medium but the
seagrasses did not survive beyond one year. A change to using artificial seawater saw
cultures surviving beyond two years (McMillan, 1980). It is thought that the initially
shorter survival period is due to natural seawater having a lower quality from variations
caused by human activities (McMillan, 1980). The use of artificial seawater also allows
researchers greater manipulation of salt concentration. For example, Bird et al. (1993)
found that when culturing Ruppia maritima a salt concentration between 0 and I 0 %
can increase rhizome and node growth, plus root production and growth. Additionally,
experiments by Balestri et a!. (1998) indicated that a different salt concentration was
required for seed germination and vegetative growth.
A carbon source is also necessary for the plantlets' survival (Woodhead & Bird,
1998). Organic carbon sources provide an energy and increase osmotic pressure
(Loques et al., 1990). Different carbon sources target different growth responses. For
example, in R. maritima bicarbonate stimulates elongation of roots while sucrose
stimulates root production (Bird et al., 1993; Woodhead & Bird, 1998). Bird et al.
4
(1996) have also noted that light-limited seagrasses do not grow in bicarbonate-based
media, but they do grow in sucrose-based media. Theoretically, this is because sucrose,
unlike bicarbonate, supplies reduced carbon that can meet the energy needs when
growth is stimulated (Bird eta!., 1996). Other soluble carbohydrates (glucose, mannitol
and myo-inositol) have also been used in tissue culture (Loques eta/., 1990). Axenic
cultures of P. oceanica showed little difference in growth when similar molar
concentrations were used of either sucrose or glucose (Loques et a/., 1990).
1.1.4 Biology
P. coriacea belongs to the species complex P. ostenfeldii, which also includes P.
ostenfeldii, P. denhartogii, P. robertsoniae and P. kirkmanii (Kuo & Cambridge, 1984).
Posidonia seeds are available only in the early Australian summer months. The seed
appears to have no dormancy period and would therefore be considered viviparous,
except that the seedling is not dependent on the parent plant (Kuo & Kirkman, 1996).
The large reserves of starch used for seedling growth are in the parenchyma
cells of the seeds' hypocotyl (Kuo & Kirkman, 1996). In P. coriacea most of this
starch is hydrolysed in the first three months, when the seedling possesses leaves up to 8
em long and the initial pair of roots are developing (Hocking, 1981; Kuo & Kirkman,
1996). After four to six months the amount of nutrients supplied from the reserve to the
seedling is not substantial (Kuo & Kirkman, 1996). After ten to twelve months, P.
coriacea seedlings in artificial culture die. This is thought to be a result of the starch
reserve being consumed by the eighth month and the seedlings being unable to
replenish their carbohydrate stores (Kuo & Kirkman, 1996).
5
1.1.5 Factors that Affect Photosynthesis
As the starch reserve in the seed is exhausted, it- is necessary for the plant to
continue to supply carbohydrates for various metabolic processes. A major source of
carbohydrates comes from the photosynthesis reaction that utilizes inorganic carbons,
such as C02 (James & Larkum, 1996). There are many factors that influence
photosynthesis, these include leaf age, light availability, pH and temperature (Alcoverro
et a/., 1998; Invers eta/., 1997; Ruiz & Romero, 2001; Seddon & Cheshire, 2001 ).
Leaf age is a major cause of variation in photosynthetic performance, with leaf
senescence following the loss of plastid integrity and the reallocation of nutrients
(Alcoverro et a!., 1998). The maximum leaf age is species specific: P. oceanica leaves
may survive for 300+ days, while Zostera marina leaves only survive for 50 days
(Alcoverro et a!., 1998). While there is no relationship between leaf age and
compensating irradiance (where net oxygen release is zero) or saturating irradiance,
there is a relationship with P max (photosynthetic production at saturating irradiance)
(Alcoverro et al., 1998). In P. oceanica, the latter pattern showed a decrease in Pmax
with leaf age from 50 days onwards (A1coverro et al., 1998).
A reduction in available light for seagrass photosynthesis has many
repercussions. For example, in P. sinuosa there were decreases in the standing crop,
leaf density, shoot density, leaf length and primary productivity (Gordon et al., 1994;
Neverauskas, 1988), similar effects were also found for P. oceanica (Ruiz & Romero,
2001 ). Long term reductions in light, resulting from epiphyte growth in high nutrient
waters, have led to mass seagrass meadow deaths (Cambridge eta/., 1986). Gordon et
a/. (1994) found that even after P. sinuosa was returned to natural light conditions,
following six months shading, the meadows showed signs of permanent damage.
6
The ability of a seagrass to survive long periods of light deprivation is thought to
be related to either its ability to store large quantities of carbohydrates, or to tolerate the
phytotoxic end products of anaerobic root respiration (Longstaff eta/., 1999). For
example, starch is stored as a source of energy to be utilised when photosynthesis is
inhibited. However, when light deprived, Halophila ova/is survives off sug!_ll's and not
the starch reserves (1999). The reason for this is suggested to be the condition of root
anoxia, where starch utilisation is inhibited in the roots (Longstaff et al., 1999).
Phytotoxic end· products (e.g. ethanol) might also accumulate to toxic levels during light
deprivation and cause rapid die·off (Longstaff eta/., 1999).
Photosynthetic activity is reduced in low and high light conditions. Shading of
P. oceanica led to a reduction of P max. which further reduced carbon assimilation (Ruiz
& Romero, 2001 ). The result of light limitation is a decrease in the leaves total
carbohydrate reserves and plant death may result even when only 2/3 of the
carbohydrate storage in the rhizome has been consumed, as seen in Z. marina
(Alcoverro et a/., 1999). However, shoot growth may still continue in light-limited
plants due to the shoot being the primary sink for reduced carbon and it may continue
even until plant death (Alcoverro eta/., 1999). In high light conditions it is necessary to
reduce photosynthesis in order to protect the photosynthetic apparatus (Alcoverro et al.,
1999).
Light requirements for photosynthesis are influenced by water temperature
(Masini et al., 1995). For example, in P. sinuosa maximum gross photosynthesis
almost doubles between 13 and 23 °C (Masini et a/., 1995). When reduced
temperatures are coupled with low light, the net photosynthesis may go into debit
(Masini et al., 1995). While photosynthetic efficiency increases with temperature, there
is no significant difference between 13 and 18 °C, however, there is a significant
7
increase in the point of light saturation (A) (Masini et a/., 1995). When the optimal
water temperature is exceeded there is a rapid decline in the rate of photosynthesis, due
to the loss of enzyme activity involved in catalysing the photosynthesis reaction and
changes in the transport of inorganic carbon (Seddon & Cheshire, 2001 ).
The water pH is important as it alters the ratio of HC03":C02 in the water, which
in turn alters the available inorganic carbon for photosynthesis. Increasing pH
decreases the C02 concentration, which also reduces the photosynthetic capacity as
HC03 ·is relatively inefficient as a carbon source (Beer, 1989; lovers et al., 1997).
1.1.6 Carbohydrate Biosynthesis in Seagrasses
The photosynthesis reaction requires an inorganic carbon source (Ci). In most
seagrasses the main point of entry for Ci is through the leaves, as in terrestrial plants.
However, for some species Ci may also enter through the roots and/or rhizomes (James
& Larkum, 1996). Ci entering through the roots or rhizomes must subsequently be
transferred to the leaves for photosynthetic fixation (Beer, 1989). Within the leaf the
epidermis is the primary site of photosynthetic activity (Beer, 1989).
In terrestrial plants C02 is the only Ci source available, but in seawater there are
four forms of C; (James & Larkum, 1996). Only CO, and HCOi are thought to take
part in seagrass photosynthesis, however, there is much discrepancy over how much, if
any, Hco,- is utilized (Beer, 1989; James & Larkum, 1996). James and Larkum (1996)
suggest P. australis and P. oceanica utilize HCoJ· in up to 25 and 53 % of their Ci
demands respectively. If HC03' is utilized it may enter the plant by conversion via
H2C03 to C02, accomplished by acidification within the layer next to the leaf surface
8
(Beer, 1989; James & Larkum, 1996), or it may be actively transported directly into
photosynthesising cells (Touchette & Burkholder, 2000).
Photosynthetic fixation of Ci occurs either via the C3 or C4 pathways; as yet
there is no support for the crassulacean acid metabolism (CAM) pathway (Beer, 1989;
Touchette & Burkholder, 2000). Improved analytical techniques have identified many
seagrasses that were thought to be C4 plants as C3 plants. In C3 plants C02 is the carbon
form used by the enzyme ribulose-1,5-bisphosphate carboxylase-oxygenase (Rubisco),
while in C4 plants HC03- is used by phosphoenolpyruvate carboxylase (PEPC) (Beer,
1989). Nine of ten seagrass species studied have been identified as C3 plants (Beer,
1989). One theory also suggests that C4 photosynthesis could be an inducible response
to low internal dissolved Ci levels (Touchette & Burkholder, 2000).
In the C3 pathway, carboxylation of carbon to ribulose 1,5-bisphosphate, a 5-
carbon sugar, produces a product that splits into 3-phosphoglycerate (PGA), a 3-carbon
molecule (Touchette.& Burkholder, 2000). Rubisco is involved in this carbon fixation,
but under high 0 2 concentration, temperature, or light it can be used for
photorespiration- a C02 releasing or carbon loss process (Touchette & Burkholder,
2000).
Starch and sucrose are biosynthesised in the plastid and cytosol respectively,
from 3-PGA, triose-phosphate and dehydroxyacetone (Touchette & Burkholder, 2000).
Sucrose is produced under high inorganic phosphate (Pi) levels, where more triose
phosphate is exported to the cytosol (Touchette & Burkholder, 2000). Starch
production increases as a result of low Pi levels and reduced exportation from the
plastid of triose-phosphate (Touchette & Burkholder, 2000). The carbohydrate
preferred for storage is species specific, one species may prefer sucrose while another
may store starch, raffinose or stachyose (Touchette & Burkholder, 2000).
9
Sucrose biosynthesis involves the enzyme su.crose~phosphate synthase (SPS),
which in Z. marina has been correlated with changes in COz availability,
photosynthesis, salinity and temperature (Touchette & Burkholder, 2000). In sink
tissues, sucrose is hydrolysed into glucose by the enzyme invertase, or into uridine
diphosphate~glucose (UDP-glucose) and fructose by sucrose synthase (Touchette &
Burkholder, 2000). Sucrose synthase activity is suggested to increase plant survival
during periods of carbon limitation by maximizing sucrose availability (Touchette &
Burkholder, 2000).
Starch synthesis occurs under high levels of triose-phosphate, yielding fructose
1,6~bisphosphate (Touchette & Burkholder, 2000). Starch synthase is then utilised to
transfonn adenosine diphosphate-glucose (ADP-glucose) into starch (Touchette &
Burkholder, 2000).
Of the soluble carbohydrates in P. oceanica, generally 90 % is sucrose, with the
balance including glucose, fructose and myo~inositol (Pirc, 1989). Other sugars found
in seagrass include apiose, fucose, galactose, mannose, rhamnose, xylose and mannitol
(Pirc, 1989; Touchette & Burkholder, 2000). Carbohydrate storage in the stem, leaf,
root and rhizome is on average 95, 100, 135 and 275 mg g" 1 dry weight (dwt)
respectively (Touchette & Burkholder, 2000). Generally, seagrasses with high
compensation irradiance (the light intensity where 0 2 production equals 02 demand),
such as Posidonia species, have total leaf soluble carbohydrates in excess of 50 mg g" 1
fresh weight (fwt) (Touchette & Burkholder, 2000). According to Drew (1983), the
maximum sucrose, glucose and fructose levels in P. au<;fra/is are 1-10 %, < 0.1 %and <
0.1 % dwt respectively. Starch levels in P. oceanica are< I % dwt (Pirc, 1989).
10
1.2 Methods of Sugar and Starch Analysis
1.2.1 Introduction to Carbohydrate Analysis
' Methods used for analysing plant carbohydrates involve three steps: extraction of
carbohydrates from the plant tissue using solvents, preparation of the extract for
analysis and the analysis of the extract. The techniques for extraction and preparation
are dependent on whether soluble or insoluble carbohydrates are to be analysed.
Analysis of carbohydrates is usually by chromatographic and spectrophotometric
methods.
A generalised definition of chromatography is ' ... a method, used primarily for
separation of the components of a sample, in which the components are distributed
between two phases, one of which is a stationary while the other moves. The stationary
phase may be a solid, liquid supported on a solid, or a gel. The stationary phase may be
packed in a column, spread as a layer, or distributed as a film ... The mobile phase may
be gaseous or liquid.' (Robards eta/., 1994).
Two common methods used for chromatographic soluble carbohydrate analysis
are high perfonnance liquid chromatography (HPLC) and gas chromatography (GC).
The HPLC technique is ideal for non~volatile and thennally unstable compounds. The
GC technique is ideal for volatile compounds and also for when sensitive detection is
required. Spectrophotometric methods arc used for the analysis of insoluble
carbohydrates.
II
1.2.2 Extraction of Carbohydrates from Leaves
Extraction of carbohydrates from plant tissue involves the extraction of the
soluble carbohydrates followed by insoluble carbohydrates. There are numerous
methods in the literature for each, of which some arc presented here. Extraction of
soluble carbohydrates has been carried out at a range of temperatures between 0 and
100 gC and in a number of solvents. The insoluble carbohydrates are then 'gelled' at
high temperature before the addition of acid, which hydrolyses the starch into its
individual sugar units.
Prior to extraction, plant material is ground into a fine powder to maximise the
extraction of the analytcs into the extracting solvent. The complexity of the extract
methods reported for the extraction of soluble carbohydrates, varies from a single hot
water extract used by Pirc (1985), to dialysis methods, as used by Kleinschmidt eta/.
(1998).
However, for soluble carbohydrates, the most commonly used methods involve
an alcohol/water extraction, using methanol or ethanol, but even here the method details
can vary significantly. Halligan & Drew (1971) used three hot 80% ethanol extracts
over 24 hours, followed by two hot ethanol washings. Morvai & Molmir·Perl (1990)
completed extractions at both 25 gC and by refluxing with 80% ethanol or methanol for
20 minutes, followed by several washings. Kahane eta/. {2001) incorporated calcium
carbonate into an ethanol extraction medium to prevent a reduction in pH. Chapman &
Horvat (1989) completed one extraction in 25 mL 75% ethanol for 10 minutes at room
temperature, with the total sugar yield being approximately I 00 %, while Lo Bianco
and Rieger (1999) only used 5 mL 80% methanol. Bleton eta/. (1996) combined 15
12
mL methanol with 0.4 mL acetyl chloride to form a methanolic HCl solution and
mcthanolysis was carried out for 24 hours at 80 °C.
Combinations of methanol (MeOH), chloroform (CF) and water have also been
used tbr soluble carbohydrate extractions. Adams er a/. (1992) extracted soluble
carbohydrates with MeOH:CF:water (12:5:3). Following this, water was added to the
extract to form two phases and the McOH:water phase was desalted using ion exchange
columns in the H+ and OH. forms. Naidu (1998) completed extractions on ice, using 5
mL MeOH:CF:water (12:5:3), adding an additional 5 mL water to form two phases. A
second extraction was found to only provide an additional2 %of analyte (Naidu, 1998).
Perchloric acid has also been used for the extraction of soluble carbohydrates. A
general method is given by Gutmann & Wahlefeld (1974), where 5 mL 5% perchloric
acid was added to 1.0 g plant tissue, followed by a second extraction with 1 mL 5 %
perchloric acid plus 1 rnL water. An altered version of this is given in Adams et a!.
(1999) where 0.1 g plant tissue was extracted twice using 5 mL 5 % perchloric acid at 4
oc, followed by the precipitation of perchlorate by adjusting the solution to pH 3 - 3.5
with I M K2C03. Using two extractions with the perchloric acid method extracted at
least 96% of analytes (Gutmann & Wahlefeld,, 1974).
Like soluble carbohydrates, there are various meth0ds for extracting starch,
some of which are specific for reducing sugars, glucose,. or he;xose sugars (Macrae et
a/., 1974). In analysing starch content in P. coriacea, Pirc (1985) gelatinised the starch
at 80 °C in 1.1% HCI for IS minutes. The starch was then neutralised with I M NaOH
before adding the enzyme amyloglucosidase to degrade the starch to glucose. Buysse
and Mercx (1993) also used HCI, but in this case the starch was hydrolysed by boiling
for 3 hours in 3 % HCI.
13
In a method described by Quannby & Allen (1989), starch in the plant material
was firstly gelatinised in a small amount of boiling water for 15 minutes. After cooling,
60 % perchloric acid was rapidly added. This method was also used by Longstaff and
Dennison (1999) in the analysis of starch in seagrasses. A modified version of Hansen
and Maller's method (Burke eta!., 1996) has used cold (0 °C) 30% perchloric acid for
starch hydrolysis.
1.2.3 High Performance Liquid Chromatography
High performance liquid chromatography involves the analysis of semi- to non
volatile compounds. In analytical mode, typically a 5- 50 lJ.L sample is injected into a
liquid mobile phase, which is pumped under high pressure through a column
approximately 4 mm x 10 - 30 em. The column is generally packed with 5 J.lffi
particles coated with the stationary phast:. Separation of analytes takes place due to the
relative interaction of the analyte with the mobile and stationary phases. Separated
~:"omponents are then passed by a detector, which gives a signal response based on the
physical property of the solute or mobile phase. The signal is recorded on a data system
(e.g. computer workstation) for analysis of the results. HPLC does not necessarily
require preparation of the plant sample for analysis but it may be used to obtain lower
detection limits. A variety of column and detector combinations may be used for
analysis but there are restrictions. For example, a column may have specific mobile
phase requirements that are not compatible with a particular detector. This section
reviews the detectors and columns used for HPLC carbohydrate analysis.
14
1.2.3.1 HPLC Detectors
The main detectors used for soluble carbohydrate analysis with HPLC are the
refractive index detector (RI), ultra violet-visible detector (UV-Vis), electrochemical
detectors and evaporative light scattering detector (ELSD). Their detection limits vary
over several orders of magnitude and where these are not low enough derivatisation of
the analyte may be an option. Derivatisation involves attaching a chemical to the
analyte to which the detector is highly sensitive.
The Rl detector is sensitive to analytes with a different refractive index than the
mobile phase. When using a Ca(II) column and a purely aqueous mobile phase,
detection limits for non-derivatised soluble carbohydrates were 100 mg L-1 and the
reproducibility of the R1 detector response was < 3.0 % relative standard deviations
(%RSD) (Lee & Coates, 2000; van de Merbe1 et ol., 1992). van de Merbe1 et al. (1992)
compared the perfonnance of the carbohydrate detector capabilities of the UV ~Vis and
RI detection with and without post~column derivatisation; derivatisation increased
sensitivity by I OO~fold.
When using UV~Vis for detection of sugars, the detector is normally set at 190
nm where maximum absorbance occurs. Sugars do not possess a chromophore and
therefore poorly absorb UV-Vis light. Above and below 190 nm the absorbance drops
dramatically. The detection limits for carbohydrates in a pure aqueous mobile phase,
using UV-Vis detection coupled with a Ca(II) column, is 1000 mg L" 1 (van de Merbel et
al., 1992). Sensitivity is increased by using a mobile phase of water containing a low
concentration of calcium ethylenediaminetetraacetate (CaEDTA), this has given
detection limits of approximately 10 ng L" 1 for glucose and fructose (Naidu, 1998).
Sensitivity is also increased by post-column derivatisation, with p
aminobenzoic acid hydrazide derivatives giving detection limits of 1 j.lg L"1 for glucose
15
and fructose when using UV-Vis detection at 410 run (van de Merbel e/ a!., 1992).
Another derivatising agent is 1-phenyl-3-methyl-5-pyrazolone (PMP), where
derivatised sugars are analysed at 245 nm. Glucose-PMP derivatives gave detection
limits of about 0.2 ng L-1 and reproducibility of the detector response was 1.9 %RSD at
the 2 ng L'1 level (Honda eta/., 1989).
The equipment for post-column derivatisation is not always available and the
strict conditions required by some derivatising agents means that only a small
percentage of carbohydrate derivatives are formed (Honda et a!., 1989). It therefore
may be more viable to use pre-column derivatisation. For example, Nojiri et al. (2000)
used a method to analyse sugar alcohols. Briefly, I 0 % p-nitrobenzoyl chloride, in
pyridine solution, was added to anhydrous samples, which was incubated for 60 - 90
minutes at 50 °C, before being evaporated to dryness. The residue was taken up in
chloroform and passed through a silica Sep-Pak cartridge to eliminate excess reagent.
Solvents were evaporated off and the residue was re-dissolved in acetonitrile for HPLC
analysis. Derivatives were detected with UV-Vis detection at 260 nm. While low
detection limits for carbohydrates can be achieved with UV-Vis, this is only when used
in conjunction with derivatisation. Derivatisation for HPLC can be a long process and
is not convenient when analysing a large number of samples.
One way to avoid derivatisation and still achieve low detection limits, is by
using pulsed amperometric detection (PAD). This method employs an electrode that
generates a current specific for oxidization of sugars, which leaves other components in
the sample undetected (Hanko & Rohrer, 2000). Electrodes that have been used include
the Au working electrode (Adams et al., 1993; Corradini eta!., 2001; Hanko & Rohrer,
2000) and the Ag/AgCl electrode (Gailing eta/., 1998; Guraya eta/., 2001).
16
PAD electrodes normally work using a triple-pulse waveform, for example
+0.05 V for 0.00 to 0.40 s, then +0.75 V from 0.41 to 0.60 s, then -0.15 V from 0.61 to
1.00 s, with integration between 0.20 and 0.40 s (Hanko & Rohrer, 2000). While the
triple-pulse waveform initially gives good detection, it has been found that over several
months the detector response decreases (Hanko & Rohrer, 2000). This degradation is
avoided by using a quadruple-pulse waveform described by Hanko & Rohrer (2000).
A method used by Lee and Coates (2000), employing PAD for analysis of myo
inositol, glucose, fructose and sucrose gave detection limits between 45 to 300 ng. The
detection limit when using theCarboPac MAl column with PAD, was approximately 1
ng for sugar alcohols and monosaccharides and 4 ng for sucrose (Hanko & Rohrer,
2000). The detection limits for glucose when using a sulfonated mono-disperse resin
based column (H' form) was 5 ng (Corradini eta/., 2001). Honda et a/. (1989) used
PMP derivatives, a C18 column and PAD to achieve detection limits for glucose at 18.0
pg.
While the Au and Ag/AgCI electrodes are widely used for electrochemical
detection in carbohydrate analysis, a more recently introduced electrode is the nickel
chromium alloy (Ni-Cr) electrode. The Ni-Cr electrode, however, does not require
continual pulsing as adopted in PAD, instead it uses a constant potential amperometric
detection (Mora & Marioli, 2001 ). The proposed mechanism of the electrode is that
sugars are oxidized by an electro-catalytic process involving Ni(Il)/N(II)
oxy/hydroxides (Mora & Marioli, 2001). This electrode has given very low detection
limits of90 pg for glucose, without the need for derivatisation (Mora & Marioli, 2001).
Methods employing electrochemical detection show good sensitivity, however,
as it is only useful for species that can be oxidised or reduced, it is not a versatile
detector. The technique also requires highly specific conditions: anion exchange
17
columns, electrolytic mobile phases and high pH. The equipment can also be complex,
difficult to equilibrate and requires maintenance for high sensitivity.
A recently developed detector that overcomes many of the disadvantages of the
detectors mentioned above is the ELSD. This is a universal detector with good
sensitivity, no maintenance, is relatively easy to operate and it can work with a range of
mobile phase solvents. Another advantage is that its baselines are stable and flat, unlike
UV-Vis detection that is affected by non-isocratic mobile phases and RI detection that
can give fluctuations due to pressure changes from injections. For detection, the ELSD
evaporates the mobile phase in a drift tube and blows a stream of nitrogen gas over the
non-volatiles, before measuring the amount of light scattering produced by semi- or
non-volatile components in a sample. This method does not require sugars to be
derivatised and the detection limits for fructose, glucose and sucrose are between 30 -
80 ng (Young, 2002).
1.2.3.2 HPLC Columns
The amino column is most commonly used for normal phase separation, in
conjunction with an acetonitrile (ACN) and water mixture as the mobile phase (de Ia
Cruz-Garela et al., 2001). Over time, the performance of the amino column may be lost
due to Schiff's base formation. Further loss of resolution may come from bleeding of
the amino groups from the column. To overcome this problem a polyamine column has
recently been developed, which combines amine functional groups in a polymer resin
coating. This provides the same selectivity as the amino column but with greater
stability and longer life. This column can also be reconditioned to remove the Schiff s
base formation.
18
The elution order for the amino and polyamine columns is monosaccharides,
disaccharides and then sugar alcohols, with fructose, glucose, sucrose and myo-inositol
resolved and eluted within 20 minutes (Lee & Coates, 2000). The reproducibility of
retention times was< 3.0 %RSD (Lee & Coates, 2000). The ratio of ACN:H20 can be
altered depending on the resolution of cluants and their molecular weights (MW). High
concentrations of water in the mobile phn.~ will clute high MW sugars faster. If a
sample contains sugars of both low and hil,h MW it is possible to use a programmed
run, starting off at a high ACN:I·hO ratio (i!.~. 80:20 %) and ending at a low ACN:H20
ratio (e.g. 50:50 %). This will resolve low ~W sugars and reduce retention times of
high MW sugars. However, programmed mobile phases such as this are not possible
for use with RI detection where changes in the mobile phase would affect the refractive
index.
Young (2002) combined the polyamine column with an ELSD detector to analyse
carbohydrates in a variety foods and beverages. This combination gave short run times
(sucrose eluting <15 minutes) with high sensitivity. Young was also able to produce
run times that were shorter again by the addition of acetone into the ACN:H20 mobile
phase, which enhanced peak efficiencies (Young, 2002). A similar method was also
used to analyse carbohydrates in onions (Kahane et al., 2001 ).
Another option for carbohydrate separation is to use cation exchange columns.
These columns comprise of sulfonated styrene divinylbenzene resins and come in either
lead (Pb(II)) or calcium (Ca(II)) forms. The mobile phase conditions are quite strict:
water or water with an organic modifier (e.g. CaEDTA), high temperatures (80- 90 °C)
and low flow rates(< 0.6 mL min'1). Soluble carbohydrates are separated principally by
size exclusion (larger molecules elute earlier), but also by ligand exchange and
partitioning effects (Lee & Coates, 2000; Naidu, 1998). Ligand exchange coordinates
19
the hydroxyl groups of sugars and polyols with the cations on the resin. The elution
order is opposite that of the amino column- higher MW sugars elute first and low MW
sugars last (Lee & Coates, 2000) and is therefore useful as a complimentary column for
checking co~eluting peaks. It is important to note that samples should be free of cations
(e.g. Ni(II), Fe(II), Co(!!), or high concentrations ofH+) as they may exchange with the
bound ions on the column and result in an unpredictable stationary phase (Marko-Varga
et a/., 1990).
The Ca(ll) column is often coupled with RI detection, but it may also be used with
UV detection. Separation of plant sugars and sugar alcohols (including raffinose,
trehalose, glucose, fructose, inositol and mannitol) has been achieved in a run time of
less than 16 minutes on a Polyspher OA~KC column, however, not all peaks had
baseline resolution (Kleinsclunidt et al., 1998). The method employed by Naidu (1998),
using a Ca(II) column, failed to resolve sucrose and trehalose.
Methods employing PAD can be coupled with anion-exchange columns, for
example, the Dionex CarboPac PAlO column. As sugars are very weak acids (due to
their -COOH group), at high pH they can be separated on a column as anions. The
mobile phase of choice is most often NaOH, with its concentration affecting
chromatographic separations and retention times. However, when low concentrations of
NaOH are used for the mobile phase, detection sensitivity may be lost. Sensitivity may
be increased by adding a solution of high concentration NaOH through a post~column
delivery system (Gailing eta/., 1998). In the method used by Lee and Coates (2000),
the retention times for myo~inositol, glucose, fructose and sucrose were less than 10
minutes.
The Dionex CarboPac columns include the PAl, MAl and PAlO. These are
fil~;;;d with a pellicular anion exchange resin (i.e. particles with a large, spherical solid
20
core (e.g. 10 J.tm) with a thin covering layer (e.g. 0.3 }liD) of resin. Pellicular particles
are more efficient than large fully porous particles, because they offer a lower resistance
even though they are of similar size (Robards et a/., 1994). These columns are,
however, restricted to operating at low pressure and low concentrations of organic
modifiers. Adams eta/. (1993) calculated the PAl to have lower capacity factors for
analytes than the MAl, that is, the PAl retained less analyte in the stationary phase than
the mobile phase.
The reproducibility of the retention times on the MAl for all soluble
carbohydrates was < 0.4 %RSD (Hanko & Rohrer, 2000). While these figures are
good, the retention times for the sugars are quite long with sucrose eluting at 45 minutes
on the MAl column, however, it does elute slightly earlier on the PAl column (Hanko
& Rohrer, 2000).
Another ion exchange column is the sulfonated monodisperse resin-based
column (H+ form). These columns separate components on the principle of ion
exclusion and partition and while they prefer pure water as the mobile phase a low
concentration ofNaOH is required for PAD analysis (Corradini et al., 2001).
Cl8 columns can support a mobile phase of organic solvents and varying pH
(Honda et a/., 1989). Honda el a/. (1989) used a mixture of 0.1 M phosphate buffer and
ACN, to a concentration of 20% (v/v), to separate PMP derivatives on a C18 column.
While derivatisation provided excellent sensitivity for detection, the retention time for
glucose was quite long (approximately 40 minutes). This could be reduced by using a
higher concentration of ACN, for example 23 % (v/v) reduced the retention time to less
than 20 minutes (Honda eta/., 1989).
21
The retention times on a phenyl column, using a 67:33 % ACN:H20 mobile
phase, for glucose, sucrose and mannitol derivatives of p-nitrobenzoyl chloride were
quite long at 15.3, 39.9 and 48.9 minutes respectively (Nojiri et al., 2000).
1.2.4 Gas Chromatography
When available, GC provides a viable alternative to HPLC if low dete..::tion limits
are required. Typically, injections of 0.1 - 10 lJ.L are made into an injection port 20- 40
°C higher than the column temperature. An inert gas mobile phase is used to push the
sample through a column where the analytes are separated by their relative interactions
with the stationary phase. Separated components then pass a detector where they
provide an electrical signal that is recorded on a data processor. Throughout this
process the sample is kept at high temperatures (1 00- 350 °C) so as the keep them in a
gaseous phase. However, sugars are not volatile, so prior to injection they must be
derivatised.
1.2.4.1 Sample Preparation
The derivatisation process replaces the hydrogen in functional groups of -COOH,
-OH, -NH and -SH. There are three types of derivatising agents: silylation agents,
acylation agents and alkylation agents. For analysis of sugars the silylation agents are
recommended due to their ease of use and high reactivity (Knapp, 1979). However, it is
important for the sample, solvent and equipment used to be free of moisture when
adding this agent due to the preference it has for reacting with the -OH group of water.
Silylation involves the replacement of the functional group hydrogen with a
trimethylsilyl (TMS) group. This increases the volatility of the analyte by blocking
22
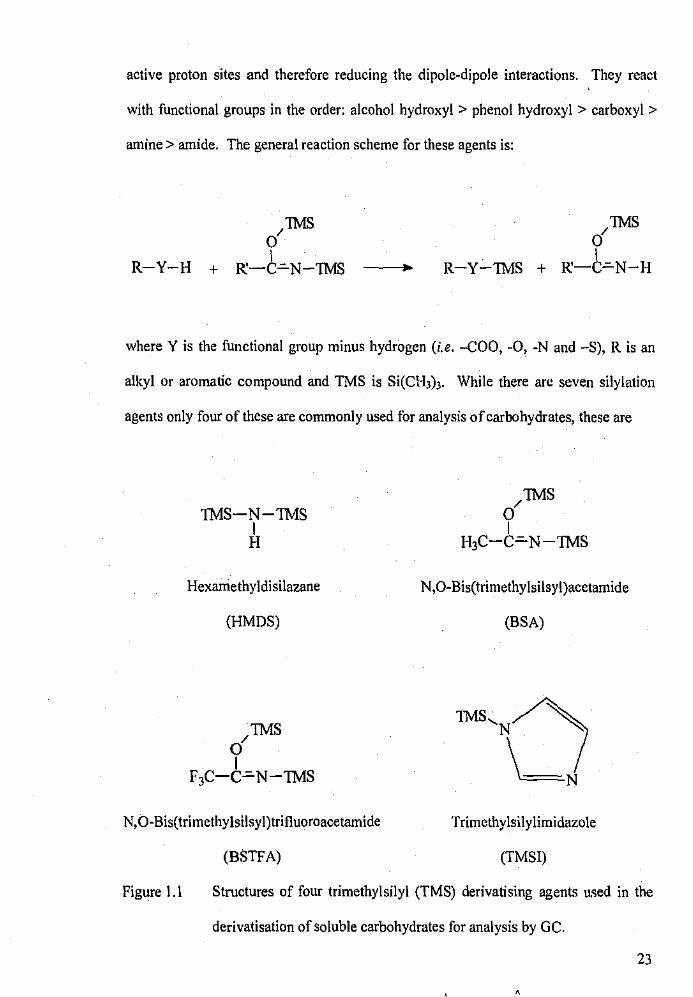
active proton sites and therefore reducing the dipole-dipole interactions. They react
with functional groups in the order: alcohol hydroxyl > phenol hydroxyl > carboxyl >
amine > amide. The general reaction scheme for these agents is:
R-Y-H
/1MS 0 I
R-Y-1MS + R:-C~N-H
where Y is the functional group minus hydrogen (i.e. -COO, -0, -N and -S), R is an
alkyl or aromatic compound and TMS is Si(Cl-b)3. While there arc seven silylation
agents only four of these are commonly used for analysis of carbohydrates, these are
1MS-N-1MS
h Hexamethyldisilazane
(HMDS)
/1MS 0 I
F3C-C=N-1MS
N,O-Bis(trimethylsilsyl)trifluoroacetamide
(BSTFA)
/1MS 0 I
H,C-C=N-1MS
N,O-Bis(trimethy!silsyl)acetamide
(BSA)
Trimethylsilylimidazole
(TMSI)
Figure 1.1 Structures of four trimethylsilyl (TMS) derivatising agents uc;ed in the
derivatisation of soluble carbohydrates for analysis by GC.
23
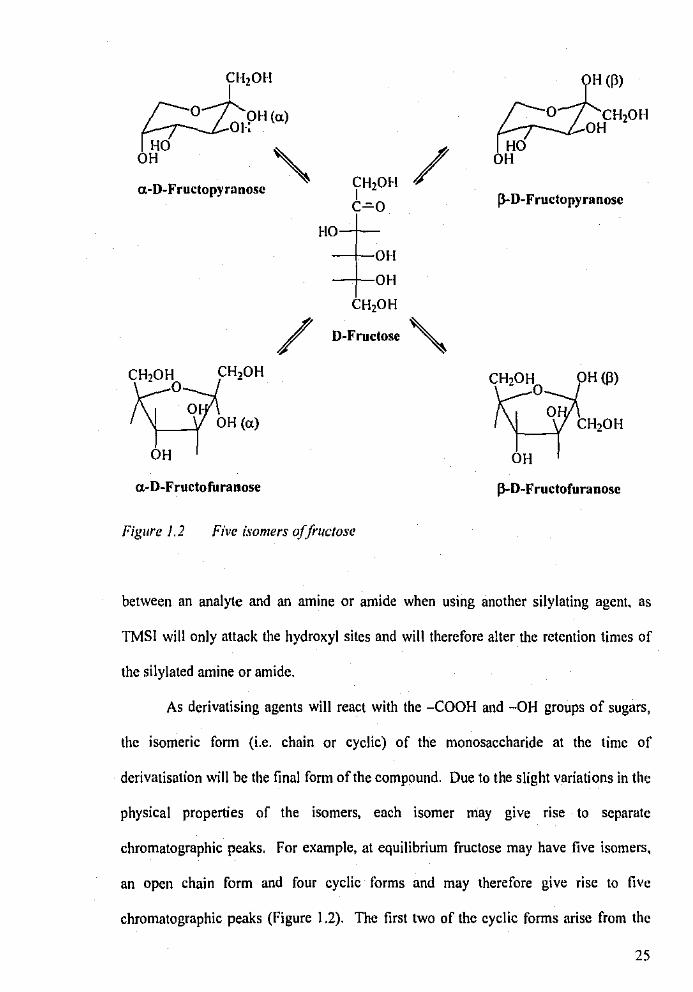
hexamethyldisilazane (HMDS), N,O-bis(trimethylsilyl)acetamide (BSA), N,O
bis(trimethylsilyl)trifluoroacetamide (BSTFA) and trimethylsilylimidazole (TMSI).
The structures of these agents are shown in Figure 1.1.
While HMOS is specifically recommended for carbohydrate analysis, it is a
weak TMS donor and will therefore only react easily with hydroxyl groups (Knapp,
1979). To provide a faster and more quantitative reaction the catalysts
trimethylchlorosilane (TMCS) or trifluoroacetic acid may be used. The general
conditions required for derivatisation with HMOS are an anhydrous sample, taken up in
HMOS and a catalyst and heated for 60 minutes at high temperature (e.g. 60- 100 °C}
(Knapp, 1979).
BSA fonns TMS derivatives under mild conditions with most organic functional
groups. It remains stable for at least 9 hours (Pirc, 1985). For derivatisation to occur an
anhydrous sample is taken up in a BSA/pyridine mix and heated for 20 minutes at 60 °C
(Knapp, 1979). However, some samples may require heating for up to 16 hours. One
disadvantage of using BSA is that it can foul the flame ionisation detector by oxidizing
to fom1 silicon dioxide.
BSTFA is one of the most reactive of the silylating agents. It reacts more
completely and produces more volatile derivatives than BSA due to the trifluoroacetyl
group. Also, unlike BSA, the combustion by-product silicon trifluoride does not foul
FID detectors. For analysis of molecules with secondary alcohols and amines, where
the functional groups are hindered, a mixture with TMCS may be used to catalyse the
reaction.
TMSI is highly recommended for carbohydrate analysis (Knapp, 1979). It is a
selective TMS donor that will not react with hindered amines or amides, but it will react
with alcohols and phenols. This agent may therefore be used if co-elution occurs
24
CH,OH
a.-D-Fructopyranosc ' CH,OH I c=o
HO
OH
OH
CH20H
/ D-Fructose
CH20H
OH
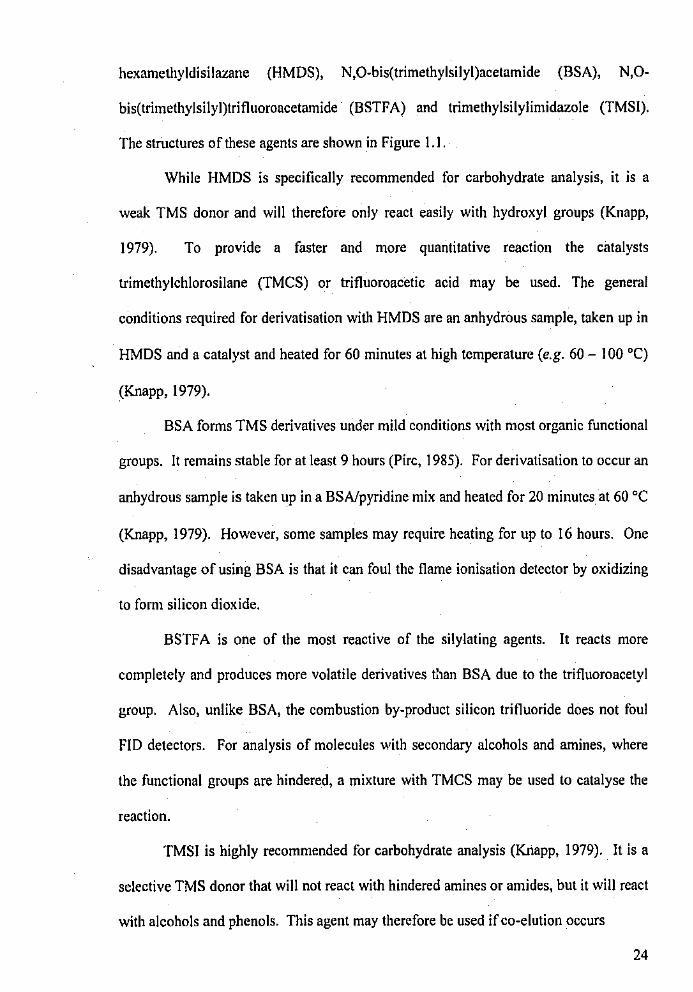
a-D-Fructofuranose
Figure 1.2 Five isomers of frucJose
/
'
H <P>
fl-D-Fructopyranosc
CHH,OHO 0 OH <P>
CH,OH
OH
Jl--0-Fructofuranosc
between an analyte and an amine or amide when using another silylating agent. as
TMSI will only attack the hydroxyl sites and will therefore alter the retention times of
the silylated amine or amide.
As derivatising agents will react with the -COOH and -OH groups of sugars,
the isomeric form (i.e. chain or cyclic) of the monosaccharide at the time of
derivatisation will be the final form of the compound. Due to the slight variations in the
physical properties of the isomers, each isomer may give rise to separate
chromatographic peaks. For example, at equilibrium fructose may have five isomers,
an open chain form and four cyclic forms and may therefore give rise to five
chromatographic peaks (Figure 1.2). The first two of the cyclic forms arise from the
25
rotation at the nnomeric carbon (-COOH) to fonn either a-D-fructose or P-D-fructose,
where the anomeric -OH group lies either cis or lrans to the tenninal -CH20H group.
The other two cyclic fonns refer to the fonnation of a five-membered ring (furanose) or
a six-membered ring (pyranose). All isomeric fonns arc interchangeable via the open
chained form designated D-fructose (Figure 1.2).
When analysing a complex chromatogram it is not k1eal for an analyte to
produce multiple peaks. Converting the sugars to their oximes may restrict the number
of chromatographic peaks produced for each monosaccharide. An oxime is formed at
the double bond of the keto group of open chain sugars.
R-CH''~o'· + H,N-OH ~ R-CH~N-OH + H20
By reacting the sugars with hydroxylamine hydrochloride (NH20H.HC1) in the
presence of pyridine the C=O group is converted to C=N-OH. The sugar is therefore
prevented from forming the cyclic structure, which minimizes the number of
chromatographic peaks produced.
1.2.4.2 GC Colum11s
Separation of analytes by GC can occur on two types of columns, packed and
capillary. Characteristically, packed columns are 2 - 4 mm x 1 - 6 m and capillary
columns are 0.1- 0.75 mm x 10- 100m. Packed columns contain a dense packing
material coated with a thin liquid stationary phase. Capillary columns have an open
tubular form with the stationary phase coated on the wall of the column or a support,
such as diatomaceous earth.
26
A common stationary phase on columns used in the analysis of carbohydrates is
polydimethyl si\oxane, with varying percentages of phenyl groups attached to alter the
polarity of the phase. For example, the DB-I column contains no phenyl groups,
therefore the column is non-polar and quickly elutes polar analytes, such as sugars.
Analysis of carbohydrates on a DB-I column have been carried out by Adams et
a/.(1999), Chapman & Horvat (1989) and Chen eta/. (1998). A DB-5 column contains
5% phenyl, slightly increasing the polarity, which increases the retention time of sugar
analytes. Analysis of carbohydrates on a DB~S column have been carried out by Bleton
et a/. ( 1996), Dormaar & Willms (1990), Ha & Thomas (1988) and Lo Bianco et a/.
(1999).
Other stationary phase options include the MS and De.xsil packings. The MS
capillary columns are a methyl polysiloxane with varying ratios of phenyl groups. The
MS designation indicates a very low bleed column that makes the column suitable for
use with the mass spectroscopy detector. An example is the HP-5 MS capillary column
used by Lee et al. (2002) and Oddo et a/. (2002). Dexsil contains methylsi!icone with
varying ratios of carborane. It has been used at 3 % (Janauer & Englmaier, 1978; Pirc,
1985) and 15 %ratios (Morvai & Molnar-Perl, 1990) in carbohydrate analysis.
1.2.4.3 GC Detectors
Separated carbohydrates in a sample are detected by either a flame ionisation
detector (FID) or a mass spectroscopy (MS) detector. The FID measures an electrical
response produc~d by the burning of organic compounds in a hydrogen/air flame of
approximately 300 °C, At this temperature reduced carbons produce ions and electrons
that conduct electricity, which is collected and amplified for mea·surement. Analysis of
27
soluble carbohydrate samples using FID have been carried out by Bleton et al. (1996),
Lee eta/. (2002) and Oddo eta/. (2002).
The MS detector continuously analyses each chromatographic zone that elutes
from the column, by separating the various ions and recording their mass to charge
(m/z) ratios. MS is therefore useful for creating characteristic ion profiles for analytes,
which can be used in the identification of analytes. GC-MS has been utilised for
soluble carbohydrate analysis by Adams eta/. (1999), Chen el a/. ( 1998), Ha & Thomas
(1988), Janauer & Englmaier (1978), Morvai & Molnar-Perl (1990) and Pirc (1985).
Detection limits for fructose, glucose and sucrose, measured by GC-MS, were 2.9 -
12.4 ng for a I ~L injection (Adams eta/., 1999).
1.2.5 UV-Vis Spectrophotometry
There are several major methods used for the analysis of starch, which include
the anthrone method, phenol-sulfuric acid method and the iodine method.
In the anthrone method the carbohydrates are hydrolysed in concentrated
sulfuric acid to which anthrone is added. This produces a blue-green colour, believed to
be the product of hydroxymethylfurfural and anthrone. This method has previously
been used to quantify a range of carbohydrates, including monosaccharides,
disaccharides and starch (Hodge & Hofreiter, 1962). In comparing six methods of
starch estimation, MacRae eta/. (1974) found the anthrone method gave consistently
higher values than four of the alternative methods. The authors reasoned that the
anthrone method is non-specific and measures total hexoses while the alternative
methods only measure glucose.
28
There arc some disadvantages to the anthrone method, which have led to the
replacement of this method with others. The anthrone reagent is not stable in sulfuric
acid (Dubois et a/., 1956); a modified version of this method requires absorbencies to be
measured at exactly 12 minutes after boiling as deviation in time can lead to a 10%
error (Buysse & Merckx, 1993). Moreover the reagent is expensive (Dubois eta/.,
1956). The method is also sensitive to ethanol, a common extraction.solvent for sugars
and would therefore require evaporation of the solvent before commencement (Buysse
& Merckx, 1993).
With the iodine method, as described by Quarmby & Allen (1989), the pH ofthe
solution is altered to be favourable for the reaction. This is done by using phenol red
indicator (pH 6.8 - 8.2), sodium hydroxide and acetic acid until the correct colour is
obtained. Solutions of potassium iodide (KI) and potassium iodate (KI03) are then
added, which tum the solution blue in the presence of starch. In this case KI acts as a
reducing agent.
A third method of starch analysis is by the phenol-sulfuric acid method. After
starch is extracted a hydrous phenol solution is added, followed immediately by
concentrated sulfuric acid. The original method, as written by Dubois et a/. (1956),
required the end mixture to stand for twenty minutes, followed by up to 20 minutes in a
25 - 30 °C water bath, before measuring the absorbance. A more recent version of this
method requires only a 15 - 20 minute standing time at room temperature (Buysse &
Merckx, 1993). The colour produced by this method is said to be stable for several
hours and the method is accurate to ± 2 % (Dubois et a/., 1956). The absorbance is
dependent on the amount of phenol added, with absorbencies for sugars reaching a peak
before falling again as the phenol concentration is increased (Dubois et al., 1956). This
method is believed to be more applicable for routine analysis than either the anthrone
29
method or the iodine method as it is fast, easy and has low costs (Buysse & Merckx,
1993). It has recently been utilised in the determination of starch in the seagrasses
Halophil a ova/is and H pinifolia (Longstaff & Dennison, 1999; Longstaff eta/., 1999).
1.3 Project Aims
The aim of this project was to investigate a possible cause to why P. coriacea
was dying in artificial culture (e.g. tissue culture) 10- 12 months after germination. As
death occurs soon after the depletion of the seed starch reserves, the seedlings may be
unable to replenish their carbohydrate stores. One way to determine if this is true is by
analysing the soluble and insoluble carbohydrates in their leaves. However, the method
for analysis would need to be suitable for limited amounts of plant material and low
concentrations of soluble carbohydrates.
As far as the author is aware, there has been no comparison made to determine
which chromatographic methods are the most appropriate for when plant material is
limited and carbohydrate concentrations are low. Therefore, before analysing the
soluble carbohydrates in P. coriacea, a chromatographic method with high sensitivity
needed to be developed.
30
CHAPTER 2: Chromatographic Analysis of Soluble Carbohydrates
2.1 Introduction
Chromatographic analysis of plant soluble carbohydrates involves three steps:
the extraction of soluble carbohydrates, preparation of the extract and chromatographic
analysis. The methods for extraction, preparation and analysis are varied, ranging from
cumbersome yet sensitive to simple but insensitive methods. While HPLC does not
necessitate carbohydrate extracts to undergo further preparation for analysis, GC does
as they must be transfonned into volatile analytes to undergo chromatographic
separation and detection.
Extraction methods vary in solvents and temperature used. Solvents utilised
include water (Pirc, 1985), ethanol (Halligan & Drew, 1971), methanol (Bleton eta/.,
1996), perchloric acid (Adams et al., 1999) and chloroform (Adams eta/., 1992). These
are often used in combination. Quannby and Allen (1989) have suggested that
extractions in pure water may lead to the hydrolysis of sugars and therefore recommend
using 80% ethanol. Temperatures used for extraction vary between 0 °C (Adams et al.,
1999), room temperature (Morvai & Molnar~Perl, 1990) and 100 ac (Bleton et al.,
1996). Quarmby & Allen (1989) suggest that high temperatures should be avoided if
possible, as sugars may be lost. As far as the author is aware, no studies so far have
made a comprehensive survey of the solvents and temperatures that are most
appropriate for extraction of carbohydrates from plants.
Preparation of the extract for analysis can be as simple as filtering the extract for
HPLC analysis, to more time consuming and multi~stepped derivatisation procedures.
31
For example, Adams et a/. (1999), used Sep-Pak Cu cartridges to simplify the extract
matrix, converted the sugars to their oximes and then converted the sugars and sugar
oximes to their TMS derivatives using a combination of sonication and heating.
While methods for carbohydrate analysis are varied, there appears to be little
comparison of these methods. As far as the author is aware there has been no
comparisons made of the GC DB-5 and BP-I (equivalent to DB-I) columns, of the
derivatising agents TMSI and BSTFA, or of the HPLC amino and polyamine columns
in the analysis of carbohydrates. Additionally, while Young (2002) compared the UV
Vis and ELSD detectors for analysis of carbohydrates, no details of the efficiency of
each method was given. The article also did not include all of the sugars that were
likely to be found in seagrass material. Neither, as far as the author is aware, have the
analytical methods of HPLC and GC undergone a comprehensive comparison in
relation to analysis of soluble carbohydrates.
The aim for this project was to develop a reproducible and sensitive method for
the routine analysis of extracts. Particular challenges included developing a method
suitable for small amounts of plant material (0.1 g) and low analyte concentrations.
Method development included:
(i) Selecting an appropriate extraction method;
(ii) Developing an easy yet robust sample preparation method;
(iii) Comparing the amino, polyamine, DB-I and BP-1 columns on their elution
orders, total run times and reproducibility of their retention times; and
(iv) Determining the sensitivity of two HPLC detectorS, the UV-Vis and ELSD
and the GC detector, FID.
32
2.2 Materials and Methods
2.2.1 Reagents and Solvents
Standard sugars, perchloric acid, pyridine, BSTFA 1% TMCS (99% purity),
TMSI (98% purity), 3-methoxybenzoic acid (m-Anisic acid) and phenyl-~-D-glycoside
obtained from Sigma Aldrich Pty. Ltd. (NSW, Australia). Absolute ethanol was
obtained from ICI Instruments, (Vic., Australia) and made to 80% concentration with
MilliQ water. Acetonitrile (ACN) and methanol (MeOH) were of HPLC grade,
obtained from EM Science (New Jersey, USA). Hexane was of 95 % concentration
with 0.01 %water, obtained from Mallinckrodt-Baker Inc. (New Jersey, USA). MilliQ
water was of 18.2 M.Q cm·1 purification.
2.2.2 Sugar Standard Preparation
A standard sugar-mix contained sucrose, D-glucose, D-fructose, D(+)-trehalose,
myo-inositol, mannitol, sorbitol and the amino acid L-proline, unless otherwise stated.
Proline was added in the sugar mix as it is a common amino acid found in plants that
may interfere with analysis. Standard sugar-mix 'A' contained 2000 mg L'1 of each
sugar. Standard sugar-mix 'B' contained 10 mM L'1 of each sugar. A set of four sugar
mix standards 'C' contained 50,250,450 and 650 11M L'1 sucrose and fructose, 50, 100,
200 and 350 ~M L'1 glucose, and 20, 40, 60 and 80 ~M L'1 of each mannitol, sorbitol,
inositol and trehalose. Standards were prepared in 80% ethanol, unless otherwise
stated. Where stated, 78 ~M L'1 phenyl-~-D-glycoside (P~DG) was added as an
internal standard (IS).
33
2.2.3 Extraction of Plant Soluble Carbohydrates
P. coriacea leaves were homogenised in liquid nitrogen using a mortar/pestle.
Ground leaf tissue {100 mg) was placed in a 40 mL centrifuge tube and the sugars were
extracted twice with 5.0 mL MilliQ or _80 % ethanol. The extractions were carried out
using agitation at either room temperature {approximately 23 °C} or in a hot water bath
at 80 °C. Each extract was centrifuged for I 0 minutes at I 0 000 rpm and the
supernatant collected and filtered through a 0.45 ).lm filter cartridge (Millipore, Bedford,
MA) into a sample tube.
Extraction methods were compared using GC, which required the derivatisation
of the extracts. A 500 ).lL aliquot of extract was transferred to a 2.0 mL autosarnpler
vial, evaporated to dryness using an air stream and taken up in 400 ).lL pyridine and 200
J.LL of BSTF A. Sealed vials were heated for 30 minutes at 60 °C and I IlL injections
were made onto a DB-5 column, using the chromatographic conditions described in
section 2.2.5.
2. 2. 4 HPLC Analysis of Soluble Carbohydrates
HPLC analysis was performed using a Varian ProStar high performance liquid
chromatograph (Varian Aust. Pty. Ltd., Australia), equipped with an autosampler
(Varian model400) fitted with a 10 ).lL injection loop, a solvent delivery module with
degasser (Varian model 240), a photo diode array (PDA) UV-Vis detector (Varian
model 330) set at 192 run and an Alltech ELSD (AIItech model 2000). Columns used
were an Alltech Prevail Carbohydrate ES 5).lm 250 x 4.6 mm (Alltech Associates Aust.
Pty. Ltd., Australia) and a Phenomenex Phenosphere 5).lm NH2 SOA 250 x 4.6 mm
34
(Phenomenex, Australia). These will be referred to as polyamine and amino columns
respectively. Data was processed using the Star Chromatography Workstation version
5.52.
2.2.4.1 Optimising ELSD Conditions
The ELSD was optimised by varying the drift tube temperature and gas flow
rate. Drift tube temperature was varied between 70, 80 and 90 °C using a gas flow rate
of2.0 L min'1• Gas flow rates of 1.7, 2.0 and 2.3 L min"1 were compared using a drift
tube temperature of70 °C. A 1000 mV full-scale voltage was used.
Standard sugar-mix 'A' was run in triplicate for each method on the amino
column using Method A2 described in section 2.2.4.2. The mobile phase solvents were
MilliQ and ACN. The gradient employed was a linear increase from 5% MilliQ to 40
% MilliQ over 20 minutes and using a 5 min equilibration time. Flow rate was 1.5 mL
min·1•
2.2.4.2 Column Conditions
The chromatographic conditions for the amino column were:
(Method AI) MilliQ:ACN mobile phase with flow rate of 2.0 mL min"1• The linear
gradient employed was 5:95% to 12:88 %over 16 min, linear increase to 28:72% at 21
min, isocratic for 9 min, linear increase to 50:50% over 10 min and a 5 min
equilibration time.
(Method A2) MilliQ:ACN mobile phase with flow rate of 1.5 mL min"1• The linear
gradient employed was 5:95 % to 57:43 % over 20 minutes and a 10 min equilibration
time.
35
(Method A3) MilliQ:MeOH mobile phase with flow rate of 1.5 mL min-1• The linear
gradient employed was 5:95 %to 40:60% over 40 min and a 5 min equilibration time.
(Method A4) MilliQ:MeOH:ACN mobile phase with flow rate of 1.5 mL min-1• The
linear gradient employed was 75:5:20 % to 40:40:20 % over 40 min and a 5 min
equilibration time.
The chromatographic conditions for the polyamine column were:
(Method PAl) MilliQ:ACN mobile phase with flow rate of 1.0 mL min-1• The linear
gradient employed was 20:80% to 50:50% at 20 min and a 10 min equilibration time.
(Method PA2) MilliQ:ACN mobile phase with flow rate of 1.0 mL min'1• The linear
gradient employed was 24:76% to 50:50% at 18 min and a 10 min equilibration time.
(Method PA3) Adapted from Young (2002), using solvent mix (A) ACN:Acetone and
(B) MilliQ, with mobile phase flow rate of 1.0 mL min"1• The linear gradient employed
was 80 % A to 60 % A over 15 min and isocratic 60 % A over 5 minutes, with a
equilibration time of 5 min.
I
2.2.5 GC Analysis of Soluble Carbohydrates
GC analysis was performed using a Varian model 3800 gas chromatograph
(Varian Aust. Pty. Ltd., Australia), equipped with an autosampler (Varian model 8200),
fitted with split/splitless capillary inlet system, a FID and a Varian Star
Chromatography Workstation v 5.3 data processor. Injections of2 J.!L were made in the
splitless mode. Between injections the syringe was washed with ethyl acetate. Helium
flow rate through column was 1 mL min-1• Nitrogen flow rate to the FID was 29 mL
min1• A DB-5 capillary column (30 m x 0.25 mm 0.25 ~m i.d.; J & W Scientific, USA)
and BP-1 capillary column (25 m x 0.22 mm 0.2 ~m i.d.; SGE Australia Pty. Ltd.,
36
Australia) were used. The DB-5 column was held at an initial temperature of 60 °C for
2 min, then increased at 20 °C min"1 to 150 °C, then at 6 °C min'1 to 300 oc and finally
held at that temperature for 3.5 min. The BP-1 column was held at an initial temperature
of 60 °C for 2 min, increased at 20 °C min"1 to 150 °C, then at 6 °C min"1 to 276 °C.
The injector and detector temperatures were 250 and 300 °C, respectively.
2.2.5.1 Derivatisation Conditions Development
A 200 ~L aliquot of standard sugar-mix B was evaporated to dryness in a 2.0 mL
autosampler vial using an air stream. The residue was taken up in 400 ~L pyridine and
200 ~L BSTFA or TMSI. Sealed vials were heated at 60 °C for 30 minutes and injected
onto the DB-5 column. An additional set of BSTF A derivatives were heated at 60 °C
for 10,30 or 60 min, and for 30 min at 60 and 80 °C.
2.2.5.2 Derivative Degradation
Three 900 J..LL aliquots of standard sugar-mix C were evaporated to dryness in a
2.0 mL autosampler vial using an air stream. Residue was taken up in ISO f.lL of
pyridine and 150 f..l.L of BSTFA. Sealed vials were heated for 30 min at 60 °C.
Injections were made onto the DB-5 column. Derivatised samples were run
continuously for 24 hours
2.2.5.3 Sample concentration
Various methods of concentrating a standard sugar-mix were trialed.
{i) A 500 ~L aliquot of standard sugar-mix B was evaporated to dryness in a
2.0 mL autosampler vial using an air stream. The residue was taken up
37
in 400 JlL of pyridine and 200 f.LL of BSTFA. Sealed vials were heated
for 30 min at 60 °C and injected onto the DB~5 column. The sample was
re~evaporated using an air~stream, taken up in 100 f.LL 95 %hexane and
injected onto the DB~5 column.
(ii) A 2.0 mL aliquot of standard sugar~mix B (in MilliQ) was evaporated to
dryness in a round bottom flask using a rotary evaporator at 45 °C. The
residue was taken up in 300 f.LL pyridine. A 200 f.LL aliquot was
transferred to a 2.0 m!... vial and 200 f.LL BSTF A wa;; added. Sealed vials
were heated for 30 min at 60 °C and injected onto the DB~5 column.
(iii) A 1200 f.LL aliquot of standard sugar~mix B was evaporated to dryness in
a 2.0 mL autosampler vial using an air stream. The residue was taken up
in 100:50, 200:100, 300:150 or 400:200 J.!L pyridine to BSTFA
respectively. Sealed vials were heated for 30 min at 60 °C and injected
onto the DB~5 column.
2.2.6 Statistics and Calculations
Data was analysed using a one~way ANOVA or a Student T~test, with
significance at p < 0.05.
Detection limits (LOD) were calculated as follows:
LOD = (C/ph) x 3(noise)
where C is the concentration of the analyte, Ph is the height of the analytes detector
response and noise is the detector variation measured prior to a sample run.
The relative standard deviation (%RSD) was calculated as follows:
38
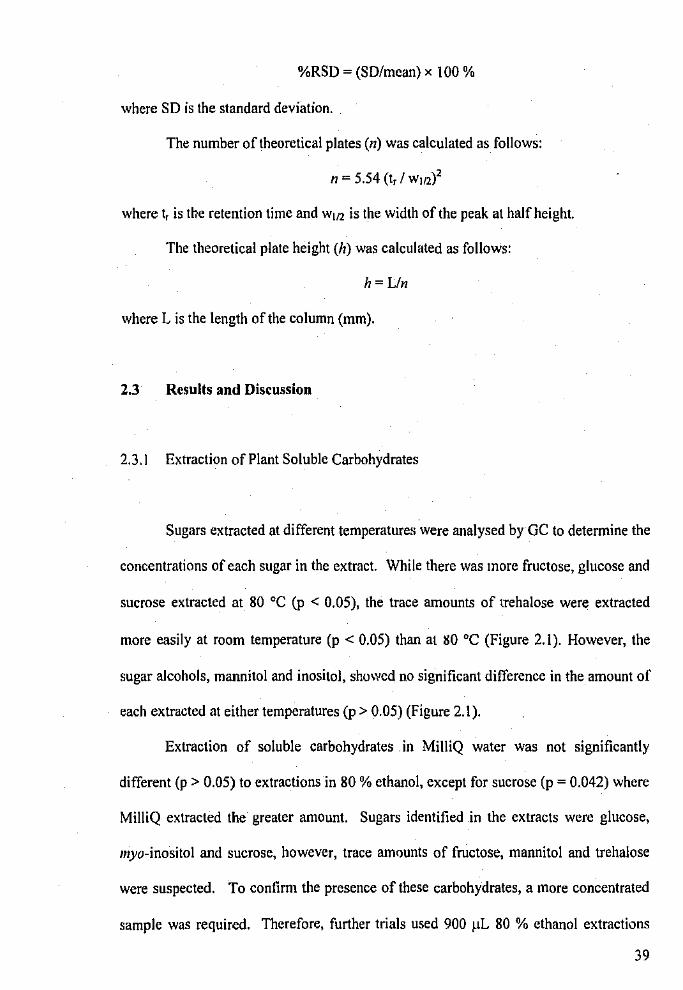
%RSD ~(SO/mean) x 100%
where SD is the standard deviation.
The number of theoretical plates (n) was calculated as follows:
n ~ 5.54 (t, I Wto)2
where tr is the retention time and w112 is the width of the peak at half height.
The theoretical plate height (h) was calculated as follows:
h ~Lin
where Lis the length of the column (mm).
2.3 Results and Distussion
2.3.1 Extraction of Plant Soluble Carbohydrates
Sugars extracted at different temperatures were analysed by GC to determine the
concentrations of each sugar in the extract. While there was more fructose, glucose and
sucrose extracted at 80 °C (p < 0.05), the trace amounts of trehalose were extracted
more easily at room temperature (p < 0.05) than at MO °C (Figure 2.1). However, the
sugar alcohols, mannitol and inositol, showed no significant difference in the amount of
each extracted at either temperatures (p > 0.05) (Figure 2.1).
Extraction of soluble carbohydrates in MilliQ water was not significantly
different (p > 0.05) to extractions in 80% ethanol, except for sucrose (p = 0.042) where
MilliQ extracted the greater amount. Sugars identified in the extracts were glucose,
myo-inositol and sucrose, however, trace amounts of fructose, mannitol and trehalose
were suspected. To confirm the presence of these carbohydrates, a more concentrated
sample was required. Therefore, further trials used 900 ~L 80 % ethanol extractions
39
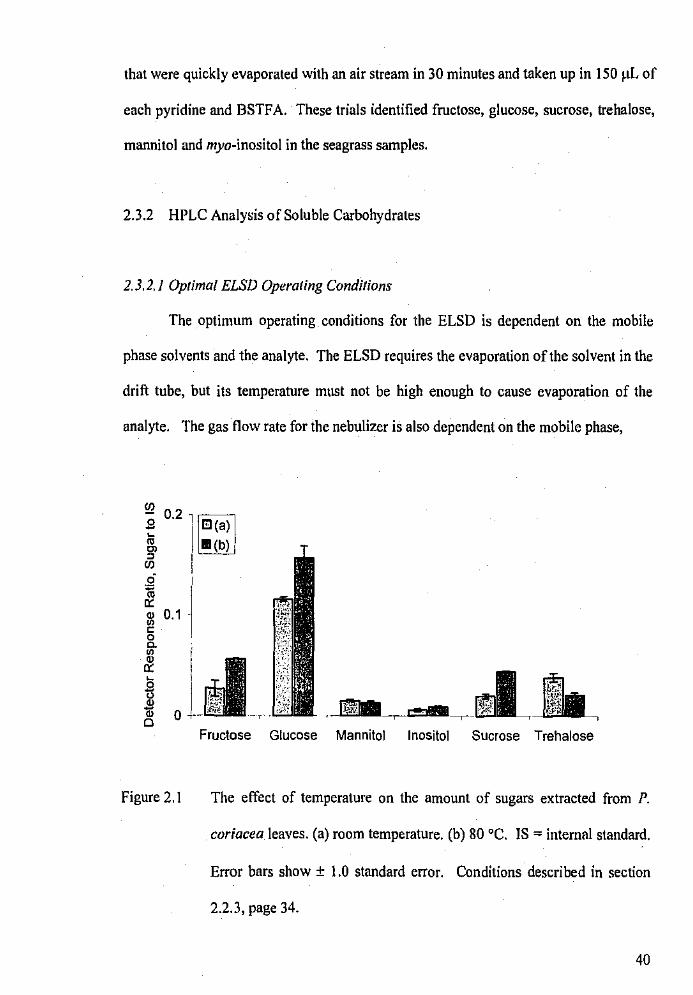
that were quickly evaporated with an air stream in 30 minutes and taken up in 150 !J.L of
each pyridine and BSTFA. These trials identified fructose, glucose, sucrose, trehalose,
mannitol and myo-inositol in the seagrass samples.
2.3.2 HPLC Analysis of Soluble Carbohydrates
2.3.2.1 Optimal ELSD Operating Conditions
The optimum operating conditions for the ELSD is dependent on the mobile
phase solvents and the analyte. The ELSD requires the evaporation of the solvent in the
drift tube, but its temperature must not be high enough to cause evaporation of the
analyte. The gas flow rate for the nebulizer is also dependent on the mobile phase,
(/) - 0.2 l =-cc-; ~ ·~!!I (a) ~ .(blJ ' I "' I ~ I
Q) 0 1 -~ .
l I Cl
0 -- ,--
Fructose Glucose Mannitol Inositol Sucrose Trehalose
Figure 2.1 The effect of temperature on the amount of sugars extracted from P.
coriacea leaves. (a) room temperature. (b) 80 °C. IS= internal standard.
Error bars show ± 1.0 standard error. Conditions described in section
2.2.3, page 34.
40
with low flow rates increasing the size of the droplets of the column effiuent and
therefore the sensitivity of the detector, but high flow rates increasing evaporation of the
mobile phase.
For an isocratic water mobile phase the drift tube temperature shuuiJ be set at
115 •c and the gas flow at 3.2 L min'1 (All tech ELSD 2000 Operating Manual). For an
isocratic acetonitrile mobile phase the drift tube is set at 70 °C and gas flow at 1.7 L
min'1 (Alltech ELSD 2000 Operating Manual). However, a mobile phase of both water
and acetonitrile was required and the method was not isocratic. The ELSD drift tube
temperature was heated at 70, 80 and 90 °C, but there was no significant difference in
the sensitivity of the ELSD operated at these temperatures. However, there was a
general trend for lower detection limits when using 90 °C. There was also no
significant difference in the ELSD sensitivity when using a gas flow rate of 1.7, 2.0 and
2.3 L min''.
For the methods presented in section 2.2.4.2 (methods Al,2; PAI,2; page 34)
that utilize a gradient program of acetonitrile and water, this study recommends using a
90 °C drift tube temperature and 2.0 L min" 1 gas flow rate so as to conserve gas. The
full-scale voltage setting of either 0- 10 mV or 0- 1000 mY is dependent on the
concentration of the analytes in the sample.
2.3.2.2 Optimal column conditions
Using methanol or acetone in the mobile phase, for the amino and polyamine
columns respectively. resulted in the loss of all peaks, even when acetonitrile was added
{section 2.2.4.2, mcihods A3,4). A gradient of water and acetonitrile programmed from
5:95% to 50:50% over 40 min (section 2.2.4.2, method AI) on the amino column
resolved all peaks, with the last peak, proline, eluting at 32 minutes. However, thC
41
reproducibility of the retention times for each sugar analysed was between 1.45 and
4.54 %RSD (Figure 2.2).
The retention times were shortened and the reproducibility was improved on the
amino column by using a linear gradient ofwater:ACN from ~·:95% to 57:43 %over 20
minutes and doubling the equilibration time to lO minutes (section 2.2.4.2, method A2).
With this method proline eluted at 13.09 min and the reproducibility of the retention
times were between 0.31 - 0.64 %RSD (Figure 2.2). Increasing the water ratio more
rapidly shortened the retention time because high molecular weight carbohydrates have
a strong affinity for the polarity of water. The reproducibility of these retention times
was improved due to the longer equilibration time, which allowed more time for the
mobile phase to become stable. The shortened retention times, however,- resulted in a
~ 'i
" • E ' j:
fciAJ )
CA2
Ill PAl
~--PAZ
J:ructosc Glucose Sucrose Trchnlosc Rutlinosc Sorbitol Mannitol Inositol Proline
Figure 2.2 Reproducibility of the retention times (%RSD) for sugars on the amino
(A) and polyamine (PA) columns using methods AI, A2, PAl and PA2.
For method details sec section 2.2.4.2. n = 3. Sorbitol/mannitol and
fructose/proline peaks co-eluted in methods A2 and PA2 respectively.
42
loss of resolution between sorbitol and mannitol, which co-eluted. This is a
disadvantage for samples containing both sorbitol and mannitol and where qualification
of analytes in a sample is required.
Using the polyamine column, a mobile phase gradient of MilliQ and acetonitrile
from 20:80% to 50:50% (section 2.2.4.2, method PAl) resolved all peaks and the
reproducibility of the retention times were between 0.41 and 1.10 %RSD for each sugar
(Figure 2.2). By starting the gradient at 24:76 %, increasing the water gradient rate and
increasing the equilibration time, the reproducibility of the retention times were slightly
improved, with each sugar being between 0.28 - 0.50 %RSD (Figure 2.2). The last
peak to elute on the polyamine column was raffinose at 13.4 minutes and the retention
time of proline was reduced, however, proline now co-eluted with fructose. The sugar
alcohols, mannitol and sorbitol, were now also eluting separately before fructose and
glucose, which on the amino column were the first to elute.
2.3.2.3 Column comparison
A comparison of the amino and polyarlline column methods (section 2.2.4.2,
methods A2 & PA2) showed the polyamine column to provide more reproducible
retention times, shorter elution times and lower ELSD detection limits (Table 2.1). The
retention time of the last eluted peak for the amino and polyamine columns was 13.09
and 11.40 min respectively. The polyamine column provided greater reproducibility of
retention times than the amino column, at 0.19 - 0.50 %RSD and 0.31 - 0.64 %RSD
respectively. This would be expected because of the stability of the stationary phase
particles on the polyamine column. The gradual degradation in the amino column, due
to bleeding of particles, is prevented in the polyamine as the amine groups are held on a
polymer resin.
43
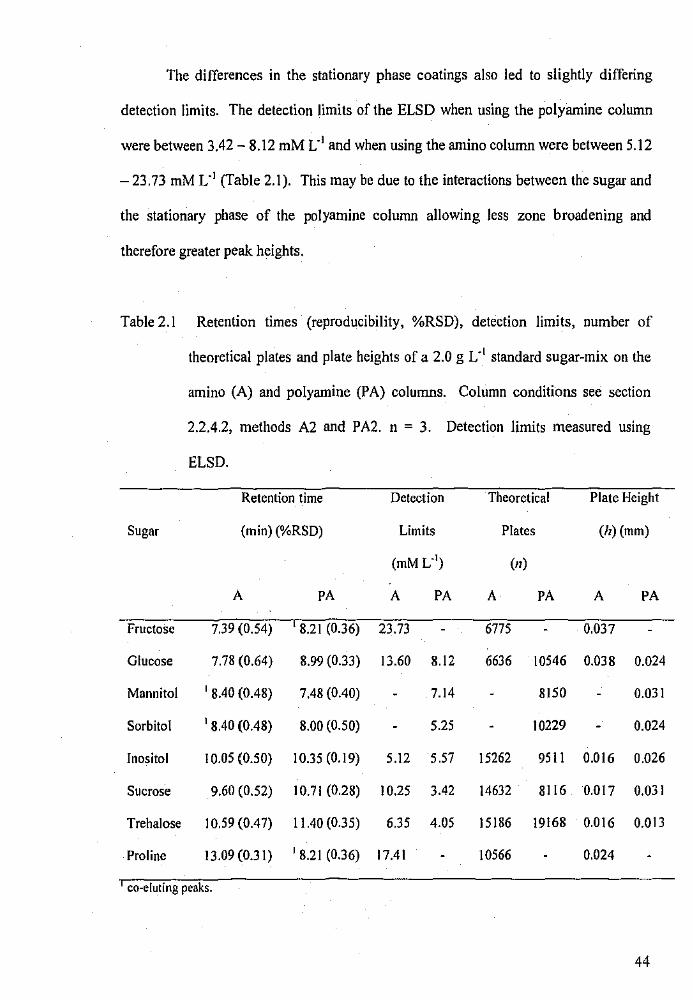
The differences in the stationary phase coatings also led to slightly differing
detection limits. The detection limits of the ELSD when using the polyamine column
were between 3.42- 8.12 mM L" 1 and when using the amino column were between 5.12
- 23.73 mM L"1 (Table 2.1). This may be due to the interactions between the sugar and
the stationary phase of the polyamine column allowing less zone broadening and
therefore greater peak heights.
Table2.1 Retention times (reproducibility, o/oRSD), detection limits, number of
theoretical plates and plate heights of a 2.0 g L"1 standard sugar~mix on the
amino {A) and polyamine (PA) columns. Column conditions see section
2.2.4.2, methods A2 and PA2. n = 3. Detection limits measured using
ELSD.
Retention time Detection Theoretical Plate Height
Sugar (min) (%RSD) Limits Plates (h) (mm)
(mM L'') (11)
A PA A PA A PA A PA
Fructose 7.39 (0.54) 8.21 (0.36) 23.73 6775 0.037
Glucose 7.78 (0.64) 8.99 (0.33) 13.60 8.12 6636 10546 O.QJ8 0.024
Mannitol ' 8.40 (0.48) 7.48 (0.40) 7.14 8150 0.031
Sorbitol '8.40 (0.48) 8.00 (0.50) 5.25 10229 0.024
Inositol I 0.05 (0.50) I 0.35 (0.19) 5.12 5.57 15262 9511 0.016 0.026
Sucrose 9.60 (0.52) 10.71 (0.28) 10.25 3.42 14632 8116 0.017 0.031
Trehalose 10.59(0.47) 11.40 (0.35) 6.35 4.05 15186 19168 0.016 0.013
Proline 13.09(0.31) '8.21 (0.36) 17.41 10566 0.024
co-eluting peaks.
44
Zone broadening is measured by calculating the number of theoretical plates (n)
and plate height (h). Theoretically, n and h can only be calculated for columns when
using an isocratic mobile phase, however,they are presented here to give a general idea
of the efficiency of the amino and polyamine columns. The number of theoretical
plates for each sugar on the amino column was ~etween 6,800 to 15,300 plates and for
the polyamine column values were between 8,200 and 19,200 plates (Table 2.1). Both
of these columns were of the same length, internal diameter, particle size and a similar
mobile phase gradient was used allowing a direct comparison to be made using the n
values, however, h values are also given in Table 2.1.
The elution order for the amino column was monosaccharides, sugar alcohols,
disaccharides and then amino acids. The elution order on the polyamine column
differed with sugar alcohols eluting first, followed by monosaccharides, amino acids
and disaccharides. When using these methods specifically, co-elution was evident
between sorbitol and mannitol on the amino column, and between fructose and proline
on the polyamine column. Sorbitol was also not fully resolved from the fructose and
proline peak on the polyamine column. This co~elution can be avoided by slowing the
rate of change in the water ratio of the mobile phase, however this results in longer
retention times.
2.3.2.4 Detector comparison
The lower limits of detection for sugars analysed with the ELSD were between
20 and 200-fold lower than for the photo-diode array (PDA) UV-Vis detector (Figure
2.3). For example, the detection limits for glucose were 3054 mM L'1 when using the
PDA and 38 mM L'1 when using the ELSD. Sensitive UV~Vis detection relies on
compounds possessing a chromophore, which is absent in carbohydrates. UV ~Vis
45
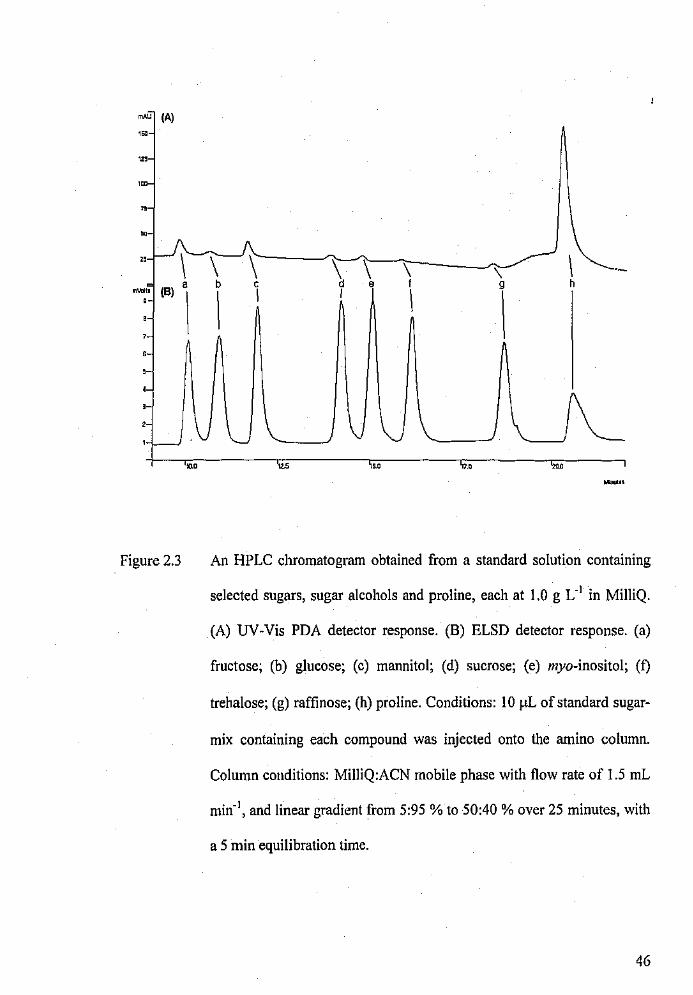
mAU (A) ,.
·~
•·
\ -·-h
'l-- .\J '- \ "-•
Figure 2.3 An HPLC chromatogram obtained from a standard solution containing
selected sugars, sugar alcohols and proline, each at 1.0 g L-1 in MilliQ.
(A) UV~Vis PDA detector response. (B) ELSD detector response. (a)
fructose; (b) glucose; (c) mannitol; (d) sucrose; (e) myo-inositol; (f)
trehalose; (g) raffinose; (h) proline. Conditions: 10 ~of standard sugar-
mix containing each compound was injected onto the amino column.
Column conditions: MilliQ:ACN mobile phase with flow rate of 1.5 mL
min-1, and linear gradient from 5:95 %to 50:40 %over 25 minutes, with
a 5 min equilibration time.
46
detection of sugars 'Jnly occurs at 190 nm. Detection is improved on the ELSD as it is a
universal detector for analytes that are sufficiently less volatile than the mobile phase.
Additionally, as it does not rely on the optical characteristics of an analyte, it does not
call for analytes to possess a chromophore for detection. However, when compounds
possess a chromophore the sensitivity of the UV-Vis and ELSD detectors are similar,
such as seen for proline (Figure 2.3). The UV-Vis and ELSD detection limits for
proline were 134 and 94.7 mM L'1 respectively.
2.3.3 GC Analysis of Soluble Carbohydrates
2.3.3.1 Derivatisation Conditions
The FID peak response for TMSI sugar derivatives was Jess than when using
BSTFA (Figure 2.4). For example, derivatisation of 10 mM L'1 glucose with BSTFA
produced peak heights 4-fold greater than when TMSI was used. The FID detection
limits for sugars derivatised with TMSI were between 23-211 J.LM L-1 and for sugars
derivatised with BSTFA were between 18-99 ~M L'1 (Table 2.2).
The lower sensitivity of the FID to TMSI sugar derivatives may be due to the
low volatility of TMSI. In preparing TMSI-derivatives for analysis, excess TMSI is
normally evaporated off and the residue is redissolved in hexane to improve volatility.
Injection of TMSI derivatives in hexane also avoids fouling of the FID that should be
avoided as it can contribute to a decrease in detection sensitivity. However, this
additional step is time-consuming and it increases the chance of moisture contamination
-the highest grade of hexane available is of 95 % purification and contains 0.01 %
water. BSTFA was therefore used as the derivatising agent for the remainder of the
study.
47
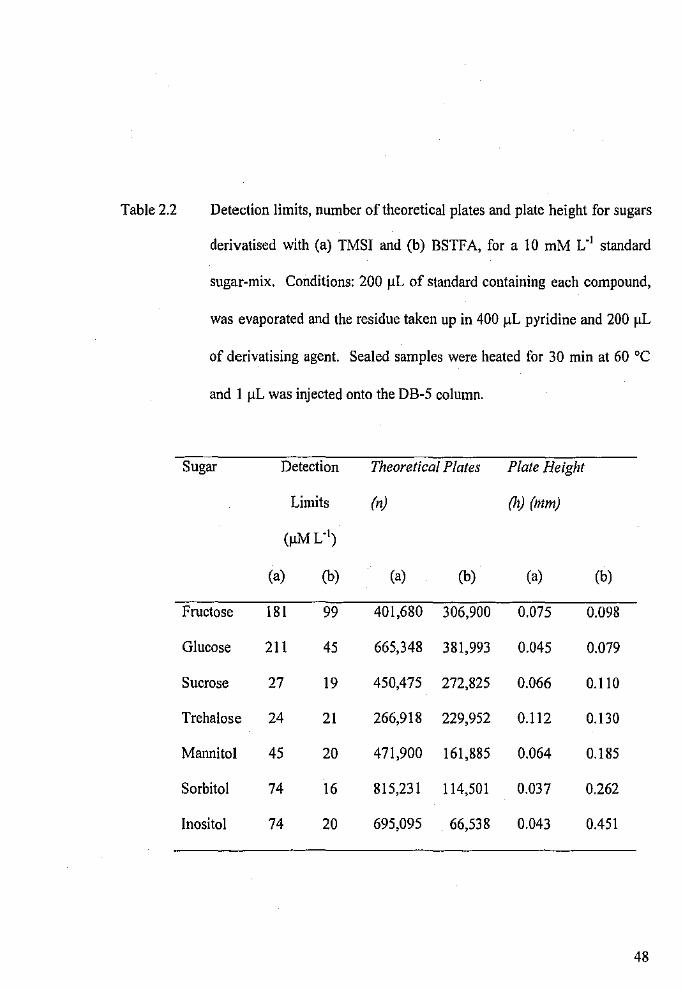
Table 2.2 Detection limits, number of theoretical plates and plate height for sugars
derivatised with (a) TMSI and (b) BSTFA, for a 10 mM L"1 standard
sugar-mix. Conditions: 200 flL of standard containing each compound,
was evaporated and the residue taken up in 400 )lL pyridine and 200 J.lL
of derivatising agent. Sealed samples were heated for 30 min at 60 °C
and I J..LL was injected onto the DB-5 column.
Sugar Detection Theoretical Plates Plate Height
Limits (n) (h) (mm)
(~L-')
(a) (b) (a) (b) (a) (b)
Fructose 181 99 401,680 306,900 0.075 0.098
Glucose 211 45 665,348 381,993 0.045 0.079
Sucrose 27 19 450,475 272,825 0.066 0.110
Trehalose 24 21 266,918 229,952 0.112 0.130
Mannitol 45 20 471,900 161,885 0.064 0.185
Sorbitol 74 16 815,231 114,501 0.037 0.262
Inositol 74 20 695,095 66,538 0.043 0.451
48
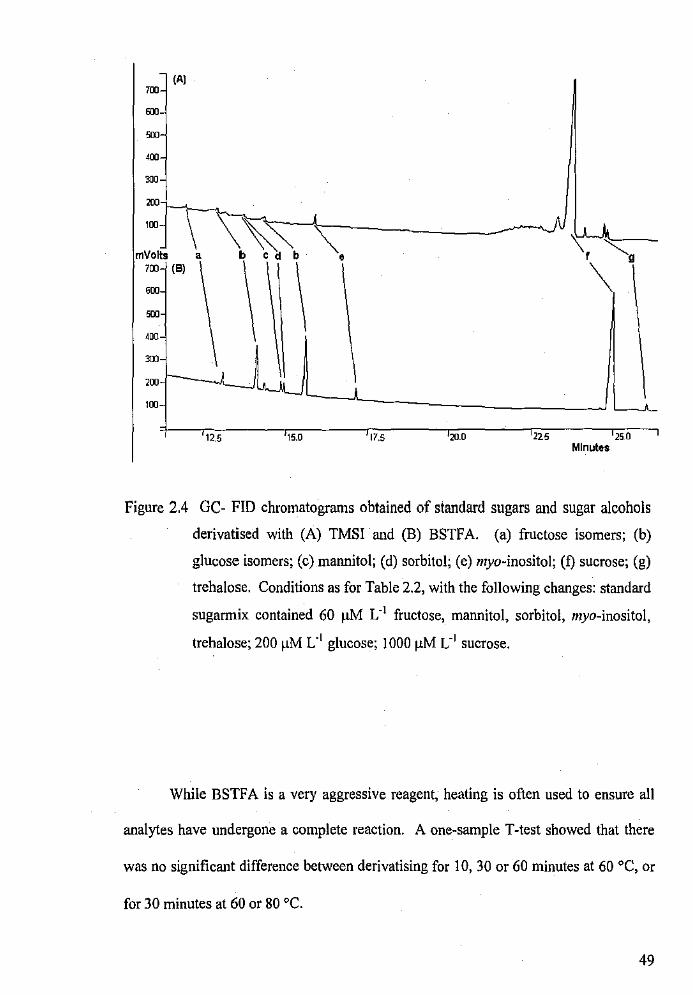
(A) 700
600
300
'"'r-f-4-~ 100
mVolts 700
600
400
300 ,_
100
a (B)
l
12.5
~~---------------J b c d b •
\ \ I
15.0 17.5 .0 "'
\
250 Minutes
Figure 2.4 GC- FID chromatograms obtained of standard sugars and sugar alcohols
derivatised with (A) TMSI and (B) BSTF A. (a) fructose isomers; (b)
glucose isomers; (c) mannitol; (d) sorbitol; (e) myoMinositol; (f) sucrose; (g)
trehalose. Conditions as for Table 2.2, with the following changes: standard
sugarmix contained 60 11M L-1 fructose, mannitol, sorbitol, myo-inositol,
trehalose; 200 1-1M L'1 glucose; 1000 J.!.M L-1 sucrose.
While BSTFA is a very aggressive reagent, heating is often used to ensure all
analytes have undergone a complete reaction. A one-sample T-test showed that there
was no significant difference between derivatising for 10, 30 or 60 minutes at 60 °C, or
for 30 minutes at 60 or 80 °C.
49
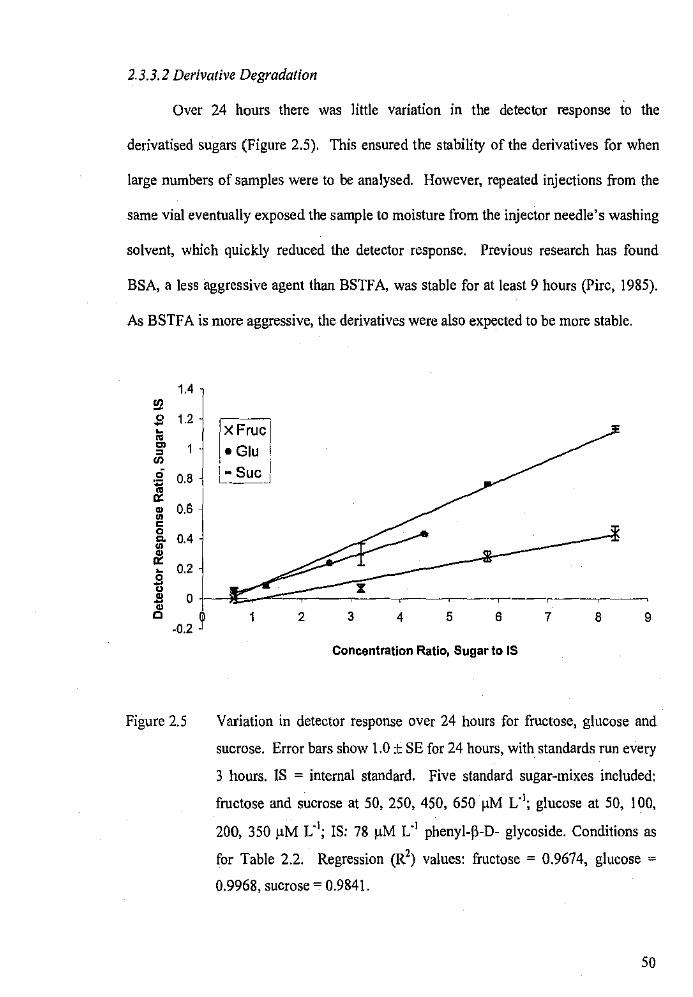
2.3.3.2 Derivative Degradation
Over 24 hours there was little variation in the detector response to the
derivatised sugars (Figure 2.5). This ensured the stability of the derivatives for when
large numbers of samples were to be analysed. However, repeated injections from the
same vial eventually exposed the sample to moisture from the injector needle's washing
solvent, which quickly reduced the detector response. Previous research has found
BSA, a less aggressive agent than BSTF A, was stable for at least 9 hours (Pirc, 1985).
As BSTFA is more aggressive, the derivatives were also expected to be more stable.
1.4 !!2 s 1.2 ~ • "' 1 . , U)
0 0.8 ., • "' m • 0.6 c 0
0.4 " • & 0.2 ~ s
u m 0 -m c
-0.2 ~
Figure 2.5
~~rucl Glu I
L~ Sue J
1 2 3 4 5 6 7 8 9
Concentration Ratio, Sugar to IS
Variation in detector response over 24 hours for fructose, glucose and
sucrose. Error bars show 1.0 ± SE for 24 hours, with standards run every
3 hours. IS = internal standard. Five standard sugar-mixes included:
fructose and sucrose at 50, 250, 450, 650 ~M L"1; glucose at 50, I 00,
200, 350 ~M L"1; IS: 78 ~M L"1 phenyi-~·D· glycoside. Conditions as
for Table 2.2. Regression (R2) values: fructose = 0.9674, glucose =
0.9968, sucrose~ 0.9841.
50
2.3.3.3 Sample Concentration
Samples that were derivatised, evaporated to dryness and then taken up in
hexane gave no detector response. The 95 %hexane contained 0.01 %water and it is
likely that the preference of the derivatising agent for water over the sugar hydroxy sites
resulted in the reversal of the derivatisafion. This method was not explored any further.
Concentrating steps that involved evaporation of ethanol solvent by air stream
could be achieved in 30 minutes for six 1.0 mL samples, whereas the rotary evaporator
evaporated only one 2.0 mL sample in 10 minutes (therefore six samples took I hour).
The rotary evaporator also involved the use of additional glassware and therefore the
quantitative removal of the sample residue from the glassware, as opposed to the air
stream evaporator where evaporation and derivatisation all took place in the one vial.
Additionally, transferral of the rotary-evaporated sample required extra solvent for a
quantitative transfer to a vial.
A one-way ANOV A showed no significant difference between using
pyridine:BSTFA ratios of200:!00, 300:150 and 400:200 ~L. However, when using a
ratio of 100:50 11L there was no detector response, perhaps because of moisture and the
agent not being present in excess.
By increasing the injection volume the detection limits are easily lowered.
Using a 2 )..J.L injection doubled the detector response of I )..J.L injections and was not
found to leak sample from the injector port.
2.3.3.4 Internal Standards
Variation was found in the detector response and it was therefore necessary to
find an internal standard. Four chemicals were trialed as intemal standards: m-anisic
acid, gallic acid, ferulic acid and phenyl-P-D-glycoside (PPDG). m-Anisic acid eluted
51
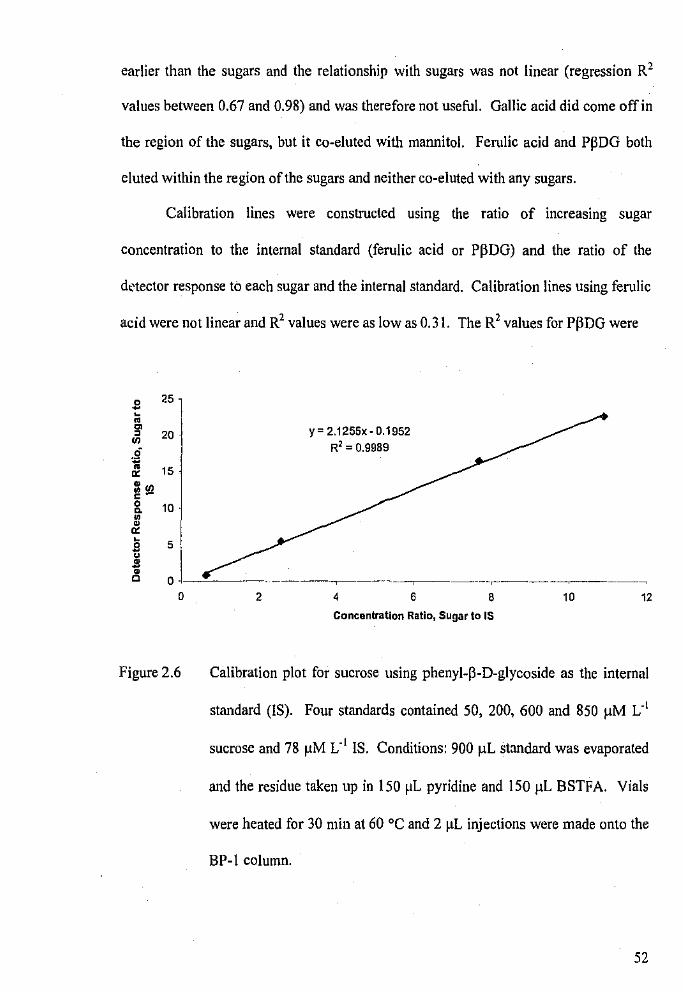
earlier than the sugars and the relationship with sugars was not linear (regression R 2
values between 0.67 and 0.98) and was therefore not useful. Gallic acid did come off in
the region of the sugars, but it co-eluted with mannitol. Ferulic acid and PpDG both
eluted within the region of the sugars and neither co-eluted with any sugars.
Calibration lines were constructed using the ratio of increasing sugar
concentration to the internal standard (ferulic acid or PPDG) and the ratio of the
dt.~tector response tO each sugar and the internal standard. Calibration lines using ferulic
acid were not linear and R2 values were as low as 0.31. The R2 values for Pf3DG were
0 251 -• • a , 20
"' i • 15 "' . ., ~-0 10 ~ • • "' • 5 ! 0 -
ol u s • c
0
Figure 2.6
2
y = 2.1255x- 0.1952
R2 = 0.9989
4 6 8
Concentration Ratio, Sugar to IS
10 12
Calibration plot for sucrose using phenyl-P-D-glycoside as the internal
standard (IS). Four standards contained 50, 200, 600 and 850 ~M L" 1
sucrose and 78 f.l.M L-1 IS. Conditions: 900 f.l.L Standard was evaporated
and the residue taken up in !50 ~L pyridine and !50 ~L BSTFA. Vials
were heated for 30 min at 60 °C and 2 f.l.L injections were made onto the
BP-1 column.
52
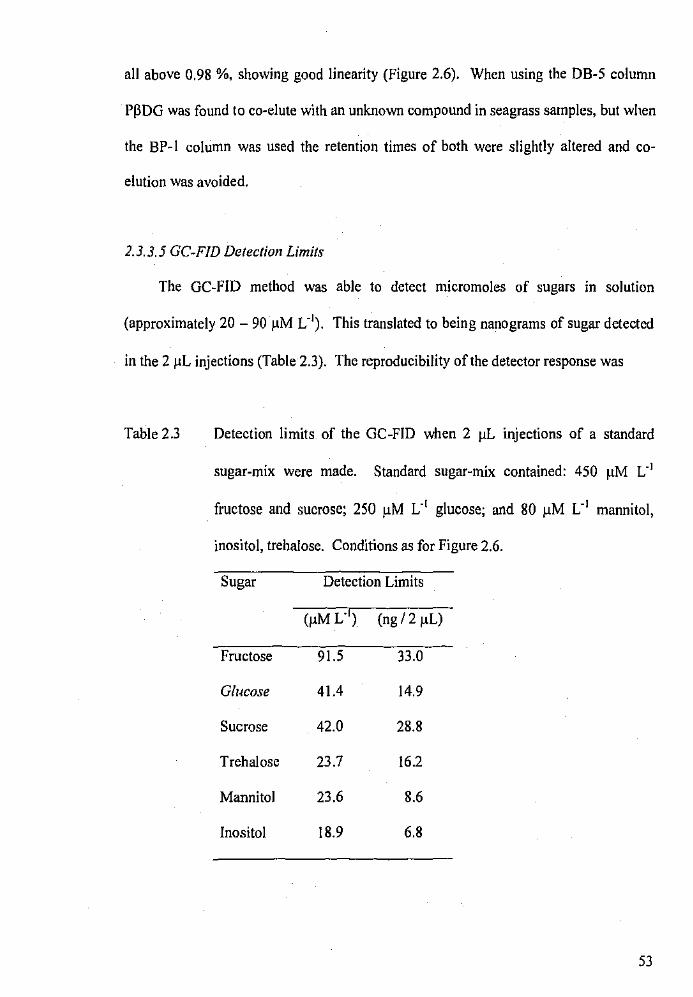
all above 0.98 %, showing good linearity (Figure 2.6). When using the DB-5 column
PPDG was found to co-elute with an unknown compound in seagrass samples, but when
the BP-I column was used the retention times of both were slightly altered and co
elution was avoided.
2.3.3.5 GC-FJD Detection Limits
The GC-FID method was able to detect micromoles of sugars in solution
(approximately 20- 90 ).tM L"1). This translated to being nanograms of sugar detected
in the 211L injections (Table 2.3). The reproducibility of the detector response was
Table 2.3 Detection limits of the GC-FID when 2 J1L injections of a standard
sugar-mix were made. Standard sugar-mix contained: 450 ~-tM L- 1
fructose and sucrose; 250 ~M L'1 glucose; and 80 ~M L'1 mannitol,
inositol, trehalose. Conditions as for Figure 2.6.
Sugar Detection Limits
(~M L') (ng/2 ~L)
Fructose 91.5 33.0
Glucose 41.4 14.9
Sucrose 42.0 28.8
Trehalose 23.7 16.2
Mannitol 23.6 8.6
Inositol 18.9 6.8
53
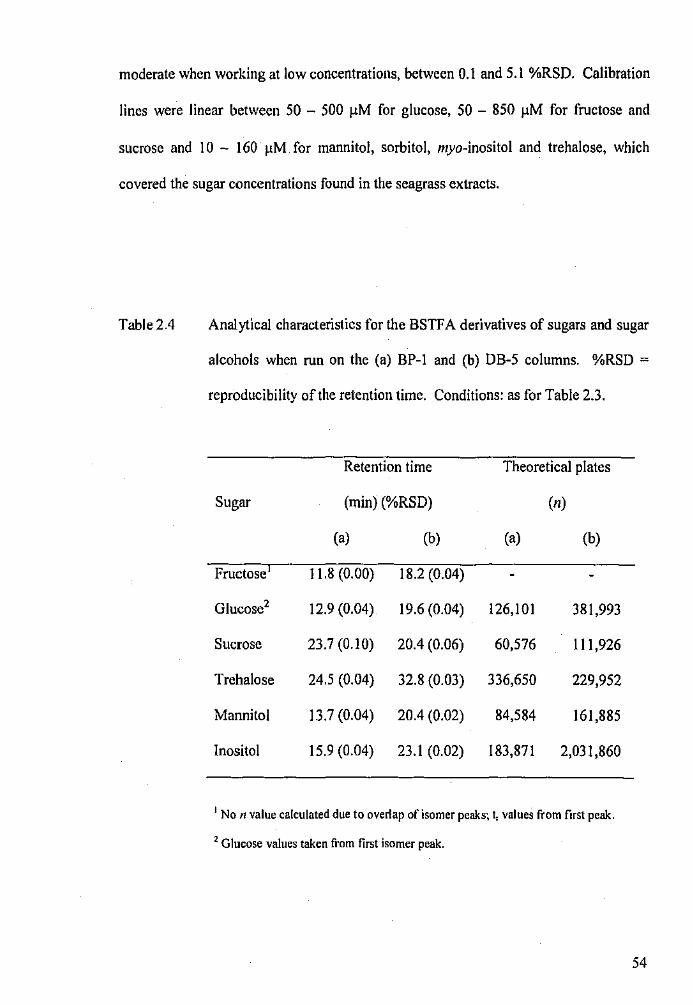
moderate when working at low concentrations, between 0.1 and 5.1 %RSD. Calibration
lines were linear between 50 - 500 ~M for glucose, 50 - 850 ~M for fructose and
sucrose and 10 - 160 11M for mannitol, sorbitol, myo~inositol and trehalose, which
covered the sugar concentrations found in the seagrass extracts.
Table 2.4 Analytical characteristics for the BSTF A derivatives of sugars and sugar
alcohols when run on the (a) BP-I and (b) DB-5 columns. %RSD =
reproducibility of the retention time. Conditions: as for Table 2.3.
Retention time Theoretical plates
Sugar (min) (%RSD) (n)
(a) (b) (a) (b)
Fructose II .8 (0.00) 18.2 (0.04)
Glucose2 12.9 (0.04) 19.6 (0.04) 126,101 381,993
Sucrose 23.7 (0.10) 20.4 (0.06) 60,576 111,926
Trehalose 24.5 (0.04) 32.8 (0.03) 336,650 229,952
Mannitol 13.7 (0.04) 20.4 (0.02) 84,584 161,885
Inositol 15.9 (0.04) 23. I (0.02) 183,871 2,031,860
1 Non value calculated due to overlap of isomer peaks; t, values from first peak.
2 Glucose values taken from first isomer peak.
54
2. 3. 3. 6 Column Comparison
The retention times of the sugars on the BP-1 column were approximately 7
minutes earlier than on the DB-5 column. The reproducibility of the retention times
was high; between 0.000 - 0.094 %RSD for the BP-1 column and between 0.018 and
0.064 %RSD for the DB-5 column (Table 2.3). Calculation of theoretical plates showed
the DB-5 column to be more efficient with the separation of soluble carbohydrates, with
most sugars, except trehalose, having twice the number of theoretical plates on the DB-
5 than on the BP-1.
2.3.4 Sugar analysis methods compared: HPLC vs GC
The performances of the HPLC-ELSD and GC-FID methods were compared
using the factors developed above. While the retention times were up to twice as long
using GC, the GC method was highly efficient compared to the HPLC method (Table
2.5). The retention times on the BP-1 column were ten-fold more reproducible than the
polyamine column (Table 2.5). This factor is important when identifying the
constituents of a sample. As expected, the GC theoretical plate number (n) was also
higher, indicating more interactions of the analytes with the column and therefore the
greater definition of peak shape. However, when n is put into relation with the length of
the column (i.e. plate height, h), carbohydrates separated on the BP-1 column have less
interaction with the column, as the plate height is greater than that on the polyamine
column (Table 2.5).
Importantly, the GC-FID had detection limits at least 80-fold better than the
HPLC-ELSD. While the ELSD was able to detect mM L"1
of analytes, the GC-FID was
detecting µM L" 1 of analytes (Table 2.5). Analysis of a seagrass sample using HPLC-
55
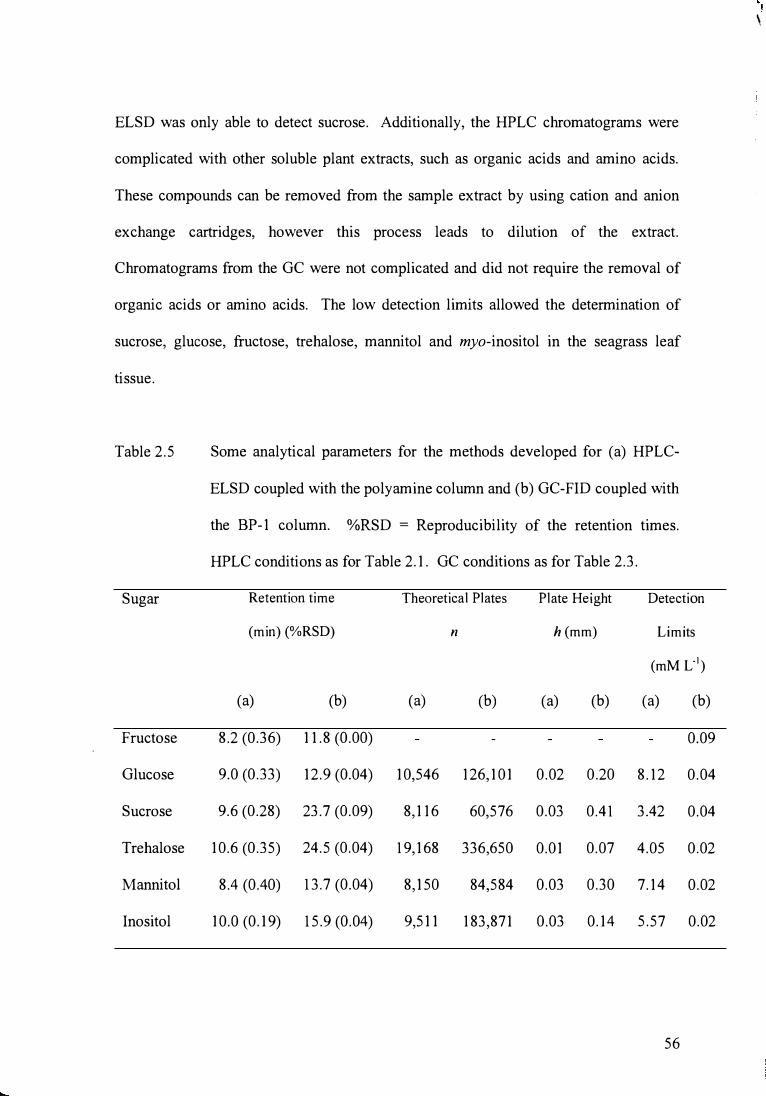
ELSD was only able to detect sucrose. Additionally, the HPLC chromatograms were
complicated with other soluble plant extracts, such as organic acids and amino acids.
These compounds can be removed from the sample extract by using cation and anion
exchange cartridges, however this process leads to dilution of the extract.
Chromatograms from the GC were not complicated and did not require the removal of
organic acids or amino acids. The low detection limits allowed the determination of
sucrose, glucose, fructose, trehalose, mannitol and myo-inositol in the seagrass leaf
tissue.
Table 2.5 Some analytical parameters for the methods developed for (a) HPLC-
ELSD coupled with the polyamine column and (b) GC-FID coupled with
the BP-1 column. %RSD = Reproducibility of the retention times.
HPLC conditions as for Table 2.1. GC conditions as for Table 2.3.
Sugar Retention time Theoretical Plates Plate Height Detection
(min) (%RSD) n h(mm) Limits
(mM L-1)
(a) (b) (a) (b) (a) (b) (a) (b)
Fructose 8.2 (0.36) 11.8 (0.00) 0.09
Glucose 9.0 (0.33) 12.9 (0.04) 10,546 126,101 0.02 0.20 8.12 0.04
Sucrose 9.6 (0.28) 23.7 (0.09) 8,116 60,576 0.03 0.41 3.42 0.04
Trehalose 10.6 (0.35) 24.5 (0.04) 19,168 336,650 0.01 0.07 4.05 0.02
Mannitol 8.4 (0.40) 13.7 (0.04) 8,150 84,584 0.03 0.30 7.14 0.02
Inositol 10.0 (0.19) 15.9 (0.04) 9,511 183,871 0.03 0.14 5.57 0.02
56
\
CHAPTER 3: Analysis of Carbohydrates in Posidonia coriacea
3.1 Introduction
Information available on P. coriacea is relatively scarce, as research has
concentrated on more abundant seagrasses such as P. australis. Ex situ research on P.
coriacea has been improved with the recent development of a technique for the
sterilization of fruits that allows the species to be grown in tissue culture (Henry, 1998).
However. the success of P. coriacea in tissue culture is limited, with seedlings dying I 0
- 12 months after germination. The possible cause of death may be that the seedlings
arc unable to replenish their carbohydrate stores, as death occurs soon after the full
depletion of the seed starch reserves (Kuo & Kirkman, 1992, 1996).
Generally, tissue cultures are provided with all the nece':>sary conditions to grow.
The tissue culture media, in which P. coril1cea is maintained, contains sucrose which
substitutes for carbohydrates that would otherwise be produced through in situ
photosynthesis. A steady and controlled supply- of light is also provided and the
cultures arc kept within a temperaturc·controlled room. Deaths of P. coriacea seedlings
however, are not restricted to tissue cultures as they have also died when kept in small
aquaria with no added nutrients and in large aquaria that mimic oceanic conditions
(Lavery, P.,pers. c:omm.).
One way to determine if placing P. coriacea in artificial cultures restricts their
ability to replenish carbohydrate reserves, is to monitor the carbohydrates of cultured
seedlings over time and compare their carbohydrate levels to those found in in situ
plants. To gain a better understanding of which carbOhydrates arc present, it is
57
necessary to measure individual carbohydrates rather than the total carbohydrate content
over a given period.
Few attempts have been made to determine what carbohydrates are found in
Australian Posidonia species. Levels of sucrose, glucose and fructose in P. australis
have been determined as 1-10, < 0.1 and< 0.1% dwt, respectively (Drew, 1983). Pirc
(1989) has determined the soluble carbohydrates found in the Mediterranean species
Posidonia oceanica, where 90 % total soluble carbohydrate was sucrose, with glucose,
fructose and myo-inositol making up the balance. Other soluble carbohydrates found in
seagrasses include apiose, fucose, galactose, mannose, rhamnose, xylose, mannitol and
a range of inositol isomers (Drew, 1983; Pirc, 1989; Touchette & Burkholder, 2000).
These studies have been limited in the range of carbohydrates determined and in their
detection limits.
The aim of this component of this project was to detcnnine if P. coriacea plants
maintained in artificial conditions were unable to replenish their carbohydrate stores.
The specific aims were to:
(i) identify the soluble carbohydrates in P. coriacea leaves and determine the
soluble and insoluble carbohydrate concentrations;
(ii) compare the soluble and insoluble carbohydrates of P. coriacea leaves, when
the seagrass is grown in tissue culture, aquaria and in situ environments; and
(iii) to analyse the carbohydrates of P. coriacea grown in each environment,
from May to October 2002 and determine if there is a pattern in the leaf
carbohydrate concentrations over this duration.
Note that while analysis of the rhizome and roots would provide a better indication of
carbohydrate loss, their growth is slow and their size on the tissue culture plants was
small, therefore it was not possible to analyse them for this project.
58
3.2 Materials and Methods
3.2.1 Reagents and Solvents
Details of reagents and solvents are in section 2.2.1. Additionally starch,
perchloric acid, phenol, concentrated sulfuric acid, Murashige and Skoog Basal
Medium (M+S), 3-(N-morpholino) propanesulfonic acid (MOPS), potassium hydroxide
and 6-furfurylaminopurine (kinetin) were purchased from Sigma Aldrich Pty. Ltd.
(NSW, Australia).
3.2.2 Preparation of Standards for GC analysis
Standard sugar-mixes were prepared in 80% ethanol. Standards contained
sucrose, D-glucose, D-fructose, D-trehalose, myo-inositol, mannitol and sorbitol. Five
standards prepared contained: 50, 200, 450, 600 and 850 µM L- 1 fructose; 50, 150, 250,
350 and 500 µM L-1 glucose; 50,250,450, 650 and 850 µM L-
1 sucrose; 10, 40, 80, 120
and 160 µM L-1
mannitol, sorbitol, inositol and trehalose; and 78 µM L-1 phenyl-P-D
glycoside as the internal standard.
3.2.3 Plant Material
Fruits from P. coriacea were collected in mid-December 2001 from Parmelia
Bank, Western Australia. Fruits were sterilized by rinsing in sterile DI water for 20
min, 20 minutes in 2 % benzalkonium chloride (in 10 % ethanol), followed by 3 rinses
in sterile seawater. The seeds were then placed into 30 mL culture tubes, with 10 mL
59
media consisting of Y2 strength M+S, 30 g L-1 Ocean Nature® seasalts, 5.0 f.l.M kinetin,
20 g L-1 sucrose and 10 mM L-1 MOPS in MilliQ, adjusted to pH 7.0 using 2M L-1
KOH. Cultures were kept in a constant temperature room of 21 °C, with a light regime
of 16 h light I 8 h dark and a light intensity of250 JlM sec"1 m"2 for four weeks before
transferring to fresh tissue culture media or aquaria.
Seagrasses in tissue culture were sub-cultured to fresh media every four to six
weeks. Seagrasses in aquaria were sub-cultured in June and September. During sub
culturing, dead leaf material was removed and green leaf blades were cut back to
approximately 50 mm. Removed green leaf material was kept at -85 °C until analysed.
3.2.3.1 Tissue Culture Plants
Uncontaminated seeds were transferred into I 00 mL fresh media consisting of Yl
strength M+S, 10 mM L"1 MOPS, 58 mM L"1 sucrose and 5.0 ~M L"1 kinetin, in either
filtered seawater or synthetic seawater mad from 30 g L-1 Ocean Nature® sea salts in
MilliQ. The pH was adjusted to pH 7.0 using 2 M L"1 KOH prior to autoclaving.
Eighty plants were kept in each type of media.
3.2.3.2 Aquaria Plants
A further 120 seagrasses, sterilized and free of contamination, were divided
evenly among three aquaria (300 x 400 x 250 mm) and kept in 24 L seawater at 21 oc
with a light regime of 16 h light I 8 h dark and a light intensity of 250 ~LM sec-1 m"2.
The seawater was changed and algal growth was removed every two months.
60
3.2.3.3 Field Plants
Seagrass shoots were collected from Pannelia Bank at depths of 4- 6 min June,
August, September and October. Leaf material was kept at -20 °C until analysed.
Before analysis epiphytes were removed with a razor blade.
3.2.4 Extraction of Carbohydrates
For each month, three replicates of leaf material (100 mg), harvested from each
environment, were ground in liquid nitrogen using a mortar and pestle. Soluble
carbohydrates were extracted in 80 % ethanol at room temperature using the method
described in section 2.2.3. The solid residue in the centrifuge tube was retained for
starch extraction.
Starch extracts were prepared using a method adapted from Quarmby and Allen
(1989). To the seagrass residue, remaining after the soluble carbohydrates had been
extracted, 2.5 mL MilliQ water was added. Sealed samples were placed in a 80 °C
agitating water bath for 15 minutes to gel the starch and then removed and cooled for 20
minutes. Rapidly, 2.5 mL 60% perchloric acid was added and the solution was left to
stand for 20 minutes to hydrolyse the starch. Samples were centrifuged for 10 minutes
at 13,000 rpm. The supernatant was made up to 50.0 mL with MilliQ water. To
prepare the stock starch standard, 100 mg of starch and 2.5 mL MilliQ water was placed
into a 30 mL centrifuge tube and treated the same as the samples. After extraction,
starch standards of 4, 20, 40,60 and 80 mg L-1 were prepared from the stock solution.
61
3.2.5 Soluble Carbohydrate Analysis
In a fume cupboard, 900 }.!L aliquots of seagrass sugar extract or standard were
transferred to 2.0 mL autosampler vials and evaporated to dryness using an air stream.
The residue was dissolved in 150 }.!L of pyridine and 150 }.!L ofBSTFA. Vials were
sealed, vortexed for I 0 seconds and heated for 30 minutes at 60 °C before GC analysis.
Analytical conditions were as described in section 2.2.5 using the BP-1 capillary
column.
3.2.6 Starch Analysis
Starch analysis was performed using the phenol-sulfuric acid method as
described in Buysse and Mercx (1993). In a fume cupboard, 1.0 mL of sample,
standard or blank (MilliQ) solution was transferred to a test tube, to which 1.0 mL of
20% (w/v) phenol solution was added. Immediately, 5.0 mL concentrated H2S04 was
added by directing the stream onto the liquid surface. The tubes were immediately
vortexed and left to stand for at least 20 minutes. The absorbance was measured using a
Shimadzu UV-1601 UV-visible spectrophotometer set at 490 run.
3 .2. 7 Statistical Analysis
Data was analysed using one-way ANOV A and the Scheffes Post-Hoc test with
significance at p < 0.05.
62
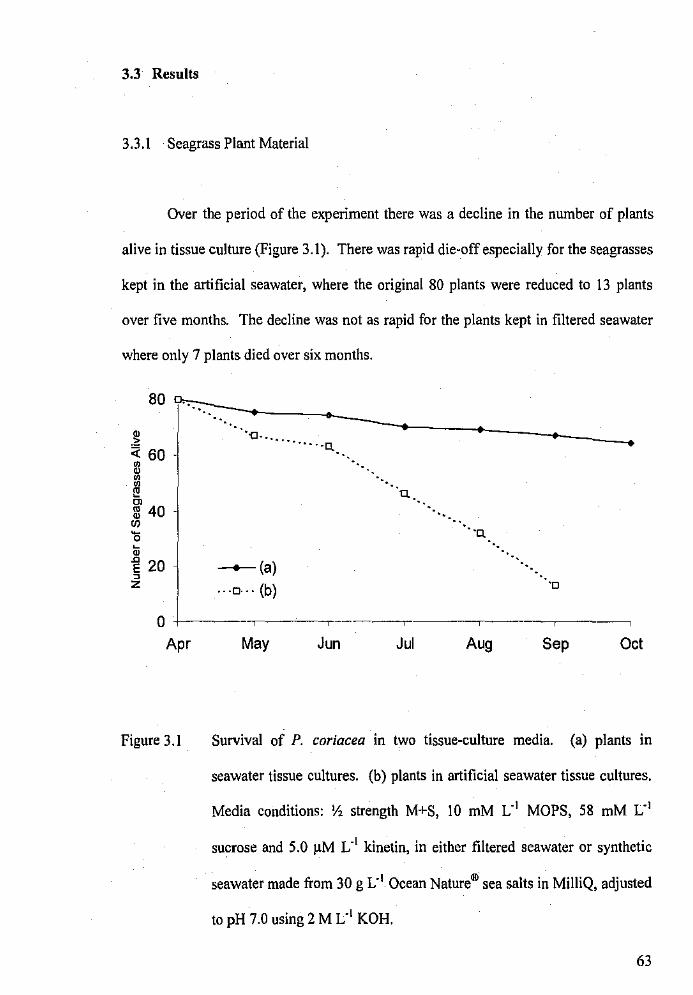
3.3 Results
3.3.1 Seagrass Plant Material
Over the period of the experiment there was a decline in the number of plants
alive in tissue culture (Figure 3.1). There was rapid die-off especially for the seagrasses
kept in the artificial seawater, where the original 80 plants were reduced to 13 plants
over five months. The decline was not as rapid for the plants kept in filtered seawater
where only 7 plants died over six months.
80 '0:-::-:-- ' ·----.. ' ' • ''(] ........... ·Q • ,, •
" 60 • • • • ~ Q
m 40 ·-"' - "CJ. 0
" . . •
~ 20 -+-(a) , z .. ·0.·. (b) ·o
0 ~~--~ ~
Apr May Jun Jul Aug Sep Oct
Figure 3.1 Survival of P. coriacea in two tissue-culture media. (a) plants in
seawater tissue cultures. (b) plants in artificial seawater tissue cultures.
Media conditions: 'lS. strength M+S, 10 mM L'1 MOPS, 58 mM L'1
sucrose and 5.0 ~M L'1 kinetin, in either filtered seawater or synthetic
seawater made from 30 g L'1 Ocean Nature® sea salts in MilliQ, adjusted
to pH 7.0 using 2M L"1 KOH.
63
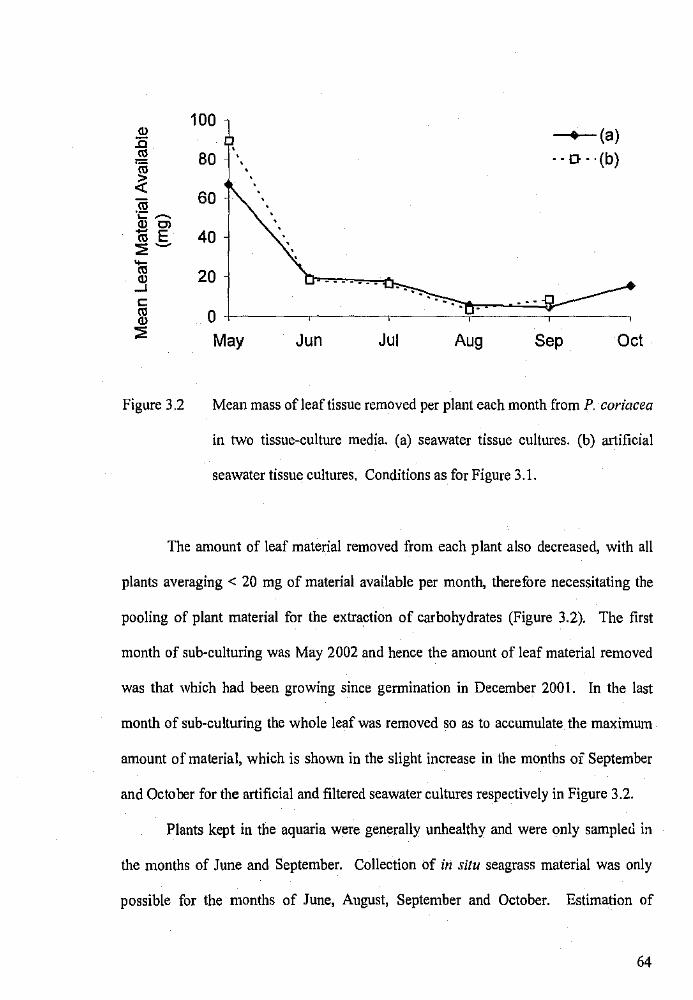
100 Q) (a) :E
'" 80 .. 0 .. (b) '(ij
~ 60 .!!!
~~
Q) Cl
iiiE ::;:- 40
'1ii 20 Q)
-' ····--- .. c: ...
'" 0 Q)
::;: May Jun Jul Aug Sep Oct
Figure 3.2 Mean mass of leaf tissue removed per plant each month from P. coriacea
in two tissue-culture media. (a) seawater tissue cultures. (b) artificial
seawater tissue cultures. Conditions as for Figure 3.1.
The amount of leaf material removed from each plant also decreased, with all
plants averaging < 20 mg of material available per month. therefore necessitating the
pooling of plant material for the extraction of carbohydrates (Figure 3.2). The first
month of sub-culturing was May 2002 and hence the amount of leaf material removed
was that which had been growing since germination in December 2001. In the last
month of sub-culturing the whole leaf was removed so as to accumulate the maximum
amount of material, which is shown in the slight increase in the months of September
and October for the artificial and filtered seawater cultures respectively in Figure 3.2.
Plants kept in the aquaria were generally unhealthy and were only sampled in
the months of June and September. Collection of in situ seagrass material was only
possible for the months of June, August, September and October. Estimation of
64
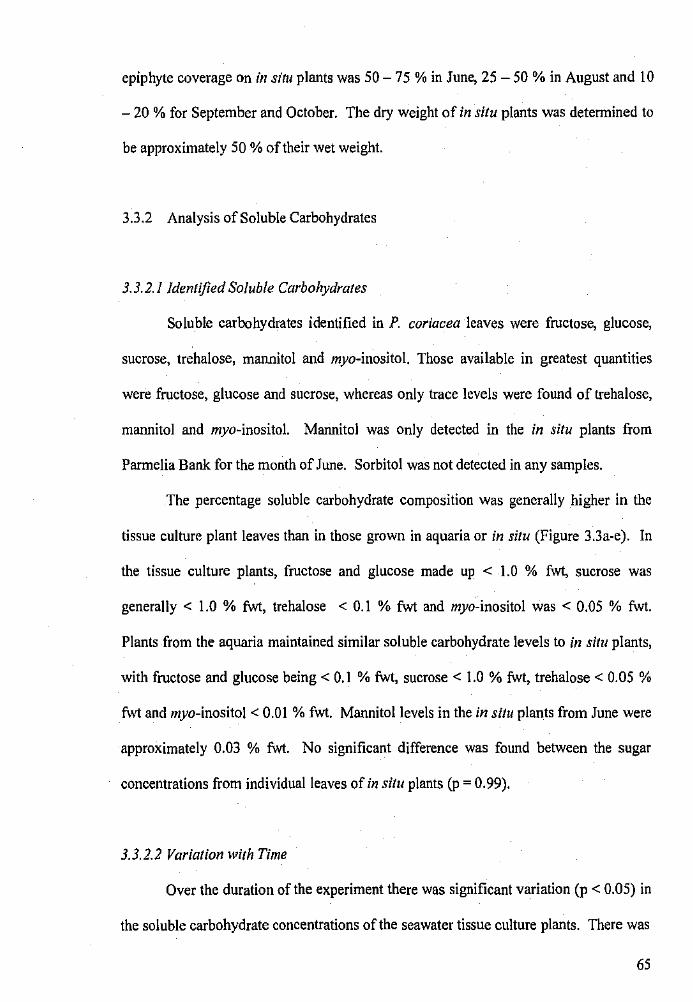
epiphyte coverage on in situ plants was 50-75% in June, 25-50% in August and 10
- 20 % for September and October. The dry weight of in situ plants was determined to
be approximately 50% of their wet weight.
3.3.2 Analysis of Soluble Carbohydrates
3.3.2.1 Identified Soluble Carbohydrates
Soluble carbohydrates identified in P. coriacea leaves were fructose, glucose,
sucrose, trehalose, mannitol and myo-inositoL Those available in greatest quantities
were fructose, glucose and sucrose, whereas only trace levels were found of trehalose,
mannitol and myo-inositol. Mannitol was only detected in the in situ plants from
Parmelia Bank for the month of June. Sorbitol was not detected in any samples.
The percentage soluble carbohydrate composition was generally higher in the
tissue culture plant leaves than in those grown in aquaria or in situ (Figure 3.3a-e). In
the tissue culture plants, fructose and glucose made up < 1.0 % fwt, sucrose was
generally < 1.0 % fwt, trehalose < 0.1 % fwt and myo-inositol was < 0.05 % fwt.
Plants from the aquaria maintained similar soluble carbohydrate levels to in situ plants,
with fructose and glucose being< 0.1 % fwt, sucrose < 1.0 % fwt, trehalose < 0.05 %
fwt and myo-inositol < 0.01 % fwt. Mannitol levels in the in situ plants from June were
approximately 0.03 % fwt. No significant difference was found between the sugar
concentrations from individual leaves of in situ plants (p = 0.99).
3.3.2.2 Variation with Time
Over the duration of the experiment there was significant variation (p < 0.05) in
the soluble carbohydrate concentrations of the seawater tissue culture plants. There was
65
(a) Fructose
12 -X-TC-SW
· · + · ·TC-ASW .':
10 [l Aquaria
- -l% -In situ
I 8 m -m
" 6 c +. 0
g '
: 1 c • '
+~ u ' c 0 u I "' 0 "' 0 --~
M•y June July August September October
(b) Glucose [---12 -~-TC-SW
+ · ·TC-ASW
!" CJ Aquaria
-tr -in sltu m -m 8
" c 6
1 +, '
~ 4 c 0
.u 2
0 M•y June J"ly August September October
Figure 3.3a,b Variations in soluble carbohydrate concentrations for P. coriacea
seedlings maintained in seawater tissue culture (TC-SW), artificial
seawater tissue culture (TC-ASW), aquaria and grown in situ. (a)
fructose. (b) glucose. (c) sucrose. (d) trehalose. (e) myo-inositol. 1.0 SE
=(a)< 1.28, (b)< 0.90.
66
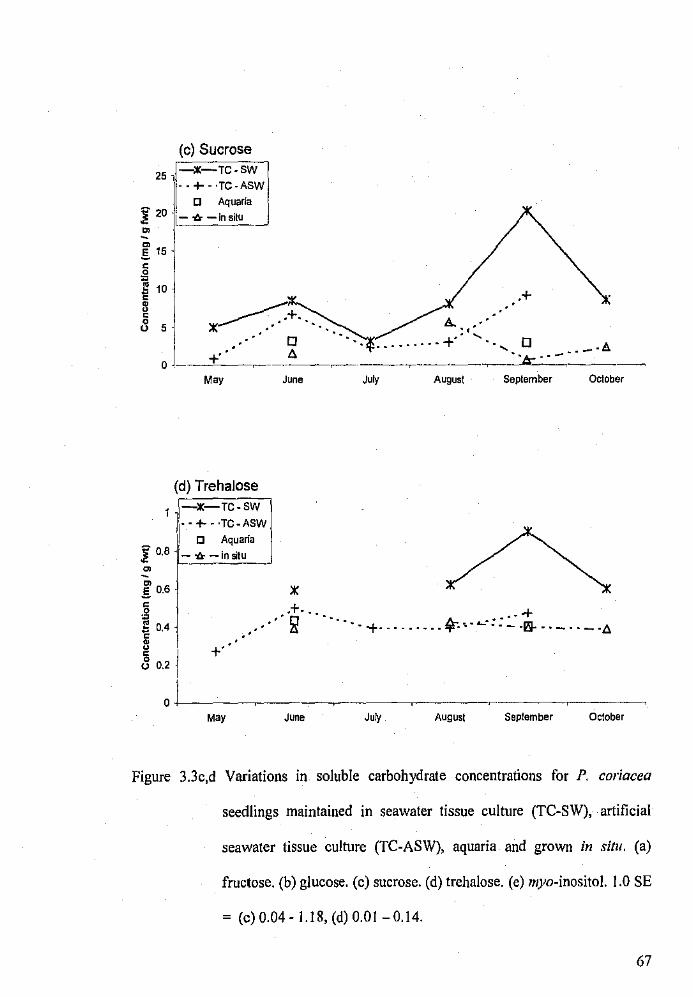
(c) Sucrose
25 ,[ ---«-TC • SJ
1
- · +- ·TC-ASW CJ Aquaria
,!' 20 [:- -tr - in situ
~
.§. 15
~ .+ £ 10
8 0
8 5 "'~+-.... A..,
.. -·· ~ ··--. ---------+·" '·- .... 0 .!J.
+" ,......-------~..,------...,...........-~-.-,L M•y
(d) Trehalose
1 1-x TC-SW
II'·.+-. ·TC-ASW IJ Aquaria
'" 0,8 ' <i: - -tr -in situ ------~ -~ .§. 0.6
June August September October
:0:
j .£l 0.4
~ I 8 0.2 j
..... ·l· ....... -+· ........ $"-'. -·:: :.· .;;. .. - .. - ·ll
Moy June August September October
Figure 3.3c,d Variations in soluble carbohydrate concentrations for P. coriacea
seedlings maintained in seawater tissue culture (TC-SW), artificial
seawater tissue culture (TC-ASW), aquaria and grown in situ. (a)
fructose. (b) glucose. (c) sucrose. (d) trehalose. (e) myo-inositol. 1.0 SE
= (c)0.04-1.18,(d)O.Oi-0.!4.
67
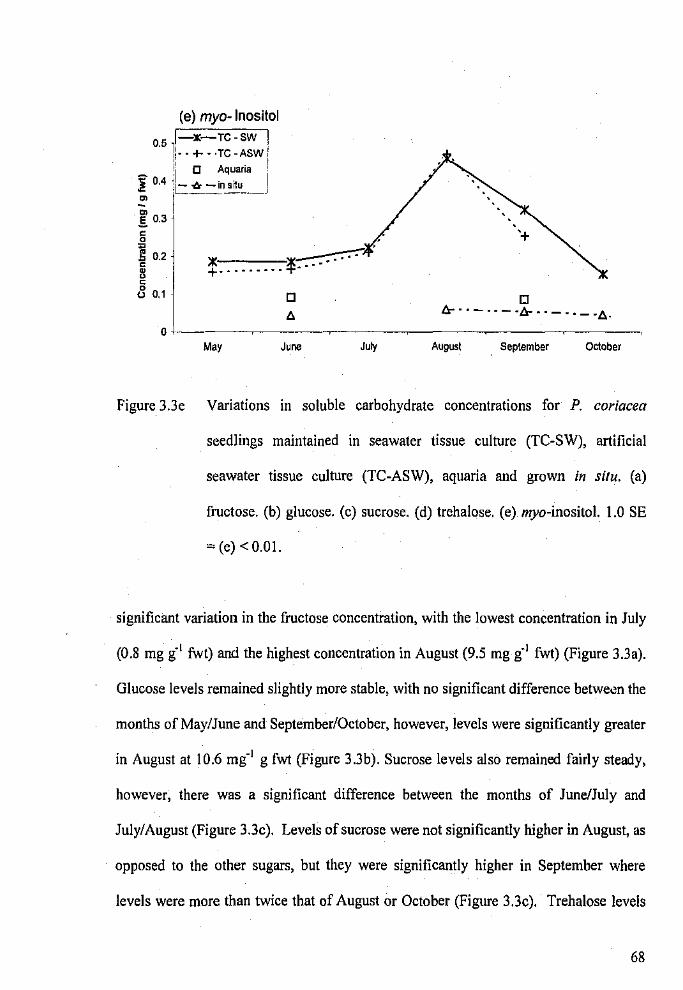
(e) myo-lnositol
o.s I x-rc-sw I 1t- · + · ·TC -ASW i ,, '
_ .!i C ~q~aria !
,! 0.4 t- ~ -m~u ! tn I---------0, I .§. 0.3
~ .£: 0.2 c X- ><~ +-········+·" 8 • 0 0.1
0 M•Y
0
"' Jooo Joly
·. ..
0 tr . . -.-- -tr----.- ....
August September October
Figure 3.3e Variations in soluble carbohydrate concentrations for P. coriacea
seedlings maintained in seawater tissue culture (TC-SW), artificial
seawater tissue culture (TC-ASW), aquaria and grown in situ. (a)
fructose. (b) glucose. {c) sucrose. (d) trehalose. (e) myo-inositol. 1.0 SE
=(e)< 0.01.
significant variation in the fructose concentration, with the lowest concentration in July
(0.8 mg g"1 fwt) and the highest concentration in August (9.5 mg g"1 fwt) (Figure 3.3a).
Glucose levels remained slightly more stable, with no significant difference between the
months of May/June and September/October, however, levels were significantly greater
in August at 10.6 mg-1 g fwt (Figure 3.3b). Sucrose levels also remained fairly steady,
however, there was a significant difference between the months of June/July and
July/August (Figure 3.3c). Levels of sucrose were not significantly higher in August, as
opposed to the other sugars, but they were significantly higher in September where
levels were more than twice that of August or October (Figure 3.3c). Trehalose levels
68
were significantly different throughout the experiment (ANOVA, p = 0.004), however a
post-hoc test was not performed as the results did not meet the requirements (Figure
3.3d). Levels of inositol were only significantly higher in August (0.46 mg g- 1 fwt)
(Figure 3.3e).
In the artificial seawater tissue cultures there was a significant difference in the
soluble carbohydrate concentrations for May, June and July. However, there was not
enough plant material to measure the significance for August or September. Fructose
and glucose levels showed the same pattern of significant changes, with high
concentrations in May and low concentrations in June (Figure 3.3a,b). Sucrose and
trehalose levels increased significantly in June (Figure 3.3c,d). However, while sucrose
levels in May were significantly lower than in July, there was no significant difference
in trehalose concentrations for these months (p = 0.531 ). Inositol concentrations only
increased significantly in July to 0.21 mg g- 1 fwt from 0.17 mg t 1 fwt (Figure 3.3e).
For the aquaria plants there was no significant difference in soluble
carbohydrate levels between June and September, except in June where glucose had
significantly higher levels (p = 0.004) (Figure 3.3b). The probability values for
fructose, inositol, sucrose and trehalose were p = 0.328, 0.643, 0.386 and 0.081,
respectively.
Soluble carbohydrates in the in situ plants all significantly differed over the
study period except for fructose (p = 0.095). Statistical analysis of fructose was limited
as it was not detected in leaves from September and only one of the three replicates
from June had detectable levels (Figure 3.3a). Levels of glucose were significantly
lower in June and September than in August and October (Figure 3.3b). Sucrose levels
were significantly different for all months sampled (Figure 3.3c), whereas trehalose
only significantly increased in August (Figure 3 .3d). Inositol levels were only
69
\
significantly different between June and August, with low levels in June and high levels
in August (Figure 3.3e).
3.3.2.3 Variation with Environment
Seagrasses in seawater tissue culture had significantly higher levels of all sugars
(fructose, glucose, sucrose, trehalose myo-inositol) than in situ plants in August and
September (3.3a-e). Fructose, glucose, trehalose and myo-inositol levels were
significantly different in all treatments for June, but sucrose levels were not different for
the tissue culture plants (Figure 3.2c). An ANOVA also showed that all sugars were
significantly different in each treatment in September, however, there was not enough
plant material to meet Post-Hoc test requirements to find where this significance lay.
Fructose, glucose, inositol and sucrose levels did not differ significantly between the
tissue culture treatments in May or July (Figure 3.3a,b,c,e).
3.3.3 Analysis of Starch
Standards prepared using the phenol-sulfuric acid method were found to be
stable for at least 2 hours and even after 12 hours there was only slight variation (about
0.002 absorbance units, AU). Calibration lines for 4 - 80 mg L- 1 were linear, giving an
R2 value of 1.000, between 0.040 - 0.860 AU.
No significant difference (p > 0.05) was found between the concentrations of
starch in individual leaves from in situ plants. Figure 3.4 shows the variation of starch
over the duration of the experiment for each environment.
70
'
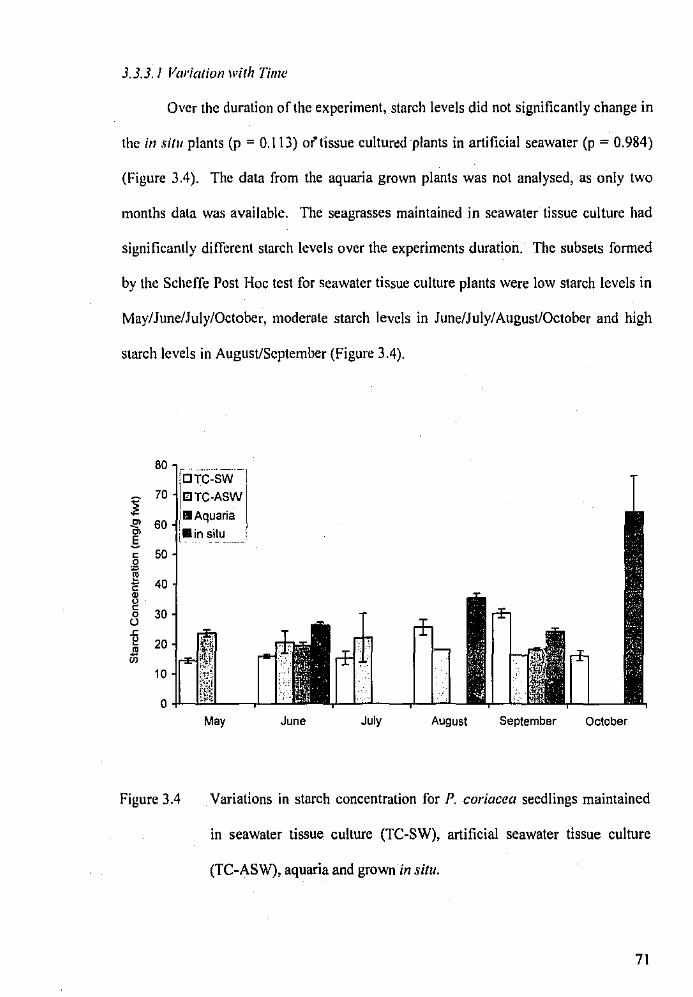
3.3.3.1 Variation with Time
Over the duration of the experiment, starch levels did not significantly change in
the in sit11 plants (p = 0.113) of tissue cultur~d -plants in artificial seawater (p = 0.984)
(Figure 3.4). The data from the aquaria grown plants was not analysed, as only two
months data was available. The seagrasses maintained in seawater tissue culture had
significantly different starch levels over the experiments duration. The subsets fanned
by the Scheffe Post Hoc test for seawater tissue culture plants were low starch levels in
May/June/July/October, moderate starch levels in June/July/August/October and high
starch levels in August/September (Figure 3.4).
80
i 70
-E' 60 ~ situ g c 50 0 ~ g 40 ~ c
30 0 (.)
"2 20 ~
10
0 May June July August September October
Figure 3.4 Variations in starch concentration for P. coriacea seedlings maintained
in seawater tissue culture (TC-SW), artificial seawater tissue culture
(TC-ASW), aquaria and grown in situ.
71
3.3.3.2 Variation with Environment
For the months of May, July, August and October, there was no significant
difference between the starch concentrations of plants from each environment (Figure
3.4). There were significant differences, however, for June (p == 0.041), August (p ==
0.101) and September (p == 0.230). In June, the in situ plants had significantly higher
starch levels than the seawater tissue culture plants (p == 0.045). Due to a lack of plant
material, post-hoc tests were unable to be performed on the months of August or
September.
3.4 Discussion
The type and levels of soluble carbohydrates found in in situ P. coriacea were
similar to that found by Drew (1983) for P. australis. Levels of sucrose, glucose and
fructose in P. australis were 1-10%, < 0.1 %and< 0.1 % dwt respectively. This study
found levels of sucrose, glucose and fructose in in situ P. coriacea to be 0.1 - 0.5, < 0.1
and < 0.1 % 1Wt respectively, with water content being approximately 50 %.
Additionally, this study also found low levels of trehalose, myo-inositol and mannitol at
concentrations approximately< 0.5% fwt respectively.
P. coriacea in tissue culture contained significantly higher levels of soluble
carbohydrates than found in aquaria or in situ. This difference may be due to the
increased regularity of the light periods rmd the light intensity, however, the aquaria
plants were also exposed to the same light conditions. The difference between the
aquaria and tissue culture media were the inclusion of micro- and macro-nutrients and
most importantly, sucrose into the tissue culture media. It is likely that the addition of
72
extra nutrients and particularly sucrose in tissue culture media elevated levels of soluble
carbohydrates in the leaf tissue.
The age of the in situ plants was unknown, but they were likely to be at least one
year old. The lower levels of soluble carbohydrates found in the in situ plants may
therefore be somewhat related to plant age, as older plants have lower carbohydrate
levels (Pirc, 1985). It may also be related to decreased photosynthesis rates, as plants
were collected over the winter months where increased turbidity, lower temperatures
and cloud cover prevent maximum photosynthetic rates. Additionally, in situ plants
were covered with epiphytes, with 50 - 75 % epiphyte coverage in June, which
decreased to 10-20% by September.
Alcoverro et al. (1999) mentions that under stress, seagrasses will preferentially
mobilize stored carbohydrates to the leaf tissue to be utilized in shoot growth, which
can be measured by increased carbohydrate levels in the leaves. This study found the
carbohydrates of seawater tissue culture plants, which did not die off quickly, did not
vary significantly from the artificial seawater plants that did die quickly (Figure 3.1).
The. effect mentioned by Alcoverro et al. (1999) was therefore not seen.
The significant variation in the soluble carbohydrate concentrations of tissue
culture plants is not well understood due to a lack of knowledge on their use in
seagrasses. The increase of fructose and glucose concentrations in August may be a
genetic response to mobilise stored sugars for the initiation of shoot growth, which in
situ plants may then have exploited for increasing photosynthesis rates before flower
onset in September. While this response was not seen as clearly in the in situ plants,
this may be due to the lower availability of intercellular carbohydrates and seawater Ci.
However, there was no concurrent increase of shoot growth of tissue culture plants in
August (Figure 3.2). September then saw the decrease of fructose and glucm·.e and an
73
increase of sucrose concentrations. Should there be some truth in the above hypothesis,
perhaps a genetic response may also initiate an increased uptake of Ci for flower
initiation.
In addition to fructose, glucose, sucrose and myo-inosiio!, the soluble
carbohydrates found in P. oceanica (Pirc, 1989), trehalose and mannitol were also
identified. Trehalose was found in most of the seagrass extracts at trace levels.
Mannitol, however, was only found in trace levels in the extracts from the in situ plants
in June. Mannitol is believed to be an osmo-regulator, with increased levels in water
stressed plants (Lewis & Smith, 1967). In higher plants mannitol is produced from
glucose and is easily transported through vasa-structures to be utilised as carbohydrate
reserves or for osmoregulation (Lewis & Smith, 1967). The presence of mannitol in
June in situ plants may be due to the high epiphyte coverage and competition for light in
that month. No mannitol was detected in the other months studied (detection limit= 8.6
ng I 2 J-I.L) and in these months the epiphyte coverage was decreasing. While epiphyte
survival has been found to decrease with a decrease in light availability, P. coriacea
may be able to utilize this light more efficiently, therefore negating the need for
mannitol.
Starch levels in P. coriacea were approximately 1 - 8 % fwt. Starch levels in P.
oceanica were found to be about 1 % dwt (Pirc, 1989). Q,;er the duration of this
experiment the starch levels varied significantly in P. coriacea grown in seawater tissue
culture but not in the aquaria or in situ plants.
Starch is one of the major storage carbohydrates in seagrasses, along with
sucrose (Touchette & Burkholder, 2000). When mobilized, it is broken down into its
glucose units to be used for various activities, including formation of cell walls, proteins
and tannins. While variation of starch levels was significant for the seawater tissue
74

cultures (ANOV A, p < 0.05), there was no general pattern to suggest that any of the
treatments were responding to environmental factors, such as light availability, or
physical factors, such as seed starch reserves.
75
CHAPTER 4: Concluding Remarks
This study was not able to provide evidence to suggest that P. coriacea in tissue
culture is unable to replenish carbohydrate reserves, however, they do contain
significantly greater amounts of soluble carbohydrates than plants growing in situ.
Elevated production of soluble carbohydrates in tissue-cultured plants is believed to be
related to the high concentration of sucrose provided in the media and the favourable
conditions provided for growth. Further studies to elucidate this may involve using
tissue culture or aquaria with/without additions of sucrose, or differing sucrose
concentrations.
In addition to the soluble carbohydrates found in P. oceanica, that is sucrose,
glucose, fructose and myo-inositol, this study also found trace levels of trehalose and
mannitol in P. coriacea. Mailllitol, however, was only found in the in situ plants from
June and may be a response to stress. As there is greater availability of in situ material,
a greater sample mass (mass> O.lOOg) could be used to see if mannitol is present in
trace levels year round or only at particular times where the plant is under stress.
The significantly higher levels of sucrose in September and glucose and fructose
in August, in the tissue culture plants is not understood. However, should it be a
genetic response to prepare the plant for flowering in September, the increased sugar
levels may be related to increases in the levels of enzyme used to synthesise these
sugars. Enzyme levels could therefore be analysed in a future study.
Soluble carbohydrates in P. coriacea were detennined using a simple, yet robust
GCMFID method developed in Chapter 2. This method used minimal volumes of
solvent, maximising the potential to identify and quantify carbohydrates in samples
when only small amounts of plant tissue is available. Preparation of extracts for GC
76
analysis was relatively quick, uncomplicated and quantitative. This method also
provided low detection limits and highly reproducible retention times for soluble
carbohydrates.
77
References
Adams, M., Chen, Z., Landman, P., & Colmer, T. (1999). Simultaneous detennination by capillary gas chromatography of organic acids, sugars and sugar alcohols in plant tissue extracts as their trimethylsilyl derivatives. Analytical Biochemistry, 266,77-84.
Adams, P., Thomas, J., Vernon, D., Bohnert, H., & Jensen, R. (1992). Distinct cellular and organic responses to salt stress. Plant and Cell Physiology, 33, 1215~ 1223.
Adams, P ., Zegeer, A, Bohnert, H., & Jensen, R. (1993). Anion exchange separation and pulsed amperometric detection of inositols from flower petals. Analytical Biochemislly, 214,321-324.
Alcoverro, T., Manzanera, M., & Romero, J. (1998). Seasonal and age-dependent variability of Posidonia oceanica (L.) Delile photosynthetic parameters. Journal of Experimental Marine Biology and Ecology, 230, 1-13.
Alcoverro, T., Zimmerman, R., Kohrs, D., & Alberte, R. (1999). Resource allocation and sucrose mobilization in light-limited eelgrass Zo~lf!ra marina. Marine Ecology Progress Series, 187, 121 ~131.
Balestri, E., Piazzi, L., & Cinelli, F. (1998). In vitro germination and seedling development of Posidonia oceanica. Aquatic Botany, 60, 83-90.
Beer, S. (1989). Photosynthesis and photorespiration of marine angiosperms. Aquatic Botany, 34, 153-166.
Bird, K., Brown, M., Henderson, T., O'Hara, C., & Robbie, J. (1996). Culture studies of Ruppia maritima L. in bicarbonate- and sucrose-based media. Journal of Experimental Marine Biology and Ecology, 199, 153-164.
Bird, K., Cody, B., Jewett·Smith, J., & Kane, M. (1993). Salinity effects on Ruppia maritima L. cultured in vitro. Botanica Marina, 36, 23-28.
Bleton, J., Mejanelle, P., Sansou1et, J., Goursaud, S., & Tchap1a, A. (1996). Characterization of neutral sugars and uronic acids after methanolysis and trimethylsilylation for recognition of plant gums. Journal of Chromatography A, 720,27-49.
Burke, M., Dennison, W., & Moore, K. (1996). Non-structural carbohydrate reserves of eelgrass Zostera marina. Marine Ecology Progress Series, 137, 195-201.
Buysse, J., & Merckx, R. (1993). An improved colorimetric method to quantify sugar content of plant tissue. Journal of Experimental Botany, 44, 1627-1629.
78
Cambridge, M. (1975). Seagrasses of south-western Australia with special reference to the ecology of Posidonia australis Hook. f. in a polluted environment. Aquatic Botany, I, 149-161.
Cambridge, M. (1999). Growth strategies ofRottnest Island seagrasses. In D. Walker & F. Wells (Eds.), The Seagrass Flora and Fauna ofRottnest Island, Western Australia (pp. 1-24). Perth: Western Australian Museum.
Cambridge, M., Chitlings, A., Brittan, C., Moore, L., & McComb, A. (1986). The loss of seagrasses in Cockburn Sound, Western Australia. II. Possible causes of seagrass decline. Aquatic Botany, 24, 269-285.
Cambridge, M., & McComb, A. (1984). The loss ofseagrasses in Cockburn Sound, Western Australia. I. The time course and magnitude of seagrass decline in relation to industrial development. Aquatic Botany, 20.
Campey, M., Waycott, M., & Kendrick, G. (2000). Re-evaluating species boundaries among members of the Posidonia ostenfeldii species complex (Posidoniaceae)morphological and genetic variation. Aquatic Botany, 66,41-56.
Chapman, J., OW., & Horvat, R. (1989). Detennination of nonvolatile acids and sugars from fruit and sweet potato extracts by capillary GLC and GLC/MS. Journal of Agricultural Food Chemistry, 37,947-950.
Chen, Z., Landman. P., Colmer, T., & Adams, M. (1998). Simultaneous analysis of amino and organic acids in extracts of plant leaves as /ert-butyldimethylsilyl derivatives by capillary gas chromatography. Analytical Biochemistry, 259, 203-211.
Corradini, C., Canali, G., Galanti, R., & Nicoletti, I. (2001). Determination of alditols and carbohydrates of food interest using a sulfonated monodisperse resin-based column, coupled with pulsed amperometric detection (PAD) and postcolumn pH adjustment. Journal of Liquid Chromatography and Related Technologies, 24, 1073-1088.
de Ia Cruz-Garela, C., Lopez-Hernandez, J., & Simai-Lozano, J. (2001). Effects of various culinary treatments on the carbohydrates content cf green beans (Phaseolus vulgaris, L.). Deutsche Lebensmillel-Rundschau, 10, 385-387.
Donnaar, J., & Willms, W. (I 990). Effect of grazing and cultivation on some chemical properties of soils in the mixed prairie. Journal of Range Management, 43, 456-460.
Drew, E. (1983). Sugars, cyclitols and seagrass phylogeny. Aquatic Botany, 15, 387-408.
Dubois, M., Gilles, K., Hamilton, J., Rebers, P., & Smith, F. (1956). Colorimetric method for detennination of sugars and related substances. Analytical Chemistry, 28, 350-356.
79
Gailing, M., Guibert, A., & Combes, D. (1998). Sensitive and reproducible method for neutral monosaccharides and uronic acid determination in sugar beet pulp enzymatic treatment media and press juices by high performance anion exchange chromatography with pulsed amperometric detection. Biotechnology Techniques, 12(2), 1o5-169.
Gordon, D. M., Grey, K. A., Chase, S. C., & Simpson, C. (1994). Changes to the structure and productivity of a Posidonia sinuosa meadow during and after imposed shading. Aquatic Botany, 47, 265-275.
Guraya, H. S., James, C., & Champagne, E. T. (2001). Evaluation ofdebranched rice starch sample preparation methods for anion-exchange chromatography with pulsed amperometric detection. Journal of Liquid Chromatography and Related Technologies, 24, 2303-2314.
Gutmann, 1., & Wahlefeld, A. (1974). Determination with malate dehydrogenase and NAD. 1n H. Bergmeyer (Ed.), Methods of Enzymatic Analysis (2nd English ed., pp. 1585 - 1589): Verlag Chemie, Academic Press.
Ha, Y., & Thomas, R. (1988). Simultaneous determination of neutral sugars and uronic acids in Hydrocolloids. Journal of Food Science, 53, 574-577.
Hanko, V., & Rohrer, J. (2000). Determination of carbohydrates, sugar alcohols and glycols in cell cultures and fermentation broths using high-performance anionexchange chromatography with pulsed amperometric detection. Analytical Biochemistry, 283, 192-199.
Henry, M. (1998). The In Vitro Propagation ofSeagrasses: Halophila ova/is, Ruppia megacarpa and Posidonia coriacea. Unpublished Honours, Edith Cowan University, Perth.
Hocking, P. (1981). The nitrogen and phosphorous nutrition of developing plants of two seagrasses, Posidonia australis and Posidonia sinuosa. Aquatic Botany, I 1, 245-261.
Hodge, J ., & Hofreiter, B. ( 1962). Determination of reducing sugars and carbohydrates. In R. Whisler & J. Wolfram (Eds.), Methods in carbohydrate chemistry (Vol. 1: Analysis and preparation of sugars, pp. 380- 394). New York: Academic Press.
Halligan, P., & Drew, E. (1971). Routine analysis by gas-liquid chromatography of soluble carbohydrates in extracts of plant tissues. New Phytologist, 70,271 -297.
Honda, S., Akao, E., Suzuki, S., Okuda, M., Kakehi, K., & Nakamura, J. (1989). Highperformance liquid chromatography of reducing carbohydrates as strongly ultraviolet-absorbing and electrochemically sensitive 1-phenyl-3-methyl-5-pyrazolone derivati'fes. Analytical Biochemistry, 180, 351-357.
80
Invers, 0., Romero, J., & Perez, M. (1997). Effects of pH on seagrass photosynthesis: a laboratory and field assessment. Aquatic Botany, 59, 185-194.
James, P ., & Larkum, A. (1996). Photosynthetic inorganic carbon acquisition of Posidonia australis. Aquatic Botany, 55, 149- 157.
Janauer, G., & Englmaier, P. (1978). Multi-step time program for the rapid gas-liquid chromatography of carbohydrates. Journal a/Chromatography, 153, 539-542.
Kahane, R., Pitiot, C., Chamaux, C., Vialle-Guerin, E., & Schweisguth, B. (2001). Nonstructural carbohydrate compostition of long-day onion in vitro. Journal of Horticultural Science and Biotechnology, 76, 320-326.
Kendrick, G., Eckersley, J., & Walker, D. (1999). Landscape-scale changes in seagrass distribution over time: a case study from Success Bank, Western Australia. Aquatic Botany. 65,293-309.
Kendrick, G., Hegge, B., Wyllie, A., Davidson, A., & Lord, D. (2000). Changes in seagrass cover on Success and Parmelia Banks, Western Australia between 1965 and 1995. Estuarine, Coastal and Shelf Science, 50, 341 - 353.
Kirkman, H. (1997). Seagrasses of Australia, Australia: State of the Environment Technical Paper Series (Estuaries and the Sea). Canberra: Department of the Environment.
Kirkman, H., & Kuo, J. (1990). Pattern and process in southern Western Australian seagrasses. Aquatic Botany, 37, 367-382.
Kleinschmidt, R, Heintschke,I., & Rothe, G. (1998). Effect of season and soil treatments on carbohydrate concentrations in Norway spruce (Picea abies) mycorrhizae. Tree Physiology, 18,325-332.
Knapp, D. (1979). Handbook of Analytical Derivatisation Reactions: John Wiley and Sons: New York.
Kuo, J., & Cambridge, M. (1984). A taxonomic study of the Posidonia ostenfeldii complex (Posidoniaceae) with description of four new Australian seagrasses. Aquatic Botany, 20,267-295.
Kuo, J., & Kirkman, H. (1992). Fruits, seeds and germination in the seagrass Halophila ovalis (Hydrocharitaceae). Botanica Marina, 35, 197-204.
Kuo, J., & Kirkman, H. (1996). Seedling development of selected Posidonia species from southwest Australia. Seagrass Biology: Proceedings of an International Workshop, Rottnest Island, Western Australia, 25- 29 January 1996, 57-64.
Lee, B., Yanamandra, K., & Thurmon, T. (2002). Quantitative estimation of organic analytes with a capillary column. American Clinical Laboratory, May, 30- 34.
81
. Lee, H. S., & Coates, G. A. (2000). Quantitative study of free sugars and myo~inositol in citrus juices by HPLC and a literature compilation. Journal of Liquid Chromatography and Related Technologies, 23,2123-2141.
Lewis, D., & Smith, D. (1967). Sugar alcohols (polyols) in fungi and green plants: I. Distribution, physiology and metabolism. The New Phytologist, 66, 143-184.
LoBianco, R., Rieger, M., & Sung, S. (1999). Activities of sucrose and sorbitol metabolising enzymes in vegetative sinks of peach and correlation with sink growth rate. Journal of the American Society of Horticultural Science, 124, 381-388.
Longstaff, B., & Dennison, W. (1999). Seagrass survival during pulsed turbidity events: the effects of light deprivation on the seagrasses Halodule pinifolia and Halophil a ova/is. Aquatic Botany, 65, 105-121.
Longstaff, B., Loneragan, N., O'Donohue, M., & Dennison, W. (1999). Effects of light deprivation on the survival and recovery of the seagrass Halophila ova/is (R. Br.) Hook. Journal of Experimental Marine Biology and Ecology, 234, 1 - 27.
Loques, F., Caye, G., & Meinesz, A. (1990). Axenic culture of selected tissue of Posidonia oceanica. Aquatic Botany, 37, 171-188.
MacArthur, L., & Hyndes, G. (2001). Differential use of seagrass assemblages by a suite of Odacid species. Estuarine, Coastal and Shelf Science, 52, 79- 90.
Macrae, J., Smith, D.1 & McCready, R. (1974). Starch estimation in leaf tissue- a comparison of results using six methods. J. Sci. Fd Agric., 25, 1465 - 1469.
Marko~ Varga, G., Dominguez, E., Hahn~Hagerdal, B., Gorton, L., lrth, H., DeJong, G. J., Frei, R. W., & Brinkman, U. A. T. (1990). On-line sample clean-up of fermentation broths and substrates prior to the liquid chromatographic separation of carbohydrates. Journal of Chromatography, 523, 173-188.
Masini, R., Cary, J., Simpson, C., & McComb, A. (1995). Effects oflight and temperature on the photosynthesis of temperate meadow~forming seagrasses in Western Australia. Aquatic Botany, 49, 239~254.
McMillan, C. (1980). Culture Methods. In C. P. McRoy (Ed.), Handbook ofSeagrass Biology: an Ecosystem Perspective. (pp. 57-68). New York: Garland STPM press.
Mora, M. !., & Marioli, J. M. (2001). Honey carbohydrate analysis by HPLC, with electrochemical detection, using a Ni-Cr alloy electrode. Journal of Liquid Chromatography and Related Technologies, 24, 711-720.
Morvai, M., & Molnar~ Perl, I. (1990). Simultaneous determination of organic acids and sugars in apples by gas~liquid chromatography. Journal of Chromatography, 520,201-207.
82
Naidu, B. (1998). Separation of sugars, polyols, proline analogues and betaines in stressed plant extracts by high performance liquid chromatography and quantification by ultra violet detection. Australian Journal of Plant Physiology, 25, 793-800,
Ncvcrauskas, V. P. ( 1988). Response of a Posidoniu community to prolonged reduction in light. 1lquatk Botany, 31, 361~366.
Nojiri. S., Taguchi, N., Oishi, M., & Suzuki, S. (2000). Determination of sugar alcohols in confectiunaries by high~pcrformancc liquid chromatography after nitrobcnzoylation. Journal ofChromarography, 893, 195-200.
Oddo, E., Saiano, f., Alonzo, G., & Bellini, E. (2002). An investigation of the seasonal patterns of mannitol content in deciduous and evergreen species of the Oleaceae growing in northern Sicily. Annals of Botany, 90, 239 ~ 243.
Orth, R. (1999). Settling rates of Posidonia coriacect seeds and Posidonia spp. seedling abundance~ offRottnest Island, Perth, Western Australia. in F. Wells & D. Walker (Eds.), The Seagrass J.7ora SJIUI-Fauna o/Rollnestlsland, Western Australia (pp. 51- 61). Perth: W~ern Australian Museum.
Palinj1, E., van Keulen, M., Phillips, J., & Dyhrberg, R. (200 I). Mechanical seagrass transplantation in Western Australia. Ecological Engineering, /6, 331 ~339.
Pirc, H. (1985). Growth dynamics in Pvsidonia oceanicct (L.) Delih:. Marine Ecology, 6, 141-165,
Pirc, H. ( 1989). Seasonal changes in soluble carbohydrates, starch and energy content in mediterranean seagrasses. Marine Ecology, 10, 97-!05.
Quannby, C., & Allen, S. (1989). Organic constituents. InS. Allen (Ed.), Chemical Analysis of Ecological Materials (pp. 172 - 176). Oxford: Blackwell Scientific.
Robards, K., Haddad, P., & Jackson, P. (1994).1ntroduction and Overview, Prinicples and Pructicc of Modern Chromatographic Method\· (I st ed., pp. I - 34). London: Academic Press Limited.
Ruiz, J., & Romero, J. (2001), Effects of in si/11 experimental shading on the Mediterranean seagrass Posidonia oceanica. Marine Ecology Progress Series, 215, 107-120,
Seddon, S., & Cheshire. A. (200 I). Photosynthetic response of Amphibolis antarctica and Posidonia australis to temperature and desiccation using chlorophyll fluorescence. Marine Ecology Progress Series, 2001, 119-130.
Silberstein, K., Chiffings, A., & McComb, A. ( 1986). The loss of seagrass in Cockburn Sound, Western Australia. III. The effect of epiphytes on productivity of Posidonia cwstralis Hook. F. Aquatic Botany, 24, 355~371.
83
Touchette, B., & Burkholder, J. (2000). Overview of the physiological ecology of carbon metabolism in seagrasses. Journal of Experimental Marine Biology and E,·nlogy, 250, 169-205.
van de Merbel, N.C., Kool, I. M., Lingeman, H., Brinkman, U. A. T., Kolhom, A, & de Rijke, L. C. (1992). On~line monitoring of fermentation processes by ultrafiltration and column liquid chromatography. Chroma/agraphia, 33, 525~ 532.
Woodhead, J., & Bird, K. (1998). Efficient rooting and acclimation ofmicropropagated Ruppia maritima Loisel. Journal of Marine Biotechnology, 6, 152·156.
Young, C. (2002). Evaporative light scattering detection methodology for carbohydrate analysis by HPLC. Cereal Foods World, 47, 14- 16.
84