development of a borehole stress meter for studying ... · development of a borehole stress meter...
TRANSCRIPT
Ishii and Asai Earth, Planets and Space (2015) 67:26 DOI 10.1186/s40623-015-0197-z
FULL PAPER Open Access
Development of a borehole stress meter forstudying earthquake predictions and rockmechanics, and stress seismograms of the 2011Tohoku earthquake (M 9.0)Hiroshi Ishii* and Yasuhiro Asai
Abstract
Although precursory signs of an earthquake can occur before the event, it is difficult to observe such signs withprecision, especially on earth’s surface where artificial noise and other factors complicate signal detection. Onepossible solution to this problem is to install monitoring instruments into the deep bedrock where earthquakesare likely to begin. When evaluating earthquake occurrence, it is necessary to elucidate the processes of stressaccumulation in a medium and then release as a fault (crack) is generated, and to do so, the stress must beobserved continuously. However, continuous observations of stress have not been implemented yet for earthquakemonitoring programs. Strain is a secondary physical quantity whose variation varies depending on the elasticcoefficient of the medium, and it can yield potentially valuable information as well. This article describes thedevelopment of a borehole stress meter that is capable of recording both continuous stress and strain at a depthof about 1 km. Specifically, this paper introduces the design principles of the stress meter as well as its actualstructure. It also describes a newly developed calibration procedure and the results obtained to date for stress andstrain studies of deep boreholes at three locations in Japan. To show examples of the observations, records of stressseismic waveforms generated by the 2011 Tohoku earthquake (M 9.0) are presented. The results demonstrate thatthe stress meter data have sufficient precision and reliability.
Keywords: Development of borehole stress meter; Continuous observations of stress and strain; Earthquakeprediction; Calibration system; 2011 Tohoku earthquake (M 9.0); Stress-water pressure seismograms
BackgroundObserving precursory phenomena of earthquakes is difficult;however, a case in which precursory fluctuations in strainand inclination were actually observed does exist, althoughthe observations were discovered after the earthquake. Thiscase was related to the swarm earthquakes that often occurin the Izu Peninsula, which is located approximately100 km southwest of Tokyo (Ishii et al. 1998; Okada et al.2000; Ishii et al. 2002). The eastern part of the Izu Peninsulais being uplifted at an annual rate of about 2 cm/year. Oneof the borehole meters that we developed is installed in adeep borehole in the eastern Izu Peninsula. This meter
* Correspondence: [email protected] Research Institute of Earthquake Science (TRIES), Association for theDevelopment of Earthquake Prediction (ADEP), 1-63 Yamanouchi Akiyo-cho,Mizunami City, Gifu Prefecture 509-6132, Japan
© 2015 Ishii and Asai; licensee Springer. This isAttribution License (http://creativecommons.orin any medium, provided the original work is p
recorded precursory inclination and strain fluctuationsbefore the occurrence of the swarm earthquakes. Itwas discovered that the precursory phenomena wereindicative of tectonic effects and that multi-componentobservations in deep boreholes is an effective techniquefor evaluating earthquake occurrences.Several types of strain observation meters are used in
boreholes. To date, volumetric strain meters (Sacks et al.1971) have been installed at more than 30 locations in theKanto and Tokai regions by the Japan MeteorologicalAgency. This type of meter can be used to observechanges in volumetric strain only. The principle of themeter is to convert the movement of silicone oil sealedinside a cylindrical vessel into changes in strain. Sakata(1981) developed a three-component strain meter byapplying a Sacks-like principle. These meters are sensitive
an Open Access article distributed under the terms of the Creative Commonsg/licenses/by/4.0), which permits unrestricted use, distribution, and reproductionroperly credited.

Ishii and Asai Earth, Planets and Space (2015) 67:26 Page 2 of 15
to temperature changes as the silicone oil is sealedinside the container. Gladwin (1984) developed athree-component strain meter based on the principleof measuring changes in the diameter of a cylindricalvessel by using a capacitance conversion sensor.Ishii et al. (1997a, 2002) developed a strain meter that
had improved sensitivity as a result of mechanicallyexpanding the deformation of the cylindrical vessel. Wehave developed a comprehensive borehole crustal activityobservation device (comprehensive observation device)equipped with strain meters and also tiltmeters, seismom-eters, and other components that are all co-located in oneborehole container. We developed this comprehensivedevice because we think it is important to obtain as muchinformation as possible to further advance the field ofearthquake prediction research.The comprehensive observation device developed by
our institute has been adopted for use by the JapanMeteorological Agency, the National Institute of AdvancedIndustrial Science and Technology, and others. Suchdevices are installed in many deep boreholes and are beingused to accumulate data. Strain was being analyzed fromobservational records of the strain meter at the Byobusanborehole observation point (depth of 1,020 m), which ismanaged by the Tono Research Institute of EarthquakeScience when the Kii Peninsula earthquake (M 7.1and M 7.4) occurred in the southeastern offshore on5 September 2004 (Okubo et al. 2004; Asai et al. 2005)and when the Sumatra-Andaman earthquake (M 9.1)occurred on 26 December 2004 (Okubo et al. 2005).Crustal deformations concurrent with deep low-frequencytremors have also been observed with the strain metersinstalled in the deep boreholes, and additional strainanalysis studies are being conducted (Itaba et al. 2010).The Tohoku earthquake (M 9.0) occurred on 11
March 2011, and there are a number of excellent studiesabout the earthquake (e.g., Nishimura et al. 2011;Yoshida et al. 2011). Outcomes regarding strain seismicmotions and crustal deformations concurrent with the2011 Tohoku earthquake (M 9.0) have been deliveredfrom observational data of meters installed at many deepborehole observation points (Itaba et al. 2011). Resultshave also been reported based on observations fromstress meters installed at deep borehole observationpoints (Ishii and Asai 2011).However, if we want to study earthquake occurrences
comprehensively, it would be best to examine the pro-cesses of stress accumulation and subsequent release asa fault is generated. It is assumed that earthquakes occurwhen the stress applied at the fault surface exceedsfrictional strength. Thus, the final objective in earthquakeprediction research is to monitor the stress distributionand fault strength in earthquake-prone areas over timeand space (Ishii et al. 1997b; Iio 2009).
At present, stress measurements are conducted usinghydraulic fracturing, stress release methods, and soforth. However, these can only be used to determine thestress value at the point of measurement and cannotbe used for continuous observations (Sano 2005).Consequently, we developed a meter capable of con-tinuously observing the stress change. This stress metercan observe strain as well as stress. This article describesthe stress meter system and reports case examples ofobservational results.
MethodsPrinciple and design of the stress meterAt present, the borehole-type strain meters developed byIshii et al. (2002) are installed for earthquake predictionresearch at many deep borehole observation sites inJapan. Borehole-type strain meters detect fluctuations inthe strain of bedrock (extension and contraction of thebedrock) continuously over long periods of time afterthey are set within a borehole and integrated with thebedrock by expansible grout with an expansion coefficientof about 0.15%. With conventional technology, strain inthe bedrock is detected based on the deformation in thecylindrical case.The most important factor to be measured when
observing the elastoplastic deformation of bedrock forearthquake prediction research is stress, which is directlyrelated to the occurrence of earthquakes. However,conventional technology detects strain in bedrock, andthe only way to obtain the continuous changes in stress isto calculate these based on continuous observations ofbedrock strain through complex operations using thepre-measured elastic coefficient for the bedrock. Thatis, stress in bedrock can be obtained only indirectlyusing conventional technology. To date, no equipmentthat can directly and continuously detect both stress andstrain in bedrock independently over a long period of timehas been developed.The stress meter that we have developed is capable of
detecting both stress and strain. It is comprised of apillar-shaped case and a pressure-receiving system withtwo pressure-receiving surfaces that are subjected tostress from the bedrock. Figure 1 shows a comparison ofthe outside view between a conventional strain meterand the newly developed stress meter. The stress meterhas two pressure-receiving surfaces that are exposed onthe outer wall of the case, but the strain meter has onlythe cylindrical case.We next compare the internal structures of the stress
meter and strain meter. Figure 2 shows front views ofthe internal parts of the two meters. The strain meter(on the right) has a frame, magnifying device (Ishii et al.2002), displacement sensor, and so forth inside thecylindrical case. Deformation in the cylindrical case causes

Figure 2 Front view of the schematic depiction of the stress meter and strain meter for one component.
Figure 1 Schematic depiction of the stress meter and strain meter from the outside view. The blue ellipses are the pressure-receivingsurfaces that are explained in the text.
Ishii and Asai Earth, Planets and Space (2015) 67:26 Page 3 of 15
Ishii and Asai Earth, Planets and Space (2015) 67:26 Page 4 of 15
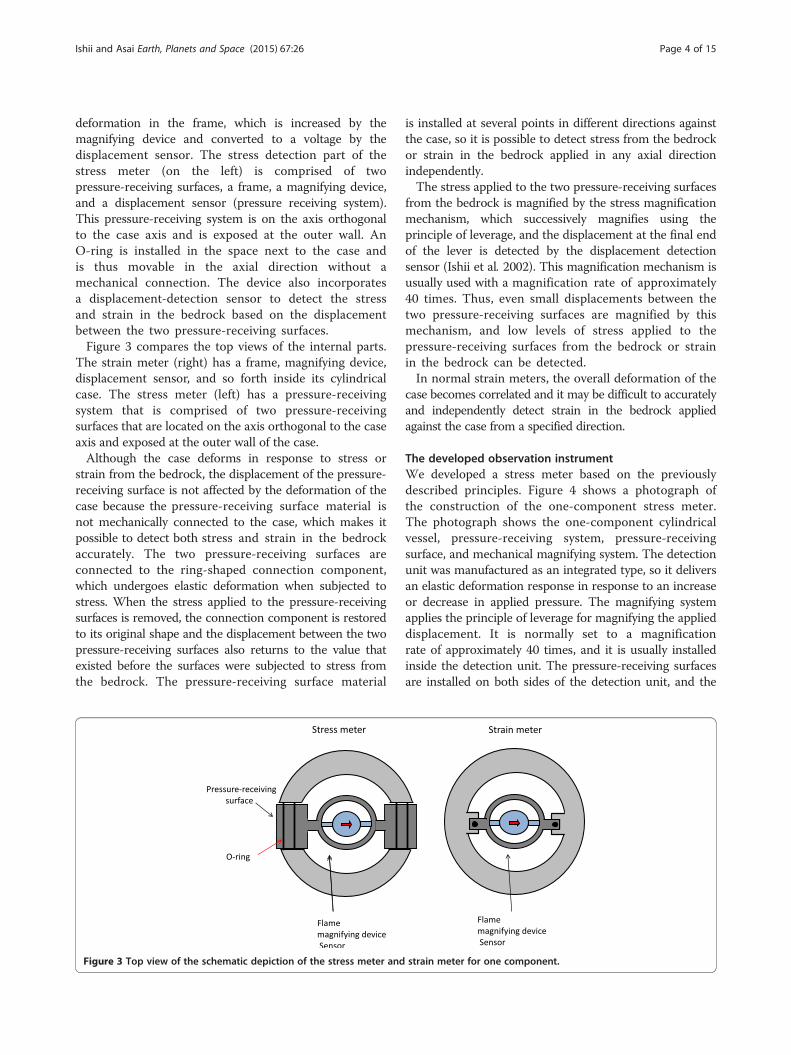
deformation in the frame, which is increased by themagnifying device and converted to a voltage by thedisplacement sensor. The stress detection part of thestress meter (on the left) is comprised of twopressure-receiving surfaces, a frame, a magnifying device,and a displacement sensor (pressure receiving system).This pressure-receiving system is on the axis orthogonalto the case axis and is exposed at the outer wall. AnO-ring is installed in the space next to the case andis thus movable in the axial direction without amechanical connection. The device also incorporatesa displacement-detection sensor to detect the stressand strain in the bedrock based on the displacementbetween the two pressure-receiving surfaces.Figure 3 compares the top views of the internal parts.
The strain meter (right) has a frame, magnifying device,displacement sensor, and so forth inside its cylindricalcase. The stress meter (left) has a pressure-receivingsystem that is comprised of two pressure-receivingsurfaces that are located on the axis orthogonal to the caseaxis and exposed at the outer wall of the case.Although the case deforms in response to stress or
strain from the bedrock, the displacement of the pressure-receiving surface is not affected by the deformation of thecase because the pressure-receiving surface material isnot mechanically connected to the case, which makes itpossible to detect both stress and strain in the bedrockaccurately. The two pressure-receiving surfaces areconnected to the ring-shaped connection component,which undergoes elastic deformation when subjected tostress. When the stress applied to the pressure-receivingsurfaces is removed, the connection component is restoredto its original shape and the displacement between the twopressure-receiving surfaces also returns to the value thatexisted before the surfaces were subjected to stress fromthe bedrock. The pressure-receiving surface material
Figure 3 Top view of the schematic depiction of the stress meter and
is installed at several points in different directions againstthe case, so it is possible to detect stress from the bedrockor strain in the bedrock applied in any axial directionindependently.The stress applied to the two pressure-receiving surfaces
from the bedrock is magnified by the stress magnificationmechanism, which successively magnifies using theprinciple of leverage, and the displacement at the final endof the lever is detected by the displacement detectionsensor (Ishii et al. 2002). This magnification mechanism isusually used with a magnification rate of approximately40 times. Thus, even small displacements between thetwo pressure-receiving surfaces are magnified by thismechanism, and low levels of stress applied to thepressure-receiving surfaces from the bedrock or strainin the bedrock can be detected.In normal strain meters, the overall deformation of the
case becomes correlated and it may be difficult to accuratelyand independently detect strain in the bedrock appliedagainst the case from a specified direction.
The developed observation instrumentWe developed a stress meter based on the previouslydescribed principles. Figure 4 shows a photograph ofthe construction of the one-component stress meter.The photograph shows the one-component cylindricalvessel, pressure-receiving system, pressure-receivingsurface, and mechanical magnifying system. The detectionunit was manufactured as an integrated type, so it deliversan elastic deformation response in response to an increaseor decrease in applied pressure. The magnifying systemapplies the principle of leverage for magnifying the applieddisplacement. It is normally set to a magnificationrate of approximately 40 times, and it is usually installedinside the detection unit. The pressure-receiving surfacesare installed on both sides of the detection unit, and the
strain meter for one component.
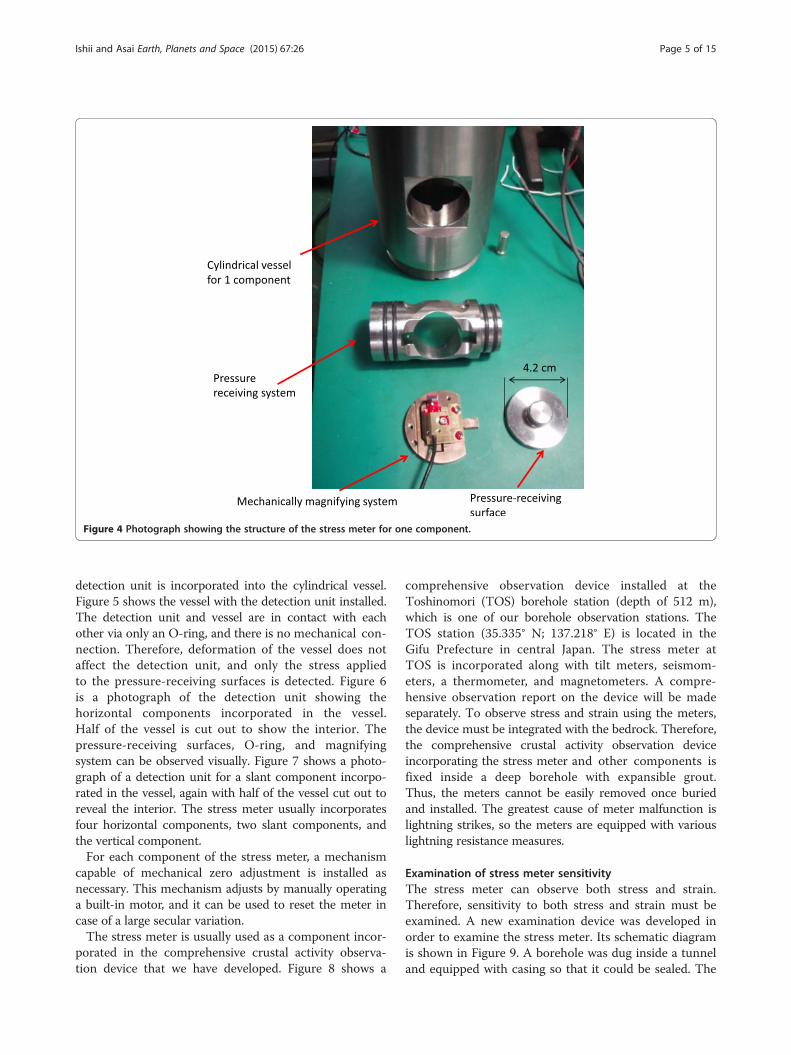
Figure 4 Photograph showing the structure of the stress meter for one component.
Ishii and Asai Earth, Planets and Space (2015) 67:26 Page 5 of 15
detection unit is incorporated into the cylindrical vessel.Figure 5 shows the vessel with the detection unit installed.The detection unit and vessel are in contact with eachother via only an O-ring, and there is no mechanical con-nection. Therefore, deformation of the vessel does notaffect the detection unit, and only the stress appliedto the pressure-receiving surfaces is detected. Figure 6is a photograph of the detection unit showing thehorizontal components incorporated in the vessel.Half of the vessel is cut out to show the interior. Thepressure-receiving surfaces, O-ring, and magnifyingsystem can be observed visually. Figure 7 shows a photo-graph of a detection unit for a slant component incorpo-rated in the vessel, again with half of the vessel cut out toreveal the interior. The stress meter usually incorporatesfour horizontal components, two slant components, andthe vertical component.For each component of the stress meter, a mechanism
capable of mechanical zero adjustment is installed asnecessary. This mechanism adjusts by manually operatinga built-in motor, and it can be used to reset the meter incase of a large secular variation.The stress meter is usually used as a component incor-
porated in the comprehensive crustal activity observa-tion device that we have developed. Figure 8 shows a
comprehensive observation device installed at theToshinomori (TOS) borehole station (depth of 512 m),which is one of our borehole observation stations. TheTOS station (35.335° N; 137.218° E) is located in theGifu Prefecture in central Japan. The stress meter atTOS is incorporated along with tilt meters, seismom-eters, a thermometer, and magnetometers. A compre-hensive observation report on the device will be madeseparately. To observe stress and strain using the meters,the device must be integrated with the bedrock. Therefore,the comprehensive crustal activity observation deviceincorporating the stress meter and other components isfixed inside a deep borehole with expansible grout.Thus, the meters cannot be easily removed once buriedand installed. The greatest cause of meter malfunction islightning strikes, so the meters are equipped with variouslightning resistance measures.
Examination of stress meter sensitivityThe stress meter can observe both stress and strain.Therefore, sensitivity to both stress and strain must beexamined. A new examination device was developed inorder to examine the stress meter. Its schematic diagramis shown in Figure 9. A borehole was dug inside a tunneland equipped with casing so that it could be sealed. The

Figure 5 Outside photograph of one horizontalcomponent vessel.
Figure 6 One horizontal component vessel where the stresssensing unit is installed. Half of the vessel is removed to show theinstallation of the sensing unit.
Ishii and Asai Earth, Planets and Space (2015) 67:26 Page 6 of 15
observation device was inserted into the casing, whichwas then filled with water with the signal cable drawnoutward. The observation device was completely sealed,and the water pressure inside the casing could be variedusing the water pump. The examination device was usedto study the relationship between the given waterpressure and the output voltage. Figure 9 shows thesetup for the method used to calibrate the stress meter.It is common to use water pressure in order to addstress to the instrument because both stress and waterpressure have the same dimension, force/(unit area), andwater is manageable for adding pressure (stress). Thestress detection part of the stress meter is comprised oftwo pressure-receiving surfaces, a frame, a magnifyingdevice, and a displacement sensor (pressure-receivingsystem), as explained in the ‘Principle and design of thestress meter’ subsection. Thus, the applied water pressureis converted into voltage by displacement. Strictly speaking,a stress meter detects displacement due to pressures(stresses) and displacements (strains) applied only to thepressure-receiving surfaces. In this way, we can measure
both rock stress and rock strain changes. Once therelationship between applied pressure and outputvoltage is deduced, the stress sensitivity of the stressmeter can also be deduced. The stress meter to be installedin deep boreholes is usually designed to withstand pressureof about 15 MPa (equivalent to a water column of1,500 m). Figure 10 shows an example of a test result. Onlythe results for the low-sensitivity vertical component of thestress meter are shown. A linear relationship with outputvoltage was measured for the stress range from 0 MPato about 14 MPa. Similar results were obtained for thehorizontal components. The stress sensitivity examination
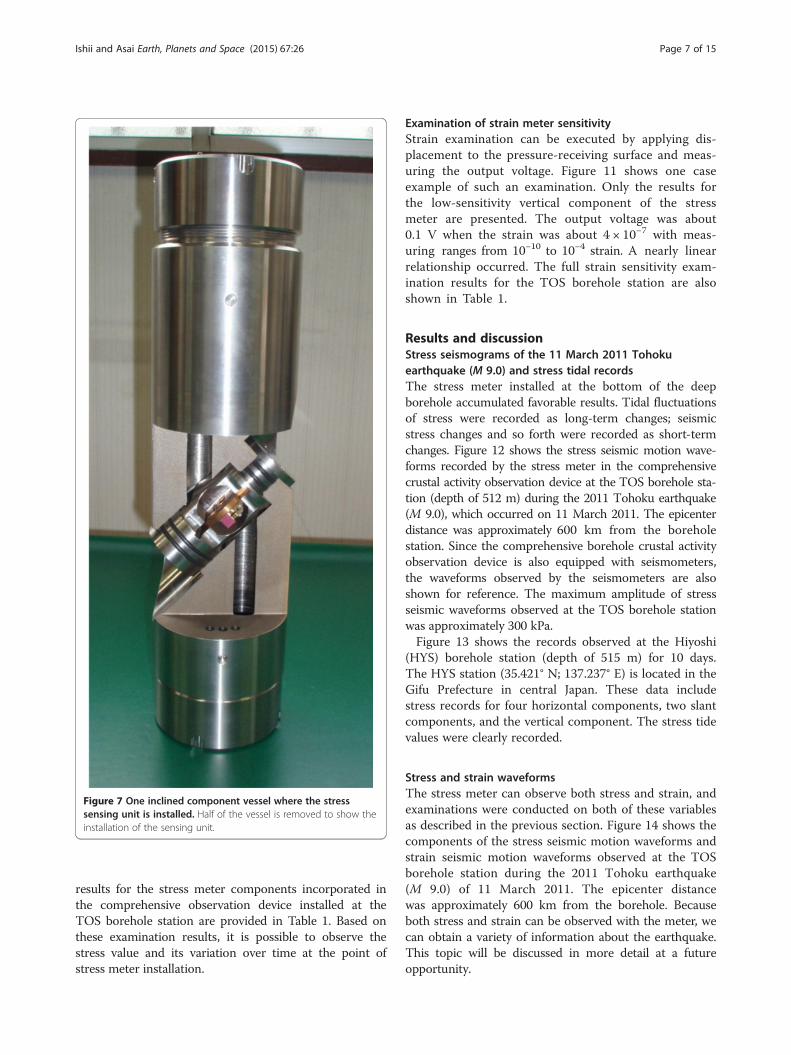
Figure 7 One inclined component vessel where the stresssensing unit is installed. Half of the vessel is removed to show theinstallation of the sensing unit.
Ishii and Asai Earth, Planets and Space (2015) 67:26 Page 7 of 15
results for the stress meter components incorporated inthe comprehensive observation device installed at theTOS borehole station are provided in Table 1. Based onthese examination results, it is possible to observe thestress value and its variation over time at the point ofstress meter installation.
Examination of strain meter sensitivityStrain examination can be executed by applying dis-placement to the pressure-receiving surface and meas-uring the output voltage. Figure 11 shows one caseexample of such an examination. Only the results forthe low-sensitivity vertical component of the stressmeter are presented. The output voltage was about0.1 V when the strain was about 4 × 10⁻⁷ with meas-uring ranges from 10−10 to 10−4 strain. A nearly linearrelationship occurred. The full strain sensitivity exam-ination results for the TOS borehole station are alsoshown in Table 1.
Results and discussionStress seismograms of the 11 March 2011 Tohokuearthquake (M 9.0) and stress tidal recordsThe stress meter installed at the bottom of the deepborehole accumulated favorable results. Tidal fluctuationsof stress were recorded as long-term changes; seismicstress changes and so forth were recorded as short-termchanges. Figure 12 shows the stress seismic motion wave-forms recorded by the stress meter in the comprehensivecrustal activity observation device at the TOS borehole sta-tion (depth of 512 m) during the 2011 Tohoku earthquake(M 9.0), which occurred on 11 March 2011. The epicenterdistance was approximately 600 km from the boreholestation. Since the comprehensive borehole crustal activityobservation device is also equipped with seismometers,the waveforms observed by the seismometers are alsoshown for reference. The maximum amplitude of stressseismic waveforms observed at the TOS borehole stationwas approximately 300 kPa.Figure 13 shows the records observed at the Hiyoshi
(HYS) borehole station (depth of 515 m) for 10 days.The HYS station (35.421° N; 137.237° E) is located in theGifu Prefecture in central Japan. These data includestress records for four horizontal components, two slantcomponents, and the vertical component. The stress tidevalues were clearly recorded.
Stress and strain waveformsThe stress meter can observe both stress and strain, andexaminations were conducted on both of these variablesas described in the previous section. Figure 14 shows thecomponents of the stress seismic motion waveforms andstrain seismic motion waveforms observed at the TOSborehole station during the 2011 Tohoku earthquake(M 9.0) of 11 March 2011. The epicenter distancewas approximately 600 km from the borehole. Becauseboth stress and strain can be observed with the meter, wecan obtain a variety of information about the earthquake.This topic will be discussed in more detail at a futureopportunity.

Figure 8 Multi-component borehole instrument. The instrument is equipped with stress meters, being installed in the Toshinomori (TOS)borehole station at a depth of 512 m. HSR, horizontal stress meter.
Ishii and Asai Earth, Planets and Space (2015) 67:26 Page 8 of 15

Figure 9 Schematic depiction of the calibration system of the stress meter.
Ishii and Asai Earth, Planets and Space (2015) 67:26 Page 9 of 15
Comparison of stress seismic motion with water pressureseismic motionAlthough the sensitivity of the stress meter has beenexamined, we made a comparison against data observedusing a water pressure meter to confirm the reliability.This was done with one of the several borehole stationswhere stress meters are installed along with water pressuremeters (STG200 borehole station; Figure 15). The STG200station (N35.379° E; 137.240° N) is located in the GifuPrefecture in central Japan. Although the arrangementis presented schematically, the bedrock is consideredto be a poroelastic body. A borehole with a diameterof approximately 15 cm and depth of 20 m was duginside a tunnel located 200 m beneath the ground,and the stress meter was installed at the bottom of
Figure 10 An example calibration showing the relationshipbetween the applied water pressure and output voltage for thestress meter.
the borehole and fixed to the surrounding bedrockusing expansible grout. The casing in the borehole has ahole in the middle through which water can pass. Withthis arrangement, the borehole is filled with waterand the water starts spilling because of water pressure. Acommercial water pressure meter was also installed in theborehole, and the opening was sealed.The waveforms recorded by the water pressure meter
and stress meter in the STG200 borehole station werethen compared. Figure 16 shows the stress seismicwaveforms and water pressure seismic waveforms for the2011 Tohoku earthquake (M 9.0). The red line indicatesstress seismic waveforms for the vertical component, andthe black line indicates the water pressure seismic wave-forms. It is evident from the graph that the stress seismicwaveforms and the water pressure seismic waveformsmatched very well, including the small changes from thepoint of wave arrival to the succeeding waves. The good
Table 1 Calibration table for both stress and strain ofthe meter
Stress (MPa) = −A × output (V) + B
HSR1 HSR2 HSR3 HSR4 VSRH VSRL
A 0.575 0.447 0.512 0.514 0.253 4.06
B 12.9 12.9 12.7 12.9 12.9 3.51
Strain = A × output (V) × 10−5 + B × 10−7
HSR1 HSR2 HSR3 HSR4 VSRH VSRL
A 2.94 2.73 2.77 2.80 3.29 32.2
B 1.51 −6.4 10.1 10.3 1.41 66.1
The meters equipped in multi-component borehole instrument are installed inthe Toshinomori (TOS) station at a depth of 512 m. HSR1 to HSR4: horizontalcomponents. VSRH: vertical component with high sensitivity, VSRL: verticalcomponent with low sensitivity.

Figure 11 An example calibration showing the relationshipbetween the strain and output voltage for the stress meter.
Ishii and Asai Earth, Planets and Space (2015) 67:26 Page 10 of 15
match of waveforms from the different meters indicatesthat the signals were recorded properly by both meters. Al-though both meters recorded the timing of pressurechanges precisely, there were some differences in the ampli-tude of the signals. Specifically, the amplitude for the verti-cal stress meter was approximately twice as large as that ofthe water pressure meter. We assumed that this representsthe behavior of a poroelastic body in which the water pres-sure fluctuations that occur are due to fluctuations in bed-rock stress.
Stress changes caused by spring waterSpring water was generated by boring work approximately300 m from the water pressure meter (Figure 15). The rateof generation was approximately 200 L/min. The waterpressure and vertical stress component varied radically inconcurrence with this, as shown in Figure 17. It is thoughtthat a water vein connects the 300-m point and the obser-vation point and that the changes appeared as a drop inwater pressure as a result of the spring water runoff as wellas extensional changes in the vertical stress component.The values of both were nearly equal. In this case, it was as-sumed that the changes in the vertical stress, which wererecorded as changes in bedrock stress, were caused bychanges in water pressure. The stress meter has been exam-ined for water pressure sensitivity, as described previously.The fact that the vertical stress component reflected thesame values as the water pressure changes shows that thesensitivity examination was conducted properly for thestress meter and that the changes in bedrock stress werefaithfully recorded without the effects of boring. Many suchobservation examples exist, and these all indicate the sameresult.Case examples of a comparison between vertical stress
seismic motion and water pressure seismic motion aswell as concurrent changes with spring water wereshown above. The structure of the meter is identical forboth the horizontal stress component and the vertical
stress component. Based on these results, it can be sur-mised that the stress meter properly records changes instress. The reliability of the horizontal stress componentcan be examined by calculating the invariant for stress.This matter will be discussed in a different report.
Considerations on the reliability of the developed stressmeterHere, we briefly describe the installation method of theborehole stress meter before discussing its reliability. Theinstrument is fixed inside a deep borehole with expansiblegrout. A rock sample of predetermined depth is extractedby overcoring before installing the instrument. Then, theborehole is examined to see if there are any cracks orwater paths. If there are any, a deeper borehole is dug.Finally, the instrument is installed in uniform bedrock.We will conduct the following tasks hereafter to inves-
tigate the reliability of the stress meter:
1. Check if the observed stress data satisfy the elasticinvariants.
2. Perform a comparison between the observed stresstidal variation and theoretical tidal variation.
3. Perform a comparison between the observed stresswaveform for the Tohoku earthquake and thetheoretical stress waveform.
According to our preliminary investigation, we haveobtained good results, and we will soon submit a morecomprehensive paper on the reliability of the meter.Here, we just present data on the reliability of the devel-oped stress meter that are clear at the present moment.Only the pressure-receiving system of the stress meter
detects stress and strain. We will now describe the rea-son why the cylindrical case does not affect the detec-tion. The system is composed of two pressure-receivingsurfaces, a frame, a magnifying device, and a displacementsensor. This pressure-receiving system is on the axis or-thogonal to the case axis, and it is exposed at the outerwall. The system is thus movable in the axial directionwithout a mechanical connection as an O-ring is installedin the space next to the case. The device also incorporatesa displacement detection sensor to detect stress and strainin the bedrock based on the displacement between thetwo pressure-receiving surfaces. Therefore, the cylindricalcase does not at all affect the detection of stress and strain.The pressure-receiving system only contributes to the de-tection of stress and strain. The device detects pressures(stresses) and displacements (strains) applied only to thepressure-receiving surfaces.In conventional strain meters, the overall deformation
of the case caused by cracks, water paths, and so on be-comes correlated, and it may be difficult to accuratelyand independently detect strain in the bedrock applied
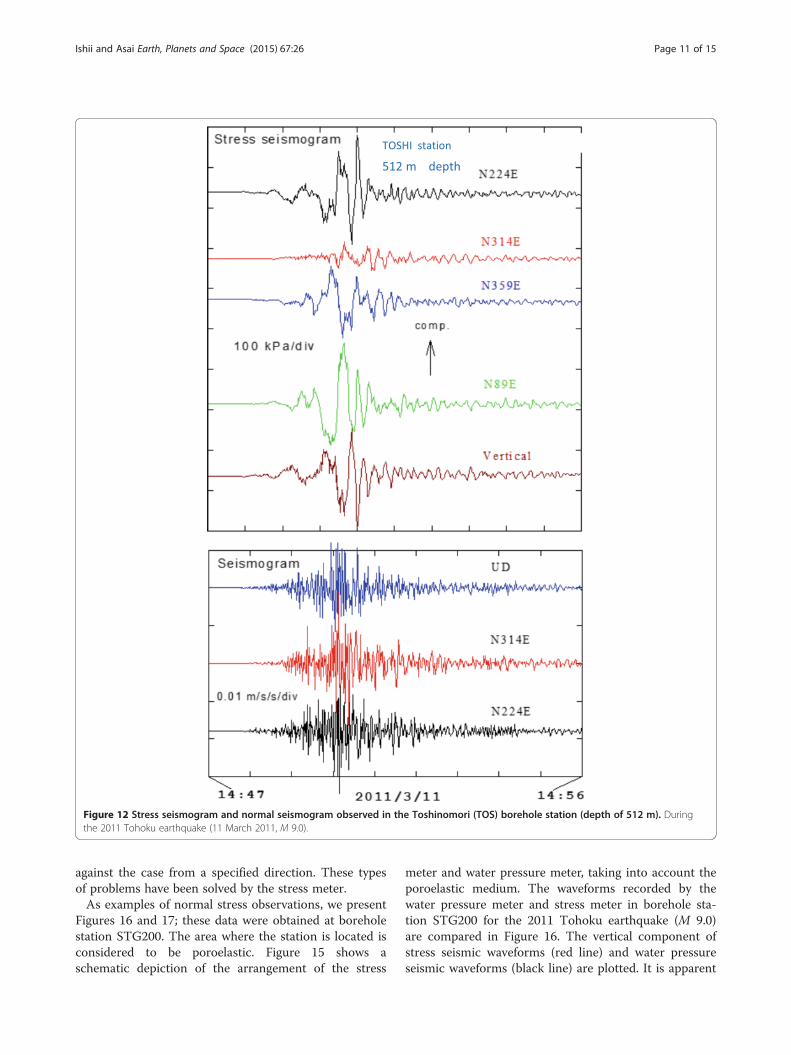
Figure 12 Stress seismogram and normal seismogram observed in the Toshinomori (TOS) borehole station (depth of 512 m). Duringthe 2011 Tohoku earthquake (11 March 2011, M 9.0).
Ishii and Asai Earth, Planets and Space (2015) 67:26 Page 11 of 15
against the case from a specified direction. These typesof problems have been solved by the stress meter.As examples of normal stress observations, we present
Figures 16 and 17; these data were obtained at boreholestation STG200. The area where the station is located isconsidered to be poroelastic. Figure 15 shows aschematic depiction of the arrangement of the stress
meter and water pressure meter, taking into account theporoelastic medium. The waveforms recorded by thewater pressure meter and stress meter in borehole sta-tion STG200 for the 2011 Tohoku earthquake (M 9.0)are compared in Figure 16. The vertical component ofstress seismic waveforms (red line) and water pressureseismic waveforms (black line) are plotted. It is apparent
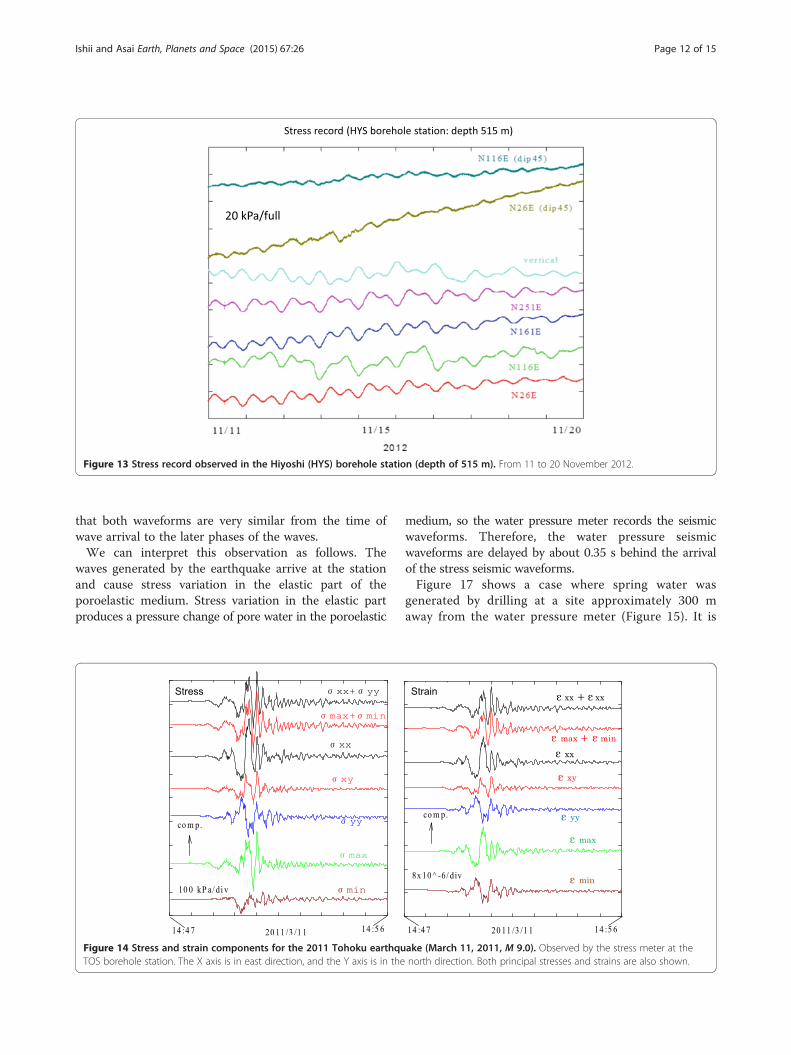
Figure 13 Stress record observed in the Hiyoshi (HYS) borehole station (depth of 515 m). From 11 to 20 November 2012.
Ishii and Asai Earth, Planets and Space (2015) 67:26 Page 12 of 15
that both waveforms are very similar from the time ofwave arrival to the later phases of the waves.We can interpret this observation as follows. The
waves generated by the earthquake arrive at the stationand cause stress variation in the elastic part of theporoelastic medium. Stress variation in the elastic partproduces a pressure change of pore water in the poroelastic
Figure 14 Stress and strain components for the 2011 Tohoku earthquTOS borehole station. The X axis is in east direction, and the Y axis is in the
medium, so the water pressure meter records the seismicwaveforms. Therefore, the water pressure seismicwaveforms are delayed by about 0.35 s behind the arrivalof the stress seismic waveforms.Figure 17 shows a case where spring water was
generated by drilling at a site approximately 300 maway from the water pressure meter (Figure 15). It is
ake (March 11, 2011, M 9.0). Observed by the stress meter at thenorth direction. Both principal stresses and strains are also shown.
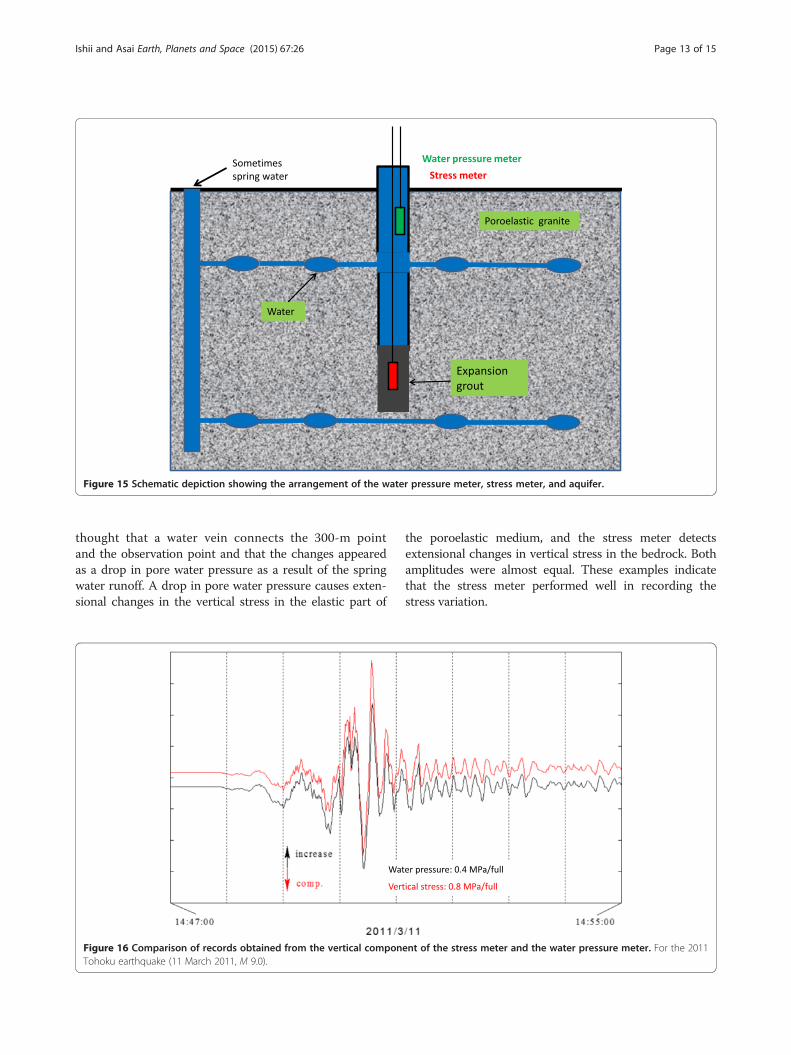
Figure 15 Schematic depiction showing the arrangement of the water pressure meter, stress meter, and aquifer.
Ishii and Asai Earth, Planets and Space (2015) 67:26 Page 13 of 15
thought that a water vein connects the 300-m pointand the observation point and that the changes appearedas a drop in pore water pressure as a result of the springwater runoff. A drop in pore water pressure causes exten-sional changes in the vertical stress in the elastic part of
Figure 16 Comparison of records obtained from the vertical componTohoku earthquake (11 March 2011, M 9.0).
the poroelastic medium, and the stress meter detectsextensional changes in vertical stress in the bedrock. Bothamplitudes were almost equal. These examples indicatethat the stress meter performed well in recording thestress variation.
ent of the stress meter and the water pressure meter. For the 2011

Figure 17 Comparison of records obtained from the stress meter and the water pressure meter. For spring water at a distance of about300 m away. A portion of the abrupt change in stress is superimposed on the pressure change curve to show the similarities.
Ishii and Asai Earth, Planets and Space (2015) 67:26 Page 14 of 15
There are two deep borehole stations, TOS andHYS, in addition to borehole station STG200 that areequipped with the stress meter. There are also sixborehole stations equipped with conventional strainmeters. The tidal strain variations observed at thesesites by the stress meters are similar to the tidal vari-ations observed by conventional strain meters. Theseobservations also indicate that the stress meters areperforming well.Based on the discussions above, we believe that the
stress meters are performing well in recording bothstress and strain variations.
ConclusionsAlthough we believe that precursory signs of anearthquake can occur before the event, it is difficultto observe such evidence with precision. This is especiallythe case when observations are made on the earth’ssurface, where the precursory signals of earthquakescan be disturbed by artificial noise and other factors. Onepossible solution to this problem is to make observationswith meters installed in the deep bedrock whereearthquakes occur.If continuous observational data can be obtained for
stress, we gain access to new information that previ-ously could not be obtained for studying earthquakeoccurrence and mechanisms and further advances inearthquake research can be expected. However, noinstrument capable of continuous observations of stresshad been developed. We therefore developed a new
borehole stress meter capable of continuous observa-tions of stress change. This stress meter can recordcontinuous observational data for both stress and strain.This report introduced the design principles for
the stress meter and showed the results of sensitivityexaminations for stress and strain. At present, suchmeters are installed and accumulating data in deepboreholes at three observation sites. We also studied thereliability of the stress meter that we manufactured.Favorable correspondence in the data was found
during comparisons of stress meter data and waterpressure meter data. As a case example, stress seismicwaveforms generated by the 2011 Tohoku earthquakewere presented. The results showed that the stress meterthat we have developed delivers data with sufficientprecision and reliability.
Competing interestsThe authors declare that they have no competing interests.
Authors’ contributionsHI designed this study, analyzed the data, and wrote the manuscript. YAworked on the installation and maintenance of the instruments and helpedwith the interpretation of the data. Both authors read and approved the finalmanuscript.
AcknowledgementsThe authors thank Mr. Hideo Sugaya of Techno Sugaya Co., Ltd. fordiscussions and comments in regard to developing the stress meter. We alsothank Mr. Shigeo Matsumoto for providing useful suggestions throughoutthe development and installation process. Lastly, we are grateful to theMACOME Corporation, Sumiko Resources Exploration Development Co. Ltd.,and System Giden Co. Ltd. for their cooperation and support.
Ishii and Asai Earth, Planets and Space (2015) 67:26 Page 15 of 15
Received: 21 August 2014 Accepted: 26 January 2015
ReferencesAsai Y, Okubo M, Ishii H, Aoki H, Yamauchi T, Kitagawa Y, Koizumi N (2005)
Co-seismic strain-steps associated with the 2004 off the Kii peninsulaearthquakes - observed with Ishii-type borehole strainmeters and quartz-tubeextensometers. Earth Planets Space 57:309–314
Gladwin MT (1984) High-precision multicomponent borehole deformationmonitoring. Rev Sci Instrum 55:2011–2016
Iio Y (2009) Why inland earthquakes happen? Kinmirai company, Nagoya,Japan, pp 1–174 (in Japanese)
Ishii H, Asai Y (2011) Development of borehole stress meter and observed stressdata, Poster presentation at: European Geosciences Union, General Assembly,Wien, Austria
Ishii H, Yamauchi T, Kusumoto F (1997a) Development of high sensitivityborehole strain meters and application for rock mechanics and earthquakeprediction study. In: Rock Stress. Balkema, The Netherlands, pp 253–258
Ishii H, Chen G, Ohnishi Y (1997b) Estimation of far-field stresses from boreholestrain meter observations. In: Rock Stress. Balkema, The Netherlands,pp 259–264
Ishii H, Nakao S, Matsumoto S, Hirata Y (1998) Precursory crustal movementsobserved by multi-component borehole instrument in the case ofearthquake swarms off east coast of Izu peninsula. In: Proceedings ofContinuous Crustal Movement Observation in Deep Underground.,pp 47–51, in Japanese
Ishii H, Yamauchi T, Matsumoto S, Hirata Y, Nakao S (2002) Development ofmulti-component borehole instrument for earthquake prediction study: someobserved example of precursory and co-seismic phenomena relating toearthquake swarms and application of the instrument for rock mechanics.Seismogenic Process Monitoring, Balkema, The Netherlands, pp 365–377
Itaba S, Koizumi N, Matsumoto N, Ohtani R (2010) Continuous observation ofgroundwater and crustal deformation for forecasting Tonankai and Nankaiearthquakes in Japan. Pure Appl Geophys 167:1105–1114,Doi:10.1007/s00024-010-0095-z
Itaba S, Matsumoto N, Kitagawa Y, Koizumi N (2011) Strain changes after the2011 off the Pacific coast of Tohoku earthquake (Mw 9.0) observed by adistant borehole strainmeter array. Poster presented at the 2011 Europeangeosciences union, general assembly, Wien, Austria, 8 April 2011
Nishimura T, Munekane H, Yarai H (2011) The 2011 off the Pacific coast ofTohoku Earthquake and its aftershocks observed by GEONET. Earth PlanetsSpace 63:631–636
Okada Y, Yamamoto E, Ohkubo T (2000) Coswarm and preswarm crustaldeformation in the eastern Izu Peninsula, central Japan. J Geophys Res105:681–692
Okubo M, Asai Y, Ishii H (2004) The seismological and geodetical roles of strainseismogram suggested from the 2004 off the Kii peninsula earthquakes.Earth Planets Space 57:303–308
Okubo M, Asai Y, Ishii H, Aoki H (2005) Thousand kilometers breaking of the 2004Sumatra earthquake proved by dynamic strain analysis. Rep Tono ResInstitute of Earthquake Sci 16:81–83
Sacks IS, Suyehiro S, Evertson DW, Yamagishi Y (1971) Sacks-Evertson strain meter,its installation in Japan and some preliminary information concerning strainsteps. Papers Meteoro Geophys 22:195–208
Sakata S (1981) On the concept of some newly-invented borehole three-componentstrainmeters. Rep Nat Res Center Disaster Prev 25:95–126 (in Japanese withEnglish abstract)
Sano O (2005) Measurement methods of contemporary stress field and rockmechanics. J Geogr 114(6):1003–1021 (in Japanese with English abstract)
Yoshida Y, Ueno H, Muto D, Aoki S (2011) Source process of the 2011 off thePacific coast of Tohoku Earthquake with the combination of teleseismic andstrong motion data. Earth Planets Space 63:565–569
Submit your manuscript to a journal and benefi t from:
7 Convenient online submission
7 Rigorous peer review
7 Immediate publication on acceptance
7 Open access: articles freely available online
7 High visibility within the fi eld
7 Retaining the copyright to your article
Submit your next manuscript at 7 springeropen.com