development appraisal report - national house building …€¦ · · 2016-05-19development...
TRANSCRIPT
Development Appraisal Report
Kenton Road
Harrow London
Report date: 10 March 2009
Prepared for ABC Developers
Site grid reference lon=517960,lat=188972
Report reference
sar_20081216_DB_161208_1

Kenton Road, Harrow, London ABC Developers – 10 March 2009
© Hometrack Data Systems - Report ref: 105/052008 Page 2 of 25
Contents Page
1. Executive Summary 3
2. Catchment area 4
3. Site context maps 5-7
4. Overview of active developments 8
5. Active sites with reported sales 9
6. Mix of housing on active sites 11
7. New build sales prices 12
8. New build sales prices per sq ft 13
9. Prices and sales volumes in the local re-sale market 14
10. Profile of existing housing supply 16
11. Education and communications in local area 18
12. Profile of demand in local area 19
Notes 21
Data Sources 22
Terms and Conditions for the Site Appraisal Report 23 Important note Use of this Site Appraisal Report is subject to the terms and conditions of the Licence under which it is was provided, which specifically limit its use to the party that originally ordered it from NHBC. The contents of the Site Appraisal Report are protected by copyright. You may not modify, copy, reproduce, republish or distribute, by any means or in any manner the Site Appraisal Report or any part thereof.
Information contained within this Site Appraisal Report is provided on an "as is" basis and is for general purposes and guidance only. The recipient acknowledges that the Site Appraisal Report is provided without the benefit of inspection of any sites or properties. The nature of the information sources used to compile this document are such that they will not be free from errors and information compiled on an historic basis will have aged by the time of its inclusion. Neither NHBC nor Hometrack warrant that a Site Appraisal Report will be suitable for any particular purpose, even if a particular intended purpose has been made know by you to NHBC or Hometrack.
It is the recipient's sole responsibility to assess the accuracy, completeness, usefulness, suitability and fitness for purpose of all information and data provided within the Site Appraisal Report. Users are advised to seek appropriate independent professional advice and to seek independent verification of the accuracy and completeness of each relevant item of information contained within a Site Appraisal Report before making any decisions based on that information. To the fullest extent permissible by applicable law, other than as expressly set out in the Customer Sales Terms, neither NHBC nor Hometrack make any express or implied warranties, representations or endorsements whatsoever with regard to the Site Appraisal Report.

Kenton Road, Harrow, London ABC Developers ± 10 March 2009
© Hometrack Data Systems - Report ref: 105/052008 Page 3 of 25
1. Executive Summary This report provides an insight into the key trends in the residential development and re-sale markets around a specific site. The analysis compares trends between two carefully defined catchment areas, one ‘local’ and one ‘wider’ which are described more fully overleaf. New development market
• There are 3 active development sites with a total of 149 units within the local catchment area and 10 sites with 430 units within the wider area. 1% of units in the local area are under construction.
• 79% of units being built in the wider area are 2 bed flats.
Pricing of new build property
• The average selling price of new property on active developments across the wider area is £219,500 for flats and £335,100 for terraced houses.
• Based on these average sales prices, typical prices per square foot are £354psf for 1 bed flats, £344psf for 2 bed flats, £391psf for 2 bed houses, £318psf for 3 bed houses and £276psf for 4 bed houses.
• Over the last 12 months the average price of a new house has risen by 12.5% compared to a rise of 7.5% for new flats.
Pricing and turnover in re-sale market
• There were 886 property sales in the local area over the last 12 months. Most residential sales (370) were in the £300 - £400k price band. There were 679 sales over £250k
• New build sales recorded by the Land Registry in the local area accounted for 8.6% of all
property sales over the last 12 months. Flats accounted for the majority (98.7%) of all new build sales over this period.
The profile of existing housing supply
• Semi Detached property accounts for 60.5% of existing housing in the local area. • New build sales over the last 12 months have added 0.1% to supply of private housing in the
local area. Education and communications
• The nearest train station is Kenton Station (0.9 miles away), whilst the nearest motorway junction is 2.9 miles away. There are 3 secondary schools, and 3 primary schools 1.4 km of the site.
Profile of demand
• There are 22,148 households in the local area. Half these households are the in the top two categories for affluence. The largest group in the catchment area are affluent young singles that represent 9% of households, the next largest are young singles who are in the comfortable wealth bracket and who represent 7% of households.
Kenton Road, Harrow, London ABC Developers ± 10 March 2009
© Hometrack Data Systems - Report ref: 105/052008 Page 4 of 25
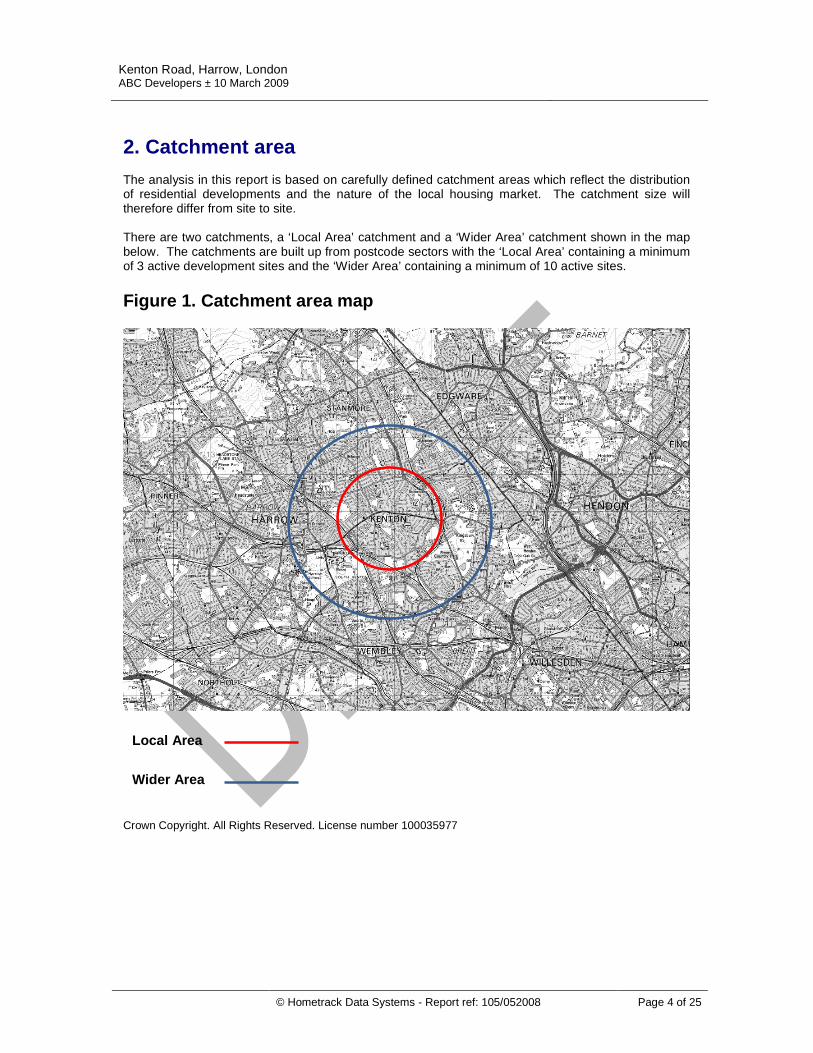
2. Catchment area The analysis in this report is based on carefully defined catchment areas which reflect the distribution of residential developments and the nature of the local housing market. The catchment size will therefore differ from site to site. There are two catchments, a ‘Local Area’ catchment and a ‘Wider Area’ catchment shown in the map below. The catchments are built up from postcode sectors with the ‘Local Area’ containing a minimum of 3 active development sites and the ‘Wider Area’ containing a minimum of 10 active sites. Figure 1. Catchment area map
Crown Copyright. All Rights Reserved. License number 100035977
Local Area
Wider Area

Kenton Road, Harrow, London ABC Developers ± 10 March 2009
© Hometrack Data Systems - Report ref: 105/052008 Page 5 of 25
3. Site context maps Figure 2. Local area map
Crown Copyright. All Rights Reserved. License number 100035977

Kenton Road, Harrow, London ABC Developers ± 10 March 2009
© Hometrack Data Systems - Report ref: 105/052008 Page 6 of 25
Figure 3. Aerial map of site
Copyright. Get Mapping ref: 03663783
Kenton Road, Harrow, London ABC Developers ± 10 March 2009
© Hometrack Data Systems - Report ref: 105/052008 Page 7 of 25
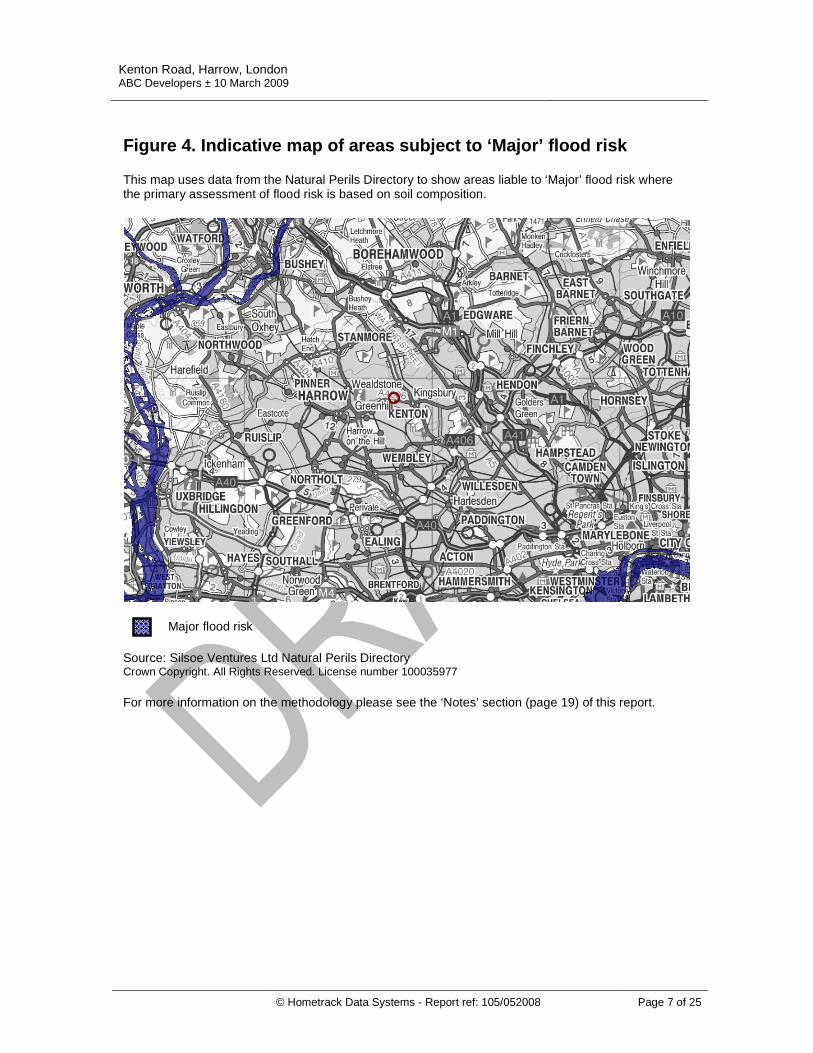
Figure 4. Indicative map of areas subject to ‘Major’ flood risk This map uses data from the Natural Perils Directory to show areas liable to ‘Major’ flood risk where the primary assessment of flood risk is based on soil composition.
Major flood risk Source: Silsoe Ventures Ltd Natural Perils Directory Crown Copyright. All Rights Reserved. License number 100035977
For more information on the methodology please see the ‘Notes’ section (page 19) of this report.

Kenton Road, Harrow, London ABC Developers ± 10 March 2009
© Hometrack Data Systems - Report ref: 105/052008 Page 8 of 25
4. Overview of active and recently completed developments This section summaries the profile of active residential developments within the two catchment areas where the NHBC are providing new home warranty on the development.. Active sites are defined as those with 5 or more units and where more than 5% of the overall scheme is still under construction In summary
• There are 3 active developments in the local area containing 149 units of which 2 (1.3%) are still under construction. The average size of these developments is 50 units.
• Across the wider area there are 10 active developments containing a total of 430 units of
which 40 (9.3%) are still under construction. The average size of these developments is 43 units.
• Across the wider area there are 2 developments with more than 91 units, which are registered as “East Lane, HA0 3” and ”Former Bacs Site, HA8 5QA”.
• The remaining 2 developments with no registered sales contain 37 units and sales price data
is not yet available for these units. Table 1. Profile of active developments
Sites Local Area Wider Area
Total no. sites 3 10
Average size of all sites 50 43
Size range of all sites 26 to 92 10 to 189
Total no. units on all sites 149 430
% units completed 99% 91%
Units yet to be sold 15 100
Source: NHBC Note: A ‘completed unit’ is a plot in the NHBC registrations dataset with a ‘finalled’ date which is the final stage of the NHBC inspection process and effectively represents the point at which the unit is ready for occupation. If a unit does not have a ‘finalled’ date, it is regarded as being ‘uncompleted’. Properties defined as ‘Yet to be sold’ are those where there is no ‘legal completion date’ listed in the NHBC dataset’

Kenton Road, Harrow, London ABC Developers ± 10 March 2009
© Hometrack Data Systems - Report ref: 105/052008 Page 9 of 25
5. Active and recently completed sites with reported sales The following tables set out an overview of the 8 active developments for which there is recorded sales data. The number of these sites will vary according to the location of the site and the nature of the surrounding development market. The scheme start date reflects the date the policy was registered with the NHBC. Site 1 - East Lane, HA0 3
Number of units 189
% houses / % flats 1% / 99%
Price Range (Achieved) £157000 - £230000
Scheme start date March 2003
Number of units legally completed 162
Site 2 - Former Bacs Site, HA8 5QA
Number of units 92
% houses / % flats 30% / 70%
Price Range (Achieved) £190000 - £399950
Scheme start date January 2005
Number of units legally completed 88
Site 3 - 381 Kenton Road, HA3 0XS
Number of units 31
% houses / % flats 0% / 100%
Price Range (Achieved) £190000 - £331000
Scheme start date January 2003
Number of units legally completed 29
Site 4 - Wembley, HA3 0QH
Number of units 26
% houses / % flats 0% / 100%
Price Range (Achieved) £181950 - £276000
Scheme start date December 2005
Number of units legally completed 17 Site 5 - Columbia Works, HA8 5DQ
Number of units 16
% houses / % flats 0% / 100%
Price Range (Achieved) £167000 - £325000
Scheme start date November 2004
Number of units legally completed 8
Kenton Road, Harrow, London ABC Developers ± 10 March 2009
© Hometrack Data Systems - Report ref: 105/052008 Page 10 of 25
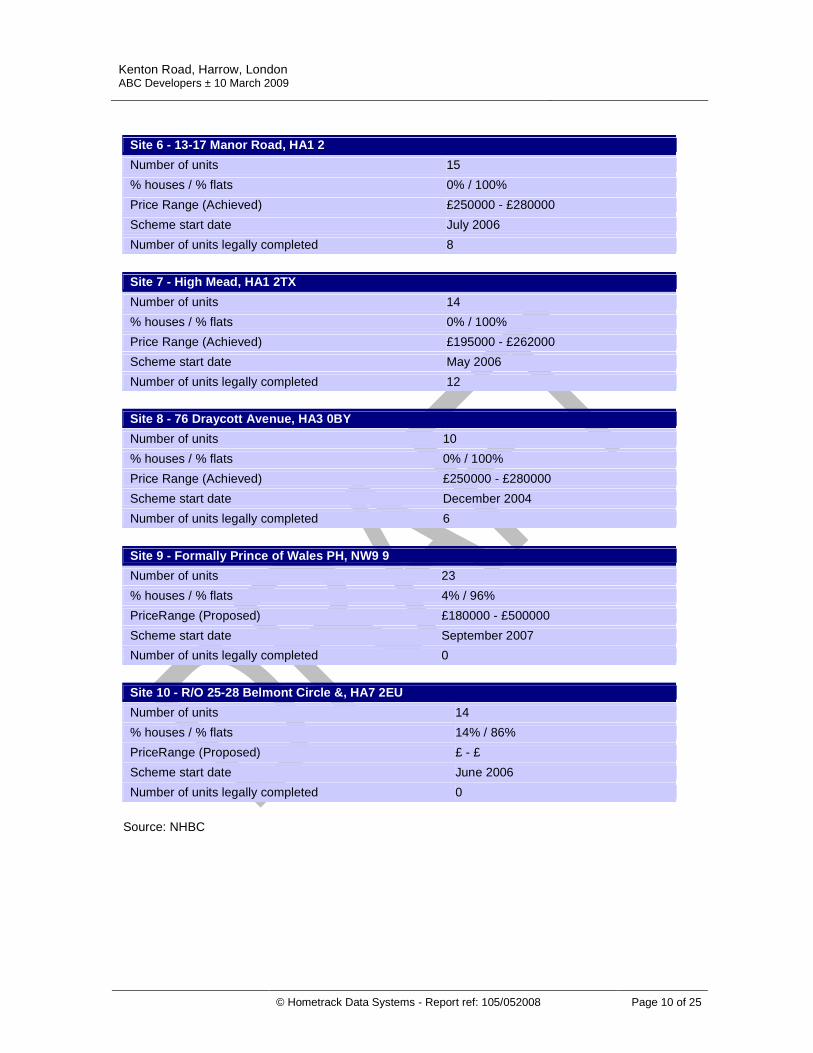
Site 6 - 13-17 Manor Road, HA1 2
Number of units 15
% houses / % flats 0% / 100%
Price Range (Achieved) £250000 - £280000
Scheme start date July 2006
Number of units legally completed 8
Site 7 - High Mead, HA1 2TX
Number of units 14
% houses / % flats 0% / 100%
Price Range (Achieved) £195000 - £262000
Scheme start date May 2006
Number of units legally completed 12
Site 8 - 76 Draycott Avenue, HA3 0BY
Number of units 10
% houses / % flats 0% / 100%
Price Range (Achieved) £250000 - £280000
Scheme start date December 2004
Number of units legally completed 6
Site 9 - Formally Prince of Wales PH, NW9 9
Number of units 23
% houses / % flats 4% / 96%
PriceRange (Proposed) £180000 - £500000
Scheme start date September 2007
Number of units legally completed 0
Site 10 - R/O 25-28 Belmont Circle &, HA7 2EU
Number of units 14
% houses / % flats 14% / 86%
PriceRange (Proposed) £ - £
Scheme start date June 2006
Number of units legally completed 0
Source: NHBC

Kenton Road, Harrow, London ABC Developers ± 10 March 2009
© Hometrack Data Systems - Report ref: 105/052008 Page 11 of 25
6. Mix of housing on active sites This section sets out a summary of the mix of units being developed in the catchment. Table 2 displays the profile of units that are yet to be sold (including those which are yet to be built). Tables 3 and 4 set out the mix of housing being developed on all sites - both under construction and completed within the last 2 years. Table 2. Mix of units ‘yet to be sold’ on active sites – by headline type Mix of units Local Area Wider Area
Number % Number %
Bungalow 0 0.0% 0 0.0%
Detached House 0 0.0% 5 2.9%
Semi Detached House 0 0.0% 4 2.3%
Terraced House 18 25.0% 33 19.0%
Flat / Maisonettes 54 75.0% 132 75.9% This table shows the profile of units on active sites which do not have a ‘legal completion’ date Source: NHBC Table 3. Mix of all housing on active sites – headline property type Mix of units - type Local Area Wider Area Difference
Bungalow 0.0% 0.0% 0.0%
Detached 0.0% 1.0% 0.0%
Semi Detached 0.0% 0.8% 0.0%
Terraced 19.5% 11.6% 8.0%
Flats 80.5% 85.5% -5.0% Source: NHBC Table 4. Mix of all housing on active sites - overall type and size Mix of units – bed count Local Area Wider Area Difference
Studio 0.0% 0.0% 0.0%
1 bed flat 20.2% 14.6% 5.7%
2 bed flat 64.7% 78.5% -13.8%
2 bed house 0.6% 0.5% 0.1%
3 bed house 5.8% 2.6% 3.2%
4 + bed house 8.7% 3.8% 4.8% Source: NHBC

Kenton Road, Harrow, London ABC Developers ± 10 March 2009
© Hometrack Data Systems - Report ref: 105/052008 Page 12 of 25
7. New build sales prices The tables below set out an analysis of actual sales prices for all completions in the catchment area over the last 12 months. The price data relates to achieved prices as recorded by a solicitor rather than asking prices. Table 5. Selling price by property type – active sites Property type Local Area Wider Area Difference
Bungalow - - -
Detached - - -
Semi Detached - - -
Terraced £340,100 £335,100 1%
Flats £234,900 £219,500 7% Source: NHBC Table 6. Current selling price by housing type and size – active sites House type and size Local Area Wider Area Difference
Studio - - -
1 bed flat £213,100 £194,500 10%
2 bed flat £241,100 £223,700 8%
2 bed house £375,000 £293,500 28%
3 bed house £301,900 £301,900 0%
4 bed house £359,100 £359,100 0% Source: NHBC Table 7. Ranges of current selling price by housing type and size – active sites House type and size Local Area Wider Area
Low High Low High
Studio - - - -
1 bed flat £167,000 £325,000 £157,000 £325,000
2 bed flat £181,950 £331,000 £159,000 £331,000
2 bed house £375,000 £375,000 £212,000 £375,000
3 bed house £285,000 £375,000 £285,000 £375,000
4 bed house £328,000 £399,950 £328,000 £399,950 Source: NHBC

Kenton Road, Harrow, London ABC Developers ± 10 March 2009
© Hometrack Data Systems - Report ref: 105/052008 Page 13 of 25
8. New build sales prices per sq ft The table below uses the average selling price of new build property across the wider area (as listed in table 6) to provide an indication of equivalent £psf prices for a range of unit sizes. The figures in bold cover the broad size ranges for different property types. Table 8. Average sales prices by property type expressed in terms of £psf
Size sq ft Studio 1 bed flat 2 bed flat 2 bed house 3 bed house 4 bed house
Ave. price - £194,453 £223,728 £293,500 £301,869 £359,136
400 - £486 £559 £734 £755 £898
450 - £432 £497 £652 £671 £798
500 - £389 £447 £587 £604 £718 550 - £354 £407 £534 £549 £653 600 - £324 £373 £489 £503 £599
650 - £299 £344 £452 £464 £553
700 - £278 £320 £419 £431 £513
750 - £259 £298 £391 £402 £479
800 - £243 £280 £367 £377 £449
850 - £229 £263 £345 £355 £423
900 - £216 £249 £326 £335 £399
950 - £205 £236 £309 £318 £378
1000 - £194 £224 £294 £302 £359
1050 - £185 £213 £280 £287 £342
1100 - £177 £203 £267 £274 £326
1150 - £169 £195 £255 £262 £312
1200 - £162 £186 £245 £252 £299
1250 - £156 £179 £235 £241 £287
1300 - £150 £172 £226 £232 £276
1350 - £144 £166 £217 £224 £266
1400 - £139 £160 £210 £216 £257 Source: NHBC / Hometrack

Kenton Road, Harrow, London ABC Developers ± 10 March 2009
© Hometrack Data Systems - Report ref: 105/052008 Page 14 of 25
9. Prices and sales volumes in the local re-sale market This section sets out key trends in prices and sales volumes in the re-sale market as it is important to benchmark proposed developments against the existing re-sale market. Resale prices are derived from Land Registry transaction prices blended with data from mortgage valuations from Hometrack. In the local area re-sale market:
• The average price of all property sold in the last 12 months is £339,400 (for new and resale properties) based on sales and valuations.
• The average price of a flat is £216,500 while the average price of a house is £386,900. • There were 886 sales over the last 12 months, 2% were flats and 98% were houses. • Most residential sales (370) were in the £300 - £400k price band. There were 679 sales over
£250k • New build sales recorded by the Land Registry accounted for 8.6% of all sales over the last 12
months. Flats accounted for the majority (98.7%) of all new build sales. Figure 5. Average re-sale prices in the local area by property type and size
£0
£50,000
£100,000
£150,000
£200,000
£250,000
£300,000
£350,000
£400,000
£450,000
1 bed flat 2 bed flat 2 bed house 3 bed house 4 bed house
Q4-06 Q1-07 Q2-07 Q3-07 Q4-07 Q1-08
Source: Hometrack

Kenton Road, Harrow, London ABC Developers ± 10 March 2009
© Hometrack Data Systems - Report ref: 105/052008 Page 15 of 25
Figure 6. Current new build & re-sale prices by bed count & type – wider area
£0
£50,000
£100,000
£150,000
£200,000
£250,000
£300,000
£350,000
£400,000
1 bed flat 2 bed flat 2 bed house 3 bed house 4 bed house
Re-Sale New Build
Source: NHBC / Hometrack Table 9. Sales volumes by price band and type in the local area – last 12 months
Flats Terraced Other houses
New Re-sale New Re-sale New Re-sale
<£100k 0 2 0 0 0 0
£100 - £150k 6 11 0 0 0 0
£150 - £200k 3 63 0 0 0 0
£200 - £250k 1 87 0 27 0 7
£250 - £300k 65 12 0 39 0 39
£300 - £400k 0 7 1 59 0 303
£400 - £500k 0 0 0 8 0 87
£500 - £750k 0 0 0 4 0 42
£750k+ 0 0 0 0 0 13
Source: Land Registry / Hometrack

Kenton Road, Harrow, London ABC Developers ± 10 March 2009
© Hometrack Data Systems - Report ref: 105/052008 Page 16 of 25
10. Profile of existing housing supply When evaluating a site, it is important to know the profile of the stock that already exists in the area. This section sets out the profile of housing stock by tenure, type and bedroom count in the catchment areas. In the local area:
• There are 31,624 dwellings.
• 74% of housing is owner occupied while 14% is privately rented.
• Semi Detached properties account for 60.5% of housing supply
• 4 bed houses are the dominant housing type accounting for 38.2% of all housing stock.
• New build sales over the last 12 months added 0.1% to the supply of private housing in the local area.
Figure 7. Profile of housing tenure
0%
10%
20%
30%
40%
50%
60%
70%
80%
Owned Private Rented Social Rented
Local Area Wider Area
Source: Office for National Statistics, Census 2001 Note: ‘Owned’ includes properties held with a mortgage and owned outright. ‘Private rented’ includes properties rented from a private landlord or an employer and those living rent-free. Social rented properties include those owned by Local Authorities and Registered Social Landlords.

Kenton Road, Harrow, London ABC Developers ± 10 March 2009
© Hometrack Data Systems - Report ref: 105/052008 Page 17 of 25
Figure 8. Mix of existing housing supply by headline type
0%
10%
20%
30%
40%
50%
60%
70%
Terrace Semi Detached Detached Flat
Local Area Wider Area
Source: Office for National Statistics, Census 2001
Figure 9. Mix of existing housing supply by type and bedroom count
0%
5%
10%
15%
20%
25%
30%
35%
40%
45%
1 bed flat 2 bed flat 2 bed house 3 bed house 4 bed house Other
Local Area Wider Area
Source: Hometrack/ Office for National Statistics, Census 2001

Kenton Road, Harrow, London ABC Developers ± 10 March 2009
© Hometrack Data Systems - Report ref: 105/052008 Page 18 of 25
11. Education and communications in local area
This section sets out a summary of the proximity of the site to local communication points and schools including the latest educational attainment statistics. Table 10. Communications
Type Name Distance (1)
Motorway junctions M1 J2 2.9 miles
Airports London Heathrow Airport 10.3 miles
Bus stops 6 bus stops within 500m of site
Local train services Kenton Station 0.9 miles
Metro/light rail - -
Underground Queensbury 10.4 miles Source: Ordnance Survey 1 All distances are given ‘as the crow flies’. Table 11. Nearest primary schools and performance
Name Miles Maths Science English Value added (2)
Uxendon Manor Primary School 0.3 miles 68% 80% 88% 99.3 Glebe First and Middle School 0.3 miles 72% 93% 84% 100.7 St Bernadette's Roman Catholic Primary School 0.4 miles 93% 98% 97% 101.7
UK average 78% 89% 81% 100.0 Source: Department for Children, Schools and Families 2 Value added score compares achievement at Key Stage 2 with Key Stage 1. See notes for more details. Where results are (PRI), school is private and does not submit results. Table 12. Nearest secondary schools and performance
Name Miles %A*-C %A*-G Any passes
Value added (3)
Claremont High School 0.3 miles 74% 97% 99% 986.4 St Gregory Roman Catholic High School 0.4 miles 58% 94% 97% 975.8 Jfs 0.9 miles 88% 99% 100% 1045.2 UK average 67% 94% 98% 1001.4 Source: Department for Children, Schools and Families 3
Value added score compares achievement at GCSE with Key Stage 2. See notes for more details
Kenton Road, Harrow, London ABC Developers ± 10 March 2009
© Hometrack Data Systems - Report ref: 105/052008 Page 19 of 25
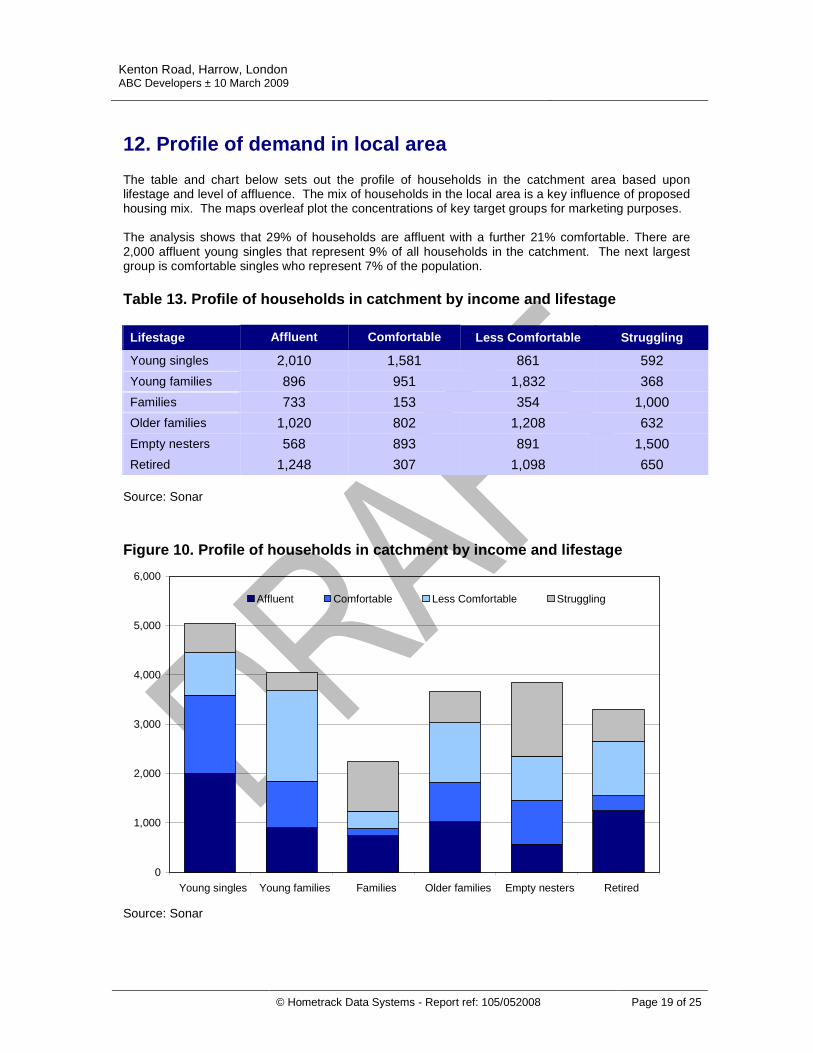
12. Profile of demand in local area The table and chart below sets out the profile of households in the catchment area based upon lifestage and level of affluence. The mix of households in the local area is a key influence of proposed housing mix. The maps overleaf plot the concentrations of key target groups for marketing purposes. The analysis shows that 29% of households are affluent with a further 21% comfortable. There are 2,000 affluent young singles that represent 9% of all households in the catchment. The next largest group is comfortable singles who represent 7% of the population. Table 13. Profile of households in catchment by income and lifestage Lifestage Affluent Comfortable Less Comfortable Struggling
Young singles 2,010 1,581 861 592
Young families 896 951 1,832 368
Families 733 153 354 1,000
Older families 1,020 802 1,208 632
Empty nesters 568 893 891 1,500
Retired 1,248 307 1,098 650 Source: Sonar
Figure 10. Profile of households in catchment by income and lifestage
0
1,000
2,000
3,000
4,000
5,000
6,000
Young singles Young families Families Older families Empty nesters Retired
Affluent Comfortable Less Comfortable Struggling
Source: Sonar

Kenton Road, Harrow, London ABC Developers ± 10 March 2009
© Hometrack Data Systems - Report ref: 105/052008 Page 20 of 25
Figure 11. Location of young singles in affluent and comfortable segments
Figure 12. Location of families in affluent and comfortable segments
Kenton Road, Harrow, London ABC Developers ± 10 March 2009
© Hometrack Data Systems - Report ref: 105/052008 Page 21 of 25
Notes Figure 4. Indicative map of areas subject to ‘Major’ flood risk (page 7) The Natural Perils Directory™ (NPD) comprises a detailed assessment of the environmental vulnerabilities to building structures from the soil related subsidence, flood, and wind exposure perils currently available within the SVL Natural Perils Information System. This data uniquely identifies the soil type in each 100m x 100m block of land in England, Wales and Scotland (excluding the Isle of Man, Northern Ireland and the Channel Islands). This data is unique to SVL and is the most detailed available for any kind of soil-related risk assessment. One element of the NPD is a flood risk assessment. The inundation of properties by flood water can occur in a number of circumstances. Surface run-off can collect on low-lying land from upslope following heavy rainfall. More commonly rivers, lakes and/or the sea extend beyond their normal limits as a result of prolonged or intense rainfall, unusually high tides and/or extreme wind events. The spatial distribution of such waterborne sediment (or alluvium as defined in soil science) is one basis upon which land that has been subject to historical flooding can be mapped, and this forms a basis for present day flooding risk assessment. Combining soil map units that are dominated by soil series developed in alluvium across Great Britain identifies most of the land that is vulnerable to flooding. The SVL Natural Perils model identifies alluvial land vulnerable to flooding. There are four classes available for Flood risk of which the ‘Major Risk’ category is shown in the map above. Included in the ‘Major Risk’ class are predominately low-lying areas that are vulnerable to inundation by flood waters. Table 11. Primary schools and performance (page 18)
A pupil's value added score is calculated by comparing the KS2 performance with the median KS2 performance of other pupils with the same, or similar, prior attainment at KS1. The median value is the middle value - with half of the pupils having a KS2 average point score below the median and half above the median. A school's value added score is a simple average (arithmetic mean) of the value added measures for all pupils in the school. Schools market (PRI) are private and do not submit results data. Table 12. Secondary schools and performance (page 18)
The student's value added score is based on comparing their capped point score in GCSE (and equivalent) qualifications with the median capped point score of other students with the same or similar prior attainment at Key Stage 2. A school's value added measure is a simple average (arithmetic mean) of the value added scores for all students in the school. In the following example, a mainstream school has 4 students eligible for inclusion in the value added measure with Key Stage 2 and GCSE (and equivalent) average point scores.

Kenton Road, Harrow, London ABC Developers ± 10 March 2009
© Hometrack Data Systems - Report ref: 105/052008 Page 22 of 25
Data sources NHBC – The National House-Building Council hold a database of all new properties registered with them for the purposes on insurance. This dataset accounts for around 85% of all new homes/ dwellings built each year. Hometrack - Hometrack have a significant amount of unique data on house prices and housing market trends which is updated monthly. The resale house price data in site appraisal report is sourced from Hometrack's Realtime Automated Valuation Model (AVM). The Hometrack AVM delivers on-line residential property valuations to the UK mortgage industry. The valuations are created by an advanced computer model built from a database containing over 22 million units of property data. This database is based on surveyor valuations and data on individual property sales from the Land Registry. The database grows every month as new data from the Land Registry and mortgage lenders becomes available. The detailed nature of the data held in the AVM allows for analysis of house prices by type and size of property as well as evidence of price trends at a local level. Land Registry The Land Registry registers title to land in England and Wales and records dealings with registered land (for example, sales and mortgages). As a result it is a primary source of data on house prices and transaction volumes across England and Wales. This site appraisal report uses Land Registry data for comparison of new build and second hand property prices as well as data on transaction levels by area. The Land Registry data is updated quarterly. Office for National Statistics – The ONS deal with data derived from the 2001 Census which provides essential information from national to neighbourhood level for government, business, and the community. In England and Wales, the Census is planned and carried out by the Office for National Statistics. The Census is population based and the most common unit is a person, but there are also bases of people grouped into households. The Census also contains important data on housing with further bases of viewing data including dwellings or communal establishments. The 2001 Census counted people where they were usually resident, with very few exceptions. The vast majority of results are on this usual residence base, although there is data about people based on where they work and where they lived a year before the Census (migration). Ordnance Survey (OS) - An executive agency of the United Kingdom government. It is the national mapping agency for Great Britain, and one of the world's largest producers of maps. All maps contained within the site appraisal report are licensed from the Ordnance Survey. Silsoe Ventures Ltd Natural Perils Directory - Cranfield University's commercial arm, Silsoe Ventures Ltd (SVL), has a unique Natural Perils Directory, which integrates soil, climate and other environmental data, onto the insurance market. The directory has been specifically developed from Cranfield University's National Soil Map which has the highest spatial resolution of any national soil data set.

Kenton Road, Harrow, London ABC Developers ± 10 March 2009
© Hometrack Data Systems - Report ref: 105/052008 Page 23 of 25
Terms and Conditions for the Site Appraisal Report 1. Introduction
1.1. A ‘Site Appraisal Report’ is a document containing information relating to the property markets
in a particular area of the United Kingdom, which is supplied to You by NHBC and produced in collaboration with Hometrack Data Systems Limited ('Hometrack').
1.2. These terms and conditions apply to the provision of Site Appraisal Reports by NHBC SERVICES LIMITED (Company No. 03067703) whose registered office is at Buildmark House, Chiltern Avenue, Amersham, Buckinghamshire HP6 5AP ('NHBC' ) to the person, firm or company ordering the same ('You' and 'Your' shall be construed accordingly).
1.3. Subject to Clause 1.4, the supply of each Site Appraisal Report shall result in the formation of a separate agreement between NHBC and You on the terms and conditions set out herein.
1.4. These terms and conditions are intended for business users of Site Appraisal Reports. If You are not intending to purchase a Site Appraisal Report in the course of a business, please do not accept these terms and conditions. Instead, please refer to NHBC for details of the terms and conditions applicable to non-business users.
1.5. By agreeing indicating Your acceptance of these terms and conditions You agree to be bound by all of the terms and conditions set out herein.
1.6. For each Site Appraisal Report ordered by You, NHBC hereby grants You a non-transferable and non-exclusive right to use the Site Appraisal Report in the course of your ordinary business subject to and in accordance with these terms and conditions for the purpose of Your ordinary business only ('Licence').
1.7. The Licence to use the Site Appraisal Report is not transferable and You agree not to disclose the contents of any Site Appraisal Report to any third party, except for Your professional advisors and only then for the purpose of seeking advice in relation to the content of the Site Appraisal Report.
1.8. The rights granted to You are conditional upon You making fair use of the Site Appraisal Report, fair use meaning use of the Site Appraisal Report in accordance with honest commercial practices to facilitate Your existing business otherwise than in competition with NHBC or Hometrack and/or the provision of Site Appraisal Reports.
1.9. In the event that NHBC believes on reasonable grounds that Your use of the Site Appraisal Reports is not fair use of the Site Appraisal Reports, NHBC may refuse to supply any further Site Appraisal Reports to you and forthwith terminate all agreements for such supply.
1.10. The Licence for each Site Appraisal Report shall terminate automatically in the event that You fail to make payment for the Site Appraisal Report in accordance with these terms and conditions or You breach any of the other terms and conditions herein.
1.11. Termination of a Licence is without prejudice to any rights which NHBC may have, including in particular the right to receive payment under Clause 2.
1.12. NHBC reserves the right to amend these terms and conditions from time to time without notice to You and You agree to be bound by any such changes in respect Site Appraisal Reports ordered by You after amended terms and conditions have been brought to Your attention.
2. Payment Terms 2.1. The price for the supply of a Site Appraisal Report under a Licence shall be the price advised
to You when You place an order with NHBC and is calculated in UK pounds sterling exclusive of UK Valued Added Tax, which shall be payable by You in addition.
2.2. NHBC shall issue an invoice for each Site Appraisal Report supplied and such invoices shall be payable within fourteen (14) days of the date of issue in accordance with the remittance instructions set out in the invoice.
2.3. If any sum payable by You to NHBC is not paid on the due date it shall be paid with interest on the overdue amount calculated at the rate of 4% above Bank of England base lending rate from time to time for the whole period from the date upon which the sum ought to have been paid until the date of payment (whether before or after any judgment).

Kenton Road, Harrow, London ABC Developers ± 10 March 2009
© Hometrack Data Systems - Report ref: 105/052008 Page 24 of 25
3. Contents and use of Site Appraisal Reports
3.1. Most of the information contained within a Site Appraisal Report will be sourced from third
parties that are not affiliated with or otherwise connected with Hometrack or NHBC, except insofar as is necessary to obtain their permission to use their information.
3.2. NHBC and Hometrack collate and publish third party sourced information in Site Appraisal Reports in good faith using reasonable endeavours to ensure that appropriate and reliable information sources are used. However, the nature of the information sources is such that they will not be free from errors and information provided on a periodic or historic basis will have aged by the time of its inclusion in a Site Appraisal Report.
3.3. NHBC and Hometrack do not take steps to verify that individual items of information in a Site Appraisal Report are complete, accurate or up to date.
3.4. All information in a Site Appraisal Report relates to circumstances prevailing at or before the date of production of the Site Appraisal Report and circumstances may change after that date.
3.5. Neither NHBC nor Hometrack warrant or represent that a Site Appraisal Report will be suitable for any particular purpose, even if a particular intended purpose has been made known by You to NHBC or Hometrack.
3.6. Because of the limitations on the content of Site Appraisal Reports as set out in this Clause 3 YOUR ATTENTION IS DRAWN TO THE FOLLOWING : 3.6.1. information contained within a Site Appraisal Report is for general purposes and
information only; 3.6.2. information contained within a Site Appraisal Report does not constitute professional
advice and does not provide a substitute for such advice; 3.6.3. You are advised to seek appropriate independent professional advice and to seek
independent verification of the accuracy and completeness of each relevant item of information contained within a Site Appraisal Report before making any decisions based on that information;
3.6.4. Site Appraisal Reports are provided on an "as is" basis and not for any particular purpose.
4. Liability
4.1. NOTHING IN THESE TERMS AND CONDITIONS SHALL EXCLUDE OR LIMIT LIABILITY
FOR PERSONAL INJURY OR DEATH CAUSED BY NEGLIGENCE, OR FOR FRAUD . 4.2. Any condition, warranty or other term concerning the subject matter of a Site Appraisal Report
which might, but for this Clause, have effect between us or would otherwise be implied or incorporated into these terms and conditions (including, without limitation, implied terms of satisfactory quality and fitness for purpose), whether by statute, common law or otherwise, is hereby excluded.
4.3. Neither NHBC nor Hometrack will be liable to you other than pursuant to the express terms of these terms and conditions.
4.4. In no event will NHBC or Hometrack be liable to you or any other user of the Site Appraisal Report for any loss or damage of any nature whatsoever and howsoever arising (including due to negligence and whether directly or indirectly) out of or in connection with the use of a Site Appraisal Report or its contents, whether due to inaccuracy, error, omission or any other cause and whether on the part of NHBC, Hometrack or any of their servants or agents, or any other person.
4.5. TO THE FULLEST EXTENT PERMITTED BY LAW NEITHER NHBC NOR HOMETRACK WILL BE LIABLE FOR ANY loss of profit, loss of business, loss of revenue, loss or impairment of goodwill, loss or impairment of opportunity, loss of or reduction in anticipated savings, indirect loss or damage, and/or consequential loss or damage.
4.6. Without prejudice to any other exclusion or limitation of liability, for each Site Appraisal Report the aggregate liability of NHBC for any loss and/or damage shall be limited to that proportion as it would be just and equitable for NHBC to pay having regard to: 4.6.1. the extent of NHBC's and/or Hometrack's responsibility for the loss and/or damage; 4.6.2. the role of other parties retained by You to advise You and/or to undertake works or
provide services to You;
4.6.3. any failure by You, howsoever arising, to take appropriate independent professional advice;
4.6.4. any failure by You, howsoever arising to take all possible steps to mitigate any and all losses, costs and expenses incurred as a result of reliance on a Site Appraisal Report.

Kenton Road, Harrow, London ABC Developers ± 10 March 2009
© Hometrack Data Systems - Report ref: 105/052008 Page 25 of 25
4.7. Neither NHBC nor Hometrack shall be liable for any failure to supply a Site Appraisal Report as
a result of the occurrence of any cause whatsoever beyond its reasonable control including (without limitation) failure or outage of the internet, electrical supply or any telecommunications failure or error.
4.8. You shall refer only to NHBC (and not to Hometrack or to individuals engaged by NHBC (including personnel and directors) for redress if You consider that there has been any breach of these terms and conditions or that you have otherwise suffered or incurred any loss or damage as a result of the supply to You of a Site Appraisal Report and You agree not to pursue any claims in contract, tort (including negligence) or for breach of statutory duty against Hometrack or any individuals working for NHBC at any time and You acknowledge that the aforementioned are entitled to enforce this term of these terms and conditions pursuant to the Contracts (Rights of Third Parties) Act 1999.
5. Indemnification You agree to indemnity and hold NHBC and Hometrack and each of our affiliate companies and their officers and employees, harmless from any claim or demand, including reasonable legal fees, made by any third party due to or arising out of your use of the Site Appraisal Report, the breach of these Terms and Conditions by You, or the infringement by You, or any other person, firm or company to whom you allow access to a Site Appraisal Report.
6. Copyright and trademarks
6.1. The contents of the Site Appraisal Report are protected by copyright laws. The owners of the
copyright in the information on the Site Appraisal Report are NHBC, Hometrack and their respective licensors. You may not modify, copy, reproduce, republish, upload, post, transmit or distribute, by any means or in any manner, any material or information contained within a Site Appraisal Report including but not limited to text, graphics and maps unless you have NHBC's prior express written permission to do so. All rights are reserved.
6.2. Product and company names mentioned in the Site Appraisal Report may be the trademarks or trading names of their respective owners, including Hometrack and NHBC.
6.3. NHBC warrants that it is fully entitled to grant the Licence.
7. General 7.1. If at any time any one or more of the provisions of these terms and conditions or any part
thereof is held by any Court or other competent authority to be void or otherwise unenforceable for any reason under applicable law, such provision shall be deemed omitted from these terms and conditions and the validity and/or enforceability of the remaining provisions of these terms and conditions shall not in any way be affected or impaired thereby.
7.2. These terms and conditions contain the entire agreement between You and NHBC with respect to the of each Site Appraisal Report and supersedes all previous arrangements, agreements, representations and understandings with respect thereto.
7.3. These terms and conditions may not be modified except by an instrument in writing signed by the duly authorised representatives of You and NHBC.
7.4. Failure or neglect by NHBC to enforce at any time any of the provisions hereof shall not be construed nor shall be deemed to be a waiver of its rights hereunder nor in any way affect the validity of the whole or any part of these terms and conditions nor prejudice its rights to take subsequent action.
7.5. Subject to Clause 4.8, a person who is not a party to these terms and conditions shall have no right under the Contracts (Rights of Third Parties) Act 1999 to enforce any term of these terms and conditions, but this shall not affect any right or remedy of a third party which exists or is available apart from that Act.
7.6. These terms and conditions, the grant of the Licence and Your use of the Site Appraisal Report are governed by English law.