development and utilization of a customized model for ... and utilization of a ... • provide tools...
TRANSCRIPT

Development and Utilization of a Customized Model for Evaluating Performance of the Calumet, Mainstream and Des Plaines Tunnel and Reservoir Systems
Ann Gray, P.E.Associate Civil Engineer

Areas Served by Combined Sewers
MWRDGC Boundary(872 square miles total)
Chicago City Boundary
Combined Sewer Areas(375 square miles)
WRP’s - 7
N

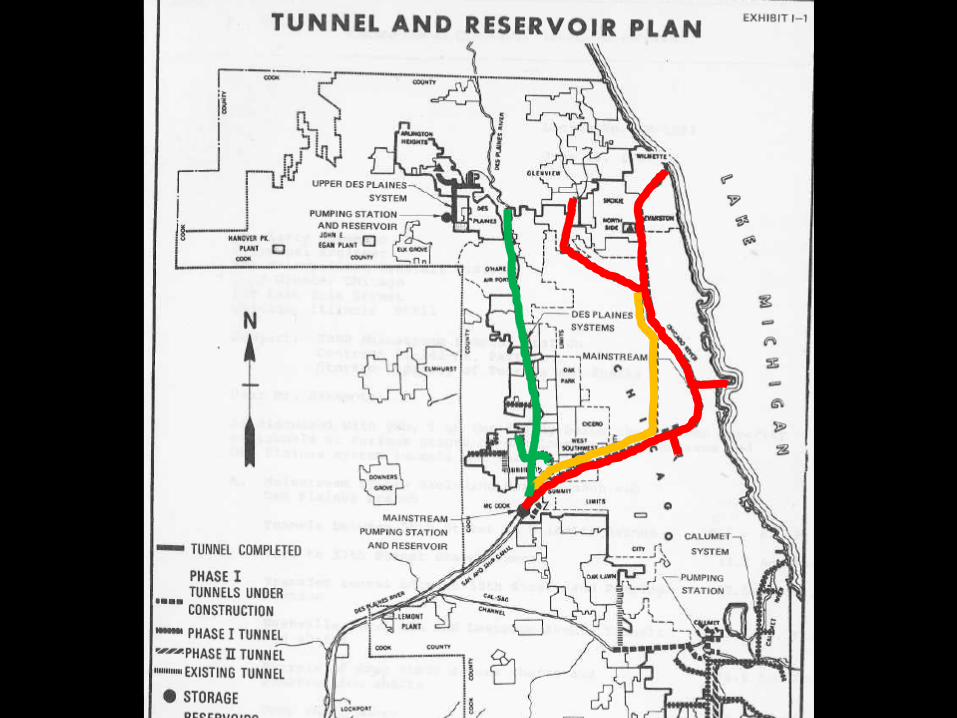
Tunnel and Reservoir Plan (TARP)
Purpose: Intercept Convey StoreReduce

• Phase I (Pollution Control)109 miles of deep tunnels 250 drop shafts600 Surface Connecting
StructuresCompleted in March 2006
• Phase II (Flood Control)3 large reservoirs
• Gloria Alitto Majewski• Thornton Composite• McCook
TARP


What is needed?• Simulate TARP as-built system:
• Overcome limitations of widely used commercial models
• Determine constraints within the system
• Identify physical changes needed
• Allow “what-if” analyses for potential storm scenarios
• Optimize operation of system (revised operation rules)

Role of Universityof Illinois Urbana-Champaign
• Develop a model interface that includes hydrologic and hydraulic models to simulate TARP systems• Capable of simulating design storms, historical storms or
extended continuous simulations (water years)
• Provide tools to facilitate interpretation of simulation results
• Provide a framework so that different models, which reflect different purposes, scales, and levels of complexity, can be consolidated into a single system

TARP ModelMetroflow - User Friendly Model Interface• Developed by University of Illinois Urbana-
Champaign (U of I)• Provides framework that allows different models
to be consolidated into a single system• Includes both hydrologic and hydraulic models


Hydrologic Models
• Illinois Urban Hydrologic Model (IUHM)
• Developed by U of I for each service area outside of the city contributing to drop shafts in TARP
• Designed to simulate the transformation of rainfall to runoff, and the capture and conveyance through combined sewer systems that eventually contributes flow to TARP

Hydrologic Models
• City Model • Utilizes InfoWorks
CS
• IUHM could not be used within city limits
• Also simulates the transformation of rainfall to runoff, and conveyance through combined sewers to TARP

Hydraulic Models• InfoWorks CS-TARP
• Incorporates TARP tunnels and McCook Reservoir
• Simulates unsteady flow and identifies bottlenecks in the TARP system.
• Determines the distribution of flow between TARP drop shafts and combined sewer overflow locations
• Determines volume, duration and frequency of CSO’s

Hydraulic Models
• Illinois Conveyance Analysis Program (ICAP)• Developed by U of I for analysis of the conveyance capacity of
the tunnels and reservoirs
• Allows for filling and dewatering of the tunnels and reservoirs to be simulated over extended periods (water year simulations)
• Designed to identify bottlenecks in the system
• Unable to accurately predict CSO volumes or simulate transient behavior

Hydraulic Models
• Illinois Transient Model (ITM)• Developed by U of I to simulate transient behavior that
may be observed in the TARP system
• Capable of predicting the formation of hydraulic transients and shocks and tracking them through the system
• Not a model used for extended period simulations

Model Development
Physical Inventory
• Foundation for hydraulic models
• Based on construction “as-built” drawings
• Provided a digital description of the physical geometry and hydraulic performance of the systems

Data Collection
• TARP Tunnels
• TARP Drop Shafts
• Connecting Structures
• Control Structures
• Combined Sewer Outfalls
• Thornton Reservoir – Calumet
• McCook Reservoir – Mainstream and Des Plaines

Model Calibration• USGS conducted flow monitoring at several drop shafts
to allow for validation of hydrologic modeling• U of I compared model run results from specific storm
events to the actual flow metering results

Model Assumptions
• Interceptor flowing at capacity at time of the storm• Uses existing District control rules for each TARP
System• Ex: TARP Sluice Gates
• Ability to run models using reservoir or no reservoir scenarios

Model Runs• Design Storms
• 1 Year, 12 Hour• 5 Year, 12 Hour• 10 Year, 24 Hour
• Historical Storms• August 2007• September 2008• February 2009• July 2010
• Water Years• WY 2009• WY 2010• WY 2011

How Long Does it Take to Perform Model Runs?
• IUHM + City Model: 20 Minutes• CS-TARP: 10 Minutes• ICAP: 2 Minutes• ITM: Hours

Model Outputs
• Map Displays to indicate frequency and duration of combined sewer overflows
• Time-Animated Profile Plots of water elevations• Graphs and Tables showing flows and water elevations


Total CSO Volume With and Without McCook Reservoir Online
StormCSO Volume (MG)
No Reservoir Reservoir1 YR/12 HR 1350 181 YR/24 HR 1220 255 YR/12 HR 3050 271
5 YR/24 HR 2630 3910 YR/12 HR 4100 27110 YR/24 HR 3530 39
Aug 2007 1950 30Sept 2008 5000 2060Feb 2009 1050 37July 2010 7050 3550

Patrick JensenAssociate Civil Engineer, P.E.

Outline:
• Purpose• Background on IUHM model• Development of revised model• Results• Project Alternatives• Questions

Purpose: To enhance MWRD’S existing hydrologic model to provide results related to CSO & flood reduction alternatives.

MODEL

Adding Interceptors Improves Model By :
• Links local sewer performance, CSO overflow volume & TARP availability
• Increase confidence in CSO volume & peak flow values
• Better represents flows to WRPs

MODEL
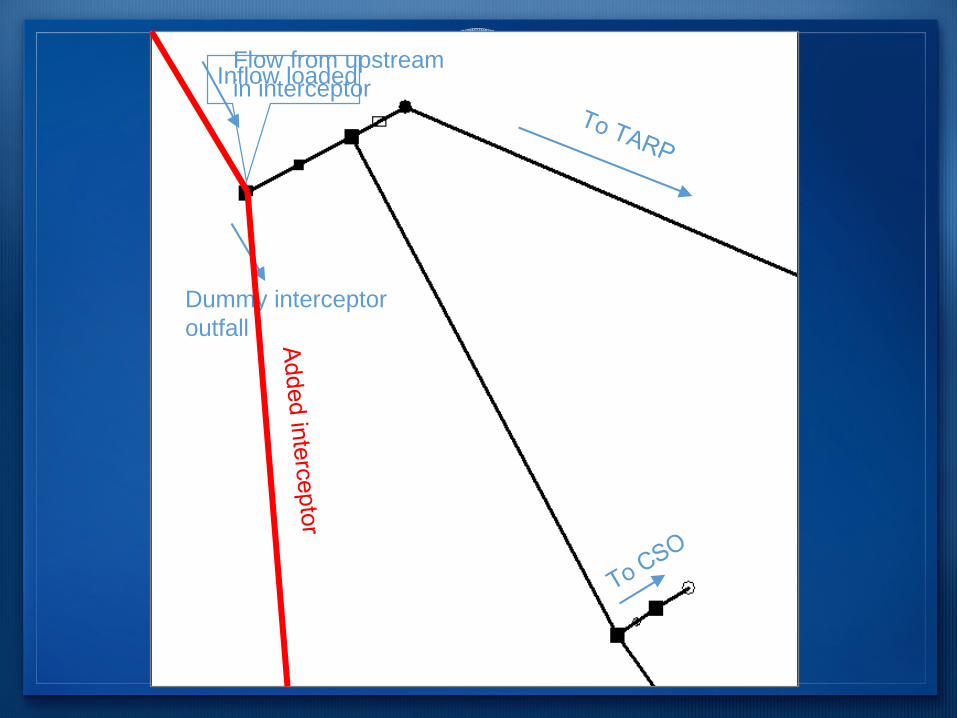
Dummy interceptor outfall
Inflow loadedFlow from upstreamin interceptor

Stickney WRP
O’Brien WRP

= 234 Mi²

MODEL


Flow from upstreamin interceptor

River Level Representation•River level source: U.S. Army of Engineer’s Great Lakes & Mississippi River Interbasin Study (GLMRIS) for a 3-hour duration storm event.
•River level hydrographs applied to all CSOs along Mainstream TARP system.
•No river data available for North Branch or Des Plaines river

CS-TARP
CS-TARP + INT + CITY
CS-TARP + INT + CITY + RIVER
85.3
303.0
Why??
193.9

• Typical Year Rainfall: 35.07 in
• MSDP Service Area: 254.7 mi2
• Runoff Produced: 74 BGal
• ~ 7 full reservoirs of runoff produced annually
CSO Captured by TARP2029 Baseline Conditions with McCook Reservoir
Wet Weather Treatment at WRPs
CSO Captured by TARP
CSO
27%
70%
3%


So What?Comprehensive Model•City of Chicago Sewers•Intercepting Sewers•WRP’s•River Level Boundaries•Connecting Structures•Drop Shafts•Mainstream & Des Plaines Deep Tunnels•McCook Reservoir
•TARP system performance•Quantify
•CSO Frequency•CSO Volume•Flood Risk
•Evaluate potential flood reduction projects

QUESTIONS?