development and use of the copper bioavailability … and use of the copper bioavailability...
TRANSCRIPT

Development and use of the copper bioavailability assessment tool (Draft)
Development and use of the copper bioavailability assessment tool (Draft)
by
Water Framework Directive - United Kingdom Technical Advisory Group (WFD-UKTAG)

Development and use of the copper bioavailability assessment tool (Draft)
ii
Publisher: Water Framework Directive - United Kingdom Technical Advisory
Group (WFD-UKTAG) SNIFFER
25 Greenside Place Edinburgh EH1 3AA Scotland www.wfduk.org
This report is the result of research commissioned and funded by the Environment Agency. © SNIFFER/ENVIRONMENT AGENCY 2012 All rights reserved. No part of this document may be reproduced, stored in a retrieval system or transmitted, in any form or by any means, electronic, mechanical, photocopying, recording or otherwise without the prior permission of SNIFFER/Environment Agency. The views expressed in this document are not necessarily those of the SNIFFER/ENVIRONMENT AGENCY. Its members, servants or agents accept no liability whatsoever for any loss or damage arising from the interpretation or use of the information, or reliance upon views contained herein.
Author(s): Merrington G, Peters A Research performed: 2012 Dissemination Status: Publicly available Keywords: Copper, bioavailability, biotic ligand model, BLM, EQS, freshwater, toxicity Research Contractor: wca environment Ltd, Brunel House, Volunteer Way, Faringdon, Oxfordshire, SN7 7YR 01285 712712 Environment Agency’s Project Manager: Bruce Brown/Lindsey Sturdy, Evidence Directorate Collaborators: Environment Agency Environment Agency Science Project Number: SC080021/8a-a

Development and use of the copper bioavailability assessment tool (Draft) v
Executive Summary A chronic Biotic Ligand Model (BLM) has been developed for Copper (Cu) by the International Copper Association. This model can account for Cu bioavailability in freshwaters and can be used to assess potential aquatic risks. However, it is relatively complicated to use and requires considerable resource and skill to interpret the outputs.
To facilitate the wider use of this tool it is necessary to develop a simplified version of the CuBLM. This project developed a Cu bioavailability assessment tool for use by both the regulated and regulator communities.
The tool mimics the CuBLM, but runs in Microsoft Excel™ and requires data input for site-specific dissolved organic carbon, pH and calcium. The bioavailability assessment tool uses an algorithm and constants which can be readily automated within the laboratory information management systems. The performance of this tool against the original CuBLM is reviewed and discussed.
Bioavailability assessment tools have been developed for other metals (manganese and zinc) and are readily accepted by regulatory organisations. Guidance on the use of the Cu tool and interpretation of the outputs from the tool, including screenshots, is also given.
This report supercedes previous Environment Agency reports on Cu bioavailability assessment tools/screening tools (eg Environment Agency 2009a). The key change between those previous reports and this one is the revision of the calculation process and finalisation of process and terminology.
Finally, an assessment is provided for matched monitoring data from samples and sites in England, Wales and Scotland failing the existing, hardness-based EQS, and using the BAT to account for Cu bioavailability. The results of this assessment show that of these 513 failures over 80% passed when bioavailability was accounted for.


Development and use of the copper bioavailability assessment tool (Draft) v
Contents 1 Introduction ........................................................................................................... 1
1.1 Background ....................................................................................................... 1 1.2 What is a bioavailability assessment tool?......................................................... 2 1.3 Why and where should the bioavailability assessment tool be used? ................ 2
2 The development of the bioavailability assessment tool for copper ................. 5 2.1 Use of the CuBLM ............................................................................................. 5 2.2 Development of the algorithm ........................................................................... 5 2.3 Testing the Cu bioavailability assessment tool .................................................. 5
3 Using the bioavailability assessment tool ......................................................... 11 3.1 Data inputs ...................................................................................................... 11 3.2 What if data for some of the fields are absent? ............................................... 11 3.3 Getting started ................................................................................................ 12 3.4 What do the outputs from the bioavailability tool mean? .................................. 15
3.4.1 Estimated Local EQSdissolved and BioF ....................................................... 15 3.4.2 Bioavailable Cu concentration and risk characterisation ratio ................... 15
4 Assessment of the sites failing the current EQS for copper ............................ 17 4.1 The datasets ................................................................................................... 17 4.2 The results ...................................................................................................... 18
5 Conclusions ......................................................................................................... 21 References ................................................................................................................... 23 Annex 1. Algorithm from the copper bioavailability assessment tool ..................... 24
Table 2.1 Selected physico-chemical characteristic of water samples from Swedish lakes (n=917). ................................................................................................................. 7
Figure 1.1 Flow diagram of the stages of a tiered EQS compliance assessment under the Water Framework Directive (Environment Agency 2009a) ........................................ 3 Figure 2.1 Cu HC5 values calculated using the CuBLM (x-axis) and the bioavailabilty assessment tool (y-axis) for 916 sites in Britain. All values in ug L-1 dissolved Cu. .......... 6 Figure 2.2 Comparison of HC5 values for Cu calculated using the CuBLM and the bioavailability assessment tool for the Swedish dataset. The solid line indicates a 1:1 relationship, and the dashed lines indicate a factor of 2 from the true result. ................... 7

Development and use of the copper bioavailability assessment tool (Draft)
vi
Figure 2.3 Frequency distribution of errors in the prediction of the Local EQSdissolved values by the copper bioavailability assessment tool. ...................................................... 8 Figure 2.4 Comparison of HC5 values for Cu calculated using the CuBLM and the copper bioavailability assessment tool for sites with Ca concentrations of > 1 mg L-1. ..... 9 Figure 2.5 Comparison of HC5 values for Cu calculated using the CuBLM and the copper bioavailability assessment tool for sites with Ca concentrations of > 3 mg L-1. ... 10 Figure 3.1 Screenshot of the Introduction Page of the bioavailability assessment tool. . ................................................................................................................. 12 Figure 3.2 Screenshot of the bioavailability assessment tool..................................... 13 Figure 3.3 Screenshot of the bioavailability assessment tool when data have been added and the calculation is complete. .......................................................................... 14 Figure 4.1 Results from the assessment of failure of the existing EQS for Cu accounting for bioavailability using the bioavailability assessment tool. ......................... 18 Figure 4.2 Comparison of current Cu EQS and estimated Local EQSdissolved using the bioavailability assessment tool ...................................................................................... 19

Development and use of the copper bioavailability assessment tool (Draft)
1
1 Introduction This report describes an approach to account for copper (Cu) bioavailability that is consistent with Water Framework Directive (WFD) requirements and implementable in routine regulatory systems. Specifically, in this report we:
• Describe the development of a bioavailability assessment tool for Cu in freshwaters.
• Explain how the bioavailability assessment tool can be used and implemented in regulatory frameworks.
• Using freshwater monitoring data from England, Wales and Scotland, assess compliance against the proposed EQS value for Cu.
In this introduction we briefly describe the background to the development of a bioavailability assessment tool for Cu before outlining what the tool is, and how and where it should be used. In Section 2 we describe in more detail the development of the tool for Cu. In particular we describe the construction and testing of the tool, and how the CuBLM has been used. Section 3 gives instructions on the use of the bioavailability assessment tool, data requirements, inputting data, and the interpretation of outputs. The results of the EQS compliance assessment for Cu for England, Wales and Scotland are given in Section 4.
1.1 Background There is a great deal of understanding of Cu ecotoxicity in freshwater systems, in part driven by the existing Substance Regulations (793/93/EEC) and the completion of a Voluntary Risk Assessment by the International Copper Association (ECI 2007). The integrated chronic CuBLM was developed by Hydroqual and can be downloaded from their website1.
A detailed description of the development of the CuBLM is provided in a previous Environment Agency report and will not be repeated (Environment Agency 2009a). However, to summarise, chronic ecotoxicity tests were performed with fish, invertebrates, and algae to assess the effect of water quality parameters on Cu ecotoxicity. The aim of this testing was to develop a model to predict the chronic ecotoxicity of Cu to aquatic organisms in freshwaters as a function of water physico-chemistry. The models that were derived are consistent with models of the toxicity of other metals to aquatic organisms: divalent cations can act as competitors to Cu toxicity in fish and invertebrates, and protons act as competitors to Cu toxicity in algae.
The models are able to predict Cu ecotoxicity to test organisms to within a factor of two in most cases.
The integrated model requires considerable technical skill to use and interpret and up to 14 measured or predicted input parameters are needed (Peters et al. 2010). Therefore,
1 http://www.hydroqual.com/wr_blm.html

Development and use of the copper bioavailability assessment tool (Draft)
2
such a complex model is unlikely to be widely used in a routine regulatory context. However, it is possible to develop simplified versions of the CuBLM (Environment Agency 2009a). The next subsection describes the development of these simplified models and why they have widespread applicability in the assessment of potential aquatic metal risks.
1.2 What is a bioavailability assessment tool?
Bioavailability can mean a number of different things depending on the area of science, but in relation to this purpose bioavailability is considered to be a combination of the physico-chemical factors governing metal behaviour and the biological receptor - its specific pathophysiological characteristics (such as route of entry, and duration and frequency of exposure). Effectively this means that a measure of bioavailability will reflect what the organism in the water column actually “experiences”. This is important as it has long been established that measures of total metal in waters have limited relevance to potential environmental risk (Campbell 1995; Niyogi and Wood 2004).
One way to account for bioavailability is through the use of BLMs. Unlike many other speciation-based approaches, the BLMs have been rigorously tested in the laboratory and field; they routinely predict ecological effects to many aquatic taxa across a wide range of water chemistries to within a factor of two. Recent European guidance recommends that where bioavailability models exist they should be used in setting and assessing EQS for metals under the WFD (EC 2010). However, there are some major drawbacks in implementing the BLMs in a routine regulatory context. Specifically, the model complexity, runtime per sample, input data requirements, and the level of operator skill needed to interpret the outputs mean that few regulatory organisations have adopted BLMs. This is equally the case for the chronic copper BLM.
Therefore, it is against this backdrop that bioavailability assessment tools, were developed (Environment Agency 2009a). Bioavailability Tools provide an implementable methodology to account for metal bioavailability. They maximise the use of current understanding of metal fate and behaviour in freshwaters, but are practical regulatory tools with few data inputs. They provide a simple straight forward method to account for metal bioavailability in freshwaters. Detailed descriptions of the development of the bioavailabilty assessment tools for zinc and manganese are provided in previous Environment Agency and UKTAG reports and the open literature (Environment Agency 2009a; 2009b; UKTAG 2012, Comber et al. 2008; Peters et al. 2011). Generally, the tools overestimate chronic toxicity (i.e. underestimate the resulting EQS, but are typically within a factor of 2) compared to the full BLMs2.
1.3 Why and where should the bioavailability assessment tool be used?
2 http://www.bio-met.net/

Development and use of the copper bioavailability assessment tool (Draft)
3
The bioavailability assessment tool can be used in an early tier within a tiered EQS compliance framework (Figure 1.1) or as means to assess site-specific issues for dischargers. The use of the tool in a tiered approach is consistent with classic risk assessment paradigms in that analyses in early tiers are precautionary, but simple to perform with large numbers of sites. As progress is made through the tiers the site numbers are reduced and the levels of precaution and uncertainty decrease. A description of the activity within each tier shown in Figure 1.1 is given below. It is possible that the CuBLM may be used within Tier 3 if required, and if there are enough data to populate the model. As identified above this may deliver a slightly less precautionary assessment (Section 2.3). The bioavailability assessment tool would be used in Tier 2.
Figure 1.1 Flow diagram of the stages of a tiered EQS compliance assessment under the Water Framework Directive
Tier 1. The first tier in the scheme considers a direct comparison of the annual average concentration from monitoring data with the proposed generic 100% “bioavailable” Cu EQS (1 µg L-1). Although the EQS is expressed as a “bioavailable” concentration, it is compared to dissolved metal measurements. This means that the assessment is conservative and false negatives are minimised. Additional supporting parameters (such as pH, DOC, and Ca) are not required in order to undertake analysis in this initial tier of the assessment. Sites, or samples, failing at this tier progress to the second tier of the assessment, in which information on additional supporting parameters (pH, DOC, and Ca) are required as inputs to the screening tool.
Tier 1: Comparison with generic EQSbioavailable
Tier 2: Use of M-BAT to predict site-specific bioavailability
Tier 3: Local refinement
Tier 4: Remedial measures
No further action necessary
Cla
ssifi
catio
n In
vest
igat
ion
Prog
ram
me
of M
easu
res
Pass
Pass
Pass
Fail
Fail
Fail

Development and use of the copper bioavailability assessment tool (Draft)
4
Tier 2. This tier makes use of the Cu bioavailabilty assessment tool and requires information on additional sampling parameters, ie pH, DOC and calcium. Samples failing this screen progress to Tier 3.
Tier 3. This tier includes the use of a potential range of tools to help refine the assessment of bioavailability, such as the use of the ‘full’ BLMs or further sampling and analysis, particularly where default values may have been used for the input parameters, and the consideration of background concentrations. Only when these factors have been accounted for can we safely assume the EQS has been breached.
Tier 4. At this tier the failure of a site to achieve good chemical status has been clearly determined. Consideration of a programme of measures to mitigate the situation, within the appropriate cost/benefit framework, may be required. The advantage of using the bioavailability-based approach at an earlier tier is that causal factors may be identified which provide a focus for the programme of measures.

Development and use of the copper bioavailability assessment tool (Draft)
5
2 THE DEVELOPMENT OF THE BIOAVALABILITY TOOL FOR COPPER
The CuBLM is a relatively complicated model, requiring many data inputs and producing an output in a Microsoft Notepad. To simplify the process of assessing potential Cu risks on a site-specific basis, a simplified bioavailability tool has been developed which relates the water quality conditions, expressed as the pH, DOC, and Ca concentrations, directly to an ecologically acceptable copper concentration under those conditions.
The bioavailability assessment tool for Cu in freshwaters was developed from an extensive dataset of CuBLM calculations covering a wide range of water quality conditions. The dataset consisted of 8400 calculations covering a pH range between 5.5 and 8.5, Ca concentrations between 1 and 200 mg L-1, and DOC concentrations between 0.5 and 32 mg L-1. For each discrete set of conditions the HC5 for dissolved Cu was calculated.
2.1 Use of the CuBLM
The CuBLM was used to calculate HC5 values for dissolved Cu (in µg L-1). The input values for pH, DOC, and Ca were set for the various conditions covered by the dataset, and the concentrations of other major ions required to perform the chemical speciation calculations (Mg, Na, K, Cl, SO4, and alkalinity) were calculated based on relationships with Ca concentrations established from European surface waters (Peters et al. 2010). The CuBLM was used to calculate the HC5 for each individual set of water quality conditions.
2.2 Development of the algorithm
The algorithms (simple equations) were derived which were able to relate the Cu HC5 to the water quality conditions (pH, DOC, Ca) with relevant constants fitted to provide the best fit of the predicted results to the CuBLM calculated results (cf. Environment Agency 2009a). The algorithm and the respective constants from this development process are shown in Annex 1.
2.3 Testing the Cu bioavailability assessment tool
The proposed generic EQS for Cu is 1 µg L-1 (UKTAG 2012b). Effectively, this is an EQSbioavailable and is set without the addition of an assessment factor on the HC5 from the derivation process (EC 2010). The CuBLM gives an HC5 for the specific water conditions inputted as its main output and the bioavailability assessment tool mimics this, giving a Local EQSdissolved as one of its outputs (Section 3).

Development and use of the copper bioavailability assessment tool (Draft)
6
The tool was tested by comparing the estimated Local EQSdissolved against the HC5 calculated using the CuBLM for 916 surface waters from across Great Britain and 917 lake samples from Sweden. The results for the British waters are shown in Figure 2.1 as the CuBLM calculated HC5 plotted against the bioavailability assessment tool EQSdissolved. The results of the tool tend to overestimate Cu toxicity under almost all circumstances however, there appears to be under prediction of toxicity by the BAT in relatively soft (low Ca) waters. This was examined further using a Swedish dataset of lake waters which was dominated by softer waters (Table 2.1) compared to waters from Britain (Environment Agency 2009a).
0.1
1
10
100
1000
0.1 1 10 100 1000
PNEC
, Bio
avai
labi
lity
Tool
(µg
l-1)
PNEC, CuBLM (µg l-1)
Figure 2.1 Cu HC5 values calculated using the CuBLM (x-axis) and the bioavailability assessment tool (y-axis) for 916 sites in England and Wales. All values in ug L-1 dissolved Cu.
A summary of the physico-chemical parameters for the Swedish dataset is shown in Table 2.1 below. The mean Ca concentration from the British dataset was 90 mg L-1 compared to just 6.5 mg L-1 for the Swedish lakes.
Development and use of the copper bioavailability assessment tool (Draft)
7
Table 2.1 Selected physico-chemical characteristics of water samples from Swedish lakes (n=917).
pH DOC (mg L-1) Ca (mg L-1) Minimum 4.00 0.54 0.06 1st Quartile 6.21 7.02 2.05 Median 6.76 10.98 3.66 Mean 6.60 12.14 6.51 3rd Quartile 7.06 15.66 6.85 Maximum 8.32 68.76 106.69
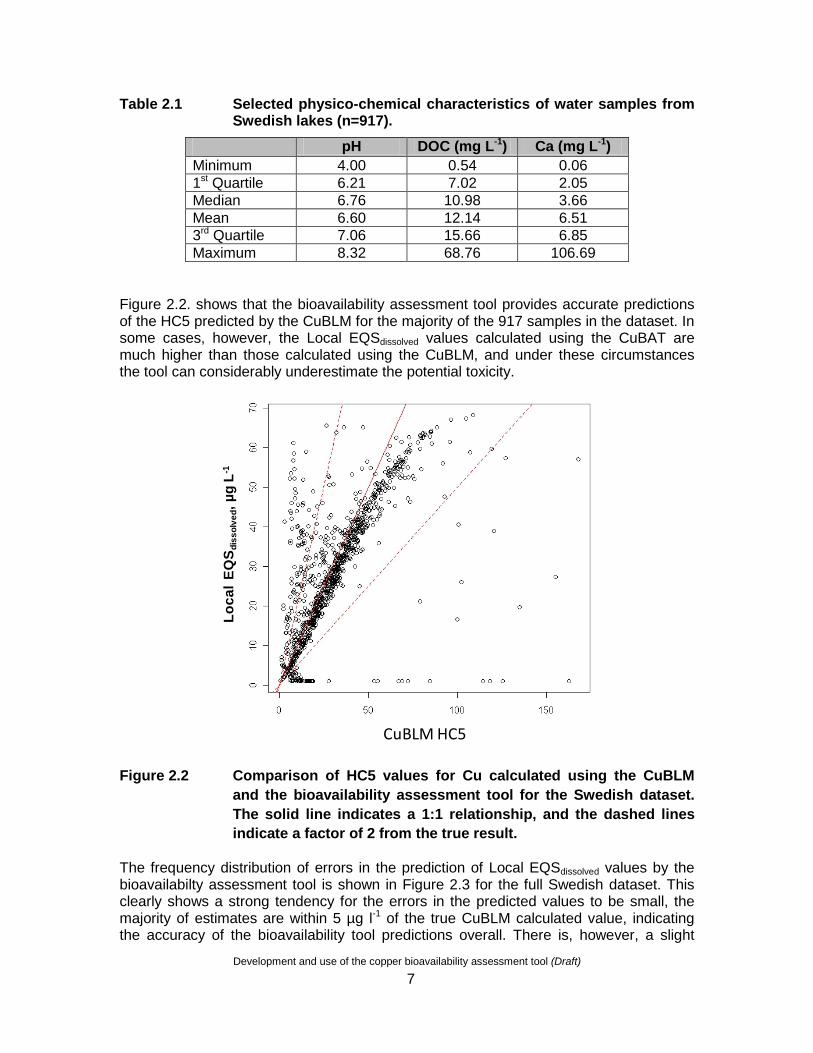
Figure 2.2. shows that the bioavailability assessment tool provides accurate predictions of the HC5 predicted by the CuBLM for the majority of the 917 samples in the dataset. In some cases, however, the Local EQSdissolved values calculated using the CuBAT are much higher than those calculated using the CuBLM, and under these circumstances the tool can considerably underestimate the potential toxicity.
CuBLM HC5
Loca
l EQ
S dis
solv
ed, µ
g L-1
Figure 2.2 Comparison of HC5 values for Cu calculated using the CuBLM and the bioavailability assessment tool for the Swedish dataset. The solid line indicates a 1:1 relationship, and the dashed lines indicate a factor of 2 from the true result.
The frequency distribution of errors in the prediction of Local EQSdissolved values by the bioavailabilty assessment tool is shown in Figure 2.3 for the full Swedish dataset. This clearly shows a strong tendency for the errors in the predicted values to be small, the majority of estimates are within 5 µg l-1 of the true CuBLM calculated value, indicating the accuracy of the bioavailability tool predictions overall. There is, however, a slight

Development and use of the copper bioavailability assessment tool (Draft)
8
tendency towards overestimation of Local EQSdissolved (positive error values) under some circumstances. The conditions that lead to these overestimations of Local EQSdissolved values are considered in more detail below.
0
50
100
150
200
250
300
350
400
450
-50 -40 -30 -20 -10 0 10 20 30 40 50
Freq
uenc
y
Error in EA BLM tool PNECError in CuBAT Local EQSdissolved
Figure 2.3 Frequency distribution of errors in the prediction of the Local EQSdissolved values by the copper bioavailability assessment tool.
The reason for this poor prediction of the Local EQSdissolved values for some sites was investigated by gradually reducing the number of soft water sites included in the comparison. The same dataset is also shown following removal of any sites with Ca concentrations of less than 1, or 3 mg l-1 in Figures 2.4, and 2.5, respectively.

Development and use of the copper bioavailability assessment tool (Draft)
9
Loca
l EQ
S dis
solv
ed, µ
g L-1
CuBLM HC5
Figure 2.4 Comparison of HC5 values for Cu calculated using the CuBLM and the bioavailability assessment tool for sites with Ca concentrations of > 1 mg L-1.
The bioavailability assessment tool continues to perform relatively poorly for a number of sites, even though those with Ca concentrations of less than 1 mg l-1 have been removed from the dataset. Estimation of Local EQSbioavalable values still occurs for some sites and in some cases these are much higher than those calculated using the CuBLM. Increasing the minimum Ca concentration to 3 mg l-1 results in a considerable reduction in the number of sites for which unprotective Local EQSbioavalable values are calculated (Figure 2.4). Increasing the minimum Ca concentration to 5 mg l-1 results in a further reduction in the frequency with which unprotective Local EQSbioavalable values are calculated for the sites.

Development and use of the copper bioavailability assessment tool (Draft)
10
Loca
l EQ
S dis
solv
ed, µ
g L-1
CuBLM HC5
Figure 2.5 Comparison of HC5 values for Cu calculated using the CuBLM and the bioavailability assessment tool for sites with Ca concentrations of > 3 mg L-1.
The bioavailability assessment tool provides reasonably accurate predictions of HC5 values from the CuBLM for sites which do not have very low Ca concentrations, with a slight tendency towards underestimation. There is also a tendency to underestimate HC5 values under low bioavailability conditions, and this effect becomes apparent at HC5 values of greater than 50 mg L-1. Underestimation of the true HC5 values under these conditions is not considered to pose a significant problem to the implementation of the bioavailability assessment tool in the UK because this only occurs for sites which are particularly insensitive to Cu.
It is recommended that the bioavailability assessment tool is not used for sites with very low Ca concentrations, and excluding sites with less than 3 mg L-1 Ca still results in some overestimates of the Local EQSdissolved. Increasing the lower Ca limit to 5 mg L-1 would exclude the application of the bioavailability assessment tool to approximately 22% of surface waters in UK (compared to approximately 13% for a cut off value of 3 mg L-1 Ca), but considerably reduces the frequency of under-protective predictions. The CuBLM should be used in cases where the bioavailability assessment tool is not applied.

Development and use of the copper bioavailability assessment tool (Draft)
11
3 Using the bioavailability assessment tool
This section describes how to use the tool to assess the potential aquatic risks of Cu. The data input requirements are outlined along with what to do to get started. The Cu bioavailability assessment tool will operate in versions of Excel™ from 2003 onwards. Supplementary information on this section is available from the report of the Water Framework Directive Workshop on bioavailability of metals held in June 20113.
3.1 Data inputs The tool accounts for Cu bioavailability for specific locations through the use of local water chemistry data, specifically pH, DOC (mg L-1) and Ca (mg L-1). These estimates can be based on a single sampling occasion or, in accordance with the requirements of the WFD, from monitoring data from 12 monthly sampling occasions over a period of one calendar year.
A hazard assessment can be performed if no measured Cu data are available, i.e. the tool will give an indication of the relative sensitivity of waters to potential Cu exposure. However, if a risk or EQS compliance assessment for Cu is to be undertaken then monitoring data for dissolved Cu are required. For a compliance assessment, the annual average of the respective measured metal data needs to be calculated and entered into the tool.
Columns are also available in the tool for entry of sample ID, location, water body code and date (Figure 3.2), although none of these need to be entered for the tool to work.
3.2 What if data for some of the fields are absent?
The bioavailability assessment tool requires data inputs for pH, DOC and Ca. Without these, the tool will not run (and you will be prompted for an input). Dissolved organic carbon is a determinand that is not routinely monitored in freshwaters in England and Wales or many other European Member States. However, in the past some DOC data were collected across most Environment Agency regions. These historical data allow estimation of DOC default values for many waterbodies and most hydrometric areas in England and Wales (Environment Agency 2009b). Importantly, as shown in Figure 1.1, only sites that progress through Tier 1 will require the collation of additional data, such as DOC.
3 http://circa.europa.eu/Public/irc/env/wfd/library?l=/framework_directive/implementation_conventio/bioavailability&vm=detailed&sb=Title

Development and use of the copper bioavailability assessment tool (Draft)
12
3.3 Getting started
The tool runs in Excel™ and upon opening it is imperative to ensure that the macros are enabled, otherwise the tool will not work. The first page that you should see is shown in Figure 3.1.
The following are step-by-step instructions on how to run the Tool. These are the same instructions that are given on the front page of the Tool.
1. Click the Start button on the Introduction Page. This will open the Bioavailabilty Assessment Tool Sheet (Figure 3.2).
2. This sheet contains an empty table (if it isn't empty, click the Clear Data button to empty it).
Figure 3.1 Screenshot of the Introduction Page of the bioavailability assessment tool

Development and use of the copper bioavailability assessment tool (Draft)
13
Figure 3.2 Screenshot of the bioavailability assessment tool.
3. The grey columns on the left (Figure 3.2) are where you enter data about your samples, as follows:
• Location (from which the sample was taken)
• WB (name of the waterbody that contains the sampling location)
• Date (on which the sample was taken)
• pH of the sample (annual average) (required)
• DOC measured in the sample (annual median or a default value in mg L-1) (required)
• Ca measured in the sample (annual average mg L-1) (required)
4. If you have measured the levels of dissolved Cu in your samples, you can enter these values as well (µg L-1). These data are not necessary to running the tool and you can undertake a hazard assessment without the measured metals data.
5. When you have entered your data, click Calculate to continue. A box will pop up to tell you when calculation is complete (Figure 3.3). Click OK to continue.

Development and use of the copper bioavailability assessment tool (Draft)
14
Figure 3.3 Screenshot of the bioavailability assessment tool when data have been added and the calculation is complete.
6. The results are displayed in the orange columns on the right-hand side of the table.
7. In all cases, the following results are shown:
• Estimated Local EQSdissolved for each site (µg L-1)
• BioF for each metal (calculated using the reference EQSbioavailable for Cu of 1µgL-1)
8. Where you have entered data about the measured concentrations of Cu, the following results are also shown:
• Bioavailable concentration for Cu (µg L-1)
• Risk Characterisation Ratio for Cu at each site
9. Some results are highlighted. Hover your cursor over the highlighted cells, and a comment will appear. This will explain why the result has been flagged. It will be for one or both of the following reasons:
• The inputted values of the abiotic water parameters result in a higher level of Cu bioavailability than the EQSbioavailable. In this case, the estimated PNEC shown has been set as equal to the EQSbioavailable. This indicates sensitive conditions at the sampling point in question. These cells are shown with a white background and red text.
• The allowable range for Ca is 1 mg L-1. There are no limits for the other parameters. These cells will be highlighted by having a white background and red text. By hovering over the cell the reason for the flag is given.

Development and use of the copper bioavailability assessment tool (Draft)
15
You can enter data for as many samples as you like, simultaneously. Make sure that each sample is entered on a separate row. You can even paste data in from another spreadsheet, so long as it is laid out in the same order as in the tool.
This tool will not work if you enter blanks, zeros or text in the DOC, pH or Ca fields.
You must enter positive numeric data only. If you edit any of the input data after running the programme, the results will not adjust automatically. You will have to click Calculate again, even if you have only changed one row. If you want to re-run the spreadsheet with a completely new set of input data, as if from the beginning, click Clear Data and start again.
3.4 What do the outputs from the bioavailability assessment tool mean?
The bioavailability assessment tool will account for Cu bioavailability for specific locations through the use of local water chemistry data, specifically pH, DOC (mg L-1) and Ca (mg L-1). If only data for pH, DOC and Ca are entered into the tool then results will appear under the column headers estimated Local EQSdissolved and BioF. If dissolved metal concentrations are added, in addition to the abiotic parameters, then bioavailable Cu and risk characterisation will also be calculated. How these outputs are calculated and what they mean is discussed below.
3.4.1 Estimated Local EQSdissolved and BioF
The estimated Local EQSbioavailable is calculated from the relationships shown in Section 2.2 that were developed on the basis of the BLM outputs. The Local EQSbioavailable can be considered as a site-specific EQS, and is useful in ranking sites in terms of their sensitivity to Cu toxicity.
The BioF is calculated by dividing the generic EQSbioavailable (1 µg Cu L-1) by the estimated Local EQSbioavailable. This step enables there to be only one EQS for the whole country, but allows account to be taken of bioavailability at each individual site. The BioF is then used in the next stage of calculations, if dissolved metal data have been added in the columns to the left. Values of the BioF should always be below 1 in this tool.
3.4.2 Bioavailable Cu concentration and risk characterisation ratio
If measured dissolved Cu data have been added to the sheet in the left hand column then there is an opportunity to assess potential risks at individual sites and undertake an EQS compliance assessment. The bioavailable Cu concentration value and risk characterisation ratio will be calculated, the former by multiplying the measured data by the BioF and the latter by dividing the measured metal concentration by the Local EQSdissolved.
The bioavailable Cu concentration gives an estimate of the amount of Cu in the sample that is biologically active and of ecological relevance. The risk characterisation ratio, or risk quotient, provides an indication of whether the site being assessed has passed or failed to meet the Cu EQS and by what extent. The risk characterisation ratio is a commonly used metric in screening risk assessments, and a value of equal to, or above,

Development and use of the copper bioavailability assessment tool (Draft)
16
unity indicates a potential risk. It is information in this final column that can be used to determine which sites progress into Tier 3, as shown in Figure 1.1 (and perhaps consideration of using the CuBLM), and which sites exit the compliance process and require no further action.

Development and use of the copper bioavailability assessment tool (Draft)
17
4 Assessment of sites failing the current EQS for copper
Any EQS regime needs to reflect the real risk to the environment and the protection goals being sought in order to avoid either unnecessary costs to society or possible environmental impacts. However, an EQS regime also needs to be as simple as possible to minimise regulatory burdens. The need to strike this balance between precision and practicality for an EQS regime is helped by taking account of metal bioavailability. This section provides a bioavailability assessment, with the bioavailability assessment tool, of those sites that failed the existing hardness based Cu EQS:
• 0-50 mg L-1 CaCO3, 1 µg Cu L-1 • 50-100 mg L-1 CaCO3, 6 µg Cu L-1 • 100 mg L-1 CaCO3, 10 µg Cu L-1
4.1 The datasets
Sites which failed to comply with current environmental quality standards (EQS) for Cu between 2006 and 2008 were assessed by applying a tiered assessment approach to take bioavailability into account. A total of 513 sites were assessed.
The sites assessed were matched to available annual average data for pH, DOC and Ca where this information was available (the annual median value was used for DOC). Measured data for pH were required, but if measured data were not available for either DOC or Ca then default concentrations were applied from a database of default DOC and Ca concentrations for waterbodies (Environment Agency 2009b), where available, and hydrometric areas. This database of default concentrations includes the 25th percentile of available DOC monitoring data and the 50th percentile of Ca monitoring data. The 25th percentile is used for DOC concentrations in order to provide a relatively conservative estimate of the Local EQSbioavailable for Cu. By taking this approach risks are more likely to be predicted where default DOC concentrations have been applied. Default concentrations are available for a limited selection of individual waterbodies (where monitoring data were available) and also for hydrometric areas. Where available, waterbody specific default values are used in preference to hydrometric area based default values.
The physico-chemical data were then used to predict the bioavailability of Cu using the tool. As discussed in an earlier section the tool provides relatively conservative estimates of potential Cu toxicity and therefore sites which fail when assessed using this model should be further analysed using the original Cu BLM in order to provide a definitive compliance assessment.

Development and use of the copper bioavailability assessment tool (Draft)
18
4.2 The results
A total of 513 sites were assessed for Cu, and of these 88 also failed the assessment using the bioavailability assessment tool. Of the 88 sites which failed this assessment 76 failed the definitive assessment based on the original CuBLM. When a nominal background concentration of 1 µg L-1 was taken into account at all sites in the screening level assessment 77 sites still failed the assessment, i.e. the conclusion was altered only for 11 out of 513 sites assessed.
Application of a bioavailability correction in assessing compliance against the current statutory standard resulted in 46 sites failing. It should be noted, however, that taking this approach results in a double correction being made for bioavailability. This is because the bioavailability is taken into account in deriving the bioavailability correction (BioF) which is applied to the measured exposure data, and a further correction is applied in using hardness based standards against which to assess the bioavailability corrected exposure level. Furthermore, the second bioavailability correction assumes that there is a protective effect of hardness on chronic copper toxicity, although this effect is not apparent in the application of the BLM (increased water hardness actually results in increased copper bioavailability).
The results of the assessment using the tool (T2), applying a background correction (Bkgd), and using the Cu BLM on sites which fail the assessment using the assessment tool (T3) are shown in Figure 4.1 as the percentage of sites passing or failing each tier.
Figure 4.1 Results from the assessment of failure of the existing EQS for Cu accounting for bioavailability using the copper bioavailability assessment tool
The estimated Local EQSdissolved values from the CuBAT are shown along with the hardness based standards for the sites which were assessed in this study in Figure 4.2. This shows that when bioavailability is taken into account the resulting standards can be much more variable than is assumed by the hardness banded system. Sites which fall

Development and use of the copper bioavailability assessment tool (Draft)
19
into the lowest of the hardness bands (<50 mg L-1 CaCO3) have the greatest variation in estimated EQSdissolved values, and can actually have the lowest bioavailability, although bioavailability at these sites can also be very high. Figure 4.2 clearly shows the poor predictive capacity of the existing hardness based standards to distinguish between sites of good status and sites with potential environmental risks associated with Cu.
0
10
20
30
40
50
60
0 5 10 15 20 25 30
Estim
ated
Cu
PNEC
(Cu,
µg
l-1)
Existing EQS (Cu, µg l-1)
Loca
l EQ
S dis
solv
ed, µ
g L-1
Figure 4.2 Comparison of current Cu EQS and estimated Local EQSdissolved using the copper bioavailability assessment tool


Development and use of the copper bioavailability assessment tool (Draft)
21
5 Conclusions One of the key practical difficulties preventing the implementation of approaches that account for metal bioavailability is the complexity of the processes that need to be followed. Chronic BLMs for several metals have been in existence for nearly 10 years, yet none have been incorporated into routine regulatory risk assessment. The development of simplified tools to facilitate the implementation of the BLMs has been shown to provide a practical way forward for regulators and the regulated community.
In this project a simplified version of the chronic CuBLM has been developed. This Cu Bioavailability Tool mimics the CuBLM, but runs in Microsoft Excel™ and requires data for site-specific dissolved organic carbon, pH and calcium. The copper bioavailability assessment tool uses a series of algorithms and constants which can be readily automated into current regulatory data management systems.
The tool tends routinely to over-predict Cu toxicity. Used within a tiered risk-based approach this level of precaution is acceptable, although the tool should not be used for sites with Ca < 3 mg L-1 (hardness 11.4 mg CaCO3 L-1). Recent EU Guidance (EC 2010) has endorsed the use of the user-friendly bioavailabilty tools in this way for compliance assessment and risk assessment.
An assessment of how accounting for bioavailability may affect the level of exceedance of Cu in waters in the UK when compared to the use of existing standards demonstrated significant reductions. Accounting for ambient background concentrations of Cu and using the CuBLM made a very minor difference to levels of exceedance (< 3%).


Development and use of the copper bioavailability assessment tool (Draft)
23
References Campbell PGC. 1995. Interactions between trace metals and aquatic organisms: a
critique of the free-ion activity model. In: Tessier A, Turner DR. Editors. Metals speciation and bioavailability in aquatic systems. Chichester, UK. John Wiley and Sons, pp 45-102.
Comber SDW, Merrington G, Sturdy L, Delbeke K, Van Assche F. 2008. Copper and zinc water quality standards under the EU Water Framework Directive: The use of a tiered approach to estimate the levels of failure. Science of the Total Environment 403:12-22.
European Commission (EC). 2009. Laying down, pursuant to Directive 2000/60/EEC of the European Parliament and the council, technical specifications for chemical analysis and monitoring of water status. Official Journal of European Union. L 210 36-38.
European Commission (EC). 2010. Chemicals and the Water Framework Directive: technical guidance for deriving environmental quality standards (Draft). JRC, Ispra, Italy.
ECI. 2007. European Union risk assessment report on copper, copper(ii)sulphate pentahydrate, copper(i)oxide, copper(ii)oxide, dicopper chloride trihydroxide. Voluntary risk assessment, draft February 2007. European Copper Institute, Brussels, Belgium.
Environment Agency. 2009a. Using biotic ligand models to help implement environmental quality standards for metals under the Water Framework Directive. Science Report SC080021/SR7b. Environment Agency of England and Wales, Bristol, UK.
Environment Agency. 2009b. The importance of dissolved organic carbon in the assessment of environmental quality standard compliance for copper and zinc. Science Report SC080021/SR7a, Environment Agency of England and Wales, Bristol, UK.
Niyogi S, Wood CM. 2004. Biotic ligand model, a flexible tool for developing site-specific water quality guidelines for metal. Environ Sci Technol 38:6177-6192.
Peters A, Merrington G, De Schamphelaere K, Delbeke K. 2010. Regulatory consideration of bioavailability for metals: Simplification of input parameters for the chronic copper Biotic Ligand Model. Integrated Environmental Assessment and Management. 7, 437-444.
Peters A, Lofts S, Merrington G, Brown B, Stubblefield W, Harlow K. 2011. Development of biotic ligand models for chronic manganese toxicity to fish, invertebrates, and algae. Environmental Toxicology and Chemistry, 30; 2407–2415
UKTAG, 2012. Development and use of the manganese bioavailability assessment tool.

Development and use of the copper bioavailability assessment tool (Draft)
24
Annex 1. Algorithm from the CuBAT
HC5(Cu) = A*DOCB The HC5 is in the units of µg L-1. DOC: mg L-1, Ca: mg L-1 Where: A = A32*pH3*Ca2 + A31*pH3*Ca + A30*pH3
+ A22*pH2*Ca2 + A21*pH2*Ca + A20*pH2 + A12*pH*Ca2 + A11*pH*Ca1 + A10*pH
+ A02*Ca2 + A01* Ca + A00 B = B12*pH*Ca2 + B11*pH*Ca + B10*pH +
B02*Ca2 + B01*Ca + B00 The values of these coefficients are dependent on whether Ca is greater than or less than 6 mg L-1. If Ca < 6 mg L-1 If Ca > 6 mg L-1
A32 0.007086 -2.44051E-06 A31 -0.03879 0.001488581 A30 0.045806 0.088218333 A22 -0.16924 4.94966E-05 A21 0.944229 -0.030123758 A20 -1.14598 -2.755899334 A12 1.33624 -0.000315114 A11 -7.61038 0.191105459 A10 9.499675 27.10433593 A02 -3.61346 0.000630283 A01 21.53243 -0.380149998 A00 -24.0449 -81.85965156 B12 -0.00263 0 B11 0.016759 0 B10 -0.02091 0.032538 B02 0.019243 0 B01 -0.11206 -0.00066 B00 1.145876 0.804597

Development and use of the copper bioavailability assessment tool (Draft)
25
Glossary BioF The bioavailability factor. The BioF is based on a
comparison between the expected bioavailability at the reference site and that relating to site-specific conditions. Through the use of a BIOF, differences in (bio)availability are accounted for by adjustments to the monitoring data but the EQS remains the same. It is calculated by dividing the Generic or Reference EC10 by the calculated site-specific EC10.
BLM Biotic Ligand Model. This is a predictive tool that can account for variations in metal toxicity and calculates a site-specific PNEC using information on the chemistry of local water sources, i.e. pH, calcium concentrations, hardness, dissolved organic carbon, etc.
BAT Bioavailability assessment tool. Effectively is a simplified version of the BLM. It performs the same calculations as the BLM, but is run in MS Excel, requires fewer data inputs, and gives outputs that are precautionary relative to the full BLM but that are readily interpretable in the context of basic risk management and EQS compliance assessment.
HC5 Hazardous Concentration to 5 percent of tested aquatic organisms.
DOC Dissolved organic carbon. The input to the screening tool for DOC should be site-specific median concentrations from at least eight sampling occasions. Default waterbody values of DOC are available for some waterbodies4.
EQS Environmental Quality Standard. A term used for the annual average.
Generic EQS Generic Predicted No Effect Concentration, sometimes also termed the reference or generic EQS. This is representative of conditions of high bioavailability and is expressed as “bioavailable” metal concentration.
PEC Predicted Environmental Concentration. These are usually replaced in the screening tool with measured environmental concentrations of dissolved copper in the waters of interest.
PNEC Predicted No Effect Concentration. This concentration is derived from the ecotoxicological data and site-specific water quality data using the BLM.
RCR Risk Characterisation Ratio, also sometimes called the risk
4 ENVIRONMENT AGENCY. 2010. The importance of dissolved organic carbon in the assessment of environmental quality standard compliance for copper and zinc. Draft final report SC080021/SR7a. Environment Agency, Bristol, UK.

Development and use of the copper bioavailability assessment tool (Draft)
26
quotient. This is calculated by dividing the PEC by the PNEC. Values equal to or greater than 1 present a potential risk.