development and demonstration of a new-generation high ...development and demonstration of a ......
TRANSCRIPT

Development and Demonstration of a New‐Generation High Efficiency 1‐10kW Stationary PEM Fuel Cell System
1
Durai Swamy Ph.D., PE
Chris Jackson Ph.D
May 20th 2009
DOE Annual Merit Review (AMR)
This presentation does not contain any propriety, confidential or otherwise restricted information
fc_25_swamy

2
Project Overview
1 2 3 4 5 6 7 8 9 10 11 12 1 2 3 4 5 6 7 8 9 10 11 12 1 2 3 4 5 6 7 8 9 10 11 12
1Technology Development
2Integrated System Design
3Fabrication and Testing
4Field Demonstration
Year 1 Year 2 Year 3
Project Target DOE 2011 Target
Electrical Efficiency 40% 40%
Overall Efficiency > 70% 80%
Durability 40,000 hrs 40,000 hrs
Capital Cost $400 / kW $750 / kW
Project Partners• Intelligent Energy‐Dr. Durai Swamy (PI)
• California Polytechnic University, Pomona
• University of South Carolina
• Sandia National Laboratories
Timeline: July 2007‐August 2010
Challenges/Barriers
Budget• Three year, $4.38 million program, 50% DOE
cost share
• Funding received in FY 08 = $459,533
• Estimated funding for FY 09 = $ 955,101
50% complete

3
Objectives• Develop and demonstrate PEM fuel cell based 1‐10 (kWe) stationary
combined heat and power system that provides the foundation for commercial mass‐producible units that address the identified technical barriers
• Technical
• 40% electrical efficiency (fuel to electric energy conversion)
• 70% overall efficiency (fuel to electric energy conversion + usable waste heat energy conversion)
• Potential for 40,000 hour life
• Potential for $450/kW
• System demonstration in IPHE country
• Topic 7A‐International Partnership for a Hydrogen Economy (IPHE)
• Engage international partners
• Demonstration phase in an IPHE country other than the USA

4
•Process Flow Diagram
Approach
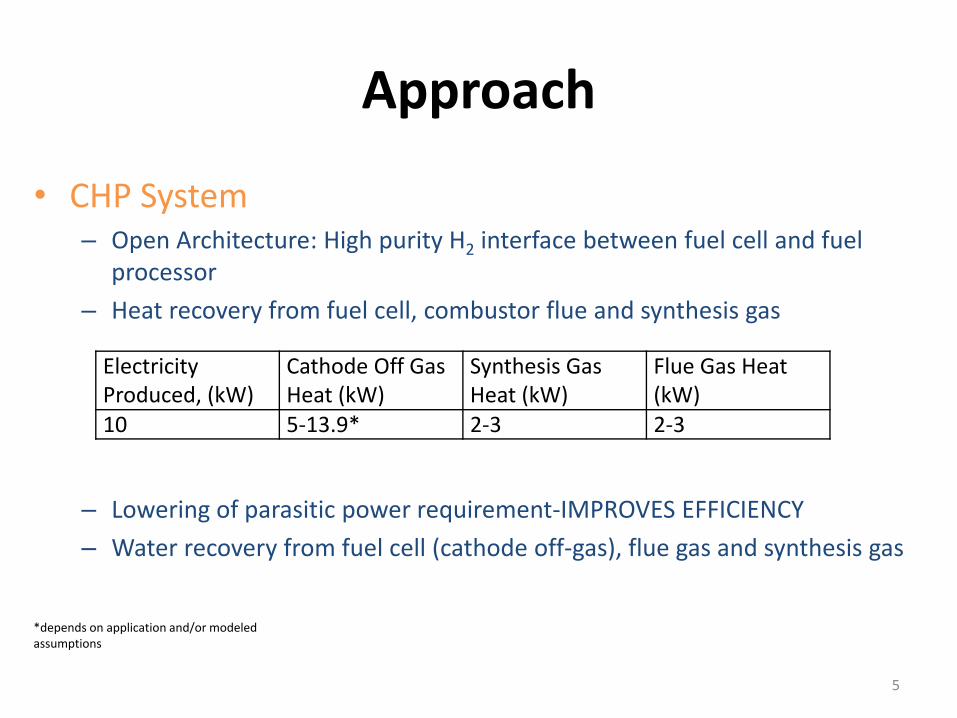
• CHP System– Open Architecture: High purity H2 interface between fuel cell and fuel
processor
– Heat recovery from fuel cell, combustor flue and synthesis gas
– Lowering of parasitic power requirement‐IMPROVES EFFICIENCY
– Water recovery from fuel cell (cathode off‐gas), flue gas and synthesis gas
5
Approach
Electricity Produced, (kW)
Cathode Off Gas Heat (kW)
Synthesis Gas Heat (kW)
Flue Gas Heat (kW)
10 5‐13.9* 2‐3 2‐3
*depends on application and/or modeled assumptions

Approach• Hydrogen Production Subsystem
– Integrate improved H2 generator/rapid cycle PSA
– Demonstrate the platform using natural gas to align with IE commercial program with Scottish and Southern Energy Ltd.
– Validate continuous H2 production using AER for future coupling to CHP prototype and/or deployed systems‐HIGHEST EFFICIENCY ENABLER
– Simplified low cost‐to‐manufacture reformer design (T3) with expected increase in efficiency
6

7
Approach
• Fuel Cell Subsystem– Improved flow field design
– Fluid flow modeling
– Advanced MEA design
– Diffuser optimized for water management
– Advanced bipolar plate materials
– Reduced air pressure requirements
– Pressed plate architecture to address cost
– Optimized air delivery design
– Optimized power management design & configuration

8
Accomplishments Since Last AMR
• AER– Multiple tube cyclic
continuous hydrogen production test rig ready for operation*
*Single tube feasibility test data presented in last AMR

9
• Hydrogen Production Subsystem– 513 Hours of Testing
Accomplishments Since Last AMR
513 Ref Hours
250 PSA Hours
58 cold starts

• Hydrogen Production Subsystem– Repeatable production runs at > 65% thermal efficiency*
10
Accomplishments Since Last AMR
Therm Eff. Load Time H20/C Supp Fuelslpm slpm
65.24 69.5 9/24/2008 16:27 2.86 064.94 69.4 9/24/2008 17:29 2.87 065.47 69.8 9/30/2008 17:11 3.08 5.365.65 69.5 10/1/2008 11:20 3.04 5.365.85 70 10/1/2008 13:30 3.13 065.21 61 10/1/2008 15:00 3.26 4.665.07 70 10/2/2008 11:41 3.04 565.27 60.7 10/2/2008 16:00 3.01 665.32 62 10/2/2008 17:40 2.91 7
* n= H2 Q out/CH4 Q inData from 10/1/2008

• Hydrogen Production Subsystem– Achievement of >69% thermal efficiency
– Validation of water‐gas shift reactor and catalyst
WGS reactor and catalyst allow for heat recovery from exothermic process (favored by low temperature) and increases H2 yield
11
Accomplishments Since Last AMR
DateCO to Shift
CO out shift
Thermal Efficiency
%, dry % dry %
Previous Shift Reactor
10/2/2008 13.3 3.6 65
New Shift Reactor10/28/2008 11.5 1.5 69

• Fuel Cell Subsystem • Work has previously been done with two efficient prototype DC‐DC
converters, one to generate high voltage compressor power, and the other to generate low voltage controls power.
• These have now both been packaged into to a near final form
12
Accomplishments Since Last AMR
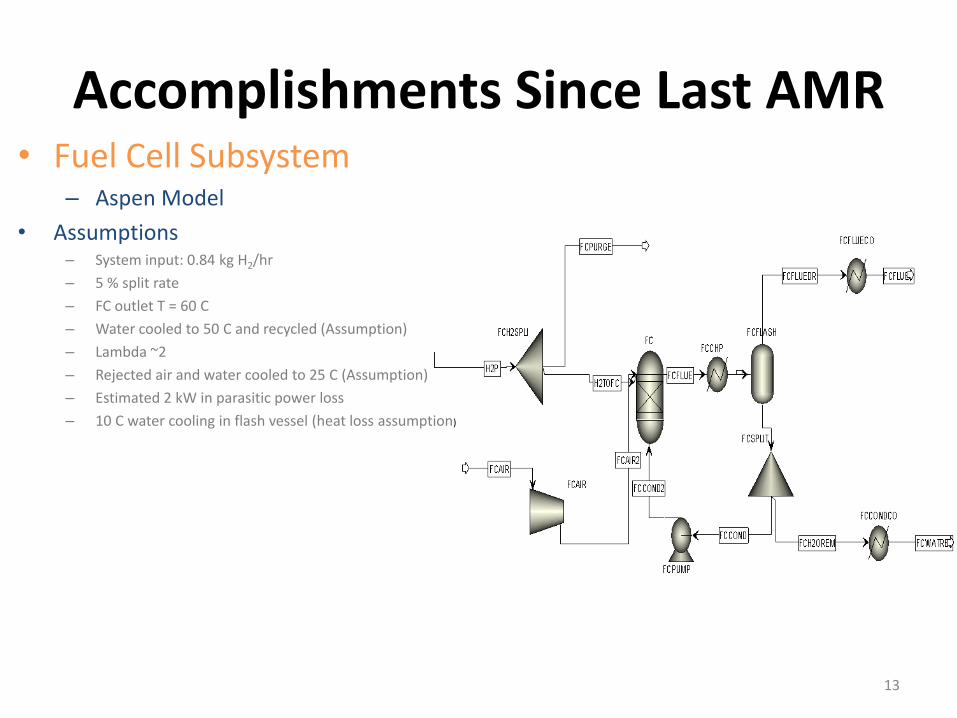
• Fuel Cell Subsystem– Aspen Model
• Assumptions– System input: 0.84 kg H2/hr
– 5 % split rate
– FC outlet T = 60 C
– Water cooled to 50 C and recycled (Assumption)
– Lambda ~2
– Rejected air and water cooled to 25 C (Assumption)
– Estimated 2 kW in parasitic power loss
– 10 C water cooling in flash vessel (heat loss assumption)
13
Accomplishments Since Last AMR

• Fuel Cell Subsystem – Testing to 500 hrs (1000 hrs to date)
14
Accomplishments Since Last AMR
Stack voltage at 90A
0
20
40
60
80
100
120
140
160
180
0 50 100 150 200 250 300 350 400 450
Hours Running (Hours)
Volt
age (
V)
0
2
4
6
8
10
12
14
16
18
Net
Po
wer
(kW
)
Stack voltage /V Net Power /kW

• Fuel Cell Subsystem– Testing to 500 hrs
15
Infant Mortality Failure Modes Root Cause Design fix
1: Failed compressor
This system was fitted with a Varex compressor. This type of compressor performed well in early prototype systems but proved to have a short life when running past 200 hrs.
Vane tip wear Replaced with high speed centrifugal type compressor which do not have close tolerance tip clearance and utilise high speed air bearings.
2: Air box gasket moved
Air leaks were found during testing Gasket face toosmall
Sub-system design modified and gasket eliminated.
3: Purge valve failure
High flow of gas detected in the purge line. The rubber seat fittedto the purge valve was found to be damaged.
Damaged sealing surface as supplied
Purge valve manufacturer changed.
4: Compressor vibration
The replacement Varex compressor began to exhibit high noise from the drive end.
Rotor needle roller bearing failure.
Future designs use a high speed centrifugal type compressor which do not have close tolerance tip clearance and utilise high speed air bearings.
5: Water flow meter failure
The water flow meter is submersed in the catch pot (as designed). The test was shut down due to low water flow. Inspection showed that the water flow meter had failed.
Water ingress into the flow meter processing electronics.
Component was replaced, examined and sent to manufacturer for further inspection
Accomplishments Since Last AMR

• Fuel Cell Subsystem– Design
16
Accomplishments Since Last AMR

• Fuel Cell Subsystem & Test Station– Built
17
Accomplishments Since Last AMR
• FC (7402)
• Test Rig
• System Tested
• Shipping to US in March 09

Accomplishments Since Last AMR
100
110
120
130
140
150
160
170
180
190
200
0 20 40 60 80 100 120 140 160
Load current /A
Sta
ck v
oltag
e /V
0
2000
4000
6000
8000
10000
12000
14000
16000
18000
20000
Sta
ck P
ow
er /
W
Stack voltage /V Stack Power /W
18
•Fuel Cell Subsystem– Polarisation Post‐”ruggedization” Testing

• Hydrogen Production Subsystem– PSA Subsystem
19
CE certified PSA* integrated into CHP system
Accomplishments Since Last AMRCHP System Design
*supplied by QuestAir

• Electrical and Grid Interconnection– The NEDAP Altrium Mygrid system currently
under consideration– This is a modular system that allows different
energy sources (e.g. wind, battery, fuel cell, solar cell and generators to be mixed and managed)
– This existing modules for battery and solar form a solid basis for a FC input module
– Output modules are rated at 5kW and two could be used for 10kW single phase, and three for 10kW three phase.
– Fuel cell input modules are required and battery module would give additional capability
20
Accomplishments Since Last AMRCHP System Design

21
FC specific: BS/EN 62282 Fuel cell modulesReformer specific: ISO 16110pt1 Hydrogen generators using fuel processing technologyCHP- specific: CEN/CENELEC – FC gas heating appliance of nominal heat input < 70 kW (prEN 50465)
Step 3: System Conformity ReviewStep 4: Testing & Notified Body
AssessmentStep 5: Certification
Certification Strategy Compiled
Step 1: Risk Assessments & FMEAsStep 2: Directive Compliance Review ATEX - Designed for equipment to be
placed in explosive atmospheres
GAD - Gas Appliances Directive PED - Pressure Equipment DirectiveLVD - Low Voltage DirectiveEMC - Electromagnetic Compatibility
DirectiveMAC - Machinery Directive (covers
rotating appliances)
• Safety AssessmentCodes & Standards Review for CE Marking
Accomplishments Since Last AMRCHP System Design

• Prototype Assembly– In‐house Package 2009
22
Fuel cell
PSA
Controller and subsystems
reformer and shift
CHP System Work in Progress

23
•Future CHP PackageField Demonstrator 2010
CHP System Work in Progress

• Finalize site selection by end of Task 3– IE Loughborough facility
– Scottish and Southern Energy Ltd. (Perth Scotland)
– Work with OEMs to create smaller, less expensive components for future designs
– CE certification
24
Plan for Remainder of Project

• Complete CHP prototype and witness test in Long Beach during September 2009
• Evaluate results of AER alongside T3 to select best platform for European demonstration unit that meets or exceeds project efficiency targets during Phase 4
• Continue techno‐economic studies to validate cost reduction strategies
25
Plan for Remainder of Project

26
Conclusion• Proven subsystems technology to 500 hrs
• Identified & Mitigated Infant Mortality• Preparing Integration of Fuel Cell Subsystem and Hydrogen Production Subsystem
• Prototype CHP to be commissioned duringQ2‐Q3 2009
• Subsystem components fullydescribed
• High Level Risk analysis of mainsubcomponents prepared in readinessfor High and Component level FMEAsin Q1 09.
• Subsystem steady‐state models• preliminary models ready for
experimental validation

1/26/2009Proprietary and Confidential DE‐FC36‐
07GO1701327
Clean power anywhere
Intelligent Energy
Thank You