development and application of in vitro models for ... · for screening drugs and environmental...
TRANSCRIPT

By: Jim McKim, Ph.D., DABTFounder and Chief Science Officer
Development and Application of In Vitro Models for Screening Drugs and Environmental Chemicals that Predict Toxicity in Animals and Humans

Presentation Topics
Introduction to CeeTox Laboratories
Overview of services
Description of our Systemic Toxicity Model
Predicting an in vitro LD50

Proprietary to CeeTox, Inc.
CeeTox ,Inc.: Is a Specialty Contract Research Laboratory Located in Kalamazoo Michigan at the Southwest Michigan Innovation Center
Founded 2003
Focus on in vitro toxicity
Currently 32 employees
Owned by NAMSA, Inc 2008
CeeTox Customer Base
Small and midsized PharmaPersonal care companiesHousehold product companiesMedical devicePetroleum companiesGovernment agencies

Proprietary to CeeTox, Inc.
CeeTox has a World Class Cell Culture and In Vitro Toxicology Laboratory

Proprietary to CeeTox, Inc.
CeeTox Utilizes Robotics and State-of-the- Art Laboratory Equipment to Process Samples

Roche 480 thermocycler 96- and 384-well head
BioTek plate reader
Perkin Elmer Fusion
Roche xCelligence system for cardiac toxicity
Beckman Coulter Biomek Robotics Station
CeeTox Has a Wide Range of Assay Capabilities all of Which can be Done in a High Throughput Mode

CeeTox Intellectual Property
CeeTox Patents
New In Vitro Screening Method IssuedCardioTox IssuedAnti-Tumor Predictive Tox PendingSkin Sensitization PendingMulti-Organ Prediction Pending

CeeTox Overview of Services
Systemic Toxicity Services CTOX Panel® Acute Toxicity Screen In Vitro LD50
Dermal Toxicity Percutaneous Absorption Corrosion Irritation Sensitization Photo Toxicity
Ocular Toxicity Endocrine Disruption
Estrogen receptor (ER) binding Estrogen transcriptional activation Androgen receptor (AR) binding Steroidogenesis Aromatase
Organ Specific Toxicity Models Heart (CardioTox®) Kidney Liver
ADME Serviced CYP Induction/Inhibition Caco2 absorption Pgp transport Metabolism Metabolic stability BSEP inhibition
Drug / Drug Interaction Target / Pathway Assays
Acute Inflammatory Response Apoptosis Cell Proliferation Cell Viability Glutathione Homeostasis Hepatobiliary Toxicity Lipidosis Membrane Integrity Metabolism Mitochondrial Function
… a wide range of in vitro toxicology and safety assessment services
Building In Vitro Models for Predicting In Vivo Toxicity
By: James McKim, Ph.D., DABTChief Science Officer
The Road From Pharmaceuticals to Environmental Chemicals

What is Systemic Toxicity and What do We Want From Alternative Methods?
Toxicity that occurs after a chemical is absorbed into general circulation• Acute systemic toxicity
Single dose, and short exposure timeIntrinsic toxicity of a chemical, LD50, organ effects
• Subacute systemic toxicityRepeated‐dose study, typically 14 dayInformation on toxicity following repeated exposureHelps establish doses for subchronic studies
• Subchronic systemic toxicityRepeated‐dose, typically 28 and 90 daysOrgan specific effectsEstablish NOAEL and LOAELRegulatory implications FDA and EPA
• Chronic systemic toxicity

The Goal is to Predict Human Systemic Toxicity
What data are required for risk assessmentNOAEL, LOAELRfD, Benchmark dose
Ideally
Realistically
Predicts Toxicity
Predicts NOAEL

Proprietary to CeeTox, Inc.
Building an In Vitro Model to Predict Repeat Dose Systemic Toxicity is Too Complex to Achieve Within the Next 10 Years!
Most models focus on predicting organ specific toxicity
Alternative approach isto identify a plasma concentrationthat results in general systemic toxicity
BARRIER to SUCCESS
Focus on the type of data neededto make decisions

What data are required from an in vitro method in order to makedecisions on systemic toxicity?
Minimum dose that results in toxicityMaximally tolerated dosePlasma concentration that results in toxicityLOAELNOAELMargin of Safety
In Vitro Models Should Provide Data That Can be Used to Make Decisions

Defining a Working Hypothesis
If the in vivo (animal) plasma concentration versus time and toxicity curves can be related to In vitro concentration versus toxicity response curves for a large number of compounds, then a relationship between the animal response data and the in vitro response data can be explained mathematically.

Relating Plasma Concentration to Toxicity
Start with pharmaceuticals• Intended for internal exposure at higher doses for shorter time
• Environmental chemicals typically not intended to be ingested, exposure to lower doses, but for longer times
Develop a means to estimate the plasma concentration where general toxicity would occur• Develop a relationship between concentration response curves in vitro and
Cmax in vivo at the dose where toxicity was observed in rat 14-day repeated oral dose studies Clinical chemistry Histopathology

The Relationship Between In Vivo Plasma Concentration (Bioavailability) and Toxicity Provides the Basic Model
Proprietary to CeeTox, Inc.
Toxicity increases with potency = target Cell models that lack target show toxicity = chemistry
JL Stevens (2006) Chem Res Toxicol 19, 1393‐1401
In vivo and In vitro data

Acquired in vivo data for pharmacokinetic parameters
Developed concentration response data in vitro
Based on multiple endpoint analysis developed a relationship between in vivo and in vitro data sets
Test the model with small number of drugs
Validate model in large blinded study
Evaluate relevance of method for determining effects in humans
Building the Predictive Model Based on Empirical Data Sets

Biochemical FunctionMembrane IntegrityMitochondrial FunctionCell ProliferationRedox‐StateOxidative StressApoptosis
Focus on Cell Biology and Physical Chemical Properties Improves the Model
Physical-Chemical PropertiesSolubilityPartition coefficientsPkaProtein bindingMetabolic stabilityMetabolic activationTransporter interactionPharmacology
CNS receptorsCardiovascular receptors and ion channels
Pharmacokinetic ParametersClearanceBioavailabilityVolume of distribution

Pharmacokinetic Data are Essential for Building In Vitro Models That Have In Vivo Relevance
Metabolic stability Clearance Absorption Protein binding (Kd = on vs off kinetics) Metabolic activation Bioavailability Volume of distribution

Selecting a Cell Model That Consistently Provides Accurate Data
Rat hepatoma (H4IIe) Cell line• Retains oxidative metabolism• Low constitutive metabolism• Accepts a wide range of serum concentrations
• Human hepatocyte model (HepaRG)

Determining the Relationship Between In VitroConcentration-Response and In Vivo Plasma Levels
Multiple endpoints improve interpretation• Membrane integrity• Cell number or mass• Mitochondrial function
Analysis and comparison to in vivo plasma Cmax/AUC
Development of weighting factors for each endpoint Result was an estimate of the plasma concentration where
toxicity would be expected to occur (Ctox)

Multiple Endpoints Are Essential For Correct Interpretation of In Vitro Data
CMPD H4IIE 24HR 20050817
0
20
40
60
80
100
120
140
1 10 100 1000
FIG. A: Exposure Concentration (µM)
% C
ontr
ol
Cell#MemToxMTTATPGSH

Important Take Home Points
Multiple endpoints based on cellular function are important
Understanding the cell model
Knowing what each assay is actually measuring

Determining Weighting Factors
Membrane integrity• Highest weight = cell death• Concentration response and potency• Time adjustment
Mitochondrial function• Moderate weighting• Concentration response and potency• Time adjustment

Evaluating Assumptions Against Rat In Vivo Data
0
20
40
60
80
100
0 20 40 60 80 100 120Predicted Concentration (uM)
R2 = 0.85
Keto (rat)
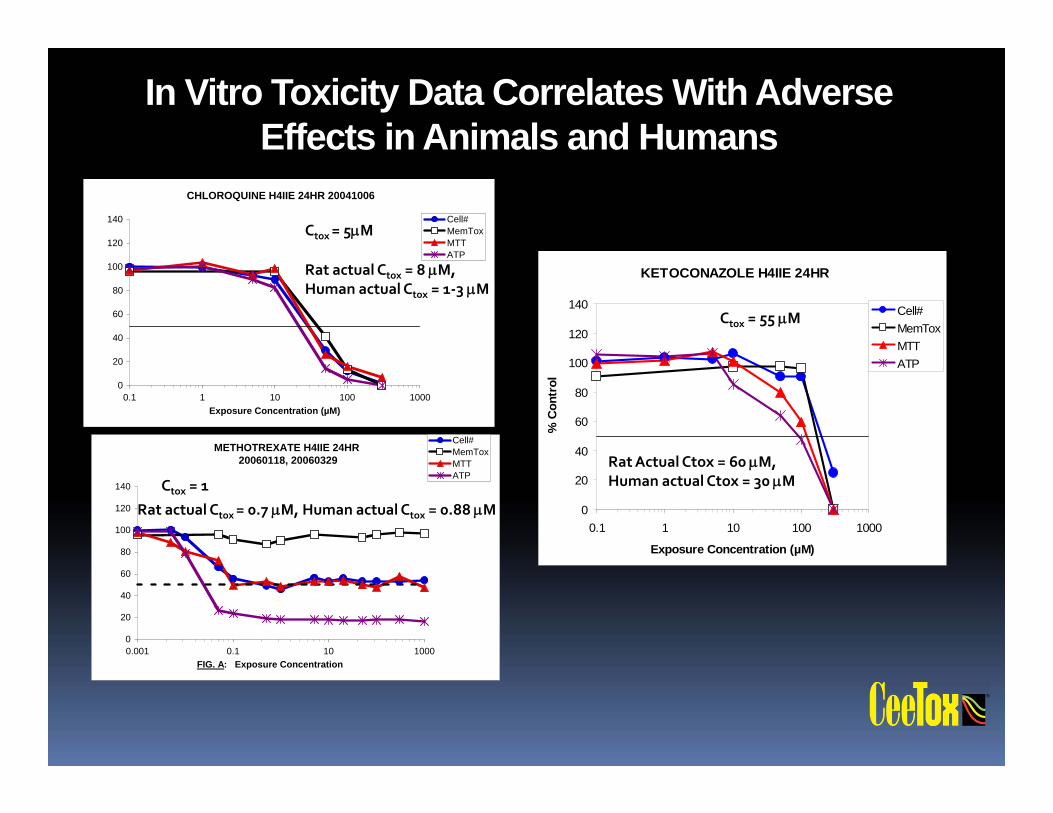
In Vitro Toxicity Data Correlates With Adverse Effects in Animals and Humans
CHLOROQUINE H4IIE 24HR 20041006
0
20
40
60
80
100
120
140
0.1 1 10 100 1000Exposure Concentration (µM)
Cell#MemToxMTTATP
METHOTREXATE H4IIE 24HR 20060118, 20060329
0
20
40
60
80
100
120
140
0.001 0.1 10 1000FIG. A: Exposure Concentration
Cell#MemToxMTTATP
Ctox = 1
Rat actual Ctox = 0.7 M, Human actual Ctox = 0.88 M
Ctox = 5M
Rat actual Ctox = 8 M,Human actual Ctox = 1‐3 M
KETOCONAZOLE H4IIE 24HR
0
20
40
60
80
100
120
140
0.1 1 10 100 1000
Exposure Concentration (µM)%
Con
trol
Cell#MemToxMTTATP
Rat Actual Ctox = 60 M, Human actual Ctox = 30 M
Ctox = 55 M

Proprietary to CeeTox, Inc.
Velcade is an Approved Drug With High In Vitro Toxicity?
0
20
40
60
80
100
120
140
0.001 0.1 10 1000
FIG. A: Exposure Concentration (µM)
% C
ontr
ol
Cell#MemToxMTTATPBrDU
0
20
40
60
80
100
120
140
1 10 100 1000
FIG. A: Exposure Concentration (µM)
% C
ontr
ol
Cell#MemToxMTTATPBrDU
Low Concentration24 hr Exposure
High Concentration24 hr Exposure

Proprietary to CeeTox, Inc.
In Rat Primary (non-dividing) Hepatocytes Velcade Has Low Toxicity
VELCADE (LOW) RAT HEPATOCYTE 24HR20061205
0
20
40
60
80
100
120
140
0.001 0.1 10 1000
FIG. A: Exposure Concentration (µM)
% C
ontr
ol
Cell#MemToxMTTATPWST-1

Proprietary to CeeTox, Inc.
Protein Binding Affinity Can Impact Toxicity
CMPD1 H4IIE 48HR 20% SERUMHIGH DOSE
0
20
40
60
80
100
120
140
100 1000 10000
Exposure Concentration (µM)
% C
ontr
ol
Cell#MemToxMTTATP
CMPD1 H4IIE 48HR 10% SERUMHIGH DOSE
0
20
40
60
80
100
120
140
100 1000 10000
Exposure Concentration (µM)
% C
ontr
ol
Cell#MemToxMTTATP
CMPD1 H4IIE 48HR 5% SERUMHIGH DOSE
0
20
40
60
80
100
120
140
100 1000 10000
Exposure Concentration (µM)
% C
ontr
ol
Cell#MemToxMTTATP

Proprietary to CeeTox, Inc.
Metabolic Stability is Key for Correct Interpretation of In Vitro Data
TERFENADINE H4IIE 24HR 20040728
0
20
40
60
80
100
120
140
0.1 1 10 100 1000
Exposure Concentration (µM)
% C
ontr
ol
Cell#MemToxMTTATP
TERFENADINE H4IIE 6HR 20040929
0
20
40
60
80
100
120
140
0.1 1 10 100 1000
Exposure Concentration (µM)
% C
ontr
ol
Cell#MemToxMTTATP
Considered safe in IND enabling safety studiesConsidered safe in clinical trialsWhy is it toxic in vitro?

Proprietary to CeeTox, Inc.
Importance of Metabolic Stability for Identifying False Positives
Terfenadine is a prodrug Terfenadine undergoes first‐pass metabolism Primary metabolite is efficacious not toxic In Vivo blood levels of terfenadine are low

Metabolic Activation Identifies False Negative Results
Tacrine = liver Flutamide = liver Acetaminophen = liver
GSH Depletion relative to no drug control after 3.5 hr incubation with induced microsomes
0.020.040.060.080.0
100.0120.0140.0
No Drug Flutamide NEM Acetaminophen Tacrine
Test Article
% G
SH re
lativ
e
Full Reaction
-NADPH reaction

Determining Relevance to Human Systemic Toxicity
Proprietary to CeeTox, Inc.
max therapeutic [plasma] (log M)1e-8 1e-7 1e-6 1e-5 1e-4 1e-3
Cto
x (
M)
1
10
100
Azathioprine
Ctox = 5 MMTPC = 8 M In vitro margin of safety <= 1
McKim, J. M., Jr. "Building a tiered approach to in vitro predictive toxicity screening: a focus on assays with in vivo relevance." Comb ChemHigh Throughput Screen 13(2): 188‐206.

Azathioprine: Inhibits Purine Synthesis and Produces Toxicity Under Clinical Conditions
Proprietary to CeeTox, Inc.
AZATHIOPRINE H4IIE 24HR 20051012
0
20
40
60
80
100
120
140
1 10 100 1000
FIG. A: Exposure Concentration (µM)
% C
ontr
ol
Cell#MemToxMTTATP
AZATHIOPRINE H4IIE 24HR 20051012
0
20
40
60
80
100
120
140
1 10 100 1000
FIG. B: Exposure Concentration (µM)
GSH
% C
ontr
ol
0
10
20
30
40
50
8-Is
opro
stan
e (p
g/m
l)
GSHISO
AZATHIOPRINE H4IIE 24HR 20051012
0
100
200
300
400
500
1 10 100 1000
FIG. C: Exposure Concentration (µM)
Fluo
resc
ence
Uni
ts
Caspase 3
Extremely ToxicCtox = < 5 µM

There is Good Concordance Between Predicted Toxicity Validated to Rat Data and Human Clinical Data
max therapeutic [plasma] (log M)1e-8 1e-7 1e-6 1e-5 1e-4 1e-3
Cto
x (
M)
1
10
100
Azathioprine
Thioridazine

THIORIDAZINE H4IIE 24HR 20041006
0
20
40
60
80
100
120
140
0.1 1 10 100 1000Exposure Concentration (µM)
Cell#MemToxMTTATP
Ctox = 11 MMTPC = 6 M In vitro margin of safety = 1.83

Drug Potency Can Influence Plasma Concentration and Toxicity
max therapeutic [plasma] (log M)1e-8 1e-7 1e-6 1e-5 1e-4 1e-3
Cto
x (
M)
1
10
100
Paroxetine
Azathioprine
Thioridazine
Chloroquine
Valproic acid

Antidepressant Paxil (SSRI) Considered Safe Under Appropriate Use: Rare Incidences of Hepatotoxicity
Paroxetine H4IIE 24HR 20051108
0
20
40
60
80
100
120
140
1 10 100 1000FIG. A: Exposure Concentration
Cell#MemToxMTTATP
Ctox = 15 MMTPC = 0.3 M In Vitro Margin of Safety = 50
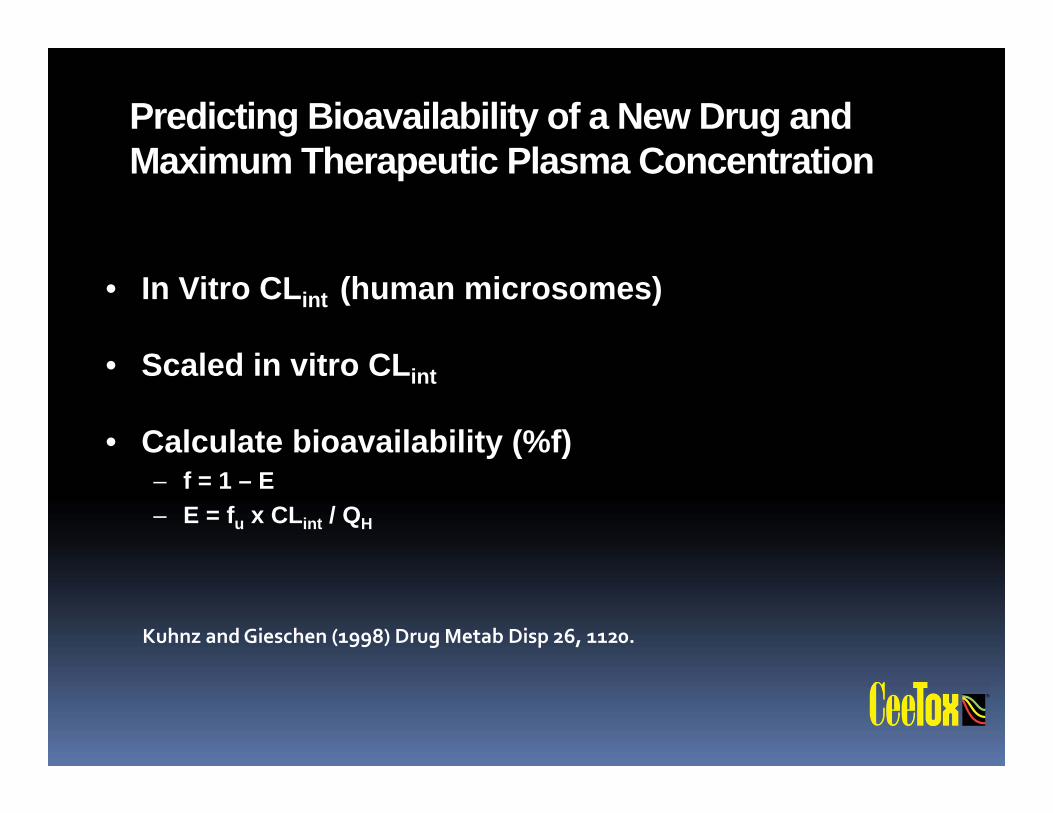
Predicting Bioavailability of a New Drug and Maximum Therapeutic Plasma Concentration
• In Vitro CLint (human microsomes)
• Scaled in vitro CLint
• Calculate bioavailability (%f)– f = 1 – E– E = fu x CLint / QH
Kuhnz and Gieschen (1998) Drug Metab Disp 26, 1120.

What is Systemic Toxicity and What do We Want From Alternative Methods?
Toxicity that occurs after a chemical is absorbed into general circulation Acute systemic toxicity Single dose, and short exposure time Intrinsic toxicity of a chemical, LD50, organ effects
Subacute systemic toxicity Repeated‐dose study, typically 14 day Information on toxicity following repeated exposure Helps establish doses for subchronic studies
Subchronic systemic toxicity Repeated‐dose, typically 28 and 90 days Organ specific effects Establish NOAEL and LOAEL Regulatory implications FDA and EPA
Chronic systemic toxicity

Predicting a Rat Acute Oral LD50 Dose
Collaborative research effort with LOREAL Paris Integrative or systems biology + Computational
Toxicology• Multiple endpoints related to cell health• Receptor binding data (pharmacology)• Physical Chemical parameters• Approach has been evaluated with more than 200
chemicals• Posters at the World Congress in Rome 2009, SOT 2010
Results show that an integrated in vitro approach can provide good estimates of an LD50

Acute Toxicity
Cat. 1 Cat. 2 Cat. 3 Cat. 4 Cat. 5
Oral(mg/Kg)
< 5 >5 < 50
> 50< 300
> 300< 2000
Safe>2000
Global Harmonization System for Acute Toxicity
Acute Toxicity
Cat. 1‐2‐3 Cat. 4 Cat. 5
Oral(mg/Kg)
< 300 >300< 500
> 2000
Standard Categories
Revised Categories

Addition of Pharmacology and Physical Chemistry Properties Improves Model Performance
Performance of the standard model at the LD50 threshold of 500 mg/kg
Performance of the integrated model at the LD50 threshold of 500 mg/kg
REDUCTION OF THE FALSE NEGATIVE RATE (yellow area)
Note, R et al. 2010 Presented at the World Congress on Alternatives to Animal Testing Montréal, August 2011

An In Vitro Acute LD50 Toxicity Model for Cosmetic Industry
Note, R et al. 2010 Presented at the World Congress on Alternatives to Animal Testing Montréal, August 2011,

Application of the Optimized Version of the In Vitro Acute LD50 Assay
Early screening with specific LD50 thresholds: case 1
Classification and labeling purposes (GHS categorization): case 2&3
Change current classification systems for acute oral toxicity as suggested in the final document of the FP6 AcuteToxprogram: case 3

Conclusions
It is currently possible to predict in vivo toxicity (animals) with a cell‐based model
Approach includes functional endpoints for cell health, physical and chemical and pharmacokinetic properties
Models are based initially on plasma concentrations that result in toxicity
High level of concordance with in vivo toxicity
An acute LD50 can be determined

Future Improvements to the Model
Develop a drug/chemical database with animal 28 or 90 day data, in vitro toxicity data, chemical properties
Determine a calculation for NOAEL in humans
Broaden the chemical space

CeeTox Overview of Services
Systemic Toxicity Services– CTOX Panel®‒ Acute Toxicity Screen
In vitro LD50 (acute tox)
Dermal Toxicity Percutaneous Absorption Corrosion Irritation Sensitization Photo Toxicity
Ocular Toxicity
Endocrine Disruption Estrogen receptor (ER) binding Estrogen transcriptional activation Androgen receptor (AR) binding Steroidogenesis Aromatase
Organ Specific Toxicity Models– Heart (CardioTox®) Kidney Liver
CYP Induction/Inhibition
Drug / Drug Interaction Target / Pathway Assays
Acute Inflammatory Response Apoptosis Cell Proliferation Cell Viability Glutathione Homeostasis Hepatobiliary Toxicity Kidney Collecting Duct Toxicity Kidney Distal Tubular Toxicity Kidney Proximal Tubule Toxicity Lipidosis Membrane Integrity Metabolism Mitochondrial Function
… a wide range of in vitro toxicology and safety assessment services

Acknowledgments
CeeTox staff
EPA and ToxCast Program