development 143: doi:10.1242/dev.130211:...
TRANSCRIPT

DRACULA2 is a dynamic nucleoporin with a role in regulating the shade
avoidance syndrome in Arabidopsis.
Marçal Gallemí, Anahit Galstyan, Sandi Paulišić, Christiane Then, Almudena
Ferrández-Ayela, Laura Lorenzo-Orts, Irma Roig-Villanova, Xuewen Wang,
Jose Luis Micol, Maria Rosa Ponce, Paul F. Devlin, Jaime F. Martínez-García
SUPPLEMENTARY MATERIALS AND METHODS
Plant material
The PBL transgenic line (also called “Ws-21a”) was in Ws-2 background and
has been described previously (Kozma-Bognar et al., 1999). In this manuscript,
we rename this line as PBL (see Introduction) as it has been used as a control
in our experiments. The mutant dra2-1, originated in our screening, is in Ws-2
background, whereas T-DNA lines in DRA2 are in Col-0 ecotype: dra2-2
(SALK_017077), dra2-3 (SALK_067219), dra2-4 (SALK_015016) and dra2-5
(SAIL_663_D07). Mutant tcu1-1 (in Ler background), tcu1-2/nup58-2
(SALK_099638), tcu1-4 (SAIL_655_C09), nup54-1 (SALK_106346), nup54-2
(SALK_015252), nup62-1 (SALK_037337), and nup62-2 (SAIL_127_F01) have
been described before (Ferrandez-Ayela et al., 2013). Mutant lines sar1-4
(SALK-126801), sar3-1 and sar3-3 (SALK_109959) are in Col-0 background
and have been described previously (Parry et al., 2006; Parry, 2014).
Development 143: doi:10.1242/dev.130211: Supplementary information
Dev
elo
pmen
t • S
uppl
emen
tary
info
rmat
ion

Genetic analyses and positional cloning of the dra2-1 mutation
For genetic analyses, dra2-1 was crossed to the PBL or Ws-2 line to
reduce the number of second-site mutations. Seedlings with the dra2-1
phenotype (long hypocotyl) were counted in the segregating F2 generation to
determine the nature of the mutation. For the positional cloning of the DRA2
gene, we outcrossed the dra2-1 (in the Ws-2 genetic background) to the Col-0
accession. The F2 seeds were sown on GM- plates, stratified as usual and
grown for 7 days under W. Seedlings showing the elongated hypocotyl
phenotype caused by dra2-1 (Figure 1B) were transferred into individual pots
and grown up in the greenhouse. Around 100 mg of rosette leaves from each
individual F2 plant, the corresponding F1 plant and the two parental lines (PBL,
in a Ws-2 background, and Col-0) was harvested for linkage analyses. These
analyses were performed using fluorescently labelled oligonucleotides, as
described (Ponce et al., 1999; Ponce et al., 2006). In brief, for low-resolution
mapping, DNA of 50 F2 phenotypically mutant plants was individually extracted
and used as a template to multiplex PCR co-amplify 26 SSLP and In/Del
molecular markers that were found polymorphic between Ws-2 and Col-0. For
fine mapping, 121 additional F2 plants were used to iteratively assess linkage
between dra2-1 and SSLP, SNP and In/Del molecular markers developed
according to the polymorphisms between Ler and Col-0 described at the
Monsanto Arabidopsis Polymorphism Collection database
(http://www.arabidopsis.org), not all of which were found polymorphic between
Ws-2 and Col-0. Synthetic oligonucleotides for fine mapping are described
below.
Development 143: doi:10.1242/dev.130211: Supplementary information
Dev
elo
pmen
t • S
uppl
emen
tary
info
rmat
ion

For sequencing of dra2-1 mutation, genomic DNA from Ws-2 and dra2-1
plants was extracted and PCR amplified with oligonucleotides shown below.
PCR products spanning the At1g10390 transcription unit were sequenced, as
described (Barrero et al., 2007).
High Resolution Mapping
Marker Name (Position)
Oligonucleotides
position sequences (5→3)
cer458005
(At1g10560-At1g10570)
Forward CTA-GTT-GAA-GTC-GCA-AAA-TGT-TG
Reverse GAC-TAA-TAG-CAT-GCT-TCC-AAT-TC
cer465532
(At1g10640-At1g10650)
Forward CAT-TAC-ACT-AGA-GAC-TAG-AC
Reverse TAA-TAT-ACA-TGT-GAG-CAT-CCT-
GAC
F16J7-TRB
(At1g11370)
Forward GTG-TCT-TGA-TAC-GCG-TCG-ATC
Reverse TGA-TGT-TGA-GAT-CTG-TGT-GCA-G
JV28/29
(At1g11730-At1g11735)
Forward GAT-ACT-CCT-GTT-TCA-CAT-ATA-TG
Reverse GAG-AGT-CCT-TAT-TGT-TGT-GCC
JV26/27
(At1g11905)
Forward CAT-TCA-AGA-GAT-TGC-AAC-ATC-C
Reverse GGG-TAA-GCT-CCT-TGG-ATC-CG
Candidate gene (At1g10390) sequencing
Name Oligonucleotide sequences (5→3)
At1g10390-F1 CCG-TGA-AGA-TGC-CCT-AAA-TTC
At1g10390-R1 GGA-GCA-AAG-GGA-TTA-TTA-CTA C
At1g10390-F2.1 CTT-GTT-GGT-TTC-CGA-AGC-CAA
At1g10390-R2 CGC-ACC-AAA-AGA-AGG-AGT-ACT-AGA
At1g10390-F2.2 GGT-GCC-ACT-AAC-ACG-CCT-G
At1g10390-F3 GTA-GCA-CTG-GCA-CCA-CGT-TT
At1g10390-R3 GGT-GAT-GGT-GTC-GTT-GTT-CC
At1g10390-F4 CGA-GCT-CAA-CAT-CTA-CCA-ACC
At1g10390-R4 GTA-TGG-GAG-TTG-CAG-AAG-GAA-G
Development 143: doi:10.1242/dev.130211: Supplementary information
Dev
elo
pmen
t • S
uppl
emen
tary
info
rmat
ion

At1g10390-F5 GTT-GTG-TTA-TTT-TAG-CTT-CAT-CG
At1g10390-R5 GTC-CGA-GAA-TTT-CCA-CAC-ATA-G
At1g10390-F6 CTT-GAT-TAC-TCT-GCG-TGT-GAG
At1g10390-R6 TGG-CAA-CTG-TTA-CTC-TAC-TCG
Oligonucleotides used for genotyping mutant lines
For genotyping the different mutant plants used in this study, specific
oligonucleotide combinations were used to genotype them by PCR analyses:
DRA2 (JO402 + JO403, GO76 + MGO6, MGO7 + GO75, GO74 + GO75, and
GO96 + GO75), dra2-1 (GO97 + GO75), dra2-2 (JO402 + LBb1), dra2-3 (LBb1
+ GO75), dra2-4 (GO76 + LBb1), dra2-5 (MGO7 + LB3), SAR1 (MGO24 +
MGO25), sar1-4 (MGO24 + LBb1), SAR3 (GO104 + GO106 and GO107 +
GO108), sar3-1 (GO105 + GO106), sar3-3 (LBb1 + GO108), TCU1 (GO78 +
GO79), tcu1-2 (LBb1 + GO79), tcu1-4 (GO78 + LB3), NUP54 (GO80 + GO81,
GO82 + GO83), nup54-1 (LBb1 + GO81), nup54-2 (GO82 + LBb1), NUP62
(GO84 + GO85, and MGO10 + MGO5), nup62-1 (GO84 + LBb1) and nup62-2
(MGO10 + LB3).
Name Oligonucleotide sequences (5→3)
JO402 GGT-CGA-AGA-ACG-TGT-GTC-C
JO403 GGT-ACC-AGA-TGA-CTG-TCC
GO74 CAC-TGA-TGA-CGA-AGA-GAG
GO75 CCA-TAA-CCG-TGT-CGT-CCC
GO76 GAT-CTT-CTG-GTT-TTG-GGC-AG
GO78 CCA-AAT-TTG-TTA-AAA-TGT-G
GO79 ACG-ATA-TAC-TCC-ACA-AAC
GO80 CCA-ATG-TTC-GGC-ACT-CCG
GO81 CAT-CTG-ATA-CAG-CTG-CAG-GC
Development 143: doi:10.1242/dev.130211: Supplementary information
Dev
elo
pmen
t • S
uppl
emen
tary
info
rmat
ion

GO82 CTT-CAG-AGA-CAT-TTG-CAA-GC
GO83 CTA-TGA-GTC-TAG-TGC-CAT-TTC
GO84 GAT-TAT-CAA-GGA-GTG-GAA-TAC
GO85 CAT-TGC-ATC-TCT-AGT-TGA-TAC
GO96 ATA-CGC-CCA-GTT-CAA-CAG-TGG
GO97 ATA-CGC-CCA-GTT-CAA-CAG-TGA
GO104 CAA-TGT-TGT-TGA-TGC-AGC-ATT
GO105 CAA-TGT-TGT-TGA-TGC-AGC-ATA
GO106 TTC-ACA-TCC-TGC-ATC-ACG-TC
GO107 GTA-GAA-CTG-GTA-TGT-CTA-CGT
GO108 CTG-TTT-TAC-TAA-GCT-GAG-ATT-TGG
MGO5 CTT-ATC-AAG-ACA-TCC-AGT-GC
MGO6 CCA-AAA-GCT-GGA-GAC-GAG-CC
MGO7 CCT-GCT-CCG-CTG-AAC-TCT-GTT-G
MGO10 AGC-GCA-CAG-GGA-GAT-TCC-GG
MGO24 CCA-AGT-ATT-TTA-GAT-GGT-TCT-ACG
MGO25 GGT-AGA-TGT-CCA-TCA-CTG-AGG
LBb1 GCG-TGG-ACC-GCT-TGC-TGC-AAC-T
LB3 TAG-CAT-CTG-AAT-TTC-ATA-ACC-AAT-CTC-GAT-ACA-C
Cosegregation analyses of dra2-1 and the mutant-like phenotype.
Seedlings from the F2 generation derived from the dra2-1 x Ws-2 cross
were grown under continuous W for 7 days. Six pools of 5-6 seedlings each
were selected, three displaying wild-type (w1, w2 and w3) and three mutant
(m1, m2, and m3) phenotypes. Genomic DNA was extracted from the pools and
PCR, using specific oligonucleotides, was employed to genotype the DRA2
(GO96 + GO75) and dra2-1 (GO97 + GO75) alleles, that were separated in a
1% (w/v) agarose gel electrophoresis (Figure S1F).
Development 143: doi:10.1242/dev.130211: Supplementary information
Dev
elo
pmen
t • S
uppl
emen
tary
info
rmat
ion
Complementation of the dra2-1 phenotype with DRA2-GFP
Transgenic lines overexpressing a translational fusion of DRA2 to the
GREEN FLUORESCENT PROTEIN (GFP) marker gene (35S:DRA2-GFP lines)
were generated in the Ws-2 background (Figure S2B). Although no GFP activity
was detected in any independent transgenic line, some displayed a subtle
phenotype (mildly curly and wavy leaves, Figure S2D), suggesting that low
levels of transgenic protein were produced. One of these 35S:DRA2-GFP
transgenic plants (line #01) was crossed to dra2-1, and F2 plants homozygous
for dra2-1 and hemizygous for the transgene were isolated (Figure S2C). In
their selfed F3 progeny, only a fourth of the seedlings were phenotypically
mutant, indicating that DRA2-GFP complements in a dose-dependent,
recessive manner the loss of function caused by dra2-1 (Figure 1D).
Analysis of hypocotyl length of nup62-1 seedlings
We noticed that only homozygous nup62-1 (i.e., not homozygous nup62-
2) plants were sterile and produced no seeds in our growing conditions. To
analyze the hypocotyl elongation of homozygous nup62-1, about 50 seeds
produced by heterozygous nup62-1/+ adult plants (confirmed by PCR
genotyping) were sown in parallel with wild-type (Col-0) seeds, grown as a
control. Simulated shade experiments were performed as indicated, and 10-20
mutant-like (i.e., displaying long hypocotyls and cotyledons curled downwards
under both light treatment) and wild-type seedlings were selected from both W
and W+FR treated plates (day 7) (Figure S4E). This experiment was repeated 3
times giving similar results. Previously, we demonstrated that the selected
mutant-like seedlings were genotyped as homozygous nup62-1.
Development 143: doi:10.1242/dev.130211: Supplementary information
Dev
elo
pmen
t • S
uppl
emen
tary
info
rmat
ion
Generation of plants that overexpress full length DRA2 in plants
To generate a construct to overexpress DRA2 fused to GFP under the
control of the 35S promoter (35S:DRA2-GFP) the following overall cloning
strategy was implemented: (1) DRA2 full-length coding sequence (3125 bp) was
split up into two fragment named as DRA2n (covering from 1 to 1360 bp) and
DRA2c (covering from 1361 to 3126 bp). (2) Both fragments were subcloned
into a commercial cloning vector (pCRII-TOPO, www.invitrogen.com). They
were sequenced to confirm their identity. (3) DRA2c was fused to GFP by
subcloning it into a binary vector (pCAMBIA1302). (4) DRA2n was fused in front
of DRA2c using the plasmid generated 35S:DRA2c-GFP in the previous step.
As a result, the construct re-established the original full-length cDNA of DRA2
fused to GFP was under the 35S promoter in the pCAMBIA1302-based binary
vector.
To subclone the DRA2n fragment, the respective coding sequence was
PCR-amplified with CTO4 (5´-ggc-cat-ggT-TGG-CTC-ATC-TAA-TCC-TTT-TG-
3’, which introduced an NcoI site and an additional Ala after the Met, that is not
present in the original protein) and CTO5 (5´-ggg-cta-gcA-ATT-GTT-GGG-GTT-
TGA-G-3´, which introduced an NheI site) oligonucleotide combination using
cDNA from Col-0 Arabidopsis plants as a template [sequences corresponding to
the original coding regions are indicated in uppercase, added sequences are
indicated in lowercase and introduced restriction sites used for cloning are
underlined]. The corresponding PCR product, flanked by NcoI and NheI
restriction sites, was directionally subcloned into pCRII-TOPO to give pCT6.
The pCT6 insert was sequenced to confirm its identity. To subclone the DRA2c
Development 143: doi:10.1242/dev.130211: Supplementary information
Dev
elo
pmen
t • S
uppl
emen
tary
info
rmat
ion

fragment and to facilitate its fusion to GFP, the original stop codon was
removed and the respective coding sequence was PCR-amplified with CTO6
(5´-gga-cta-gtT-CGA-GTT-TTG-GAA-CGG-3´, which introduced an SpeI site)
and CTO8 (5’-ggt-cta-gAA-ACT-CCA-TCT-TCT-TCA-TCT-TCG-TCG-C-3´,
which introduced an XbaI site) oligonucleotide combination using cDNA from
Col-0 Arabidopsis plants as a template. The corresponding PCR product,
flanked by SpeI and XbaI restriction sites, was directionally subcloned into
pCRII-TOPO to give pCT7. The pCT7 insert was sequenced to confirm its
identity. Non-silent point mutations were found in the DRA2c fragment of pCT7
insert in all the generated clones; these mutations were always located after an
internal BamHI site. To replace the erroneous final part of DRA2c, a smaller C-
terminal fragment DRA2 was PCR-amplified with GO96 and CTO8
oligonucleotide combination using cDNA from Col-0 Arabidopsis plants as a
template. The corresponding PCR product was directionally subcloned into
pCRII-TOPO to give pCT11. The pCT11 insert was sequenced to confirm its
identity and no mutations were found in between the internal BamHI and the C-
terminal XbaI sites. Next, to generate the recomposed DRA2c fragment, pCT11
and pCT7 plasmids were digested with BamHI. Plasmid pCT11, containing the
correct coding sequence of the final part of the DRA2c between BamHI-XbaI
sites, was used as a vector. Fragment from pCT7, containing the correct coding
sequence of the first part of the DRA2c between its SpeI-BamHI sites, was used
as an insert. The resulting plasmid, pCT29, was equivalent to pCT7 containing
the recomposed SpeI-XbaI insert of the DRA2c fragment. Next, the SpeI-XbaI
fragment of pCT29 was subcloned into the binary vector pCAMBIA1302
digested with SpeI to give the pCT8 (35S:DRA2c-GFP). Finally, the NcoI-NheI
Development 143: doi:10.1242/dev.130211: Supplementary information
Dev
elo
pmen
t • S
uppl
emen
tary
info
rmat
ion

fragment of pCT6 was subloned into pCT8 digested with SpeI, which gave
pCT9 (35S:DRA2-GFP), that allows to overexpress full-length DRA2 fused to
GFP (35S:DRA2-GFP).
The binary plasmid pCT9 was used to transform Arabidopsis Ws-2 plants
via Agrobacterium tumefaciens by the floral dip method (Clough and Bent,
1998). The resulting transgenic plants (named as pCT34) were selected as
hygromycin resistant. Only lines with a single T-DNA insertion (as estimated
from the segregation of the marker gene in T2 populations) were eventually
selected.
Generation of plants that overexpress NtDRA2 in plants
To generate the construct to overexpress the NtDRA2 (M1-W781, 2.343
bp) fused to the GFP under the control of the 35S promoter (35S:NtDRA2-GFP)
the following strategy was used: (1) we used the DRA2n fragment from pCT6,
which covered from M1 to S456; (2) we clone the C-terminal part of NtDRA2,
covering from S457 to Q779, into the binary vector pCAMBIA1302; (3) the full
NtDRA2 was reconstituted by fusing the fragment from pCT6 into the binary
vector generated in step 2.
To generate the C-terminal part of NtDRA2 (977 bp), CTO6 and MGO36
(5’-ggt-cta-gaC-CAC-TGT-TGA-ACT-GGG-CGT-ATA-AC-TAG-AGC-3’, with
introduced XbaI site) oligonucleotides were used using pCT9 as a template.
The PCR fragment cloned on the pCRII-TOPO vector (named as pMG52) was
sequenced to confirm its identity. The SpeI-XbaI fragment from pMG52 was
cloned into pCAMBIA1302 digested with SpeI (construct pMG54). Finally, the
NcoI-NheI fragment from pCT6 was ligated into pMG54 digested with NcoI and
Development 143: doi:10.1242/dev.130211: Supplementary information
Dev
elo
pmen
t • S
uppl
emen
tary
info
rmat
ion

SpeI, to give pMG56 (35S:NtDRA2-GFP). The binary plasmid pMG56 was used
to transform Arabidopsis plants (Col-0 ecotype) as previously described. The
resulting transgenic plants were selected as hygromycin resistant. Only lines
with a single T-DNA insertion (as estimated from the segregation of the marker
gene in T2 populations) were eventually selected.
Generation of RNAi-DRA2 plants
To generate an RNAi construct to silence the endogenous DRA2, a
fragment of 318 bp was PCR-amplified using the primers GO96 and SPO1 (5’-
AAG-AGC-CTC-GAT-ATC-TGC-AC-3’) and the vector pCT9 as a template. This
DRA2 region was selected because it showed less similarity with DRAL (64.43
% of nucleotide identity) compared to the whole DRA2 and DRAL nucleotide
coding sequences (77.23 % identity); sequence comparison in this region
indicated that identical sequences had a maximum of 12 nucleotides in length,
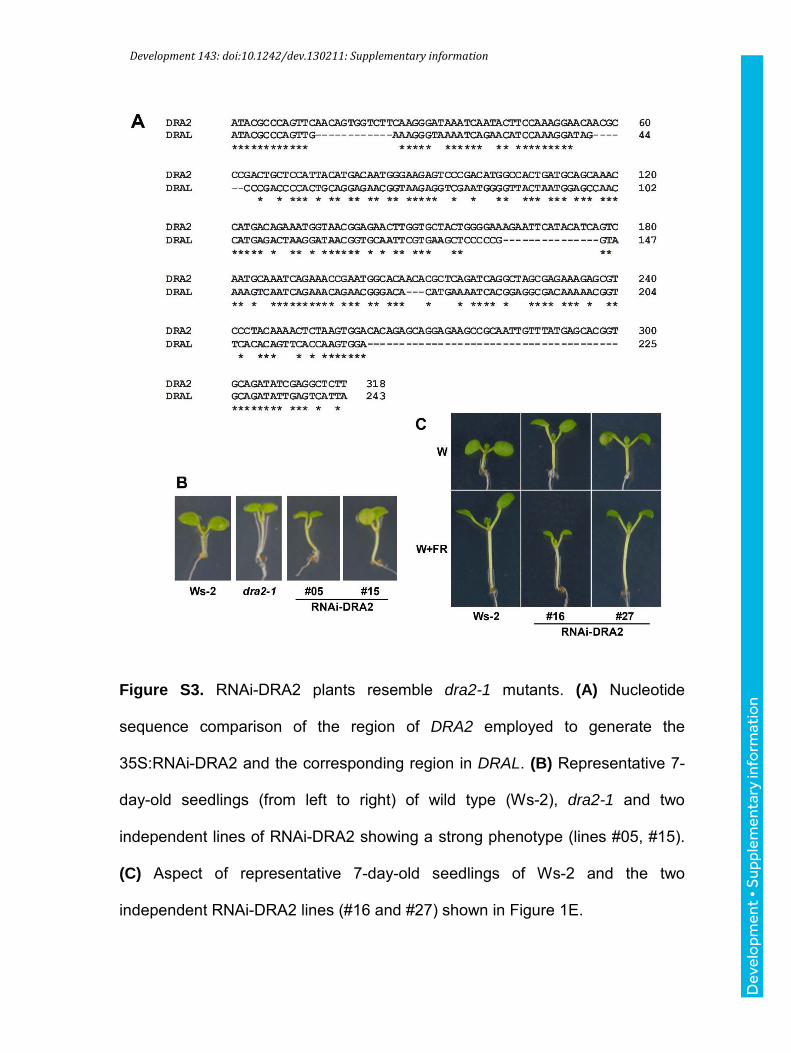
which likely prevented cross-silencing (Figure S3A). PCR product was
directionally subcloned into pCRII-TOPO to generate pSP30. The pSP30
fragment was sequenced to confirm its identity. A XhoI-BamHI fragment of
pSP30 was subcloned into the same sites of pENTR3C vector (Invitrogen),
flanked by the attL1 and attL2 sites, to give pSP31. Using the Gateway LR
Clonase II (Invitrogen), in vitro recombination with pHELLSGATE12 destination
vector (Wesley et al., 2001), containing attR1 and attR2 sites, generated pSP32
(35S:RNAi-DRA2).
The binary plasmid pSP32 was used to transform Arabidopsis Ws-2
plants via Agrobacterium using the floral dip method (Clough and Bent, 1998).
The resulting transgenic plants were selected as kanamycin resistant.
Development 143: doi:10.1242/dev.130211: Supplementary information
Dev
elo
pmen
t • S
uppl
emen
tary
info
rmat
ion
Generation of constructs to visualize DRA2 in plants
Because no GFP activity was detected in any independent transgenic
line overexpressing DRA2-GFP, a construct to overexpress a triple fusion GFP-
DRA2-GFP under the control of the 35S promoter (35S:GFP-DRA2-GFP) was
generated. The GFP ORF was PCR-amplified using the primers SPO40 (5’-
GGC-CAT-GGT-AGA-TCT-GAC-TAG-TAA-3’, which introduced an NcoI site)
and SPO41 (5’-GGC-CAT-GGA-CAC-GTG-GTG-GTG-GTG-G-3’, which
introduced an NcoI site) and the vector pCAMBIA1302 as a template. The PCR
product was subcloned into pCRII-TOPO to generate pSP76, whose insert was
sequenced to confirm its identity. A NcoI fragment of pSP76 was directionally
cloned into the same site of pCT9 to give pSP77 (35S:GFP-DRA2-GFP). This
construct was used to transiently express the protein in leaves of Nicotiana
benthamiana.
RNA blot analyses
Total RNA was isolated from seedlings, separated by electrophoresis (10
µg) and blotted as indicated elsewhere (Roig-Villanova et al., 2006). Probe for
At1g10390 (DRA2) was made by amplifying Col-0 genomic DNA with specific
oligonucleotides GO76 (sequence shown above) and GO77 (5’-CAT-TGT-TTG-
TCC-AAA-GGG-AG-3’). PCR product was subcloned into pCRII-TOPO to give
pMG30. Insert was sequenced for identity confirmation. DNA inserts, isolated by
PCR using specific oligonucleotides, were radioactively labeled and purified as
indicated elsewhere (Sorin et al., 2009). Hybridization, washes and exposure
were carried out as described (Roig-Villanova et al., 2006). Images were
Development 143: doi:10.1242/dev.130211: Supplementary information
Dev
elo
pmen
t • S
uppl
emen
tary
info
rmat
ion

visualized by using a Molecular Imager FX (Bio-Rad, www.bio-rad.com).
Expression levels were normalized with the 25S rRNA signal.
Oligonucleotides used for qPCR analyses
Gene name
and code Name, oligonucleotide sequences (5→3)
HFR1,
At1g02340
BO89, GAT-GCG-TAA-GCT-ACA-GCA-ACT-CGT
BO90, AGA-ACC-GAA-ACC-TTG-TCC-GTC-TTG
PIL1,
At2g46970
BO87, GGA-AGC-AAA-ACC-CTT-AGC-ATC-AT
BO88, TCC-ATA-TAA-TCT-TCA-TCT-TTT-AAT-TTT-GGT-
TTA
PHYB,
At2g18790
MGO16, GCG-ACC-ATT-GTC-AAC-TGC-TAG-T
MGO17, GAG-CTG-AGC-TGA-ACG-CAA-AT
LUC,
no code
MGO18, GCT-GGA-AGA-TGG-AAC-CGC-T
MGO19, CCA-CCT-CGA-TAT-GTG-CAT-CTG-T
DRA2,
At1g10390
SPO17, CAC-CAA-CTG-TTG-AGG-CAG-ACA
SPO18, GGC-AGA-AAT-AGA-TTC-CAA-CTT-TCC
DRAL,
At1g59660
MGO46, ACG-GTG-CAA-TTC-GTG-AAG-CT
MGO47, TTT-TGT-CGC-CTC-CGT-GAT-TT
UBQ10,
At4g05320
BO40, AAA-TCT-CGT-CTC-TGT-TAT-GCT-TAA-GAA-G
BO41, TTT-TAC-ATG-AAA-CGA-AAC-ATT-GAA-CTT
Whole-mount in situ hybridization of polyA RNA
Plant material was mounted in water on glass slides. Poly(A) RNA in situ
hybridization was conducted essentially as described (Gong et al., 2005) with
minor modifications. Briefly, four 7-day-old seedlings at a similar developmental
stage were fixed and dehydrated as described (Gong et al., 2005). Two mL of
Hyb Plus hybridization buffer (Sigma-Aldrich; H-7033, www.sigmaaldrich.com)
was used for the hybridization with 15 pmol of 45-mer oligo(dT) labeled with one
Development 143: doi:10.1242/dev.130211: Supplementary information
Dev
elo
pmen
t • S
uppl
emen
tary
info
rmat
ion

molecule of fluoresceine at the 5'-end (synthesized by Sigma-Aldrich Company)
at 50ºC in darkness for more than 8 h. Washes were performed at 50ºC in
darkness, first with 2x SSC, 0.1 % (w/v) SDS (30 min) and then with 0.5x SSC,
0.1 % (w/v) SDS (5 min). After washing, samples were immediately observed
with confocal microscope. Fourteen to sixteen optical sections in 1.5 µm steps
were collected and projected with the LAS AF Lite software (Leica microscope).
Experiments were repeated at least twice with similar results.
Agroinfiltration in tobacco leaves
Nicotiana benthamiana plants were transiently transfected by
agroinfiltration with constructs to express DRA2-GFP, GFP-DRA2-GFP and/or
mCherry-ER proteins. mCherry-ER localizes in the endoplasmic reticulum
(construct C307). For the co-agroinfiltration (Figures 6, S8), equal volumes of
the Agrobacterium transformed cultures (the GFP derived construct and/or the
mCherry; and the strain expressing the HcPro protein) were mixed (Vilela et al.,
2013). Confocal observations were performed 3 days after infiltration. Ten
optical sections in 1.0 µm steps were collected and projected with the Olympus
Fluoview viewer software (Olympus microscope). Experiments were repeated at
least twice with similar results.
Microbombardments of leek epidermal cells
Transient expression of NtDRA2-GFP and dsRED constructs (Figure 5A)
was performed via co-bombardment with the corresponding DNA plasmids of
leek epidermal cells using a Biolistic PDS1000/He system (Bio-Rad) according
to the manufacturer's protocol. After bombardment, epidermal cells were
Development 143: doi:10.1242/dev.130211: Supplementary information
Dev
elo
pmen
t • S
uppl
emen
tary
info
rmat
ion

recovered on plates of GM- supplemented with 1% (w/v) sucrose for 12-18 h at
22ºC in the dark before analyzing with confocal microscope.
Accession numbers
Sequence data from this paper can be found in the Arabidopsis Genome
Initiative or GenBank/EMBL databases under the following accession numbers:
DRA2/NUP98A (At1g10390), DRAL/NUP98B (At1g59660), HFR1 (At1g02340),
NUP58/TCU1 (At4g37130), NUP54 (At1g24310), NUP62 (At2g45000), PHYB
(At2g18790), PIL1 (At2g46970), SAR1/NUP160 (At1g33410), and
SAR3/NUP96 (At1g80680).
SUPPLEMENTARY REFERENCES
Barrero, J. M., Gonzalez-Bayon, R., del Pozo, J. C., Ponce, M. R. and Micol, J.
L. (2007) 'INCURVATA2 encodes the catalytic subunit of DNA Polymerase
alpha and interacts with genes involved in chromatin-mediated cellular memory
in Arabidopsis thaliana', The Plant Cell 19(9): 2822-38.
Clough, S. J. and Bent, A. F. (1998) 'Floral dip: a simplified method for
Agrobacterium-mediated transformation of Arabidopsis thaliana', The Plant
Journal 16(6): 735-43.
Ferrandez-Ayela, A., Alonso-Peral, M. M., Sanchez-Garcia, A. B., Micol-Ponce,
R., Perez-Perez, J. M., Micol, J. L. and Ponce, M. R. (2013) 'Arabidopsis
TRANSCURVATA1 Encodes NUP58, a Component of the Nucleopore Central
Channel', PLoS One 8(6): e67661.
Development 143: doi:10.1242/dev.130211: Supplementary information
Dev
elo
pmen
t • S
uppl
emen
tary
info
rmat
ion

Gong, Z., Dong, C. H., Lee, H., Zhu, J., Xiong, L., Gong, D., Stevenson, B. and
Zhu, J. K. (2005) 'A DEAD box RNA helicase is essential for mRNA export and
important for development and stress responses in Arabidopsis', The Plant Cell
17(1): 256-67.
Kozma-Bognar, L., Hall, A., Adam, E., Thain, S. C., Nagy, F. and Millar, A. J.
(1999) 'The circadian clock controls the expression pattern of the circadian input
photoreceptor, phytochrome B', Proceedings of the National Academy of
Sciences, USA 96(25): 14652-7.
Parry, G. (2014) 'Components of the Arabidopsis nuclear pore complex play
multiple diverse roles in control of plant growth', J Exp Bot 65(20): 6057-67.
Parry, G., Ward, S., Cernac, A., Dharmasiri, S. and Estelle, M. (2006) 'The
Arabidopsis SUPPRESSOR OF AUXIN RESISTANCE proteins are
nucleoporins with an important role in hormone signaling and development',
The Plant Cell 18(7): 1590-603.
Ponce, M. R., Robles, P., Lozano, F. M., Brotons, M. A. and Micol, J. L. (2006)
'Low-resolution mapping of untagged mutations', Methods Mol Biol 323: 105-13.
Ponce, M. R., Robles, P. and Micol, J. L. (1999) 'High-throughput genetic
mapping in Arabidopsis thaliana', Mol Gen Genet 261(2): 408-15.
Roig-Villanova, I., Bou, J., Sorin, C., Devlin, P. F. and Martinez-Garcia, J. F.
(2006) 'Identification of primary target genes of phytochrome signaling. Early
transcriptional control during shade avoidance responses in Arabidopsis', Plant
Physiology 141(1): 85-96.
Sorin, C., Salla-Martret, M., Bou-Torrent, J., Roig-Villanova, I. and Martinez-
Garcia, J. F. (2009) 'ATHB4, a regulator of shade avoidance, modulates
hormone response in Arabidopsis seedlings', The Plant Journal 59(2): 266-77.
Development 143: doi:10.1242/dev.130211: Supplementary information
Dev
elo
pmen
t • S
uppl
emen
tary
info
rmat
ion

Vilela, B., Moreno-Cortes, A., Rabissi, A., Leung, J., Pages, M. and Lumbreras,
V. (2013) 'The maize OST1 kinase homolog phosphorylates and regulates the
maize SNAC1-type transcription factor', PLoS One 8(2): e58105.
Wesley, S. V., Helliwell, C. A., Smith, N. A., Wang, M. B., Rouse, D. T., Liu, Q.,
Gooding, P. S., Singh, S. P., Abbott, D., Stoutjesdijk, P. A. et al. (2001)
'Construct design for efficient, effective and high-throughput gene silencing in
plants', The Plant Journal 27(6): 581-90.
Development 143: doi:10.1242/dev.130211: Supplementary information
Dev
elo
pmen
t • S
uppl
emen
tary
info
rmat
ion

Development 143: doi:10.1242/dev.130211: Supplementary information
SUPPLEMENTARY FIGURES
Figure S1. Phenotypes and segregation analyses of dra2-1 plants. (A) Aspect
of representative 6-week-old adult PBL and dra2-1 plants grown under SD for 3
weeks and then transferred to LD for 3 additional weeks. (B) Detail of siliques of
the plants shown in B. Bar corresponds to 5 mm. (C) Aspect of representative
6-week-old adult PBL and dra2-1 seedlings grown under SD. (D) Length of
cotyledons and primary leaves (PL) of PBL and dra2-1 in response to W+FR.
Seeds were germinated and grown as indicated in Figure 1C. Different letters
denote significant differences (one-way ANOVA with Tukey test, P<0.05)
Dev
elo
pmen
t • S
uppl
emen
tary
info
rmat
ion

Development 143: doi:10.1242/dev.130211: Supplementary information
among means, and red asterisks indicate significant differences (two-way
ANOVA, **P<0.01) between the mutant and wild-type genotypes in response to
W+FR. ���%� Mutation found in the DNA sequence of the At1g10390 gene. The
predicted amino acid sequences are shown below. ���&� Cosegregation analyses
of the dra2-1 mutation and the mutant-like phenotype. Seedlings from the F2
generation of the dra2-1 x Ws-2 cross were grown under continuous W for 7
days. PCR products using specific oligonucleotides were subjected to a 1%
(w/v) agarose gel electrophoresis.
Dev
elo
pmen
t • S
uppl
emen
tary
info
rmat
ion

Development 143: doi:10.1242/dev.130211: Supplementary information
Figure S2. DRA2 corresponds to At1g10390 gene. (A) Map-based cloning
strategy. The molecular markers in chromosome 1 used for linkage analyses
are indicated. Some light-related genes at the top of chromosome 1 are also
indicated. (B) Mutant dra2-1 phenotype is complemented by the overexpression
of At1g10390. Cartoon describing the construct used to complement the dra2-1
mutant phenotype, named as 35S:DRA2-GFP. (C) Diagram shows the cross
Dev
elo
pmen
t • S
uppl
emen
tary
info
rmat
ion

Development 143: doi:10.1242/dev.130211: Supplementary information
performed between transgenic 35S:DRA2-GFP and mutant dra2-1 plants for
posterior analyses. (D) Aspect of representative 6-week-old adult Ws-2, dra2-1,
35S:DRA2-GFP and dra2-1;35S:DRA2-GFP plants grown under SD for 3
weeks and then transferred to LD for 3 additional weeks. All images are shown
to the same scale. Bar corresponds to 20 mm.
Dev
elo
pmen
t • S
uppl
emen
tary
info
rmat
ion
Development 143: doi:10.1242/dev.130211: Supplementary information
Figure S3. RNAi-DRA2 plants resemble dra2-1 mutants. (A) Nucleotide
sequence comparison of the region of DRA2 employed to generate the
35S:RNAi-DRA2 and the corresponding region in DRAL. (B) Representative 7-
day-old seedlings (from left to right) of wild type (Ws-2), dra2-1 and two
independent lines of RNAi-DRA2 showing a strong phenotype (lines #05, #15).
(C) Aspect of representative 7-day-old seedlings of Ws-2 and the two
independent RNAi-DRA2 lines (#16 and #27) shown in Figure 1E.
Dev
elo
pmen
t • S
uppl
emen
tary
info
rmat
ion
Development 143: doi:10.1242/dev.130211: Supplementary information
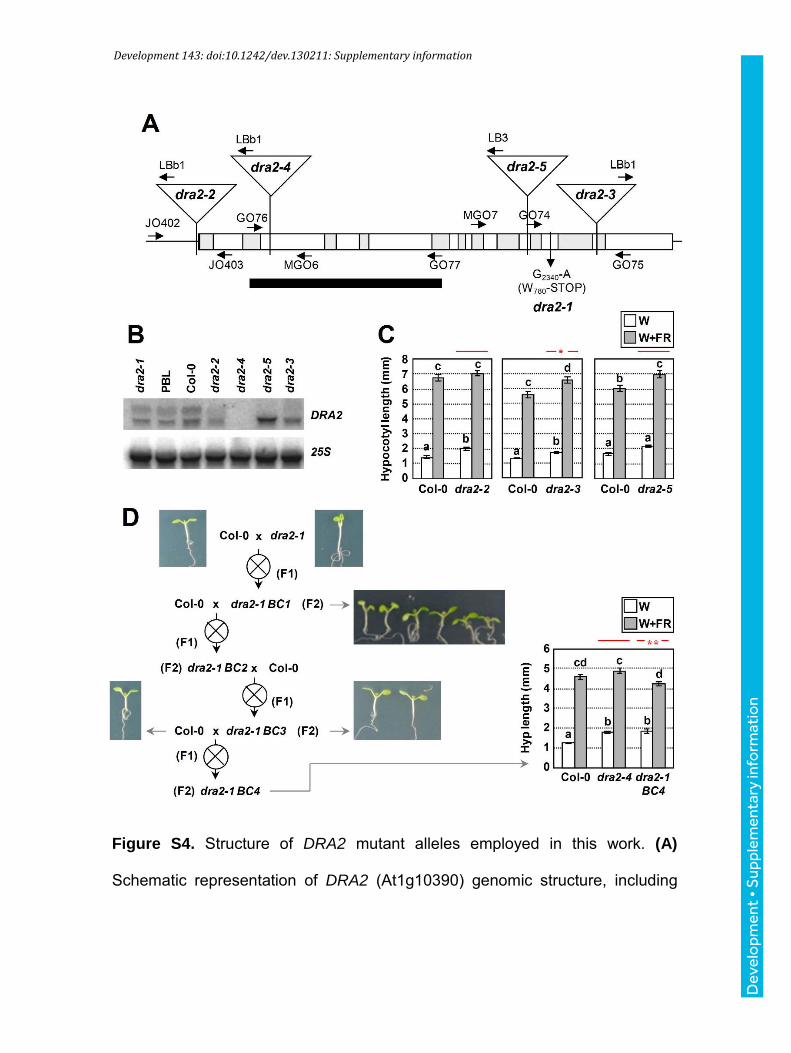
Figure S4. Structure of DRA2 mutant alleles employed in this work. (A)
Schematic representation of DRA2 (At1g10390) genomic structure, including
Dev
elo
pmen
t • S
uppl
emen
tary
info
rmat
ion

Development 143: doi:10.1242/dev.130211: Supplementary information
the position of oligonucleotides designed for PCR analyses as arrows. Black
box, covering from GO76 and GO77, indicates the probe employed for the RNA
blot analyses. (B) Expression levels of DRA2 in the corresponding mutant lines
represented in A. Total RNA (10 µg) was extracted from 7-day-old plants. 25S
rRNA levels are shown as a loading control. (C) Hypocotyl length of wild-type
(Col-0) and mutant dra2 seedlings. (D) Backcross of dra2-1 in Col-0 results in
an attenuation of the mutant phenotype. A diagram is shown with the
successive backcrosses of dra2-1 with Col-0. After the first backcross, dra2-
1_BC1 seedlings were selected visually. In the following backcrosses, dra2-1
seedlings were selected after PCR genotyping. In the dra2-1_BC4, the
hypocotyl elongation in response to simulated shade was measured and
compared to that of Col-0 and dra2-4 mutant seedlings. In parts C and D, seeds
were germinated and grown as indicated in Figure 1C. In graphs of sections C
and D, different letters denote significant differences (one-way ANOVA with
Tukey test, P<0.05) among means, and red asterisks indicate significant
differences (two-way ANOVA, *P<0.05, **P<0.01) between the mutant and wild-
type genotypes in response to W+FR.
Dev
elo
pmen
t • S
uppl
emen
tary
info
rmat
ion

Development 143: doi:10.1242/dev.130211: Supplementary information
Figure S5. Hypocotyl elongation response to simulated shade of NUP-deficient
seedlings. Scheme showing the genomic organization of (A) NUP54 and (B)
NUP62 genes. The location of T-DNA insertions and oligonucleotides used for
genotyping is indicated. Hypocotyl length in response to simulated shade was
measured in Col-0, (C) nup54-1, nup54-2, (D) nup62-1 and nup62-2 mutant
seedlings. Seedlings were grown as described in Figure 1C. Mutant nup62-1
plants were sterile, so we worked with segregating heterozygous plants. (E)
Dev
elo
pmen
t • S
uppl
emen
tary
info
rmat
ion

Development 143: doi:10.1242/dev.130211: Supplementary information
Representative 7-day-old Col-0 and nup62-1 seedlings grown under W (left) or
W+FR (right), as indicated in part D. (F) Hypocotyl length of wild-type, single
tcu1-2, dra2-3, dra2-5, and double tcu1-2;dra2-3 and tcu1-2;dra2-5 mutants in
response to simulated shade. Seedlings were grown as indicated in Figure 1C.
In sections C, D and F, different letters denote significant differences (one-way
ANOVA with Tukey test, P<0.05) among means, and red asterisks indicate
significant differences (two-way ANOVA, **P<0.01) between the mutant and
wild-type genotypes in response to W+FR.
Dev
elo
pmen
t • S
uppl
emen
tary
info
rmat
ion
Development 143: doi:10.1242/dev.130211: Supplementary information
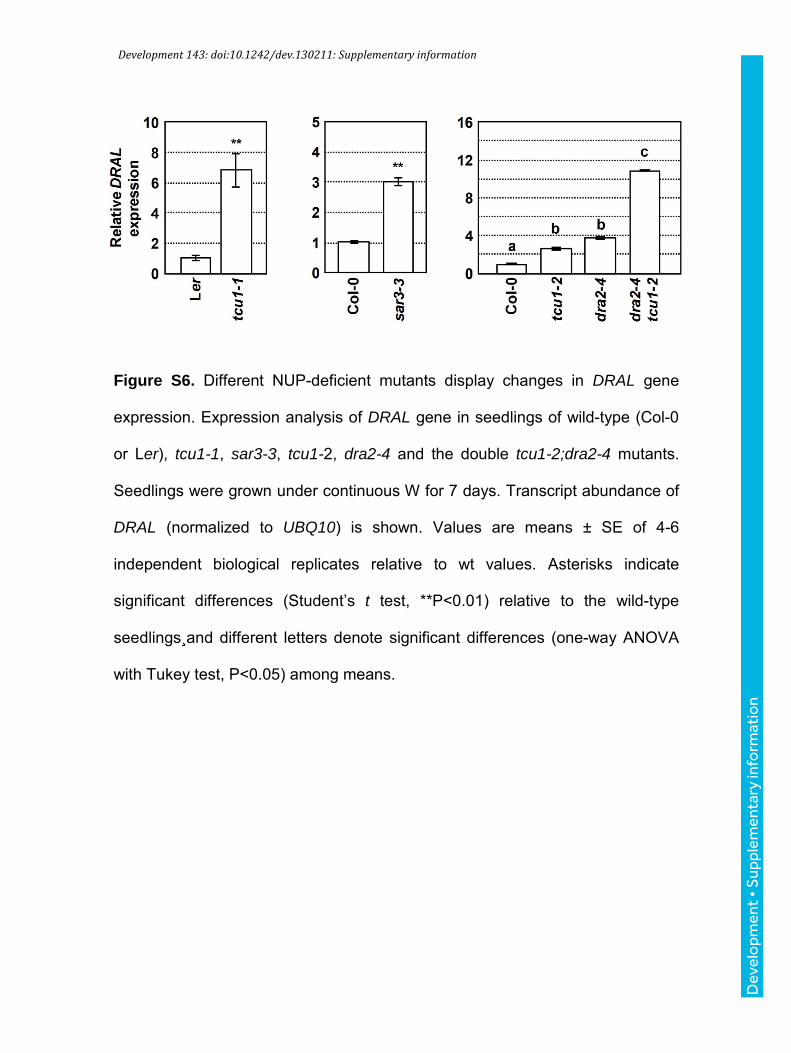
Figure S6. Different NUP-deficient mutants display changes in DRAL gene
expression. Expression analysis of DRAL gene in seedlings of wild-type (Col-0
or Ler), tcu1-1, sar3-3, tcu1-2, dra2-4 and the double tcu1-2;dra2-4 mutants.
Seedlings were grown under continuous W for 7 days. Transcript abundance of
DRAL (normalized to UBQ10) is shown. Values are means ± SE of 4-6
independent biological replicates relative to wt values. Asterisks indicate
significant differences (Student’s t test, **P<0.01) relative to the wild-type
seedlings¸and different letters denote significant differences (one-way ANOVA
with Tukey test, P<0.05) among means.
Dev
elo
pmen
t • S
uppl
emen
tary
info
rmat
ion

Development 143: doi:10.1242/dev.130211: Supplementary information
Figure S7. Shade-induced expression of ATHB2 is not altered on dra2-1.
Expression analysis of ATHB2 in seedlings of wild-type and dra2-1 seedlings
treated for 0, 1, 2 and 4 h with W+FR. Seedlings were grown under continuous
W for 7 days (as in Figure 4). Transcript abundance of ATHB2, normalized to
UBQ10, is shown. Values are means ± SE of three independent quantitative
PCR biological replicates relative to wild-type values at 0 h. Different letters
denote significant differences (one-way ANOVA with Tukey test, P<0.05)
among means, and red line indicate no significant differences (two-way
ANOVA) between the mutant and wild-type genotypes in response to W+FR. D
evel
opm
ent •
Sup
plem
enta
ry in
form
atio
n

Development 143: doi:10.1242/dev.130211: Supplementary information
Figure S8. DRA2 is localized in the cytoplasm, within the nucleus and in the
nuclear rim. (A) Expression analysis of DRA2 gene in seedlings of wild-type
(Ws-2) and two independent transgenic 35S:DRA2-GFP lines. Seedlings were
grown under continuous W for 7 days. Transcript abundance of DRA2,
normalized to UBQ10, is shown. Values are means ± SE of three independent
quantitative PCR biological replicates relative to wild-type values. Different
letters denote significant differences (one-way ANOVA with Tukey test, P<0.05)
among means. (B) Z stack of confocal images of leaf tobacco cell co-
agroinfiltrated with constructs GFP-DRA2-GFP and mCherry-ER (see Figure
6B, lower images). The 3 shown images (from left to right: green fluorescence,
red and green fluorescence overlay, and bright-field images) are the overlay of
10 optical sections. (C) Series of the optical section images in order from top (1)
to bottom (10) shown as a Z stack in section B. Only the red and green
fluorescence overlay image is shown. Image 5 corresponds to the one shown in
Figure 6B, lower part. All images are shown to the same scale. Scale bar = 20
μm.
Dev
elo
pmen
t • S
uppl
emen
tary
info
rmat
ion
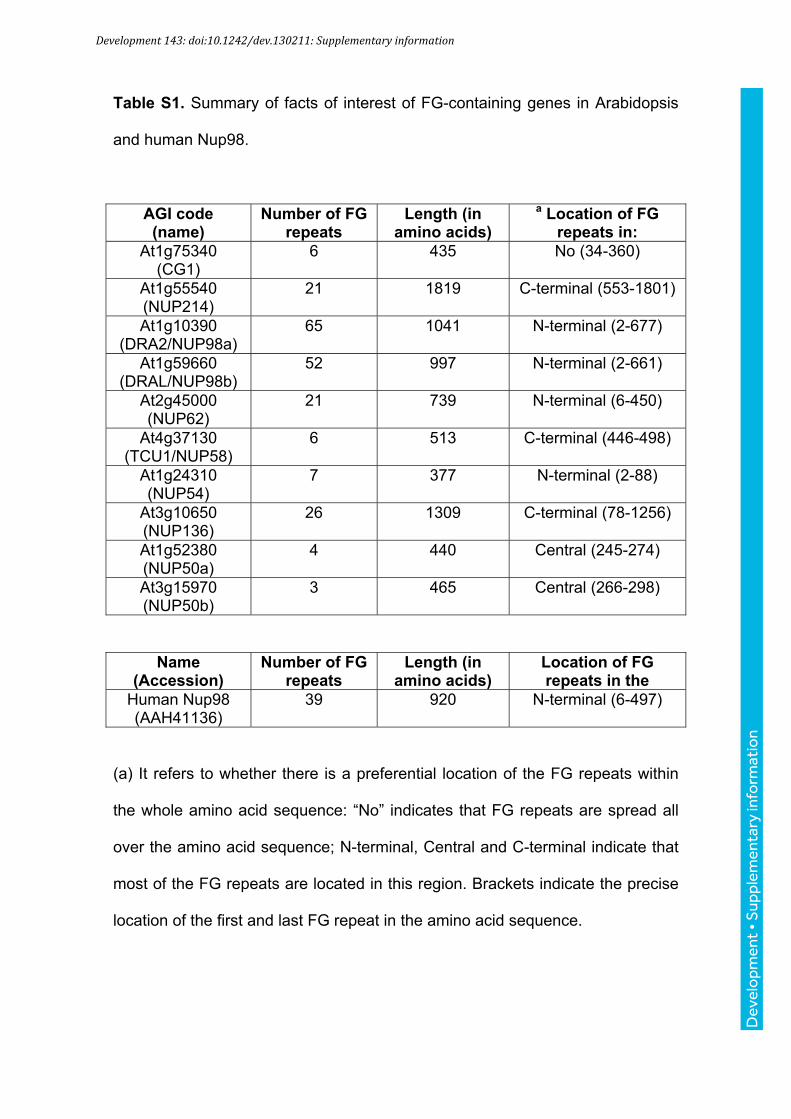
Table S1. Summary of facts of interest of FG-containing genes in Arabidopsis
and human Nup98.
AGI code (name)
Number of FG repeats
Length (in amino acids)
a Location of FG repeats in:
At1g75340 (CG1)
6 435 No (34-360)
At1g55540 (NUP214)
21 1819 C-terminal (553-1801)
At1g10390 (DRA2/NUP98a)
65 1041 N-terminal (2-677)
At1g59660 (DRAL/NUP98b)
52 997 N-terminal (2-661)
At2g45000 (NUP62)
21 739 N-terminal (6-450)
At4g37130 (TCU1/NUP58)
6 513 C-terminal (446-498)
At1g24310 (NUP54)
7 377 N-terminal (2-88)
At3g10650 (NUP136)
26 1309 C-terminal (78-1256)
At1g52380 (NUP50a)
4 440 Central (245-274)
At3g15970 (NUP50b)
3 465 Central (266-298)
Name (Accession)
Number of FG repeats
Length (in amino acids)
Location of FG repeats in the
Human Nup98 (AAH41136)
39 920 N-terminal (6-497)
(a) It refers to whether there is a preferential location of the FG repeats within
the whole amino acid sequence: “No” indicates that FG repeats are spread all
over the amino acid sequence; N-terminal, Central and C-terminal indicate that
most of the FG repeats are located in this region. Brackets indicate the precise
location of the first and last FG repeat in the amino acid sequence.
Development 143: doi:10.1242/dev.130211: Supplementary information
Dev
elo
pmen
t • S
uppl
emen
tary
info
rmat
ion

Table S2. Summary of Tukey’s Multiple Comparison test for the PHYB, PIL1
and HFR1 expression analyses in Col-0, sar1-4 and sar3-1 seedlings
(experiments shown in Figure 4B). n.s., not significant; *, significant P<0.05.
PHYB:UBQ10 expression. 0 h 1 h 2 h 4 h
sar1-4 sar3-1 Col-0 sar1-4 sar3-1 Col-0 sar1-4 sar3-1 Col-0 sar1-4 sar3-1 0 h Col-0 n.s. n.s. * * * * n.s. n.s. * n.s. n.s.
sar1-4 n.s. * * * * n.s. * * n.s.sar3-1 * * * * * * * *
1 h Col-0 * * * * * * * * sar1-4 n.s. n.s. n.s. n.s. n.s. n.s. n.s.sar3-1 n.s. * n.s. n.s. * *
2 h Col-0 * n.s. n.s. * * sar1-4 n.s. n.s. n.s. n.s.sar3-1 n.s. n.s. n.s.
4 h Col-0 n.s. n.s.sar1-4 n.s.
PIL1:UBQ10 expression. 0 h 1 h 2 h 4 h
sar1-4 sar3-1 Col-0 sar1-4 sar3-1 Col-0 sar1-4 sar3-1 Col-0 sar1-4 sar3-1 0 h Col-0 n.s. n.s. * * * * * * n.s. * *
sar1-4 n.s. * * * * * * n.s. * * sar3-1 * * * * * * n.s. * *
1 h Col-0 n.s. n.s. * n.s. n.s. * n.s. * sar1-4 n.s. * n.s. n.s. * * * sar3-1 * n.s. n.s. * n.s. *
2 h Col-0 * * n.s. n.s. n.s.sar1-4 n.s. * n.s. * sar3-1 * n.s. *
4 h Col-0 n.s.sar1-4 n.s.
HFR1:UBQ10 expression. 0 h 1 h 2 h 4 h
sar1-4 sar3-1 Col-0 sar1-4 sar3-1 Col-0 sar1-4 sar3-1 Col-0 sar1-4 sar3-1 0 h Col-0 n.s. n.s. * * * * * * * * *
sar1-4 n.s. * * * * * * * * * sar3-1 * * * * * * * * *
1 h Col-0 n.s. n.s. n.s. n.s. n.s. n.s. n.s. n.s.sar1-4 n.s. n.s. n.s. n.s. n.s. n.s. n.s.sar3-1 * n.s. * * n.s. n.s.
2 h Col-0 n.s. * n.s. * n.s.sar1-4 n.s. n.s. n.s. n.s.sar3-1 n.s. n.s. n.s.
4 h Col-0 n.s. n.s.sar1-4 n.s.
Development 143: doi:10.1242/dev.130211: Supplementary information
Dev
elo
pmen
t • S
uppl
emen
tary
info
rmat
ion