developing magnetic and gps-aided inertial navigation · pdf filedeveloping magnetic and...
TRANSCRIPT

Intellimotion vol. 9 no. 4 2002
Research Updates inIntelligent TransportationSystems
Volume 9, No. 42002
Page 1Developing Magnetic and GPS-AidedInertial Navigation for PATH’s VehicleGuidance System
Page 5PATH Database Hits New Mark—World’s Largest
Page 5CarLink II Wins NationalTransportation Award
Page 6Institutional Aspects of Bus Rapid Transit
Page 8Putting the Microscope on Freeway Traffic Data
Page 14PATH on Paper
Page 16Center for Commercialization of ITSTechnologies (CCIT) Opens
PATH—Partners for Advanced Transit andHighways—is a collaboration between theCalifornia Department of Transportation(Caltrans), the University of California, otherpublic and private academic institutions, andprivate industry.
PATH’s mission: applying advanced technol-ogy to increase highway capacity and safety,and to reduce traffic congestion, air pollutionand eneregy consumption.
Developing Magnetic and GPS-Aided Inertial Navigation for PATH’s Vehicle Guidance SystemJay Farrell, UC Riverside
magine computing a moving vehicle’s
position to within two centimeters — the
size of your thumbnail— from a satellite
in a twenty-million meter orbit. A PATH proj-
ect now makes such accuracy attainable via the
Global Positioning System (GPS), through
techniques referred to as carrier phase differ-
ential processing. Researchers from UC
Riverside and the PATH staff are collaborating
to develop a reliable and fault-tolerant navi-
gation system capable of providing vehicle
state information with position estimation
accuracy at the centimeter level. The imme-
diate application of such a system would be
for vehicle lateral control; application to lon-
gitudinal control and to aircraft, ships, and
satellites is also possible.
To be capable of detecting and isolating sen-
sor faults, the system should incorporate at
least three sensors. To prevent all sensors from
failing simultaneously, the sensors should
have distinct operating principles. The three
sensing approaches selected were magne-
tometer, carrier phase differential GPS
(CPDGPS), and inertial measurements.
continued on next page
I The main objective of this research was to
develop and analyze the methods and algo-
rithms needed to combine the magnetome-
ter, CPDGPS, and inertial measurements in a
navigation system to calculate the full vehi-
cle state at accuracies consistent with the goal
of achieving cm position accuracy. Since the
main application is vehicle control, the sys-
tem had to output the vehicle control state
information with a rate of at least 25 Hz.
PATH has used a magnetometer sensing
approach for over a decade with a high degree
of reliability and success. Using an array of
magnetometers mounted on a vehicle, the
magnetic navigation system is capable of
measuring the vehicle’s distance from a path
of magnetic markers embedded in the road-
way with approximately 1.0 cm accuracy. The
system also provides a measurement of
trajectory relative vehicle heading.
Carrier phase differential GPS was being rou-
tinely used for post-processed surveying appli-
cations by the mid 1990s. A GPS receiver
maintains phase lock to the carrier signal

Intellimotion vol. 9 no. 4 2002
generated by each GPS satellite. CPDGPS uses this
phase measurement to compute the range between
the antennae of the user and satellite. The main
complicating factor is that this range is initially
biased by the integer number of wavelengths of the
carrier between the user and satellite antennas at the
time that the receiver “locked” onto the satellite. This
“integer ambiguity” must be estimated before the
carrier phase can be used as a range estimate. Post-
processed CPDGPS applications are now common-
ly and reliably used, since the integer ambiguities
can be estimated and verified across an entire dataset.
GPS real-time kinematic (RTK) research focuses on
the development of methods to accurately and reli-
ably estimate the integer ambiguities of a set of satel-
lites in real-time for a moving GPS antenna.
Inertial navigation for vehicle control dates back to
the 1940s. The advantages of an inertial navigation
system (INS) are that the sample rate is fixed and
can be quite high (kHz) and that the accuracy is
unaffected by external fields. However, inertial sys-
tems for aviation and military applications are too
expensive to be feasible for automotive applications.
Two of the major factors for the high cost are low
production volumes and the high cost of accurate
inertial instruments. Recent advances in micro-
electromechanical systems (MEMs) technology have
resulted in solid-state accelerometers and gyros with
potential costs of only tens of dollars in high pro-
duction volumes. However, such solid-state inertial
instruments, even when temperature compensated,
tend to have high bias drift rates relative to tradi-
tional navigation specifications.
When this project began in 1995, pseudorange dif-
ferential GPS-aided inertial navigation systems
achieving 2 m accuracy were commercially avail-
able. Off line CPDGPS-aided inertial navigation had
been implemented via post-processing, but there
had been no demonstration of a real-time imple-
mentation, as is required for vehicle control. In May
1997, a team of researchers from the University of
California at Riverside and the Stanford Research
Institute demonstrated a real-time CPDGPS-aided
INS that achieved 2.5 cm accuracy at 100 Hz. This
navigation state vector was processed to produce a
control state vector at approximately 30 Hz. In Sep-
tember 2000, a team of researchers from UC Riverside
and PATH demonstrated reliable high-speed vehicle
control using the CPDGPS-aided INS. In May 2001,
reliable and accurate vehicle state estimation and
control using the (triple redundancy) magnetome-
ter and CPDGPS-aided INS was demonstrated.
This triplicate redundancy navigation system pro-
vides vehicle position, velocity, acceleration, atti-
tude, heading, and angular rates at 150 Hz with accu-
racies (standard deviation) of 1.5 cm, 0.8 cm/s, 2.2
cm/s/s, 0.03 deg, 0.1 deg, and 0.1 deg/s. The system
is designed to operate reliably whether or not GPS
and magnetometer measurements are available. The
May 2001 lateral vehicle control demonstration
included the following situations: both CPDGPS and
magnetometer-aided INS, CPDGPS-aided INS, mag-
netometer-aided INS, and switching between
CPDGPS and magnetometer aiding of the INS at ran-
dom times. The control demonstrations involved
basic trajectory following as well as trajectory rela-
tive maneuvering (i.e., tracking sinusoidal pertur-
bations and performing lane changes).
Sensor PackageFigure 1 shows a PATH Buick LeSabre instrumented
with the magnetometer and CPDGPS-aided INS. The
gray box on the left contains a Crossbow DMU-6X
three axis inertial measurement unit, which includes
a three-axis 2g solid-state accelerometer (100 Hz
bandwidth) and a three-axis 100 deg/s solid-state
gyro (10 Hz bandwidth). The DMU-6X performs
anti-alias filtering, A/D conversion, start-up bias and
axis-misalignment correction, and temperature com-
pensation, and outputs the set of six inertial meas-
urements by serial port at 150 Hz to the navigation
computer. Commercial automotive applications
would require similar inexpensive solid-state iner-
tial instruments.
Figure 1.GPS antenna mount on
PATH test vehicle.

Intellimotionvol. 9 no. 4 2002
Mounted on top of the gray box is the GPS anten-
na used for this project. Toward the front of the
vehicle on the same mounting structure is a second
GPS antenna that was used in selected attitude
determination experiments. The tall antenna
between the two GPS antennae is for the Freewave
radio modem, used to communicate differential GPS
corrections from a base station to the vehicle. A
Novatel RT-2 GPS receiver (located in the trunk)
processes the GPS antenna signal and sent pseudo-
range, Doppler, and carrier phase measurements via
serial port to the navigation computer. The naviga-
tion computer (a Pentium notebook) implements
the INS, complementary filter, and control state cal-
culation equations.
Sensor IntegrationInertial, CPDGPS, and magnetometer measurements
are integrated using a complementary filter (see
Figure 2). In this approach, the angular rate infor-
mation from the gyros is processed and integrated
to compute a rotation matrix between the vehicle
and tangent plane coordinate frames. Using that
rotation matrix, the vehicle frame accelerometer
measurements are processed and integrated to yield
tangent frame velocity and position. This inertial
state information is used to calculate predicted val-
ues for the CPDGPS and magnetometer measure-
ments. The filter labeled KF is designed to attenu-
ate the CPDGPS and magnetometer measurement
noise and accurately estimate the INS state error.
Then the estimated INS errors are fed back to cor-
rect the INS state. This estimation and error feed-
back can occur whenever GPS or magnetometer
measurements are available. For the system discussed
herein, the GPS and magnetometer measurements
are incorporated at 1 Hz.
The INS state is computed at 150 Hz. INS computa-
tions continue regardless of whether magnetome-
Figure 2. Complementaryfilter for integration of themagnetometer, carrier phasedifferential GPS, and inertialinformation.
East, m.
Figure 3. Tangent PlanePosition. Plot of the northversus east coordinates of thevehicle performing a 3.6 m lanechange maneuver along acurved section of the Crow’sLanding test track.
ter or CPDGPS measurements are available; there-
fore, the availability of the vehicle state for control
computations is not affected by missed magnets or
by loss of GPS satellite signals. The accuracy of the
INS state information is affected by the amount of
time since the last magnetometer or CPDGPS meas-
urement. The error in the unaided INS grows in a
polynomial fashion, reaching 0.5 meter error
approximately 15 seconds after the last mag-
netometer or CPDGPS measurement. The comple-
mentary filter propagates error covariance matrices
that characterize the accuracy of the INS state esti-
mate. Therefore, in the event of sensor failure while
in an automated mode of operation, the navigation
system is able to warn the driver to resume manu-
al operation with sufficient time for the driver to
resume control.
Experimental Control ResultsFigure 3 and Figure 4 show results of the instru-
mented vehicle performing maneuvers relative to
the trajectory at the Crow’s Landing test facility. The
lane trajectory at Crow’s Landing begins and ends
with straight line segments. The middle section of

Intellimotion vol. 9 no. 4 2002
the trajectory is composed of three 800-meter-radius
turns that are constructed so that they connect
smoothly to the straight portions of the trajectory.
In Figure 3 the vehicle is traveling north to south.
The southernmost curve and straight line segment
have been cut off to improve the scale of the figure.
The path of magnetic markers is indicated by the
dashed line. The vehicle was commanded to perform
a 3.6-meter lane change maneuver. Once the vehi-
cle was more than 0.40 meter from the trajectory,
the magnetometers were out of their effective range.
The vehicle trajectory that resulted from this on-
vehicle experiment is shown as the solid line in the
figure. Note that this maneuver occurred at an arbi-
trary location.
Magnetic and GPS-aided Inertial NavigationThe trajectory relative data is shown in Figure 4.
The top graph is a time response plot of the distance
d from the vehicle to the predefined trajectory. The
bottom graph indicates the vehicle velocity tangent
to the trajectory. The navigation system also com-
putes velocity normal to the trajectory, trajectory
relative heading and heading rate, and tangential
and normal acceleration.
Significance and Future ApplicationsThe main motivating application for our system is
lateral vehicle control. However, the CPDGPS-aided
INS portion is also applicable to air, sea, and space
craft applications. The magnetometer and CPDGPS-
aided INS has potential satellite-control applica-
tions.
Figure 4. Trajectory relative data for the maneuver
depicted in Figure 3.
Top—Plot of the calculateddistance d, from the trajectory.
Bottom—Velocity tangent to the trajectory.
In addition to the control state information required
for lateral control, the navigation system also pro-
vides the tangential velocity information necessary
for longitudinal control; therefore, a longitudinal
control demonstration should be possible. This nav-
igation system is also directly applicable to driver
lane-departure warning and driver-assistance appli-
cations.
While roadway databases are available and used for
a variety of purposes, the dominant roadway data-
bases are only accurate to 15m, and do not store the
altitude of the roadway. DaimlerChrysler and other
research groups are developing methods to auto-
matically incorporate position data from vehicles
equipped with real-time kinematic (RTK) GPS into
roadway databases. As the number of vehicles so
equipped and the capabilities of these automated
mapping methods increases, the development of a
three dimensional centimeter-accuracy roadway
database will be possible.
Another interesting application is the computation
of relative vehicle state information for platooning
or negotiating maneuvers with adjacent vehicles.
Since each vehicle equipped with a magnetometer
and CPDGPS-aided Inertial Navigation System is
able to compute its own absolute position and veloc-
ity, the relative state information between any two
vehicles can be computed by differencing the
absolute state information of the two vehicles. The
only additional hardware that would be required to
support computation of vehicle relative state is a
mechanism for communicating data between adja-
cent vehicles.
A variety of engineering projects (for example,
vehicle system identification, tire slip estimation,
and aerodynamic drag estimation) involve esti-
mating particular aspects of a vehicle model. The
accuracy of the estimated quantities is directly relat-
ed to the accuracy of the sensors involved for meas-
uring the dynamic state of the vehicle. The naviga-
tion system described in this article calibrates the
inertial instruments and provides the vehicle state
estimates at 150 Hz, with rates and accuracies bet-
ter than any of the individual sensors involved.
Perhaps the use of such integrated sensors in future
projects involving the estimation of vehicle model
parameters will allow more accurate estimation of
the parameters of interest.

Intellimotionvol. 9 no. 4 2002
PATH’s innovative commuter-based carsharing pro-
gram, CarLink II, was presented with the AASHTO
(American Association of State Highway and
Transportation Officials) President’s Award for
Intermodal Transportation on December 4, 2001.
The President’s Transportation Awards recognize an
individual or team whose project has or could have
a salutary impact on transportation nationwide or
on a regional basis. Nominees for the award were in
competition with people from across the country.
The CarLink team is very honored and would like
to thank AASHTO for the award. The team hopes
more regions and states will follow the CarLink path!
Carlink II was formally launched August 23, 2001
at the California Street Caltrain Station in Palo Alto.
Representatives from CarLink’s partner agencies—
PATH, the Institute of Transportation Studies at the
University of California, Davis (ITS-Davis), Caltrans,
Honda Motor Company, and Caltrain—shared the
CarLink II Wins National Transportation Award John Wright, PATH
The California PATH Database recently reached yet
another milestone—entry of its 25,000th fully-
abstracted record into the Database. Attending a cel-
ebration of the event at UC Berkeley’s Harmer E.
Davis Transportation Library were PATH and
Institute of Transportation Studies managers,
researchers and staff. Two noted visitors from
Washington, DC, Ms. Nelda Bravo, Head of the
National Transportation Library, and Ms. Barbara
Post, Manager of Information Services for the
Transportation Research Board, were also on hand.
For the event, PATH Database Manager Seyem
Petrites and Database Librarian Michael Kleiber
joined Ms. Bravo and Ms. Post to virtually enter
record number 25,000 into the Database. The record
chosen for this honor was an Internet report enti-
tled Other Road-Side Detectors, written by PATH
researcher Dimitri Loukakos.
The PATH Database is the world’s largest biblio-
graphic database devoted to Intelligent Transporta-
tion Systems. Founded in 1988 by the Institute of
PATH Database Hits New Mark—World’s LargestSeyem Petrites, UC Berkeley
media spotlight with half a dozen new CarLink II
users. Local officials and members of the public also
came out in support of this innovative carsharing
program.
After five months of operation CarLink already has
over eighty users sharing a fleet of up to twenty-
seven Ultra Low Emission Honda Civics. Members
drive the Hondas between their homes or worksites
and the Caltrain station, then use Caltrain for most
of their commute. Caltrain is a commuter rail system
Transportation Studies, the Database is maintained
and managed by the Institute’s Harmer E. Davis
Transportation Library.
Internet access to the Database is provided through
a partnership established in 1998 between the
California PATH Program and the Transportation
Research Board, with Database funding provided by
Caltrans, the California Department of Trans-
portation.
The PATH Database can be reached at:
continued on page 11
Entering the Database's25,000th record were BarbaraPost, Manager of InformationServices for the TransportationResearch Board, Nelda Bravo,Head of the NationalTransportation Library, PATHDatabase Manager SeyemPetrites and Database LibrarianMichael Kleiber.
CarLink II program manager Susan Shaheen with ULEV Honda at Palo Alto Caltrain station.
http://www4.nationalacademies.org/trb/tris.nsf/web/path

Intellimotion vol. 9 no. 4 2002
arious facets of intelligent transportation
system technology, grouped together under
the rubric of Bus Rapid Transit (BRT), offer
the possibility of enhancing transit bus operations
and the quality of services delivered to transit rid-
ers. In concept, BRT combines the speed, comfort,
and environmental efficiency of light rail systems
with the flexibility, convenience, and relatively low
cost of buses. Successful implementation of BRT
technology in cities such as Curitiba (Brazil), Ottawa,
and Pittsburgh has fueled interest in utilizing these
low—or at least lower-cost—strategies to make bus
transit more attractive and competitive.
The most popular strategies for improving service
are station area improvements, automated vehicle
location systems, advanced passenger information
systems, signal priority, and modifications to bus-
stop spacing. BRT projects also are using articulated
fleets and low-floor vehicles to expand capacity and
reduce boarding times. With these and other imple-
mentation strategies such as electronic fare payment
and automated passenger counting, improvements
have been documented in terms of increased rider-
ship, decreased travel times, and other performance
measures.
Implementing BRT raises many challenging issues,
technical, operational, and institutional issues. A
recently completed PATH study investigated BRT
institutional issues with respect to their relative level
of importance and difficulty of resolution.
Our report investigates BRT through a macroscopic
examination (comprising a literature review plus
project members’ own knowledge and experience),
a survey of members of the US Bus Rapid Transit
Consortium (http://www.fta.dot.gov/brt/) and sev-
eral Canadian transit properties, and a more focused
site-specific examination of three California BRT sys-
tems: the Santa Clara Valley Transit Authority,
Alameda-Contra Costa Transit and Los Angeles
County Metropolitan Transportation Authority.
Where appropriate and possible, our study also rec-
ommends strategies for these issues’ resolution. The
literature review provided insight into the history
of bus rapid transit and helped identify potential
institutional issues for further investigation. The sur-
vey provided information culled from the insights
and experiences of planners, administrators, and
engineers working for transit agencies, regional plan-
ning organizations, or highway and street depart-
ments. By design, the survey sample size was
relatively small and thus even with a large response
rate, survey response analysis was accomplished
more descriptively than statistically. The result is an
assessment of current opinions on this topic held
by people who are most familiar with bus rapid tran-
sit systems in their communities, rather than a sta-
tistical or scientific study.
Survey Instrument:Design, Administration, and AnalysisBy surveying field practitioners, our study gathered
real-world experience and a broad understanding of
the institutional issues affecting organizations
involved with BRT systems. Several dozen issues were
identified, grouped as follows, forming the basis of
the survey instrument:
• intergovernmental and inter-organizational,
• intratransit property,
• political,
• public relations and marketing,
• funding and finance,
• labor,
• safety and liability,
• planning and land use, and
• physical environment.
Institutional Aspects of Bus Rapid TransitMark A. Miller, PATH
In concept, Bus Rapid Transit combines thespeed, comfort, and
environmental efficiencyof light rail with the
flexibility, convenience,and relatively low
cost of buses.
V

Intellimotionvol. 9 no. 4 2002
The survey was administered to members of the US
Bus Rapid Transit Consortium and several Canadian
transit agencies employing BRT systems. Survey
responses were analyzed to identify the most impor-
tant and most difficult issues to resolve overall and
with respect to two distinct BRT system operational
settings (mixed traffic and exclusive facilities), and
respondents’ organizational affiliation (transit agen-
cies, highway and streets departments, and planning
agencies). Recommendations for resolving the issues
were also considered.
Overall FindingsSurvey responses identified several of the most com-
mon and site-independent institutional issues of
bus rapid transit systems deemed to be the most
important and most difficult to resolve:
• integration of multiple priorities, objectives,
and agendas;
• finding political champions to support BRT;
• local and business community opposition to
the removal of/restrictions on parking spaces
for BRT use;
• availability and acquisition of right-of-way or
physical space;
• impacts of BRT on roadway operations;
• concerns over long term funding commit-
ments to BRT;
• gaining community support for transit-
oriented development; and
• educating the public on BRT while managing
perceptions and expectations.
Integration of Multiple Priorities, Objectives, and AgendasIntegrating multiple priorities, objectives and agen-
das is often the key to resolving institutional issues.
When institutions discuss common-interest issues,
each brings to the table their own organizational
experiences, cultures, and goals. A “win-win” strat-
egy might not always be achievable, but BRT proj-
ect members need to acknowledge other agencies’
concerns. Modal biases and agendas have histori-
cally infiltrated transportation planning. Recently,
however, with the recognition that multi-modal
transportation systems tend to be the healthiest, we
have witnessed greater levels of cooperation. Many
transportation organizations, however, still have
responsibilities to their respective agencies or juris-
dictions, and are still expected to protect their own
interests. This enhanced cooperation and continu-
ous dialogue should be encouraged to better under-
continued on page12
Figure 1.Survey responses wereanalyzed to identify themost important issuesand those most difficultto resolve.
stand stakeholders’ concerns and attempt to address
them throughout the BRT development and deploy-
ment process.
Finding Political Champions to Support BRTGaining the ear and voice of influential politicians
is one of the most often-cited means of achieving
results in implementing a BRT system. Public sup-
port is critical though usually not attainable through
transportation agencies alone. Finding a political
champion to support a BRT initiative may be criti-
cal in gaining public support, since politicians are
typically the final decision makers, with the clout
to produce results.
Roadway-related IssuesThe following three issues may be covered under the
umbrella of roadway-related issues:
• Local/business community opposition to
removal of/restrictions on parking spaces for
BRT use
• Availability and acquisition of right-of-way or
physical space
• Impacts of BRT on roadway operations
BRT is intended to provide the high-quality service
associated with rail transit at a much lower price. In
many BRT projects this is accomplished by provid-
ing buses with exclusive or nearly exclusive right-
of-way, so operations are unaffected by urban-street
congestion. However, obtaining the required right-
of-way may be difficult. Most BRT projects operate
at least partially in developed urban areas where
physical space for transportation improvements may
be scarce. In several projects this space comes from
currently utilized roadway lanes or from existing
parking lanes. BRT roadway facility operators
(typically municipal street departments or state

Intellimotion vol. 9 no. 4 2002
ommuters generally agree that congestion
has reached an intolerable level. To reduce
congestion, transportation engineers need
highly detailed traffic information, information that
is also prized by traffic researchers as a prerequisite
for improving the theoretical understanding of how
traffic flows—or doesn’t. Ideally, researchers and
engineers could know the position of every vehicle
on a particular road at every moment in time.
However, the technology of recording space-time
vehicle trajectories on a massive scale is in its infan-
cy; therefore, analysts must work with much less data
than they would like.
Many freeways are equipped with primitive sensors
that can record only the anonymous presence of
vehicles at specific locations, coded in a time series
of 0s and 1s. Typically, these simple inductive loop
detectors are installed on all lanes at sites, called sta-
tions, spaced about 500 meters to one kilometer
apart. Despite this anonymity, and the spatial dis-
creteness of the measurements, a treasure trove of
detailed information can be recovered from 0-1
detector data if one analyzes the data with the right
tools. In this article, we will illustrate the use of these
tools using real traffic information from a section
of Interstate 880 in Oakland, California (see Figure 1).
Figure 2a shows a time series of vehicle counts from
a single detector at a single station on the left lane
(number 1) of a section of Interstate 880 in Oakland,
California. The counts cover a six-hour period brack-
eting the afternoon rush, in two-second intervals.
Very little information can be obtained from this
graph because the data include the effects of lane
changes, driver differences, etc. If one aggregates all
the two-second counts of all the station’s detectors,
as if a single detector were recording all vehicles
across all lanes, lane-changing noise is eliminated
(see Figure 2b). Some patterns emerge, but it is still
impossible to detect the behavior of individual vehi-
cles. Even if the data are aggregated over longer time
periods, this difficulty remains (see Figure 2c).
However, if the data are compared across stations,
more patterns emerge.
Figure 2.Counts at station 0 vs. timeof day: (a) 2-second counts
at a single detector; (b) 2-second counts at all
detectors; (c) 2-minute countsat all detectors.
Figure 1.Site description and stations locations. C
Putting the Microscope on Freeway Traffic DataJuan Carlos Muñoz, Carlos F. DaganzoUC Berkeley
Intellimotionvol. 9 no. 4 2002
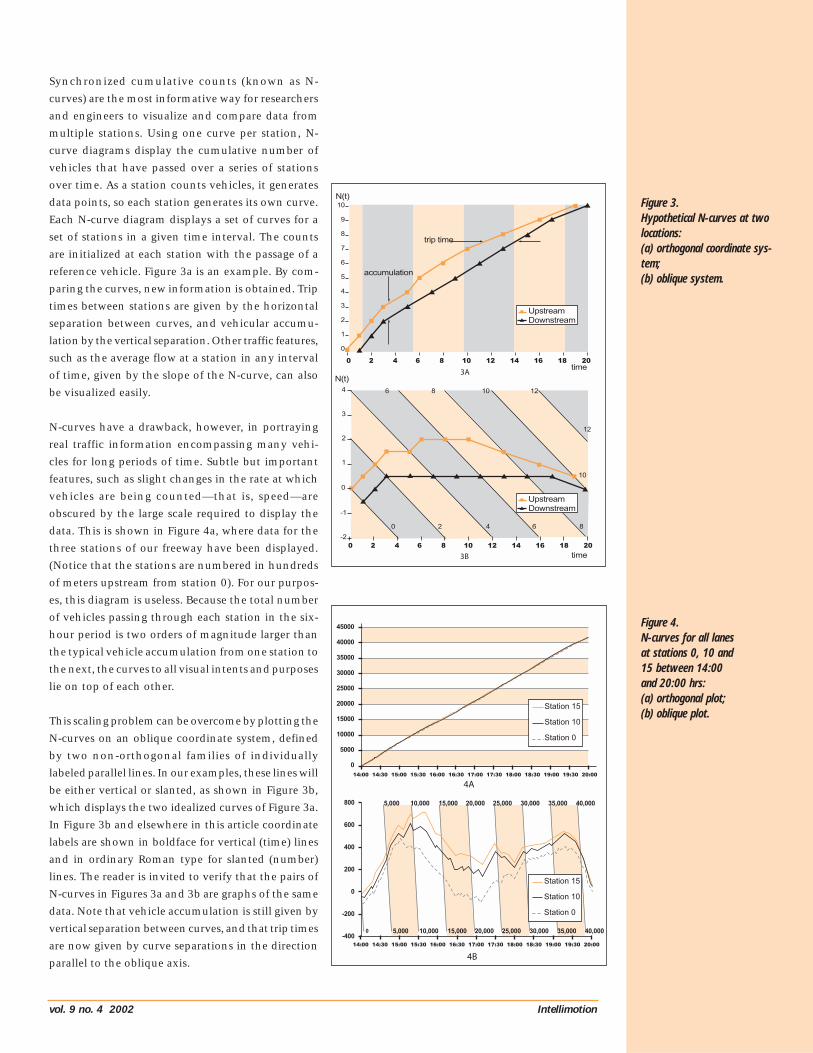
Synchronized cumulative counts (known as N-
curves) are the most informative way for researchers
and engineers to visualize and compare data from
multiple stations. Using one curve per station, N-
curve diagrams display the cumulative number of
vehicles that have passed over a series of stations
over time. As a station counts vehicles, it generates
data points, so each station generates its own curve.
Each N-curve diagram displays a set of curves for a
set of stations in a given time interval. The counts
are initialized at each station with the passage of a
reference vehicle. Figure 3a is an example. By com-
paring the curves, new information is obtained. Trip
times between stations are given by the horizontal
separation between curves, and vehicular accumu-
lation by the vertical separation. Other traffic features,
such as the average flow at a station in any interval
of time, given by the slope of the N-curve, can also
be visualized easily.
N-curves have a drawback, however, in portraying
real traffic information encompassing many vehi-
cles for long periods of time. Subtle but important
features, such as slight changes in the rate at which
vehicles are being counted—that is, speed—are
obscured by the large scale required to display the
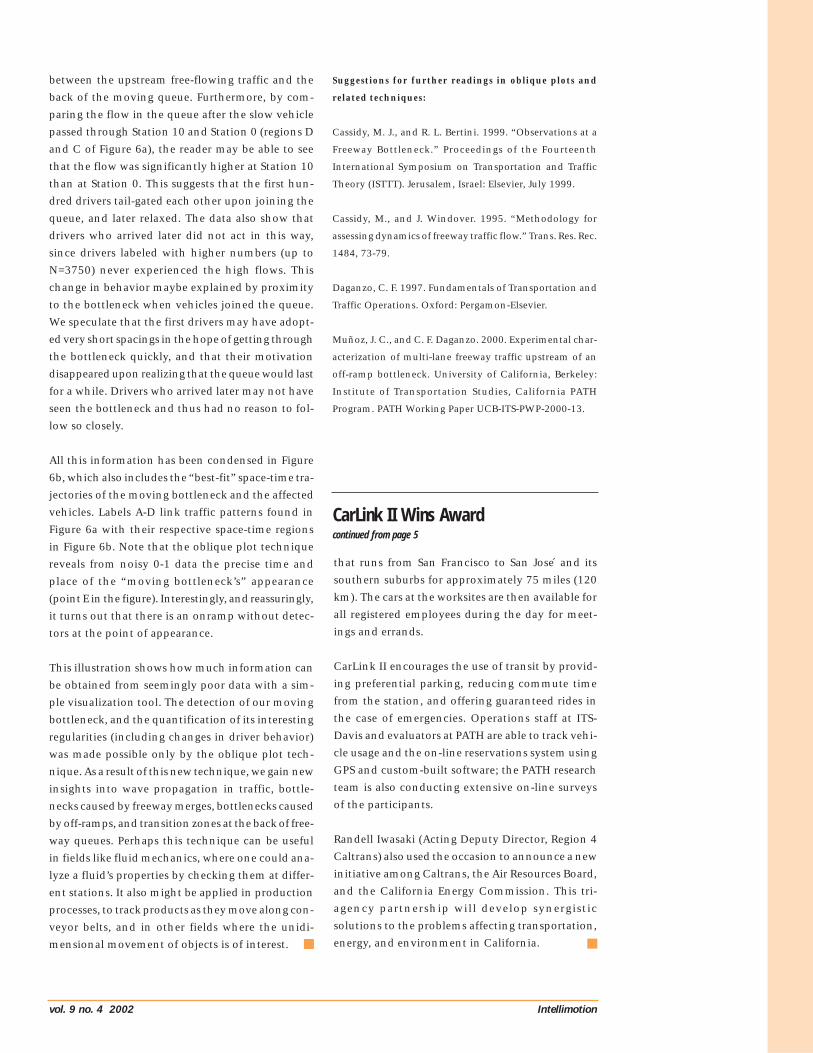
data. This is shown in Figure 4a, where data for the
three stations of our freeway have been displayed.
(Notice that the stations are numbered in hundreds
of meters upstream from station 0). For our purpos-
es, this diagram is useless. Because the total number
of vehicles passing through each station in the six-
hour period is two orders of magnitude larger than
the typical vehicle accumulation from one station to
the next, the curves to all visual intents and purposes
lie on top of each other.
This scaling problem can be overcome by plotting the
N-curves on an oblique coordinate system, defined
by two non-orthogonal families of individually
labeled parallel lines. In our examples, these lines will
be either vertical or slanted, as shown in Figure 3b,
which displays the two idealized curves of Figure 3a.
In Figure 3b and elsewhere in this article coordinate
labels are shown in boldface for vertical (time) lines
and in ordinary Roman type for slanted (number)
lines. The reader is invited to verify that the pairs of
N-curves in Figures 3a and 3b are graphs of the same
data. Note that vehicle accumulation is still given by
vertical separation between curves, and that trip times
are now given by curve separations in the direction
parallel to the oblique axis.
Figure 3.Hypothetical N-curves at twolocations: (a) orthogonal coordinate sys-tem; (b) oblique system.
Figure 4.N-curves for all lanesat stations 0, 10 and15 between 14:00and 20:00 hrs: (a) orthogonal plot;(b) oblique plot.

Intellimotion vol. 9 no. 4 2002
moving waves, such as the one observed on our sec-
tion of freeway between 15:00 and 15:30 hrs, reflect
the presence of congested conditions. Uncongested
conditions, on the other hand, are characterized by
forward-moving waves that propagate with the traf-
fic speed. They can be clearly seen in Figure 5, which
displays data at stations 0 and 15, from 14:15 to
14:45 hrs. It can be clearly seen that (except for a
discrepancy around 14:28 hrs) traffic conditions at
station 15 define conditions 1.5 kms downstream
very accurately, with less than a minute of delay, and
that trip times remained quite constant despite the
fluctuations in count.
The discrepancy at 14:28 hrs presents a new oppor-
tunity to show the potential of oblique plots. At first
sight, it appears that station 0 may have malfunc-
tioned, since it seems to have stopped recording
vehicles for a short period. To look into this further
let us rescale the oblique plot to achieve a desired
magnification level (as with a microscope) and also
add the curve for the intermediate station (see Figure
6a). Clearly the detectors at Station 0 were not mal-
functioning: the interruption in flow is also record-
ed at Station 10. Because the interruption grew while
moving downstream, other explanations, such as a
traffic accident or a sudden drop and recovery in
travel demand must also be ruled out. Such events
would have left different signatures. The only plau-
sible explanation for the observation is that the bot-
tom of the “V” represents a clot, as it were, of slow
vehicles moving downstream, caused by an obstruc-
tion moving forward with traffic. Inspection of the
figure shows that the obstruction traveled slightly
below the speed limit (88 km/hr). An observer at
Station 0 would have observed normal flow condi-
tions, followed by a 30-second period of extremely
low flow, and then two minutes of flow at nearly
the maximum rate for a 5-lane freeway. The most
likely explanation for these patterns (high speed for
the moving obstruction with negligible downstream
flows) is that a highway patrol car with its lights
flashing, traveling just under the speed limit, entered
the road somewhere upstream of Station 15, when
the vehicle count was about 3400. Even on the free-
way, drivers would have hesitated to pass such a
vehicle, which would thus block traffic behind it,
causing a moving queue.
By looking at Figure 6a in more detail one can iden-
tify the flow downstream and upstream of the slow
vehicle, as well as the speed of the transition zone
Figure 5.Traffic conditions at
stations 0 and 15 between14:15 and 14:45 hrs.
Figure 6.Traffic patterns
around a movingbottleneck:
(a) N-curve signaturedetected at stations 27,22 and 12; (b) evolution
in time and space.
The separation between curves can now be ampli-
fied by reducing the vertical scale. Figure 4b displays
the curves of Figure 4a on an amplified oblique sys-
tem. Notice the appearance of previously hidden
information. For example, from the change one can
now clearly see (and quantify) a drop in flow at all
stations between 15:00 and 15:30 hrs. The drop was
first felt downstream, at Station 0, and later at the
upstream stations. It is also easy to see how vehicle
accumulation and trip times increased immediate-
ly after that flow reduction. The diagram shows that
a queue grew from Station 0 to Station 15 and
beyond, and that this queue began to dissipate
around 17:30 hrs, starting at station 15.
Information in traffic moves as waves. We are all too
familiar with a freeway accident causing a shock
wave, a moving traffic jam that travels upstream:
this is an excellent example of information travel-
ing as a wave against the traffic stream. Upstream-
Intellimotionvol. 9 no. 4 2002
between the upstream free-flowing traffic and the
back of the moving queue. Furthermore, by com-
paring the flow in the queue after the slow vehicle
passed through Station 10 and Station 0 (regions D
and C of Figure 6a), the reader may be able to see
that the flow was significantly higher at Station 10
than at Station 0. This suggests that the first hun-
dred drivers tail-gated each other upon joining the
queue, and later relaxed. The data also show that
drivers who arrived later did not act in this way,
since drivers labeled with higher numbers (up to
N=3750) never experienced the high flows. This
change in behavior maybe explained by proximity
to the bottleneck when vehicles joined the queue.
We speculate that the first drivers may have adopt-
ed very short spacings in the hope of getting through
the bottleneck quickly, and that their motivation
disappeared upon realizing that the queue would last
for a while. Drivers who arrived later may not have
seen the bottleneck and thus had no reason to fol-
low so closely.
All this information has been condensed in Figure
6b, which also includes the “best-fit” space-time tra-
jectories of the moving bottleneck and the affected
vehicles. Labels A-D link traffic patterns found in
Figure 6a with their respective space-time regions
in Figure 6b. Note that the oblique plot technique
reveals from noisy 0-1 data the precise time and
place of the “moving bottleneck’s” appearance
(point E in the figure). Interestingly, and reassuringly,
it turns out that there is an onramp without detec-
tors at the point of appearance.
This illustration shows how much information can
be obtained from seemingly poor data with a sim-
ple visualization tool. The detection of our moving
bottleneck, and the quantification of its interesting
regularities (including changes in driver behavior)
was made possible only by the oblique plot tech-
nique. As a result of this new technique, we gain new
insights into wave propagation in traffic, bottle-
necks caused by freeway merges, bottlenecks caused
by off-ramps, and transition zones at the back of free-
way queues. Perhaps this technique can be useful
in fields like fluid mechanics, where one could ana-
lyze a fluid’s properties by checking them at differ-
ent stations. It also might be applied in production
processes, to track products as they move along con-
veyor belts, and in other fields where the unidi-
mensional movement of objects is of interest.
Suggestions for further readings in oblique plots and
related techniques:
Cassidy, M. J., and R. L. Bertini. 1999. “Observations at a
Freeway Bottleneck.” Proceedings of the Fourteenth
International Symposium on Transportation and Traffic
Theory (ISTTT). Jerusalem, Israel: Elsevier, July 1999.
Cassidy, M., and J. Windover. 1995. “Methodology for
assessing dynamics of freeway traffic flow.” Trans. Res. Rec.
1484, 73-79.
Daganzo, C. F. 1997. Fundamentals of Transportation and
Traffic Operations. Oxford: Pergamon-Elsevier.
Muñoz, J. C., and C. F. Daganzo. 2000. Experimental char-
acterization of multi-lane freeway traffic upstream of an
off-ramp bottleneck. University of California, Berkeley:
Institute of Transportation Studies, California PATH
Program. PATH Working Paper UCB-ITS-PWP-2000-13.
that runs from San Francisco to San Jose and its
southern suburbs for approximately 75 miles (120
km). The cars at the worksites are then available for
all registered employees during the day for meet-
ings and errands.
CarLink II encourages the use of transit by provid-
ing preferential parking, reducing commute time
from the station, and offering guaranteed rides in
the case of emergencies. Operations staff at ITS-
Davis and evaluators at PATH are able to track vehi-
cle usage and the on-line reservations system using
GPS and custom-built software; the PATH research
team is also conducting extensive on-line surveys
of the participants.
Randell Iwasaki (Acting Deputy Director, Region 4
Caltrans) also used the occasion to announce a new
initiative among Caltrans, the Air Resources Board,
and the California Energy Commission. This tri-
agency partnership will develop synergistic
solutions to the problems affecting transportation,
energy, and environment in California.
CarLink II Wins Awardcontinued from page 5

Intellimotion vol. 9 no. 4 2002
Departments of Transportation) are interested in
how BRT operations would affect their facilities. In
cases where projects look to utilize roadway space
that is currently on-street parking, businesses and
residents may be opposed to the “loss” of parking,
even if it is only during peak-periods. Therefore a
major concern is the availability of physical space
to accommodate BRT operations. Proper consider-
ation must be given to identify if there are competing
interests for space and how BRT operations may
impact these facilities.
Concerns Over Long-Term Funding Commitments to BRTIs BRT merely the “flavor of the month?” What are
the implications for transit agencies should a BRT
concept fall out of favor? Some BRT projects will
require a great deal of capital investment, often
requiring transit agencies to shoulder the risk of
having greater capital to maintain without recov-
ering sufficient additional revenue to cover those
costs. Such operating and maintenance costs may
make transit agencies reluctant to embrace BRT.
Until there are domestic success stories and the fed-
eral government shows a firm commitment to the
program, many transit agencies may proceed cau-
tiously.
Gaining Community Support for Transit-Oriented DevelopmentMany BRT projects have incorporated land use
strategies to encourage and reinforce transit usage.
continued from page 7Bus Rapid Transit However, for most outside the transportation and
planning communities, the concept of transit-ori-
ented development (TOD) is new. For many, high-
er density and mixed use means more crowding and
greater congestion. Attempting to garner public sup-
port for TOD could be difficult, especially if there
are not many local examples to aid the public’s
understanding. Proactively educating the public on
this subject may bear fruit to avoid future public
opposition. Allaying fear of the unknown is often a
responsibility that must be borne when presenting
an untested concept to the public.
Educating the Public on BRT, and Managing Perceptions and ExpectationsTransit agencies must carefully present BRT to the
public and to decision-makers in order to maintain
support and interest for the program. Setting unre-
alistically high expectations can lead to disap-
pointment and a loss of support. Agencies must bal-
ance between “hype” and actual results.
Operational SettingThe physical setting in which a BRT system oper-
ates, whether busway, expressway, bus lanes on arte-
rials, or in mixed traffic, is an important system
attribute. We investigated whether the operational
setting raised specific institutional issues. Opera-
tional types were aggregated into two distinct
families: mixed traffic and exclusive facilities. Each
completed survey was identified with one of these
two families, based on the predominant operational
setting of the corresponding BRT project (since a BRT
system might have different settings along its
routes).
Mixed TrafficSurvey respondents representing mixed-traffic BRT
systems identified the following issues: street and
highway departments having to relinquish control
of their infrastructure, reaching agreement or con-
sensus on bus stop/station area enhancements, and
capital costs associated with BRT. The first two issues
are clearly associated with a mixed-traffic type of
operational setting. Mixed-traffic systems tend to be
upgrades of existing systems. Exclusive facility sys-
tems, however, tend to be new systems (often built
on unused rail right-of-way) and their costs are more
likely compared to such capital-intensive systems
as light rail transit, so capital costs may be of greater
importance for mixed traffic systems than for exclu-
sive facilities.
Los Angeles CountyMetropolitan Transit
Authority and the City ofLos Angeles Department
of Transportation havepartnered to implement
new Metro Rapid expressbus lines. Metro Rapid
service focuses on majordestinations and transfer
points, with stop inter-vals lengthened to every
0.8 to 1.0 miles.Expansion to corridors
with exclusive busways isbeing considered.

Intellimotionvol. 9 no. 4 2002
Exclusive FacilitiesSurvey respondents representing exclusive facility
BRT systems identified the following issues: view-
ing BRT as a top down solution to a problem, local
and community opposition to BRT, lack of empiri-
cal evidence on BRT’s effects on land use, and poten-
tial developers’ perception of BRT’s lack of perma-
nence as compared to rail. These are more regional
than local issues. Because exclusive facility systems
are generally larger in scale and scope than mixed
traffic systems, especially relative to required infra-
structure and capital, it is not surprising that suc-
cessfully implementing these systems requires a
regional perspective on planning, development, and
land use.
Organizational TypeSurvey participants’ responses reflect their organi-
zation, its objectives, agendas, and business cultures.
We examined responses by organizational type to
identify differing values, priorities, and perceptions.
Organizational types included transit agencies, high-
way/street departments, and planning agencies.
For transit agencies, issues deemed the most impor-
tant and difficult to resolve included responsibility
for enforcement on bus lanes/ busways, and edu-
cating the public on BRT and managing perceptions
and expectations. Maintenance responsibilities for
shared infrastructure and hardware/software was
one of the most important associated with street
and highway departments. For planning agencies,
the following issues were highlighted: reaching
agreement or consensus on bus stop/station area
enhancements, educating the public on BRT and
managing perceptions and expectations, gaining
community support for transit oriented develop-
ment, and perceived or actual competition of BRT
with rail transit.
Recommendations for Resolution of IssuesRespondents recommended action to help resolve
their most important issues. They emphasized mar-
keting and public relations, public outreach and edu-
cation, stakeholder participation, creation of new
institutional entities, and studying land use and
planning policies. Reference was also made for the
need to quantitatively document the impacts, both
benefits and costs, of BRT. Calls were also made to
develop solutions to various potential negative
impacts or disbenefits of BRT, such as excessive noise,
vehicle emissions, and safety-related problems.
Respondents also thought it would be very import-
ant for study findings to be fully communicated
both to local jurisdictional decision-makers and the
public who live in the communities or along a spe-
cific corridor most impacted by a BRT system imple-
mentation. Also of particular import, from the
respondents’ perspective, is the need to welcome
and solicit input from a multitude of stakeholders
to build as large as possible a constituency of polit-
ical supporters within the affected community for
a proposed BRT system.
In Silicon Valley, the SantaClara Valley TransitAuthority's Line 22 "BusRapid Transit Corridor"intersects the north-southGuadalupe Light Rail Line.
ConclusionsOur study gleaned the insight and expertise of
individuals who have experienced these BRT
issues. The results should offer guidance in antici-
pating future problems and developing strategies
to solve them. Follow-on work in this area will
include in-depth site-specific case studies of BRT
systems to more thoroughly probe into the insti-
tutional environment of bus rapid transit. In this
way, our research should be able to offer guidance
to practitioners involved with bus rapid transit
systems.
ReferencesMiller, Mark A., and Stephen M. Buckley. 2000.Institutional aspects of bus rapid transit-a macroscopicexamination. University of California, Berkeley: Instituteof Transportation Studies, California PATH Program.PATH Working Paper UCB-ITS-PWP-2000-7. July 2000.Miller, Mark A., and Stephen M. Buckley. 2001.Institutional aspects of bus rapid transit operation.University of California, Berkeley: Institute of Trans-portation Studies, California PATH Program. PATHResearch Report UCB-ITS-PRR-2001-9. April 200l.

Intellimotion vol. 9 no. 4 2002
PATH publications (whichinclude research reports,working papers, technicalmemoranda, and technicalnotes) can be obtainedfrom:
Institute of Transportation StudiesPublications OfficeUniversity of California109 McLaughlin HallBerkeley, CA 94720-1720
510-642-3558, FAX: 510-642-1246
http://www.its.berkeley.ed/publications.html
A searchable database of PATH publications is available via the PATH WorldWide Web site at:http://www.path.berkeley.edu
PATH on PaperAn Updated List of Recent PATH Sponsored Research Publications
*Available online at:http://www.path.berkeley.edu/Publications/PATH/index.html
Institutional Aspects of Bus Rapid Transit Operation.Mark A. Miller, Stephen M. Buckley, April 2001, 68pp, $15UCB-ITS-PRR-2001-9*
Wireless Token Ring Protocol. Duke Lee, April 2001,97 pp, $15UCB-ITS-PRR-2001-10*
Compression Braking for Longitudinal Control ofCommercial Heavy Vehicles. Lasse Moklegaard, MariaDruzhinina, Anna G. Stefanopoulou, April 2001, 104 pp, $20UCB-ITS-PRR-2001-11*
Human Driver Model for SmartAHS. DelphineDelorme, Bongsob Song, April 2001, 50 pp, $10,UCB-ITS-PRR-2001-12*
Analysis of Traffic Flow With Mixed Manual andIntelligent Cruise Control Vehicles: Theory andExperiments. Arnab Bose, Petros Ioannou, April 2001,71 pp, $15UCB-ITS-PRR-2001-13*
Mixed Manual/Semi-Automated Traffic: AMacroscopic Analysis. Arnab Bose, Petros Ioannou,April 2001, 35 pp, $10UCB-ITS-PRR-2001-14*
New Hardware and Software Design of a Field-Deployable Real-Time Laser-Based Non-IntrusiveDetection System for Measurement of True TravelTime on the Highway. Harry H. Cheng, Ben Shaw, JoePalen, Bin Lin, Xudong Hu, Bo Chen, Jason Parks, June2001, 65 pp, $15UCB-ITS-PRR-2001-15*
Data Sharing of Traveler Information With the Publicand Private Sectors: State of the Practice. Mark A.Miller, Kevin Balke, August 2001, 40 pp, $10UCB-ITS-PRR-2001-16*
Emergency Vehicle Maneuvers and Control Laws forAutomated Highway Systems. Charmaine Toy, KevinLeung, Luis Alvarez, Roberto Horowitz, August 2001,143 pp, $20UCB-ITS-PRR-2001-17*
Development and Performance Evaluation of AVCSSDeployment Sequences to Advance from Today’sDriving Environment to Full Automation. StevenShladover, Joel VanderWerf, Mark A. Miller, NataliaKourjanskaia, Hariharan Krishnan, August 2001, 82pp, $15UCB-ITS-PRR-2001-18*
Integrating a Comprehensive Modal Emissions Modelinto ATMIS Transportation Modeling Frameworks.
Matthew Barth, Carrie Malcolm, George Scora,August 2001, 54 pp, $15UCB-ITS-PRR-2001-19*
Coordinating Automated Vehicles via Communication.Soheila Vahdati Bana, September 2001, 145 pp, $20UCB-ITS-PRR-2001-20*
Fault Detection and Handling for LongitudinalControl. Jingang Yi, Adam Howell, Roberto Horowitz,J.K. Hedrick, Luis Alvarez, September 2001, 117 pp,$20UCB-ITS-PRR-2001-21*
The Prospects for High Occupancy/Toll (HOT) Lanes:Where Should They be Implemented. Joy Dahlgren,September 2001, 36 pp, $10UCB-ITS-PRR-2001-22*
Completing the Circle: Using Archived OperationsData to Better Link Decisions to Performance. JoyDahlgren. Reinaldo C. Garcia, Shawn Turner,September 2001, 39 pp, $10UCB-ITS-PRR-2001-23*
ITS Hardware Maintenance Management Systems:White Paper for MORIP Pooled Fund Study. Beverly T.Kuhn, Brooke R. Durkop, September 2001, 17 pp, $5UCB-ITS-PRR-2001-24*
Brake System Modeling and Control. J.K. Hedrick, M.Uchanski, September 2001, 82 pp, $15UCB-ITS-PRR-2001-25*
System Fault Detection in Human-AugmentedAutomated Driving. Theodore Cohn, September2001, 15 pp, $5UCB-ITS-PRR-2001-26*
Aerodynamic Forces on Truck Models, Including TwoTrucks in Tandem. Mustapha Hammache, MarkMichaelian, Fred Browand, October 2001, 24 pp, $5UCB-ITS-PRR-2001-27*
Enhanced AHS Safety Through the Integration ofVehicle Control and Communication. J.K. Hedrick, M.Uchanski, Q. Xu, October 2001, 142 pp, $20UCB-ITS-PRR-2001-28*
Optimized Vehicle Control/Communication Inter-action in an Automated Highway System. J.K. Hedrick,Y. Chen, S. Mahal, October 2001, 132 pp, $20, UCB-ITS-PRR-2001-29*
Safety Assessment of Advanced Vehicle Control andSafety Systems (AVCSS): A Case Study. Ching-YaoChan, Wei-Bin Zhang, El Miloudi El Koursi, EtienneLemaire, October 2001, 63 pp, $15UCB-ITS-PRR-2001-30*
Sensor-Friendly Freeways: Investigation of ProgressiveRoadway Changes to Facilitate Deployment of AHS.James A. Misener, Paul Griffiths, Lee Johnson, Andy

Intellimotionvol. 9 no. 4 2002
Get on the Mailing List!FAX, mail or e-mail us the followinginformation for a free subscription toIntellimotion:
Name & Title
Address
Phone and FAX
E-mail address
Primary area of interest in ITS
Please mention the Intellimotion mailing list. See back pagefor our address and fax number.
PATH DatabaseThe PATH Database, the world’s largest onIntelligent Transpostation Systems is nowaccessible at:
http://www4.nationalacademies.org/trb/tris.nsf/web/path
It surrently lists over 25,000 bibliographicrecords with abstracts.
Also available is the monthly PATH RecentAdditions list, a collection of 150-200 recentcitations to the Database at:
http://www.lib.berkeley.edu/ITSL/newbooks.html
ITS Decision
Analysis of Implementation ofIntelligent Transportation Systems
www.path.berkeley.edu/itsdecision
Reader Feedback SurveyWhat do you like about Intellimotion?Dislike? What could be improved?
What features are most helpful to you, and what new ordifferent features would you like to see?
Please write us a note, in the space below if you’d like,and fax it to (510) 231-9565 or email us [email protected]
Thanks!
Your feedback is important to us, and to YOU!
Segal, October 2001, 112 pp, $20UCB-ITS-PRR-2001-31*
Section-Related Measures of Traffic SystemPerformance: Prototype Field Implementation. StephenG. Ritchie, Carlos Sun, Seri Oh, Cheol Oh, October2001, 80 pp, $15UCB-ITS-PRR-2001-32*
Assessing Benefits of Coordination on Safety inAutomated Highway Systems. Woosuk Choi, DarbhaSwaroop, October 2001, 42 pp, $10UCB-ITS-PRR-2001-33*
Assessing Opportunities for Intelligent TransportationSystems in California’s Passenger IntermodalOperations and Services. Mark A. Miller, DimitriLoukakos, November 2001, 97 pp, $15UCB-ITS-PRR-2001-34*
Robust Lateral Control of Heavy Duty Vehicles. MeihuaTai, Jeng-Yu Wang, Ryan White, Masayoshi Tomizuka,December 2001, 70 pp, $15UCB-ITS-PRR-2001-35*
Evaluation of On-ramp Control Algorithms. MichaelZhang, Taewan Kim, Xiaojian Nie, Wenlong Jin, LianyuChu, Will Recker, December 2001, 122 pp, $20UCB-ITS-PRR-2001-36*
The AHS/Street Interface; Effects of CapacityConcentration on System Performance: Phase 1 FinalReport. Randolph Hall, December 2001, 50 pp, $10UCB-ITS-PRR-2001-37*
Integration of GPS/INS and Magnetic Markers forAdvanced Vehicle Control. Jay Farrell, Matthew Barth,December 2001, 62 pp, $15UCB-ITS-PRR-2001-38*
Carlink II: Research Approach and Early Findings. SusanA. Shaheen, John Wright, December 2001, 33 pp, $10UCB-ITS-PRR-2001-39*
Traffic Data Measurement and Validation. BenjaminCoifman. December 2001, 91 pp, $15UCB-ITS-PRR-2001-40*
Incident Management: Process Analysis andImprovement. Randolph W. Hall, December 2001, 45pp, $10UCB-ITS-PRR-2001-41*
Modeling the Santa Monica Freeway Corridor:Simulation Experiments. Alexander Skabardonis,January 2002, 71 pp, $15UCB-ITS-PRR-2002-1*
PATH, Caltrans, and the
UC Berkeley Institute of
Transportation Studies
formally opened the
Center for the Com-
mercialization of ITS
Technologies (CCIT)
Thursday February 7,
2002. At the ribbon-cut-
ting ceremony, CCIT
Executive Director Ha-
med Benouar said:
“CCIT will facilitate the
commercial deploy-
ment of advanced transportation products and services to improve trans-
portation safety, security and efficiency—necessary components of a vibrant
and growing economy. CCIT will create strong links between the transporta-
tion industry, automobile manufacturers, University researchers, government
experts, and commercial developers of advanced information technologies,
in Silicon Valley and throughout California.”
CCIT is structured to optimize private sector participation in the future of
California’s vast transportation network. The Center specializes in traveler
information, transportation management, and vehicle information and con-
trol. Among the first industry participants are DaimlerChrysler Research and
Technology and Siemens ITS North America.
Physically located one block from the UC Berkeley campus, CCIT offers facilities
for research, development, testing, training, focus group meetings, and
technology transfer, to promote commercial deployment of ITS products and
services.
Center for Commercialization of ITS Technologies (CCIT) Opens
Intellimotion is a quarterly newsletter edited and designed by the California PATH Publications Department.
Publications Manager Bill StoneEditor Gerald StoneMultimedia Specialist Jay Sullivan
For more information or to offer comments about this newsletter, please write, call, fax or e-mail:
PATH Publications1357 South 46th Street, Bldg. 452
Richmond, CA 94804-4648Tel: 510/231-9495 FAX: 510/231-9565
e-mail: [email protected] http://www.path.berkeley.edu
Metro Rapid photo on p.12 courtesy LADOT. Other photographs by Gerald Stone
Partners for Advanced Transit and Highways
Director Karl HedrickDeputy Director, AVCSS Program Manager Steven ShladoverATMIS Program Manager Pat ConroyCaltrans Management Liasion Greg Larson
Primary funding provided by:
©2002 California PATH. All rights reserved. Unless permission isgranted, this material shall not be reproduced, stored in a retrievalsystem, or transmitted in any form or by any means, electronic,mechanical, photocopying, recording or otherwise.
ISSN-1061-4311
Printed on recycled paper
Member
NON-PROFIT ORGANIZATIONU.S. POSTAGE PAID
UNIVERSITY OF CALIFORNIA
University of California
California PATH PublicationsRichmond Field Station, Bldg. 452Berkeley, CA 94720-3580
Address Service Requested
23929M0302