developing guidelines for the selection of streamflow … guidelines for the selection of streamflow...
TRANSCRIPT

Developing guidelines for the selection of streamflow gauging stations
Final
5 August 2010

The SKM logo trade mark is a registered trade mark of Sinclair Knight Merz Pty Ltd.
Developing guidelines for the selection of streamflow gauging stations
Final
5 August 2010
Sinclair Knight Merz ABN 37 001 024 095 590 Orrong Road, Armadale 3143 PO Box 2500 Malvern VIC 3144 Australia Tel: +61 3 9248 3100 Fax: +61 3 9248 3400 Web: www.skmconsulting.com
COPYRIGHT: The concepts and information contained in this document are the property of Sinclair Knight Merz Pty Ltd. Use or copying of this document in whole or in part without the written permission of Sinclair Knight Merz constitutes an infringement of copyright.
LIMITATION: This report has been prepared on behalf of and for the exclusive use of Sinclair Knight Merz Pty Ltd’s Client, and is subject to and issued in connection with the provisions of the agreement between Sinclair Knight Merz and its Client. Sinclair Knight Merz accepts no liability or responsibility whatsoever for or in respect of any use of or reliance upon this report by any third party.

SINCLAIR KNIGHT MERZ
I:\VWES\Projects\VW05100\Deliverables\Reports\r06_HQ Gauges Report.docx PAGE i
Contents
1. Introduction 1
1.1. Preliminary criteria for seasonal forecasting site selection from the Bureau 1
1.2. Preliminary criteria for climate change and land use change site selection from the Bureau 2
1.3. Preliminary criteria for modernisation and extension funding site selection from the Bureau 2
2. Literature Review 3
2.1. Introduction 3
2.2. High Quality Climate Data 3
2.3. Measures of quality in gauged streamflow data 4
2.4. Selection of Suitable Sites for Regional Hydrologic Studies 5
2.5. Baseflow separation studies 5
2.6. Hydrologic regionalisation projects 6
2.7. Regionalising rainfall-runoff model parameters 8
2.8. Regional land use change studies 9
2.9. Climate change studies 12
2.10. Seasonal hydrologic forecasting studies 13
2.11. International Precedents for Designating High Quality Streamflow Sites 14
2.12. Supporting spatial datasets 15
2.13. Summary 16
3. Discussion of Guideline Selection Criteria 18
3.1. Introduction 18
3.2. Empirical Selection of Sites 18
3.3. Defining Unimpaired Catchments 19
3.4. Use of quality codes 21
3.5. Use of uncertainty from Australian Standard 22
3.6. Land Use Change 23
3.7. Climate stationarity 26
3.8. Assessing representativeness 30
4. Proposed Guidelines 32
5. Case Studies 35
5.1. Campaspe River, Victoria 35
5.2. Summary of Campaspe River case study outcomes 45
5.3. Adelaide River, Northern Territory 47

SINCLAIR KNIGHT MERZ
I:\VWES\Projects\VW05100\Deliverables\Reports\r06_HQ Gauges Report.docx PAGE ii
5.4. Summary of Adelaide River case study outcomes 55
6. Conclusions and Recommendations 56
7. Abbreviations 59
8. References 60
Appendix A Example streamflow data quality codes 64
A.1 Thiess Environmental Services in Victoria 64
A.2 Melbourne Water – Victoria 66
A.3 NRETAS – Northern Territory 68
A.4 DERM – Queensland 70
A.5 DLWBC – South Australia 71
A.6 HydroTasmania – Tasmania 72
A.7 Department of Water – Western Australia 74
Appendix B Uncertainty plots for Adelaide River at Railway Bridge 75
B.1 Uncertainty plot for 1952-1958 75
B.2 Uncertainty plot for 1958-1979 76
B.3 Uncertainty plot for 1979-current 76

SINCLAIR KNIGHT MERZ
I:\VWES\Projects\VW05100\Deliverables\Reports\r06_HQ Gauges Report.docx PAGE iii
Document history and status
Revision Date issued Reviewed by Approved by Date approved Revision type
Work in progress
25/5/10 T.Ladson K.Austin 25/5/10 Lit Review only
Work in progress
17/6/10 T.Ladson K.Austin 17/6/10 Added draft guidelines and part completion of case studies
Draft A 9/7/10 K.Austin K.Austin 9/7/10 Draft including case studies and earlier comments from Bureau
Draft B 20/7/10 T.Ladson K.Austin 20/7/10 Finalisation of uncertainty analysis and spatial data in case studies
Final 5/8/10 K.Austin K.Austin 5/8/10 Incorporation of comments from the Bureau
Distribution of copies
Revision Copy no Quantity Issued to
Final 1 1 M.Bari, Bureau of Meteorology
N.Plummer, Bureau of Meteorology
G. Amirthanathan, Bureau of Meteorology
Printed: 14 June 2013
Last saved: 14 June 2013 12:02 PM
File name: I:\VWES\Projects\VW05100\Deliverables\Reports\r06_HQ Gauges Report.docx
Author: Amanda Woodman, Brad Neal
Project manager: Brad Neal
Name of organisation: Bureau of Meteorology
Name of project: Developing guidelines for the selection of streamflow gauging stations
Name of document: Developing guidelines for the selection of streamflow gauging stations
Document version: Final
Project number: VW05100

SINCLAIR KNIGHT MERZ
I:\VWES\Projects\VW05100\Deliverables\Reports\r06_HQ Gauges Report.docx PAGE 1
1. Introduction
This report for the Bureau of Meteorology provides advice on the selection of high quality
streamflow gauges across Australia. The aim of this study is to develop guidelines to allow the
Bureau to identify these high quality gauges. The guidelines and their subsequent application are
intended to support the Bureau’s streamflow gauging network modernisation and extension
program and its seasonal (weeks to seasons) streamflow forecasting and long-term (multi-decadal)
streamflow prediction studies. It is assumed that the focus of the guidelines is not to identify high
quality sites for the purposes of flood event (daily and sub-daily) or short-term flow (7-10 days)
monitoring and forecasting.
The study was conducted in three phases:
A literature review of previous regional studies where streamflow gauges have been selected
for their quality from all available streamflow gauges (Section 2);
Develop guidelines for the selection of high quality streamflow monitoring stations for
monitoring changes due to climate change, climate variability, land use and related factors
such as plantations, forest harvesting and bushfire impact on water yield (Section 3 and 4); and
Two example applications of the guidelines in the Campaspe River in Victoria and the
Adelaide River in the Northern Territory (Section 5).
An appendix to the study includes a list of sites previously selected as being suitable for past
hydrologic investigations.
This version of the report is a work in progress and documents the outcomes of the literature
review, draft guidelines and part of the application to the case studies.
1.1. Preliminary criteria for seasonal forecasting site selection from the Bureau
An internal file note produced by the Bureau (2010b) outlined some draft criteria for the selection
of sites at which its seasonal streamflow prediction service would ideally be provided. The
following were draft selection criteria for sites:
Key user stakeholder(s) will likely derive benefit from forecasts at that site;
Site used or needed for flood warning, short term flow or multi-decadal as well as seasonal;
Length of record – greater than 25 years is required for statistical modelling and useful for
dynamic modelling;
Historical data accessible;
Historical data has a low number of periods of zero flow. The more perennial the stream the
more likely it is suitable for seasonal forecasting;

SINCLAIR KNIGHT MERZ
I:\VWES\Projects\VW05100\Deliverables\Reports\r06_HQ Gauges Report_SKM.docx PAGE 2
High quality data without long period gaps;
Good metadata including accurate catchment boundary;
Optimally the site should have a fixed location in record – the streamflow gauge has not been
relocated either upstream/downstream or left/right bank. This may not be necessary if good
ratings are available at both sites and there is a reasonable period of overlapping record;
Commitment from owner for ongoing maintenance and support into the future;
Quality of rating table at both low flow and high flow and quality/stability of the cross section;
Climate data also collected at site or nearby;
Real time data availability – need to be able to generate previous months streamflow on the
first of each month;
Unregulated stream; and
Main tributary catchment to a major water supply storage (dam, weir) with a high contribution
to total storage inflows.
This project aims to refine these criteria, particularly where they relate to the quality of data at the
site of interest. The Bureau (2010b) highlighted that this current study by SKM would assist in
refining the above criteria.
1.2. Preliminary criteria for climate change and land use change site selection from the Bureau
No specific criteria for the selection of streamflow monitoring sites for climate change and land use
change were provided by the Bureau prior to this study. This project aims to develop criteria that
suit this end use.
1.3. Preliminary criteria for modernisation and extension funding site selection from the Bureau
In addition to the above criteria for seasonal forecasting, the Bureau (2010b) outlined draft criteria
for supporting modernisation and extension funding. In funding rounds to date, proposals were
considered for funding where:
The site is located upstream of a major water supply storage;
The site has an existing record greater than 25 years (or at least 15 years and the funding
would help it to reach 25 years in the future); and
There is an ongoing commitment to maintain the station into the future.

SINCLAIR KNIGHT MERZ
I:\VWES\Projects\VW05100\Deliverables\Reports\r06_HQ Gauges Report_SKM.docx PAGE 3
2. Literature Review
2.1. Introduction
This section of the report documents the outcomes of a literature review of previous regional
hydrology studies where streamflow gauges have been selected for their quality from a broader list
of available gauges. This section focuses on the criteria used for selecting gauges to see whether
there are any common criteria between studies. Past studies have been grouped according to the
theme or region of the study wherever possible to avoid duplication of the discussion. Criteria
which are not relevant to the quality of the gauge are ignored in this review, such as the
requirement for catchments to be below a certain size for small catchment dam inflow studies.
By way of introduction, the preparation of a list of high quality rainfall gauges by the Bureau is
also discussed. This is then followed by a discussion of measures of quality in raw streamflow
data, which is an input to the selection criteria used in other studies.
2.2. High Quality Climate Data
The Bureau is already familiar with the concept of high quality data from the identification of high
quality climate data for daily temperature, annual temperature, daily rainfall, monthly rainfall,
monthly pan evaporation and monthly cloud amount (Bureau of Meteorology 2010a). Primary
references for the derivation of these site lists and data are Trewin (2001), Della-Marta et al.
(2004), Torok et al. (1996), Lavery et al. (1992), Lavery et al. (1997), Jovanovic et al. (2006),
Jovanovic et al. (2009).
Key features of note for the high quality climate data are:
Adjustments have been made to some datasets (e.g. temperature) to standardise its quality,
whilst an inhomogeneity or data quality problem in other variables (e.g. rainfall) was not
adjusted and the site was rejected. The adjustments included adjustments for discontinuities
caused by changes in location, exposure, instruments and observation practice;
Some data sets from different sites have been merged where sites were observed to be
correlated and contained a minimum period of overlap;
The list of high quality sites is different when using data at different time scales and there are
more sites for high quality data presented at longer time steps;
Statistical tests formed part of the selection process for some variables. For example, a
cumulative deviation measure for annual rainfall was used to detect abnormal drift from mean
rainfall conditions;
The high quality sites have data periods of varying length;
Missing data is still evident in some datasets;

SINCLAIR KNIGHT MERZ
I:\VWES\Projects\VW05100\Deliverables\Reports\r06_HQ Gauges Report_SKM.docx PAGE 4
The data for each site is accompanied by metadata which enables users to readily select a
subset of gauges from the high quality list for specific purposes. Climate data in urban areas,
for example, was denoted as such;
The list of high quality sites was a very small subset of the total available sites. For example
for daily rainfall, 191 high quality sites were selected from 2100 candidate sites. Since
identification of the high quality sites in 1992, the number that are still high quality has
declined to 152, indicating that the list of high quality sites can change over time if sites do
not continue to meet the necessary standard or are discontinued.
2.3. Measures of quality in gauged streamflow data
Measures of quality in raw streamflow gauge data are considered an input to the selection of high
quality streamflow sites. This information relates only to the quality of data as collected by the
hydrographer and does not consider other catchment or water management processes which could
affect the quality of the data for specific purposes, which are discussed subsequently.
2.3.1. Streamflow Quality Codes
Streamflow data is typically collected by converting continuous water level data into a stream flow
using reference velocity measurements at given water level depths. These reference velocity
measurements are taken at varying intervals, depending on the stability of the control section for
the particular streamflow gauge.
The quality of streamflow data records is assessed by hydrographic data collection agencies. There
are many differences between State and Territory jurisdictions, however the general principle
usually applies that the higher the quality code, the poorer the data quality. These quality codes
identify how the data was collected or estimated on a given time step and take into account the
quality of the rating table used and the magnitude of the water level value being measured.
An example list of quality codes from different jurisdictions around Australia is contained in
Appendix A. Other quality codes may exist for locally collected data. It is clear from this list that
currently there is not a standard set of quality codes that can be considered to form high quality
data across all data collection agencies of Australia.
2.3.2. Measurement uncertainty
The uncertainty in measuring streamflow at a site is a combination of the uncertainty in measuring
the stream water level and the uncertainty in relationship which converts the water level to a
streamflow volume. An Australian Standard (ASA 3778.2.3) specifies a method to quantify the
uncertainty associated with streamflow measurements (Australia Standards International 2001).

SINCLAIR KNIGHT MERZ
I:\VWES\Projects\VW05100\Deliverables\Reports\r06_HQ Gauges Report_SKM.docx PAGE 5
Some recent studies have applied this standard at sites across Australia, including the analysis of
uncertainty in annual flow in 2005/06 at 71 sites across Gippsland in Victoria by Ozbey et al
(2008) and 14 sites in the Werribee River catchment in Victoria by Lowe (2009). This approach
provides a measurement of uncertainty over different flow ranges as well as an integrated
measurement of uncertainty across all flow ranges for a given site. This technique is considered to
provide a reasonably robust and comparable measure of the quality of streamflow data collected at
a site. Unfortunately this technique is neither widely nor routinely applied across Australia. The
application of this technique as part of routine streamflow data collection activities would
significantly improve the ability to separate high quality streamflow data sites from lower quality
sites and would help to drive investment in gaugings in particular parts of the flow regime where
uncertainty is high.
2.4. Selection of Suitable Sites for Regional Hydrologic Studies
A number of studies in regional hydrology have been undertaken across Australia which have
selected high quality gauges suitable for use in these analyses from a wider list of available sites.
These include studies of baseflow, hydrologic index regionalisation, rainfall-runoff model
parameter regionalisation, flow homogeneity, land use change impacts on hydrology, seasonal
forecasting and climate change impacts on hydrology. The criteria used to select sites from these
previous studies are discussed below.
2.5. Baseflow separation studies
A survey of baseflows in unregulated streams of the Murray-Darling Basin was conducted by SKM
(SKM 2002a; Neal et al. 2004) in 2002 and repeated in as yet unpublished work by SKM (2010a)
for the Basin Plan that identified 3 criteria for selection of gauging sites. A total of 178 streamflow
data sites were selected based on the following criteria:
The flow should be unregulated, where an unregulated catchment is defined as one with less
than 10% of the catchment area affected by regulation by major on-stream impoundments
or known major discharges. The definition of a major on-stream impoundments was
subjective, but was generally restricted to those operated to deliberately release water
downstream for environmental or consumptive purposes and did not include on-stream farm
dams. Major discharges focussed on checking whether there were sewage treatment plant
discharges upstream of the site which generated a consistent baseflow.
The flow should cover a minimum concurrent period of 10 years. In SKM (2002a) this
period spanned from 1990-1999 inclusive, but was extended to 2009 in the more recent
unpublished work.
Raw data should contain not more than 5% missing data. Beyond this amount the baseflow
signal at the site was considered to be unduly influenced by the infilling technique.

SINCLAIR KNIGHT MERZ
I:\VWES\Projects\VW05100\Deliverables\Reports\r06_HQ Gauges Report_SKM.docx PAGE 6
This resulted in 178 streamflow data sites being selected for this project across the Murray-Darling
Basin, of which 91 were located in NSW, 26 were located in Qld, 5 located in SA and 56 located in
Victoria.
A more recent baseflows study covering all of Australia is being undertaken as part of the update of
Australian Rainfall and Runoff. The project is estimating baseflow contribution to flood peaks
(SKM 2009b). This study identified four criteria for the selection of sites:
Unimpaired (unregulated flow) sites – sites that are unimpaired from flow management
conditions;
Availability of hourly data – data is required at a high frequency time step, i.e. sites that
record instantaneous flow;
Availability of 30 years of record – to ensure that a range of flood events are captured within
the time series; and
Less than 10% missing data – to maximise the usefulness of the data.
These criteria were developed through examining previous studies in which sites were selected
based on similar criteria. These studies were the National Land and Water Resources Audit (Peel
et al. 2000), other projects for the Australian Rainfall and Runoff Revision project and the
Victorian Sustainable Yields Project (SKM 2003). This resulted in 274 sites being applied for this
project.
2.6. Hydrologic regionalisation projects
Hydrologic regionalisation involves estimating the hydrology in ungauged catchments from a
selection of gauged catchments using regressions between recorded streamflow indices and
catchment characteristics.
The Victorian Sustainable Diversion Limit project (SKM 2003; Voorwinde et al. 2003) determined
the volume of diversion that could sustainably be taken from the catchment. Seven criteria were
used to select sites:
Unregulated;
Area between 10 km2 and 1000 km
2;
Gauged with more than 10 years of data with less than 5% of missing records;
Free from the effect of large reservoirs;
Largely non-urban and unaffected by channel and drainage networks – based on analysis
of topographic maps that show large reservoirs, urbanisation and the extent of channel and
drainage networks; and

SINCLAIR KNIGHT MERZ
I:\VWES\Projects\VW05100\Deliverables\Reports\r06_HQ Gauges Report_SKM.docx PAGE 7
Relatively unaffected by upstream diversions – based on whether summer diversions were
less than 10% of the mean summer flow. Where Summer is between December and April, and
diversions are to urban and rural users. Diversions over the winter period generally do not
exceed 1% of the mean winter flow and the largest diversion was estimated to be less than
3.5% of the mean winter flow.
This resulted in the selection of 165 sites.
The Sustainable Diversion Limit technique was also applied in south-west Western Australia (Lang
et al. 2008; SKM 2008a) and used 4 criteria for the selection of sites:
Catchment area of greater than 10km2;
A flow record of at least 10 years, post 1975 – due to the shift in climate in 1975;
Minimal percentage of missing data; and
Impacts of regulation should be negligible;
This resulted in the selection of 142 gauges. The second criterion above is of key importance for
south-west Western Australia, because earlier data is considered unrepresentative of current climate
conditions. To ensure a good spatial range of gauges were included in this analysis, gauges were
not excluded based on a specific percentage of missing data (third criteria above) allowed but were
assessed for suitability of infilling and their importance in representing regional trends.
The Northern Australia Sustainable Yields Project included regionalisation of ecologically relevant
hydrologic indices (SKM 2009a) from gauged to ungauged catchments. Several criteria were
developed in consultation with CSIRO and State and Territory agencies for the selection of sites:
Data assessment period from 1/9/1972 to 31/8/1987 (15 years) for annual indices and
1/11/1972 to 31/10/1987 for wet/ dry season indices;
No more than 10% missing data. Data was infilled using Sacramento rainfall-runoff models;
No sites impeded by upstream impoundments (i.e. unregulated flow);
No more than 60% of the gauged streamflow record above the maximum gauged stage
height (relevant to the analysis of average, median and high flow indices, and wet season
indices);
No sites with known unstable rating tables at low flows (relevant to the analysis of low flow
and dry season indices only.
This study differed from the hydrologic regionalisation studies conducted in southern Australia
because of known difficulties in measuring flows at very high and low flows. It involved thorough
examination of rating table stability from the gauging history, as well as examination of the number
of gauging within designated flow ranges. At high flows there are difficulties with access to

SINCLAIR KNIGHT MERZ
I:\VWES\Projects\VW05100\Deliverables\Reports\r06_HQ Gauges Report_SKM.docx PAGE 8
remote areas of tropical northern Australia, where road access can be cut off for several months
during the wet season. There can also be significant shifts in channel morphology due to the high
flow volumes generated, which can also affect low flow readings in the following dry season if the
gauge is not re-rated. At low flows there are difficulties at some sites due to the presence of
carbonate aquifers discharging to streams and creating a natural build up of calcium carbonate
(limestone) on control sections. This is evident as an increase in rated discharge as the dry season
progresses.
The Northern Australia Sustainable Yields Project drew upon pre-cursor studies by Petheram et al
(2008), SKM (2007b) and SKM (2008b). Petheram et al (2008) also noted that a minimum period
of less than 10 years would be unsuitable because the El Nino Southern Oscillation, which is driver
of climate variability, operates on a 2-7 year climate scale. Petheram et al. (2008) selected 99 sites
whilst the SKM work was restricted to the Adelaide and Finniss River basins only.
Moliere et al (2006) used one criteria for streamflow gauge selection in their study of flow
characteristics of streams in the tropical rivers region – that gauges must have at least 20 years of
complete annual flow data. In a related study to classify the flow regime of data-limited streams in
the wet-dry tropical region of Australia (Moliere et al. 2009) the same criterion was applied to
select 27 sites – 13 within the Daly River catchment, 6 within the Fitzroy River catchment, and 9
within the Flinders River catchment.
2.7. Regionalising rainfall-runoff model parameters
Similar to the above studies of hydrologic regionalisation of gauged data, a number of studies have
investigated the regionalisation of rainfall-runoff model parameters.
This technique is known to have been applied in Australia in the mid-1990s in Nathan et al. (1996),
which regionalised the four MOSAZ rainfall-runoff model parameters using catchment
characteristics. The streamflow sites selected for the analysis, which was limited to Victoria, was
based on the list of sites prepared in the Low Flow Atlas of Victorian Streams (Nathan et al. 1993).
The criteria used by Nathan and Weinmann (1993) were:
A minimum length of record of 15 years;
Within each drainage division, catchments should be representative of a range of gauged
catchment sizes and climatic conditions;
No appreciable artificial regulation (<5% of the catchment is regulated) or diversion (<5%
of the mean annual flow) upstream of the point of gauging; and
Catchments should be free from appreciable dense urban development (<5% of the
catchment is densely urbanised).

SINCLAIR KNIGHT MERZ
I:\VWES\Projects\VW05100\Deliverables\Reports\r06_HQ Gauges Report_SKM.docx PAGE 9
This resulted in 117 catchments being selected by Nathan and Weinmann (1993), with a further 78
being added in Nathan et al. (1996) possibly due to additional data collected between the two
studies and because of additional sites sourced from Nathan and McMahon (1992).
Chiew et al. (undated) took a similar approach but for the estimation of SIMHYD parameter values
for application in ungauged catchments across Australia. This study drew upon a list of 331
unimpaired catchments derived for the National Land and Water Resources Audit by Peel et al..
They used several parameters to select appropriate catchments for analysis, ensuring that there
were no inconsistencies in the data series. Inconsistent data was identified by one or more of the
following:
Runoff coefficient greater than 0.8;
Actual evapotranspiration (mean annual rainfall minus mean annual runoff) greater than 0.8
times the mean annual areal potential evapotranspiration; and
Clear inconsistencies between monthly rainfall and runoff data.
This resulted in 293 catchments being used for Chiew et al. (undated).
The study to estimate streamflow in ungauged catchments by Peel et al. (2000) selected sites based
on the following criteria:
At least 10 years (120 months) of unimpaired streamflow data;
Area between 50 km2 and 2000 km
2;
Unimpaired catchments with no upstream regulation or diversion;
Missing data was allowed as long as 120 months of data was available;
When a catchment has greater than 20% of its area represented by another
catchment(s), then the sub-catchment(s) are used, while the larger catchment is not used;
and
Available data from various federal, state and territory agencies.
This resulted in 331 gauging stations being applied for this study. This study appears to be the only
one which has considered the issue of nested catchments duplicating information.
2.8. Regional land use change studies
Many studies have been undertaken in Australia examining the effect of land use change on
hydrology. The majority of these studies are local catchment studies, however there have been a
number of regional investigations focussed on the hydrologic impact of farm dams.

SINCLAIR KNIGHT MERZ
I:\VWES\Projects\VW05100\Deliverables\Reports\r06_HQ Gauges Report_SKM.docx PAGE 10
2.8.1. Farm Dams
A project undertaken to assess the impacts and implications of farm dams on catchment yield
(ICAM et al. 1999) used a two step process for identifying high quality gauges for assessing trends
in streamflow:
1) Selection critera that had to be satisfied:
a) 10 years of streamflow, rainfall and temperature
b) Reasonable quality of streamflow gauging according to AWRC rating.
2) Liaison with local State agency officers for provision of essential background information on
land use development, key issues and concerns.
This resulted in the selection of 11 key catchments.
Gan et al. (1988) estimated yield from farm dams from 71 catchments across Victoria. Catchments
were in the range of 0.1 km2 to 250 km
2 with no appreciable urban area and no large storages
upstream.
Nathan et al (undated) undertook a study to estimate farm dam yield in small agricultural
catchments in south-eastern Australia. The catchments were required to broadly represent the
range of agricultural catchments found in the regions; the following selection criteria were used:
Less than 20km2 in area;
Rural, with no appreciable urban development;
Have no significant impoundments upstream of the point of interest;
Are not influenced by snowmelt (thus have an elevation of less than 1000 mAHD);
Have dense to medium forest covering less than 90% of the total catchment area;
Have a mean annual rainfall of less than 1400mm;
Exhibit the highest mean monthly streamflow during Winter (May – October) months; and
Have at least three years record of reasonable quality streamflow.
This resulted in 37 catchments being used in the study (31 in Victoria and 6 in NSW).
SKM is currently undertaking a study to model the impacts of farm dams at 168 sites across the
Murray-Darling Basin. The criteria being used to select streamflow gauges for the analysis
include:
Minimum 15 year record;
End of the 15 year record must be after 1995;
Gauge must be free from significant regulation or major storages / offtakes;
SINCLAIR KNIGHT MERZ
I:\VWES\Projects\VW05100\Deliverables\Reports\r06_HQ Gauges Report_SKM.docx PAGE 11
Overall choice of gauges must provide good spatial coverage;
1 gauge in SA was excluded due to an excessive baseflow component, which was not
representative of farm dam inflows; and
Several gauges were excluded because they required excessive periods of infilling.
The effect of farm dams on streamflows in south-west Western Australia was undertaken by SKM
(2009c). Selection of catchments was undertaken by the Western Australia Department of Water
based on local knowledge of the extent of farm dam development in the catchments. Streamflow
gauges were then assigned to those catchments.
2.8.2. Plantations, Forest Harvesting and Bushfires
A number of studies examining the effects of plantations, forest harvesting and bushfires have been
undertaken around Australia, however the majority of these have been local investigations rather
than regional scale ones. Examples include studies into the impact of blue gum plantations on
baseflows in five catchments in south-west Victoria (SKM 2008c).
Regional studies of the effects of plantations, forest harvesting and bushfires are less common. The
assessment of the 2003 and 2006/07 alpine bushfires on streamflows was undertaken in several
studies (SKM 2007c; SKM 2008c; SKM 2009d). No specific criteria for selecting streamflow
gauges were identified in those reports, as gauging information was simply used when and where it
was available. The effect of changing from forested catchments to pasture was assessed at 1 km by
1 km grids across Victoria in SKM (2008f) however streamflow gauges were not used as part of
that assessment. Outputs were expressed as a percentage change without specifying the baseline
conditions from which the results were changed.
Historical trend analyses were undertaken on one forested catchment for NSW State Forests, from
a selection of six candidate catchments. The criteria for selection were “on the basis of long,
reliable hydrologic records (rainfall and streamflow) and a significant proportion of the catchment
having been historically planted with pines” (SKM 2002b). The remaining five candidate
catchments in the study area did not meet these criteria.
The effect of potential future plantations on streamflows was estimated in Sustainable Yields
projects for the Murray-Darling Basin (CSIRO 2008a), Tasmania (CSIRO 2009a) and South-West
Western Australia (CSIRO 2008b). This scenario was not prepared for the Northern Australia
Sustainable Yields project.
A recent study led by SKM for the NWC has identified catchments where intercepting activities are
expected to increase in the future (SKM et al. 2010). The study was a national baseline look at
unregulated intercepting activities including plantations, land use change, stock and domestic

SINCLAIR KNIGHT MERZ
I:\VWES\Projects\VW05100\Deliverables\Reports\r06_HQ Gauges Report_SKM.docx PAGE 12
bores, farm dams and periurban development. This information could be used as an overlay to
prioritise gauges. In addition meteorological data sets and climate change scenarios should be
reviewed as well. The Bureau and CSIRO are expected to be sources of such data.
2.9. Climate change studies
Chiew et al (2008) undertook a study that assessed the impact of climate change on runoff
throughout the Murray-Darling Basin using rainfall-runoff models. This study used the following
criteria to select sites:
Unregulated catchment;
Areas between 50 and 2000km2;
Most gauges have 70% of daily streamflow data considered as good quality over the study
period; and
Dates range between 1975 and 2006.
The same criteria as listed in Section 2.6 were used for the Northern Australia Sustainable Yields
project. For the south-west Western Australia Sustainable Yields project, the selection criteria for
selecting the 106 streamflow gauges for calibration of rainfall-runoff models were that catchments
had to (CSIRO 2009b):
be at least 10 km2 in area;
have at least 10 years of recent, good quality and continuous streamflow record; and
contain streams with potable or near potable brackish quality water.
For the Tasmanian Sustainable Yields project, a total of 60 streamflow gauges were used for the
calibration of rainfall-runoff models but the criteria for selecting these sites were not reported
(CSIRO 2009a).
Each of the sustainable yields projects across Australia assessed water availability under a recent
climate scenario which repeated data from the last 10-11 years, typically from 1997-2007. The
selection of this period was based on the analysis of climate data, not streamflow data.
McMahon et al. (2007) have done extensive work with a global data set for assessing
characteristics of annual streamflows. This data base consists of 1221 sites worldwide that were
selected based on the following criteria:
10 years or more of continuous historical annual and monthly flows;
Not impacted by major water withdrawals or upstream reservoirs; and
Data is free from errors.
SINCLAIR KNIGHT MERZ
I:\VWES\Projects\VW05100\Deliverables\Reports\r06_HQ Gauges Report_SKM.docx PAGE 13
In more recent work that McMahon and Peel are undertaking, a sub-set of the data used for
McMahon et al. (2007) was applied. In addition to those criteria outlined for McMahon et al
(2007), sites that did not satisfy checks were removed. These checks were for:
Transcription errors;
Errors relating to catchment area and location; and
Impacts of major water withdrawals and upstream reservoirs.
This results in 861 streamflow records being applied for this study. Median streamflow record
length is 32 years (ranging between 10 and 172 years); median area is 1,620 km2 (ranging between
3.6 and 4,640,300 km2).
Kiem and Verdon-Kidd (2010) identified statistically significant break points in historical climate
at 8 gauged streamflow sites across Victoria. The streamflow data were not used for the statistical
analysis, but were used to support conclusions drawn from the analysis of rainfall data. These 8
sites had a desirable length of record of 60 years, representative of natural flow conditions and
were spatially distributed across Victoria. In the Goulburn and Yarra River catchments they
were unable to find suitable sites and utilised modelled data in their analysis in those two
catchments.
A climate shift scenario has been adopted in each of the Victorian State Government’s Sustainable
Water Strategies. This scenario is based on setting the mean annual runoff in the pre-July 1997
period equal to the mean annual runoff in the post-July 1997 period. The individual streamflow
gauges used in these adjustments are not listed in the Sustainable Water Strategies, however having
at least ten years of data from 1997 onwards is necessary to undertake the calculation.
In south-west Western Australia the shift in climate was observed to occur earlier and only data
collected after 1975 is used in current water planning (CSIRO 2009b).
2.10. Seasonal hydrologic forecasting studies
A project that undertook seasonal forecasting of Victorian Streamflows selected high quality
gauges to undertake the analysis, the selection criteria were (SKM 2007a):
Natural streamflow conditions (or as close as possible) that are not impacted by upstream
impoundments or diversions – Identified using the Flow Stressed Ranking scores and
Sustainable Diversion Limit statistics;
Long streamflow records (preferably at least 60 years to capture multi-decadal variability);
Spatially distributed across Victoria to ensure several different regions are analysed;
Relatively large catchment;

SINCLAIR KNIGHT MERZ
I:\VWES\Projects\VW05100\Deliverables\Reports\r06_HQ Gauges Report_SKM.docx PAGE 14
Streamflow gauges that are “useful” to DSE (the client) for operational purposes; and
Minimal % of missing data.
2.11. International Precedents for Designating High Quality Streamflow Sites
The selection of high quality streamflow sites around the world was previously reported in Section
2.9 for the global climate change study by McMahon et al. (2007). Further information was
available on the selection of high quality streamflow sites in the United States. The United States
Geological Survey (USGS) has established a hydro-climatic data network for use in the study of
long-term climate variations (Slack et al. 2006). The process by which the USGS selected its sites
is similar to that being undertaken in this study, namely by compiling sites selected and the criteria
used to select them from a range of previous studies. The criteria adopted by the USGS are as
follows:
Availability of data in electronic form;
Breadth of coverage – records from any station were considered if it had any data over the
assessment period from 1874-1988;
Length of record of at least 20 years, however sites with less than 20 years were considered if
their type of catchment or location was underrepresented in the data set;
Accuracy of records – records had to be predominantly “good” where good was defined as
having 95% of the daily mean discharge values to be within 10% of the true value, but
with an allowance for “professional judgment of the office that obtains and prepares the
record”;
Unimpaired (unregulated) basin conditions – this included no upstream impoundments or
significant changes in land use, but also included no reduction in baseflow due to extreme
groundwater pumping;
Measured discharge values should not include an excessive number of estimated values. No
attempt was made to infill the data.
Of note in the USGS hydro-climatic data network site selection was the flexible approach adopted.
There were a number of exceptions to the criteria adopted, such as including part of the record only
if it was unimpaired at an earlier point in its history and allowing sites with constant upstream
diversions or small hydropower storages which would have no impact on longer time step climate
variability studies.
Carlisle et al. (2009) used spatial datasets and hydrologic models to select 1272 reference sites
across the United States from 5271 candidate gauges. The aim of the analysis was to identify sites
which were undisturbed from flow regulation or land use change. The analysis used a range of
modelling techniques to identify deviation from modelled conditions in the historical records as an

SINCLAIR KNIGHT MERZ
I:\VWES\Projects\VW05100\Deliverables\Reports\r06_HQ Gauges Report_SKM.docx PAGE 15
indicator of undisturbed flow conditions. Thirteen hydrologic metrics were combined to evaluate
deviation from historical conditions.
The World Meteorological Organisation (2004) developed criteria for selecting streamflow gauges
in pristine river basins for use in climate change studies. These criteria were the same as those
used in Slack et al. (2006). The dataset was to be known as a Reference Climate Variability and
Change Hydrological Station Network. More information on this network could not be located and
the absence of any reference to this in McMahon et al. (2007) suggests that the network has not
been established yet.
2.12. Supporting spatial datasets
Spatial analysis utilising available National and State/Territory data sets will support the
identification of high quality stream gauges. A review of available spatial datasets was undertaken
to examine whether there were any key datasets missing at a National or regional scale which could
inhibit the ability to identify high quality streamflow sites. This list of useful spatial characteristics
was derived by examining the spatial datasets utilised in the previous studies outlined above.
It can be seen from Table 2-1 that most datasets are available uniformly at a National or
State/Territory scale, and hence could be readily adopted if needed for use in developing selection
criteria. The exceptions to this are the point source discharges, such as from mine sites, irrigation
drains and sewage treatment plants, and point source diversions. Both of these datasets are
typically held by water utilities and are not readily available at a State/Territory or National scale.
Particular opportunities exist with national mapping programs. This includes the Department of
Climate Change NCAS – LCCP (National Carbon Accounting System – Land Cover Change
program), which can provide current and retrospective views of tree cover and bushfire. It also
includes the national plantations inventory on the extent and location of current plantations (Bureau
of Rural Sciences) and farm dam mapping programs such as the Murray Darling Basin Authority /
Geosciences Australia initiative to update waterbodies and farm dams in the Murray-Darling
Basin.

SINCLAIR KNIGHT MERZ
I:\VWES\Projects\VW05100\Deliverables\Reports\r06_HQ Gauges Report_SKM.docx PAGE 16
Table 2-1 Supporting Spatial Datasets
Data set Source Coverage
Streamflow gauge sites State/Territory agencies State/Territory
Stream network Geoscience Australia National (1:250k)
River basin boundaries Geoscience Australia National
Major river catchment boundaries Geoscience Australia National
Streamflow gauge catchment boundaries State/Territory agencies State/Territory
Geology Geoscience Australia National
Rainfall Bureau of Meteorology National
Evapotranspiration Bureau of Meteorology National
DEM (to extract stream order) Bureau of Meteorology / GA National
Land use BRS National
Farm dams State and Commonwealth Agencies / GA Regional
Tree cover (includes logging) DCCEE, LCAS, State/Territory agencies National, 1972 - 2009
Bushfire extent State agencies / DCCEE, LCAS Regional / National
Water bodies Geoscience Australia National (1:250k)
Point Source Discharges Water authorities Local
Diversions Water authorities Local
2.13. Summary
This literature review highlighted the following:
1) Streamflow data quality codes around Australia vary between each State and Territory and
there is no commonly accepted definition of “high quality” data based on quality codes;
2) Estimating streamflow gauge uncertainty using Australian Standard ASA 3778.2.3 has been
undertaken at a small selection of sites in southern Victoria, but is not routinely applied there
or elsewhere in Australia. The use of this standard to measure streamflow gauge uncertainty
over time could improve the ability to transparently and robustly identify high quality sites;
3) Regional hydrologic studies have been undertaken throughout Australia that identified
streamflow gauging stations suitable for use in those studies. The selection criteria were
somewhat similar. Key points to note from these studies were:
a) Sites are usually unimpaired. The definition of unimpaired typically involved less than
10% of the catchment by area affected by flow regulation. Some studies added that they
should be non-urban and unaffected by major discharges and diversions;
b) Sites usually contain less than 5-10% missing data. The way in which missing data was
specified was not readily available, however in the tropical northern Australia an analysis

SINCLAIR KNIGHT MERZ
I:\VWES\Projects\VW05100\Deliverables\Reports\r06_HQ Gauges Report_SKM.docx PAGE 17
of rating tables and gauging was undertaken to limit the percentage of the flow record
above the maximum gauged value;
c) Sites usually had a minimum period of record, which varied from 10 to 30 years
depending on the study, with one study designed to capture inter-decadal climate
variability specifying a minimum of 60 years of data. In south-west Western Australia
this period had to be after the climate shift around 1975. In one study this period of record
was specified to include a recent date;
d) Some studies specified that sites should be representative of a range of catchment sizes
and climate conditions;
e) One study applied tests to eliminate sites with inconsistencies between observed climate
data and observed streamflow data; and
f) Some studies included liaison with State and Territory agency hydrographers to ensure
that there were no local factors affecting the gauges.
4) A similar exercise undertaken by the United States Geological Survey (USGS) adopted a
flexible approach within broad selection criteria to ensure that all types of sites were
represented. Additional criteria adopted by the USGS that have not been mentioned in
Australian studies were the exclusion of sites where baseflow was affected by excessive
groundwater pumping and the inclusion of sites where upstream diversions were constant over
the period of record.
5) A range of supporting spatial datasets is available for assisting with the selection of high
quality sites and assessing their representativeness. None of these datasets were considered to
prohibit the selection of sites, with the exception of point source discharges and diversions,
which are not readily available in a single repository at each State/Territory level.
The list of gauges used in the above studies has been compiled into a spreadsheet which will allow
an empirical check of any selection criteria developed in this study.

SINCLAIR KNIGHT MERZ
I:\VWES\Projects\VW05100\Deliverables\Reports\r06_HQ Gauges Report_SKM.docx PAGE 18
3. Discussion of Guideline Selection Criteria
3.1. Introduction
After completing the literature review there are a number of possible approaches to selecting sites.
This section of the report discusses some of the issues surrounding the approach and selection
criteria for identifying high quality streamflow gauges, including:
Pros and cons of an empirical selection of sites and the potential use of the empirically selected
dataset of gauges from previous studies;
Criteria for identifying unimpaired sites;
Comments on how to incorporate land use change into the assessment;
Selection criteria based on available data quality for unimpaired sites;
Selection criteria based on an estimate of measurement uncertainty for unimpaired sites;
Comments on how to incorporate climate stationarity into the assessment; and
Assessing representativeness of the sites selected.
3.2. Empirical Selection of Sites
The literature review identified a list of sites across Australia which had been selected in previous
studies in hydrology for seasonal streamflow forecasting, land use change and climate change
investigations. One approach to selecting sites would be to compile this list into a consolidated
dataset on the assumption that if a site has been specifically selected for one or more of these
previous studies, then it must have value for these types of investigations and would be suitable for
the Bureau’s purposes.
The advantages of this approach are that:
It is fast and simple to implement; and
The data can still be supplemented with information about the quality of data at the site for
users of the data.
The disadvantages of this approach are that:
The criteria used in those previous studies vary, resulting in inconsistent selection criteria;
In some regions there may have been no or only one study undertaken, which limits the
confidence that a particular site is high quality for the purposes of the Bureau and that all high
quality sites have been selected;

SINCLAIR KNIGHT MERZ
I:\VWES\Projects\VW05100\Deliverables\Reports\r06_HQ Gauges Report_SKM.docx PAGE 19
The length of available data and its quality changes over time. Sites which were not suitable
for previous studies may now meet the selection criteria applied in those studies because of
additional data since collected.
For these reasons, it is recommended that the list of sites used in previous studies should only be
used for reference purposes by the Bureau to sanity check its own selection of sites.
3.3. Defining Unimpaired Catchments
A common feature of all of the catchments identified in previous studies for investigating seasonal
streamflow forecasting, land use change and climate change impacts on hydrology was that they
were unimpaired. The definition of unimpaired varies slightly from study to study, however there
are some common features. There is also some redundancy in defining unimpaired catchments in
previous studies, because in many cases the definition of an unimpaired catchment has been carried
from one study to the next rather than being derived independently.
The following definition of an unimpaired catchment is proposed:
A stream gauging station is in an unimpaired catchment if not more than 10% of the
catchment by area is affected by flow regulation, and with major discharges and diversions
being less than 10% of the mean annual flow.
The figure of 10% by area for flow regulation acknowledges that some form of flow regulation
would be likely to exist in most catchments around Australia, but that any more than 10% is likely
to compromise the integrity of the dataset. A figure of 5% could equally have been chosen and in
some applications no flow regulation may be desirable. Similarly the figure of 10% of the mean
annual flow being diverted or discharged is arbitrary and could be tightened to a smaller volume,
particularly where mean annual flow volumes are large, such as in tropical areas. In some
instances, seasonal patterns of discharge or diversion may adversely affect streamflows in low flow
months, even if less than 10% of the mean annual flow is diverted or discharged. The threshold of
10% for the volume of diversions or discharges relative to mean annual flow may need to be more
stringent for climate change investigations than seasonal forecasting. The magnitude of the change
being detected may be within 10% of the mean annual flow in some climate zones, although it is
noted that in south-east Australia climate induced changes in mean annual flow post-1994 have
been well in excess of this figure.
The effect of intercepting activities such as small catchment dams (farm dams), bushfire regrowth
and plantation forestry lie outside of the diversion licensing regime in some jurisdictions and to
different regimes and would be in addition to licensed diversions. Discussion of these intercepting
activities occurs in Section 3.6.

SINCLAIR KNIGHT MERZ
I:\VWES\Projects\VW05100\Deliverables\Reports\r06_HQ Gauges Report_SKM.docx PAGE 20
The degree to which a catchment is impaired may change over time. It is assumed in the analysis
that sites are still useful where data exists prior to a flow regulating structure being constructed or
after its decommissioning.
For some applications, the selection criteria by which a catchment is designated as unimpaired may
be relaxed or tightened. For this reason, it is recommended that the data in Table 2-1 be collated
with each site to allow end users to restrict their selection of sites if needed. The approach to
collecting the data in Table 3-1 would be to focus on the most readily accessible sources of
information which would exclude a site as being impaired (e.g. the presence of a major on-stream
dam) and only to collect the remaining data for sites where the most readily accessible data does
not exclude the site.
Table 3-1 Metadata for degree to which catchments are unimpaired
Item Comments and Definitions
Proportion of the catchment upstream of a flow regulating
structure
- Name
- Storage Capacity (if applicable)
- Area upstream of structure
- Proportion of catchment upstream of structure
- Date of construction of flow regulating structure
- Date of decommissioning of flow regulating
structure
A flow regulating structure is defined as any on-stream
storage that deliberately releases water for environmental
use, consumptive use or electricity generation purposes.
This assessment should be undertaken for each flow
regulating structure if the proportion of the catchment
upstream of the structure is less than 10% by area.
Electricity generation storages may be acceptable if they
only regulate flows on a daily basis and do not affect flows
on a seasonal basis.
Point source discharges within the catchment
- Name
- Description of Location (tributary name, nearest
urban centre or spatial co-ordinates)
- Average annual discharge volume (ML)
- Period of record affected by the discharge
This information must currently be sourced from individual
water utilities and would include sewage treatment plant
discharges, industrial discharges (e.g. from mine
dewatering) and irrigation drains. It should include any
inter-basin transfers to rivers associated with water supply
operations.
Current annual diversions upstream of streamflow gauge:
- Surface water licence volume (ML)
- Groundwater licence volume (ML)
- Total licence volume (ML)
- Licence volume as % of mean annual flow at
gauge (%)
- Period of record affected by the diversions (if
known)
The period of record of diversions may only be known
approximately. There are known commencement dates for
some major irrigation diversions such as the Ord River
scheme and Thomson River diversions to Melbourne. The
groundwater licence volume would be collected for all
production bores in the first instance and would be refined
to include only those in connection with the surface water
system if this criteria is critical for the selection of a site.
SINCLAIR KNIGHT MERZ
I:\VWES\Projects\VW05100\Deliverables\Reports\r06_HQ Gauges Report_SKM.docx PAGE 21
3.4. Use of quality codes
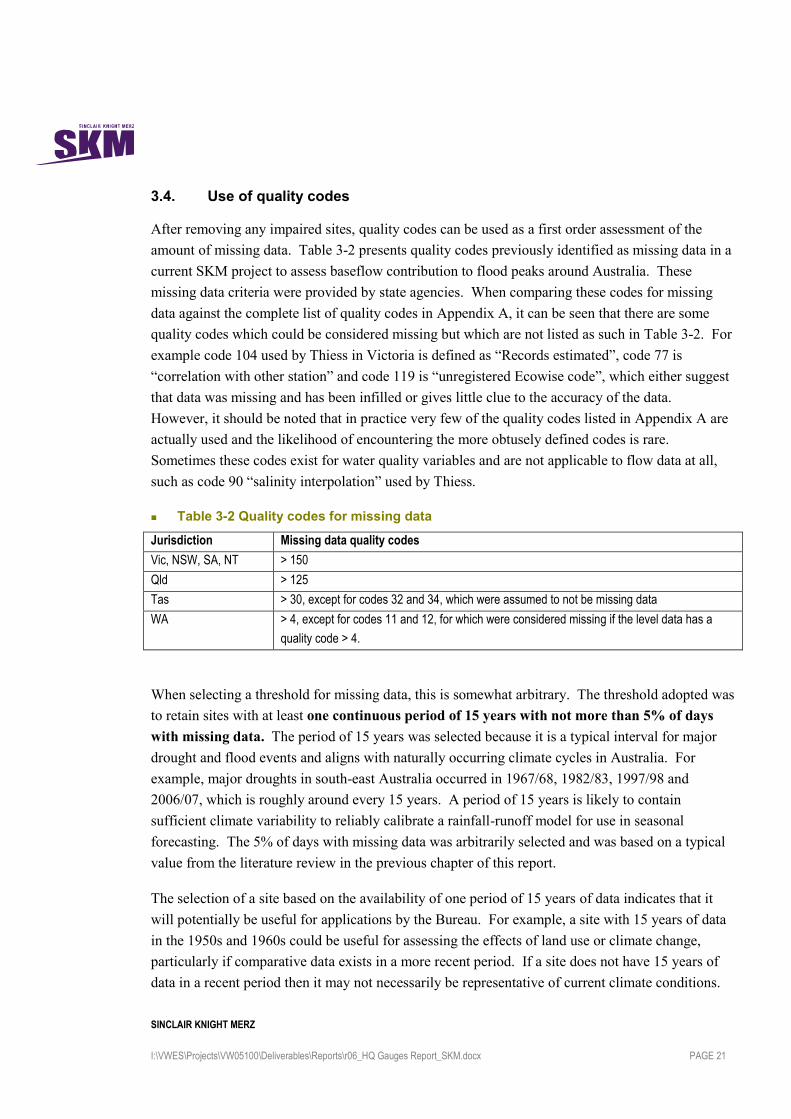
After removing any impaired sites, quality codes can be used as a first order assessment of the
amount of missing data. Table 3-2 presents quality codes previously identified as missing data in a
current SKM project to assess baseflow contribution to flood peaks around Australia. These
missing data criteria were provided by state agencies. When comparing these codes for missing
data against the complete list of quality codes in Appendix A, it can be seen that there are some
quality codes which could be considered missing but which are not listed as such in Table 3-2. For
example code 104 used by Thiess in Victoria is defined as “Records estimated”, code 77 is
“correlation with other station” and code 119 is “unregistered Ecowise code”, which either suggest
that data was missing and has been infilled or gives little clue to the accuracy of the data.
However, it should be noted that in practice very few of the quality codes listed in Appendix A are
actually used and the likelihood of encountering the more obtusely defined codes is rare.
Sometimes these codes exist for water quality variables and are not applicable to flow data at all,
such as code 90 “salinity interpolation” used by Thiess.
Table 3-2 Quality codes for missing data
Jurisdiction Missing data quality codes
Vic, NSW, SA, NT > 150
Qld > 125
Tas > 30, except for codes 32 and 34, which were assumed to not be missing data
WA > 4, except for codes 11 and 12, for which were considered missing if the level data has a
quality code > 4.
When selecting a threshold for missing data, this is somewhat arbitrary. The threshold adopted was
to retain sites with at least one continuous period of 15 years with not more than 5% of days
with missing data. The period of 15 years was selected because it is a typical interval for major
drought and flood events and aligns with naturally occurring climate cycles in Australia. For
example, major droughts in south-east Australia occurred in 1967/68, 1982/83, 1997/98 and
2006/07, which is roughly around every 15 years. A period of 15 years is likely to contain
sufficient climate variability to reliably calibrate a rainfall-runoff model for use in seasonal
forecasting. The 5% of days with missing data was arbitrarily selected and was based on a typical
value from the literature review in the previous chapter of this report.
The selection of a site based on the availability of one period of 15 years of data indicates that it
will potentially be useful for applications by the Bureau. For example, a site with 15 years of data
in the 1950s and 1960s could be useful for assessing the effects of land use or climate change,
particularly if comparative data exists in a more recent period. If a site does not have 15 years of
data in a recent period then it may not necessarily be representative of current climate conditions.

SINCLAIR KNIGHT MERZ
I:\VWES\Projects\VW05100\Deliverables\Reports\r06_HQ Gauges Report_SKM.docx PAGE 22
Consideration of whether the period of available data is representative of current climate will affect
its use by the Bureau and is discussed further in Section 3.7.
The quality of data can be differentiated from whether data is simply present or missing. The
quality of data is a reflection of the stability and therefore certainty of the rating table used to
convert water levels into streamflow. A complex measure of uncertainty in the data collected is
presented in Section 3.5. A simpler approach using quality codes was considered to minimise the
degree of effort required to classify streamflow gauges according to their quality. One simple but
key measure of data quality is the extent to which streamflow data has been generated using water
levels above or below the highest or lowest water levels at which streamflow gaugings exist. This
indicates that the rating table has been extrapolated beyond the range of reliable recorded values.
This is a common issue in remote areas with poor access, particularly where these areas are
inaccessible over parts of the flow regime, such as in tropical Australia during the wet season. It
would also include low flow data collected in a drought worse than that which has previously been
gauged, however low flow data is typically more reliably extrapolated than high flow data.
Establishing a threshold for selecting high quality data based on rating table extrapolation is
arbitrary and may need to be relaxed in areas where no other data exists, which is likely to be the
case in some river basins in remote tropical areas. A notional threshold has been selected of only
retaining sites which have not more than 20% of data outside of the range of gauged data. This
may be revised by the Bureau after considering the effect that this threshold has on the number of
sites selected in river basins across Australia. It may also be revised if it can be correlated with the
more meaningful measure of data uncertainty discussed in Section 3.5.
3.5. Use of uncertainty from Australian Standard
The previous section discussed the use of quality codes to reflect the stability and therefore
certainty of the rating table used to convert water levels into streamflow. A more complex
approach incorporates a statistical analysis of uncertainty associated with the streamflow
measurements. This procedure is time intensive and is presented as an alternative to using quality
codes. While this approach may time consuming, it provides the only reliable measure of
uncertainty across the whole flow range that is independent of subjective quality code
classifications.
At each streamflow gauging site the water level is measured on a regular (or continuous) basis and
converted to a flow rate using a rating curve. The rating curve is constructed based on a sample of
measured streamflows and their corresponding water level (a concurrent streamflow and water
level data sample is termed a ‘gauging’). The rating curve can be fitted to the gaugings either
using statistical techniques or can include some subjective judgment that may take into account the
influence of the shape of the river cross section and downstream obstructions. Details of these

SINCLAIR KNIGHT MERZ
I:\VWES\Projects\VW05100\Deliverables\Reports\r06_HQ Gauges Report_SKM.docx PAGE 23
methods can be found in standard hydrology text books or the relevant Australian Standard
(Standards Australia 1990).
The Australian Standard number AS3778 (Measurement of water flow in open channels) specifies
a method to quantify the uncertainty associated with streamflow measurements and considers the
uncertainty due to measurement error associated with the water level and uncertainty in the rating
curve. Specific information regarding the water level measurement uncertainty is generally
contained in the manufacturer’s specifications. Alternatively the uncertainty can be estimated by
comparing the continuous measurements with more accurate spot readings. The uncertainty in the
rating curve is based on a statistical analysis of the variation in the individual gaugings used to
construct the rating curve and follows these general steps:
The historical gaugings that are representative of the current conditions at the site are selected.
The rating curve is divided into segments which, in the log domain, can be characterised with a
straight line.
The uncertainty estimate is based on the scatter of historical gaugings around the rating curve
within each segment.
Further details of these steps, including the relevant equations, can be found in the Australian
Standard or the descriptions given by McMillian (2008) or Ozbey et al. (2008).
It should be noted that when applying the Australian Standard that 20 gaugings are required in each
segment to ensure a statistically valid estimate of the uncertainty in flow. Ozbey et al. (2008)
found that this was not possible for several sites in the Gippsland region of Victoria due to limited
gaugings.
Establishing a threshold for selecting high quality data based on uncertainty analysis is arbitrary,
and the acceptable level of uncertainty will depend on the use of the data and the alternatives
available. A notional threshold has been selected of only retaining sites which have an uncertainty
in the mean annual flow (MAF) of less than 10%. This figure is based on the Ozbey et al (2008)
study of the Gippsland regions, which found that at the majority of monitoring sites, uncertainty in
mean annual flow estimates ranged from +/- 5% to +/- 15%. The chosen threshold of 10% MAF
may require review by the Bureau after the method has been applied to more sites. The Bureau
may also wish to include a threshold for uncertainty around particular flow ranges (for example
low flows).
3.6. Land Use Change
Land use information can be useful for deciding the extent to which a particular site is suitable for a
particular investigation. A catchment with a high proportion of a particular land use may still be
useful for seasonal forecasting activities or climate change studies, especially if that land use is

SINCLAIR KNIGHT MERZ
I:\VWES\Projects\VW05100\Deliverables\Reports\r06_HQ Gauges Report_SKM.docx PAGE 24
stationary over time. Where land use is changing, this has the potential to affect the ability to
derive comparable statistics between catchments and over time, and could affect the quality of
rainfall-runoff models calibrated to the data.
The majority of catchments in the developed areas of Australia will be subject to some form of land
use change such as logging, afforestation, bushfire or farm dam development. In a study of
streamflow trends in the Murray-Darling Basin due to climate change, Cai and Cowan (2008)
resorted to examining trends in modelled streamflow due to the absence of sufficient long-term
gauged streamflow datasets which were unaffected by land use change and flow regulation. Most
of the river basins in southern New South Wales, Victoria and the Mount Lofty Ranges in South
Australia will have been affected by bushfires at some time over the period of available streamflow
gauge data. Black Friday (1939), Ash Wednesday (1983), the Alpine fires of 2003 and Black
Saturday (2009) are examples of major fire events contained within the hydrologic record of
streamflow gauges in south-east Australia, for example.
Rainfall-runoff models have been developed which endeavour to dynamically model the effects of
land use change, such as the WaterCast model of the Googong River catchment near Canberra,
which explicitly included changes in farm dam volumes, groundwater pumping and forest cover
over the model calibration period (SKM 2010c). The application of such models could obviate the
need to exclude streamflow gauging sites due to land use change, however their application is in its
infancy and is still subject to high uncertainty.
A threshold for acceptable land use change is difficult to readily incorporate into the selection of
high quality streamflow sites because information on land use change is generally not available as a
continuous time series. This makes statistical trend analysis of the land use data difficult or
impossible. An example of this would be farm dam information, which is only available when
aerial photography or satellite imagery of sufficient quality has been collected. In many
catchments this data would consist of snapshots that are 10-20 years apart and may not be available
earlier than a few decades ago. The quality of the information itself is also subject to change over
time, particularly where the techniques for deriving land use change have improved. This means
that any comparison against a specified threshold for land use change would be subject to high
uncertainty and could not be uniformly applied using the same land use change estimation
procedures around Australia.
The approach taken in these guidelines to land use change is to collate data associated with land
use change in each catchment and then use this to inform the judgement of the hydrologist in
deciding whether to use the high quality dataset for a particular purpose. The current land use
provides a good indication of whether land use change is likely to have occurred historically. A
summary of the metadata which can be used to identify land use change is contained in Table 3-3.

SINCLAIR KNIGHT MERZ
I:\VWES\Projects\VW05100\Deliverables\Reports\r06_HQ Gauges Report_SKM.docx PAGE 25
Some rules of thumb which can be applied to indicate the potential change in mean annual flow
arising from land use change are as follows:
For every megalitre of farm dam, mean annual flows are reduced in the order of one megalitre
(SKM 2004). Impacts vary climatically and are affected by the purpose of the dam and the
presence of bypass structures.
The change in runoff anticipated from change in vegetation is related to the change in
evapotranspiration from the vegetation at different ages and for different vegetation types. The
range of impact is wide and is affected by climate conditions, as well as the species type. For
bushfires it is also affected by the fire intensity. The effect of vegetation change on hydrology
will change over time. After trees have been removed by fire or logging, runoff will initially
increase in the first few years and then decrease to a peak reduction in around 10-20 years.
When this peak reduction is reached, runoff will begin to increase again to return to the long-
term average runoff over subsequent decades. A summary of bushfire impact modelling in
Victoria presented in (SKM 2010b) indicated maximum average annual reductions in runoff
from bushfire of between 0-1 ML/ha/yr with an average impact of 0.4 ML/ha/yr (or 40
mm/yr). The increase in runoff immediately after bushfire ranged from 0.7-3.0 ML/ha/yr and
averaged 1.7 ML/ha/yr (or 170 mm/yr).
For urban areas, urbanisation could have a range of impacts, including increasing runoff in wet
periods due to the increase in impervious area and the increase in baseflow in dry periods due
to garden watering using water imported from other catchments. In previous studies presented
in the earlier literature review, an urban area of around 5-10% of the catchment was regarded
as an indicator that streamflow gauges could be non-stationary due to urbanisation.
There may be local land use changes which also affect hydrology. For example in south-west
Western Australia, land salinisation has been shown to increase runoff (Bowman et al. 2000).
The root fungus disease Phytophthora cinnamomi has also been linked to changes in
hydrology in this region (CSIRO 2009b). Local knowledge of the catchments is required to
obtain insights such as these, hence the recommendation in the guidelines to consult with state
and territory agency hydrologists before finalising the list of high quality streamflow gauges.
The effects of land use change on streamflows can be likened to any other diversion or flow
regulating activity and as a guide, any land use change which is estimated to change the mean
annual flow at a site by more than 10% could be regarded as potential grounds for excluding the
site. This single threshold would apply to the sum of land use change and direct diversions and
discharges discussed in the previous section. Double mass curves against nearby sites that are
unaffected by the same land use change could also indicate the suitability of a site for subsequent
investigations where high quality data is required. Using double mass curves instead of collecting
land use data may simplify the application of the guidelines.

SINCLAIR KNIGHT MERZ
I:\VWES\Projects\VW05100\Deliverables\Reports\r06_HQ Gauges Report_SKM.docx PAGE 26
Table 3-3 Metadata for Land Use Change Assessment
Item Comments and Definitions
% of catchment forested over
time
A national coverage of the % forested is available at intervals over the period 1972-
2009
Volume of small catchment
dams in catchment (ML)
Geoscience Australia compiled farm dam data for the Murray-Darling Basin. Earlier
snapshots are generally only available from State agencies at irregular intervals.
Years of significant bushfires
affecting the catchment
List the years when the catchment was partially or fully burned. In Victoria this is
maintained by DSE at http://www.dse.vic.gov.au/DSE/nrenfoe.nsf/childdocs/-
D79E4FB0C437E1B6CA256DA60008B9EF?open Other states would need to be
contacted directly.
Years of significant logging
within the catchment
List the years, name and area of logging coops.
Area of forest plantations over
time
Information on the extent of forest plantations and their harvesting cycle…
% of the catchment with urban
area
Current urban land use is defined by the Bureau of Rural Sciences GIS layer of land
use with type “urban”.
3.7. Climate stationarity
In many parts of Australia, there has been a significant climate shift and streamflow gauges need to
be selected that have adequate data to represent each climate step. The following discussion
outlines the timing of climate shifts in different regions across Australia, and the streamflow gauge
requirements to represent these shifts.
When dividing parts of Australia into climate regions for the purposes of the guidelines, a
pragmatic approach has been adopted based on available hydrologic literature examining this issue.
The four regions identified broadly correspond to subsets of the major Köppen climate classes
(Figure 3-1) and the Bureau’s major seasonal rainfall zones. Hydrologic studies documenting
climate shift such as the CSIRO sustainable yields reports have generally aligned with these
climate classes. Trends in annual rainfall total from 1970 to date are shown in Figure 3-2, which
suggests that climate shift does not however necessarily align with these climate classes. For
example there is a clear difference in trend in historical rainfall on either side of the Western
Australia border. The line of no trend cuts through several climate classes, with isolated pockets of
no trend also occurring in eastern Australia and in the middle of the Northern Territory. Further
work could be undertaken to better define stationary climate periods in different parts of Australia,
which may require a departure from traditionally adopted climate and hydrologic regions.

SINCLAIR KNIGHT MERZ
I:\VWES\Projects\VW05100\Deliverables\Reports\r06_HQ Gauges Report_SKM.docx PAGE 27
Figure 3-1 Climate Classification of Australia
Figure 3-2 Trend in Annual Total Rainfall

SINCLAIR KNIGHT MERZ
I:\VWES\Projects\VW05100\Deliverables\Reports\r06_HQ Gauges Report_SKM.docx PAGE 28
Literature discussing climate in the south east region of Australia has recognised a recent dry
period, with reference to the shift beginning anywhere from 1990 to 1998. Kiem et al (2010)
applied a statistical test to rainfall records across nine study sites and indentified 1994 as the first
year of the current dry phase. The exceptions were the two far eastern stations, Buchan and Mitta
Mitta (where 1996 was identified as the start of the dry phase) and Goulburn (where 1993 was
identified). Chiew et al (2008) supported this, and showed that the 1997 to 2006 mean annual
rainfall and the 1895 to 1996 long-term mean annual rainfall are significantly different for southern
catchments including the Eastern Mount Lofty Ranges, Wimmera, Loddon, Avoca, Campaspe,
Goulburn-Broken, Ovens, Murray and Murrumbidgee regions. Importantly, this corresponds to
reduced streamflows. In Victoria, over the past decade, streamflows in the east of the State have
typically been around 25-50% below average, and in the west of the State they have been more
typically around 60-90% below the long term average (SEACI 2001). A number of studies have
also recognised that the mid-1930s to mid-1940s were drier than average, while the mid-1940s to
mid-1990s were wetter than average, which is believed to be linked to longer term climate cycles
(Kiem et al. 2010). Streamflow gauges selected in this region should include at least 15 years of
record post 1994 and 15 years of record prior to 1994. Ideally, records should also include 15 years
of data representing the dry period of the 1930s and 1940s. Tasmania has exhibited a similar
climate shift to that identified for the South Eastern region of mainland Australia. In general, the
climate over the recent period (1997 to 2007) has been drier than that over the historical period
(1924 to 2007) (Post et al. 2009).
In south-west Western Australia an earlier shift in climate was observed, with the period post
1975 significantly drier than the historical period (CSIRO 2009b). A major decline in rainfall was
apparent in the mid 1970s, with another more recent shift in the late 1990s (IOCI 2009). The
WaterCorporation has included this later shift in its water planning (WaterCorporation 2008). The
magnitude of this shift for inflows into Perth’s water supply dams is shown in Figure 3-3. Annual
rainfall variability in this area has been correlated with variation in the Southern Oscillation Index,
however the causes of longer term trends in the relationship between the Southern Oscillation
Index and rainfall in south-west Western Australia are less clear. At least part of the shift in
climate in south-west Western Australia has been attributed to climate change and some has been
attributed to natural climate variability and the relative contribution of each is unknown (IOCI,
2002).

SINCLAIR KNIGHT MERZ
I:\VWES\Projects\VW05100\Deliverables\Reports\r06_HQ Gauges Report_SKM.docx PAGE 29
Figure 3-3 Yearly inflow to Perth’s Dams including Southern Sources (WaterCorporation, 2008)
A number of studies have examined the historical climate sequence from Northern Australia and
found that rainfall since the mid-1960s is above average compared to the long term average (Jolly
et al. 2007; SKM 2007b). The CSIRO (2009) report on sustainable yields in the Timor Sea
Drainage Division found that recent years (back to 1996) have been slightly wetter than the
historical record. However, the recent past does not exhibit the full range of climatic variability
seen in the historical record. CSIRO suggested that for this region there is considerable risk in
using only recent conditions to guide future water planning as a single very wet year can
significantly bias the historical mean.
Information on the arid region of Australia was not available. Given the absence of long-term
high quality streamflow data in this region and the absence of hydrologic studies on historical
climate shift, no climate phases have been specified. Figure 3-2 suggests that climate trends have
varied widely in this region, however changes in runoff are likely to be small because runoff is
historically low anyway.
A summary of the recommended requirements for selecting high quality streamflow gauges which
can represent all periods with climate shift is listed in Table 3-4.

SINCLAIR KNIGHT MERZ
I:\VWES\Projects\VW05100\Deliverables\Reports\r06_HQ Gauges Report_SKM.docx PAGE 30
Table 3-4 Requirements for streamflow gauges to ensure adequate representation of climate shifts
Region Representation of Climate shifts
South East Australia Include at least 15* years of data post 1994
Include at least 15 years of data between 1940 and 1994
Ideally, include 15 years of data prior to 1940
South West Australia Include at least 15* years of data post 1996
Include at least 15 years of data between 1975 and 1996
Include at least 15 years of data prior to 1975
Northern Australia Include at least 15 years of data post 1960
Include at least 15 years of data prior to 1960
Arid region Include at least 15 years of data in any historical period
* or the length of the climate phase where the period of the climate phase is less than 15 years
3.8. Assessing representativeness
After applying rigid selection criteria to prepare a candidate list of high quality streamflow gauges,
it is recommended that three checks should be undertaken on the data. The first is to plot daily
flow duration curves and daily time series data and examine these plots for any anomalies. Typical
anomalies include flow data with the same reading on consecutive days, which is a potential
indicator of flow regulation or flow discharges, or atypical rates of rise or fall on flood
hydrographs.
The second recommended check is to prepare double mass curves against other candidate high
quality stations in the same area. This will help to identify any regional anomalies caused by
historical climate or land use change. Double mass curves against climate data have not been
recommended due to the lack of consistency in rainfall-runoff relationships in some catchments as
part of natural catchment processes.
The third recommended check is for the Bureau to consult with State agency representatives to
confirm that there have been no peculiarities at the selected high quality sites that would affect their
use in subsequent applications. These could include industrial discharges over part of the flow
record for industrial sites which have since been decommissioned, for example.
The literature review identified that previous studies generally initially applied rigid criteria for
selecting high quality streamflow gauges, but then applied some flexibility if there were no
available sites in certain areas or over certain periods of time. This is likely to occur in data poor
parts of Australia. The guidelines include a step to relax selection criteria in specific river basins if
needed to ensure that some datasets are available for seasonal or long-term forecasting.
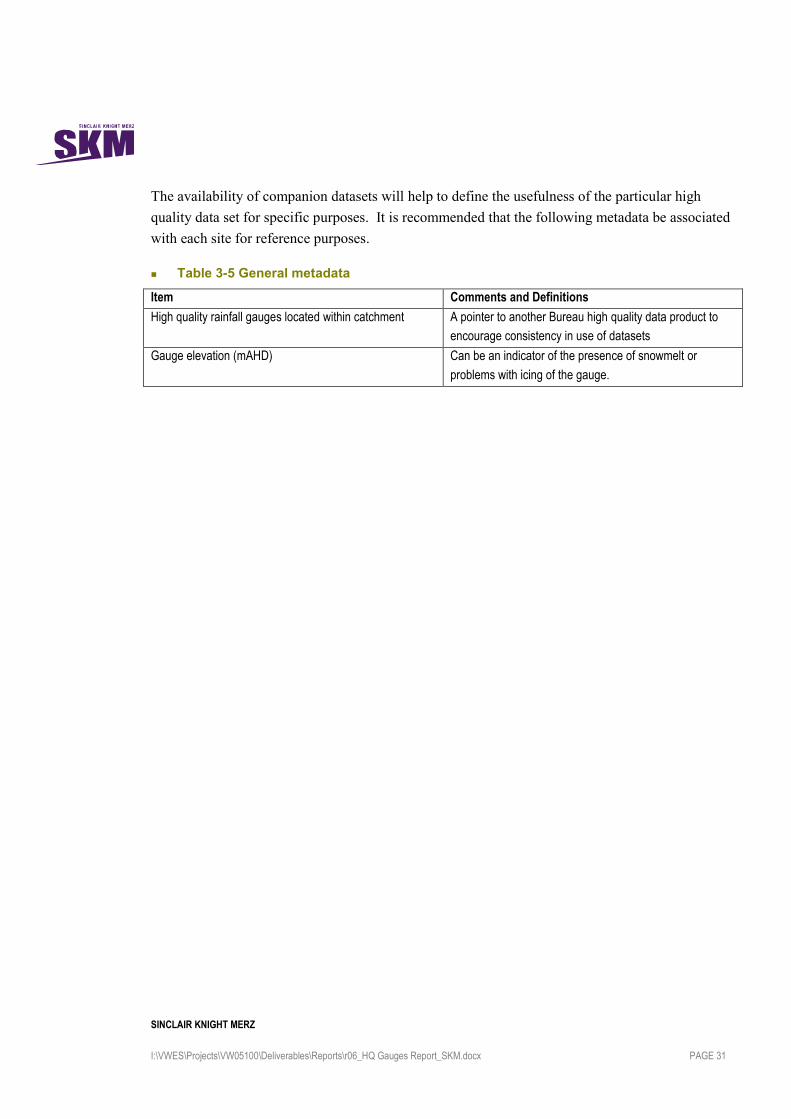
SINCLAIR KNIGHT MERZ
I:\VWES\Projects\VW05100\Deliverables\Reports\r06_HQ Gauges Report_SKM.docx PAGE 31
The availability of companion datasets will help to define the usefulness of the particular high
quality data set for specific purposes. It is recommended that the following metadata be associated
with each site for reference purposes.
Table 3-5 General metadata
Item Comments and Definitions
High quality rainfall gauges located within catchment A pointer to another Bureau high quality data product to
encourage consistency in use of datasets
Gauge elevation (mAHD) Can be an indicator of the presence of snowmelt or
problems with icing of the gauge.
SINCLAIR KNIGHT MERZ
I:\VWES\Projects\VW05100\Deliverables\Reports\r06_HQ Gauges Report_SKM.docx PAGE 32
4. Proposed Guidelines
The process for selecting high quality streamflow gauging stations is proposed as follows. The
order in which steps are undertaken may be varied and the process has been designed to try and
minimise the effort required to classify sites. The option to adjust selection thresholds when
applying these guidelines more widely can be undertaken if required. Other local selection criteria
may be added where they can be demonstrated to affect the quality of streamflow data.
1) Identify all streamflow gauges within a river basin from the Bureau’s water resources station
catalogue at http://www.bom.gov.au/hydro/wrsc/. Extract information on the station number,
river name, station name, latitude, longitude and catchment area. Where the catalogue
identifies sites with duplicate numbers but a different suffix, separately list each site and
suffix, because this may indicate a change in location of the site or a significant gap in the
period of record at the site.
2) Check this list of gauges against state agency lists to ensure that all available streamflow
gauges are covered. State agency lists include those on published registries such as the
Victorian Data Warehouse, the NSW Pineena Database, the Water Information System of
Tasmania. It is envisaged that this step will become redundant once the Bureau’s water
resources station catalogue contains all State and Territory information. Fill in any gaps about
the period of record and catchment area of streamflow gauges where they are readily available
from state agency lists.
3) Exclude any sites clearly identifiable as drains, channels, outfalls, lakes or other non-
river sites. The flow recorded at drains, channels and outfalls will be a function of water
management activities and will not be suitable for seasonal or long-term prediction. Data
recorded in lakes, lagoons, dam intake towers, etc. will not contain streamflow data.
4) Exclude any sites clearly identifiable as affected by tidal movement. The flow recorded at
these sites will be affected by tidal movements and will not represent streamflow generated
from upstream catchments.
5) Identify the approximate period of record at each streamflow gauge from the Bureau’s water
resources station catalogue and state agency lists after excluding sites in previous steps above.
6) Identify the most downstream flow regulating structure upstream of the gauge. Major
reservoirs can be identified from the ANCOLD register
(http://www.ancold.org.au/content.asp?PID=10005), which also has the construction date of
the reservoir. Other smaller flow regulating structures can be identified through local
knowledge, state agency publications and topographic maps. Determine the area upstream of
the structure and calculate the proportion of the gauged catchment that is regulated.
a) If the area upstream of the structure is more than 10% of the gauged catchment area, then
the site is considered regulated over the period for which the structure was in place.

SINCLAIR KNIGHT MERZ
I:\VWES\Projects\VW05100\Deliverables\Reports\r06_HQ Gauges Report_SKM.docx PAGE 33
b) For each site considered to be regulated, determine whether there is any data available
prior to the construction of the structure or after its decommissioning by comparing these
dates with the period of record from Step 5.
c) Exclude any sites where all data at the site is considered to be regulated.
d) Repeat the above steps a) to c) for subsequent upstream flow regulating structures if a site
is subject to flow regulation from more than one structure. This only needs to be repeated
for sites identified as potentially flow regulated at step a).
7) Estimate the mean annual flow at each streamflow gauge – This can be sourced from the data
itself, if available at this stage of the assessment, or it may be sourced from previously
published information.
8) Estimate the volume of any point source discharges upstream of the streamflow gauges – This
includes wastewater treatment plants discharging to rivers, industrial discharges, any irrigation
drains and any transfers to rivers from elsewhere as part of water management activities. A
site is not considered suitable if the average annual volume of point source discharges
upstream of the gauge is more than 10% of the mean annual flow. If annual volumes of
discharge are low but there is considered to be a significant shift in the seasonality or low flow
characteristics of streamflows due to the discharges, then this may also be justification for the
exclusion of a site. Exclude any sites where flow is considered to be impaired.
9) Estimate the volume of diversion licences upstream of streamflow gauges. A site is not
considered suitable if the average annual volume of licensed diversions upstream of the gauge
is greater than 10% of the mean annual flow. Groundwater licences should be included in the
total licensed diversions in areas where groundwater volumes are high and are considered to
potentially deplete stream baseflows. Exclude any sites where flow is considered to be
impaired.
10) Combine the data records of any duplicated streamflow gauges corresponding to a single site
and note any changes in location for a given streamflow gauge which could create a
discontinuity in the data.
11) Determine the proportion of missing data over the period of record. The proportion of missing
data is based on an assessment of streamflow data quality codes in each jurisdiction shown in
Table 4-1. Only retain sites which have at least one continuous period of 15 years with
not more than 5% of days with missing data.

SINCLAIR KNIGHT MERZ
I:\VWES\Projects\VW05100\Deliverables\Reports\r06_HQ Gauges Report_SKM.docx PAGE 34
Table 4-1 Quality codes for missing data
Jurisdiction Missing data quality codes
Vic, NSW, SA, NT > 150
Qld > 125
Tas > 30, except for codes 32 and 34, which were assumed to not be missing data
WA > 4, except for codes 11 and 12, for which were considered missing if the level data has a
quality code > 4.
12) Determine the proportion of data above the highest gauged streamflow or below the lowest
gauged streamflow. The highest and lowest gauged values can be obtained from rating tables
and may vary over different parts of the flow record if rating table versions change over time.
Only retain sites which have not more than 20% of data outside of the range of gauged
data.
13) As an alternative to the previous step, calculate the uncertainty associated with all streamflow
data collected at a site using Australian Standard ASA 3778.2.3. Only retain sites which
have not more than +10% average uncertainty in flow data over the period of record.
14) Collect and report on land use change data for each selected site. This includes the percentage
of urban area over time, the percentage of forest cover over time, the volume of small
catchment dams over time, the area of forest plantations over time, a list of historical bushfire
events and a history of coops logged in the catchment. Coops are the named areas logged at
any given time. Consider excluding sites subject to significant land use change, particularly
for long-term climate change investigations.
15) Check the spatial and temporal representativeness of high quality streamflow sites and
consider relaxing the constraints if needed to be able to identify a site with slightly lesser
quality but with the potential to become a high quality site in the future. Assign a climate
region and classify sites according to whether they have at least 15 years of data with not more
than 5% missing in each climate phase. Check the list against those used in previous studies.
16) Plot a daily flow-duration curve for each site over each climate period and visually inspect a
plot of the daily time series data to ensure that there are no data anomalies or unusual flow
patterns which are potential indicators of poor quality data. Also prepare double mass curves
of streamflow relative to other candidate high quality streamflow sites in the same region.
This step should be undertaken by an experienced hydrologist.
17) Present the list of selected high quality sites to a State agency representative to ensure that
there are no other factors influencing the streamflow data at these sites which could cause them
to be considered not high quality.
18) Document other supporting information, such as preparing a catchment map, identifying any
high quality rainfall sites located within the catchment and presenting the elevation of the
gauge.

SINCLAIR KNIGHT MERZ
I:\VWES\Projects\VW05100\Deliverables\Reports\r06_HQ Gauges Report_SKM.docx PAGE 35
5. Case Studies
5.1. Campaspe River, Victoria
This section of the report presents the outcome of the application of the guidelines at each step for
the Campaspe River Basin. The Campaspe River is a tributary of the River Murray in northern
Victoria. It is part of the Murray-Darling Drainage Division. It includes several major flow
regulating structures which supply both rural and urban users. There is significant irrigation in the
vicinity of Rochester and private diverters downstream of Lake Eppalock. The majority of the
catchment is cleared of native vegetation. A map of the catchment is shown in Figure 5-1.
Figure 5-1 Campaspe River Catchment

SINCLAIR KNIGHT MERZ
I:\VWES\Projects\VW05100\Deliverables\Reports\r06_HQ Gauges Report_SKM.docx PAGE 36
The steps involved in assessing streamflow data in the Campaspe River basin are outlined as
follows:
1) Identify all streamflow gauges - A total of 57 streamflow gauges were listed for the Campaspe
River catchment on the Bureau’s water resource station catalogue. One site was excluded
because it was named as being on the River Murray and did not have an associated stream
gauging station number.
2) Check against state agency lists - A further 5 sites were identified on the Victorian Data
Warehouse, a further 9 sites were identified in RWC (1990) and a further 6 sites were
identified in SRWSC (1984), resulting in a total of 76 streamflow gauges identified for the
Campaspe River Basin. No additional sites were identified in SRWSC (1971). A number of
queries are available in the data warehouse. The query used for this project was Standard
Warehouse Reports Catchment and Basin Reports Select Streamflows by Basin.
3) Exclude any sites clearly identifiable as drains, channels, outfalls, lakes or other non-river
sites – This included 29 sites in the Campaspe River basin, leaving a remaining list of 47 sites.
These 29 sites were mainly located in the Campaspe Irrigation District and drains/channels
outfalling directly into the River Murray. Two sites on Sheepwash Creek were excluded
because a spur of the Emu Valley No. 1 Channel in the Coliban system was located directly
upstream of these sites. The Woodend water treatment plant outfall was also excluded.
4) Exclude any sites clearly identifiable as affected by tidal movement – no sites in the Campaspe
River basin are affected by tidal movement. Some sites may be affected by backwater from
the River Murray, however this is assessed in subsequent steps.
5) Identify the approximate period of record – there were some differences in the periods of
record reported in the Bureau’s water resource station catalogue and the State agency sources,
so both sources were used and the maximum periods of record was adopted for assessing flow
regulation. For example, for the site 406214 Axe Creek at Longlea, the Bureau’s water
resource station catalogue notes the data as commencing from January 1965 for site 406214B,
but does not include the period of record for site 406214A, which commenced in 1933.
6) Identify the most downstream flow regulating structure upstream of the gauge – Five structures
were identified on the ANCOLD register in the Campaspe River Basin and are listed in Table
5-1. A total of 15 sites were considered to be regulated due to the most downstream structure
upstream of the gauge and a further 5 sites were excluded because they had data available prior
to Lake Eppalock being constructed, but not prior to Malmsbury Reservoir being constructed
further upstream. A total of 26 sites remained after checking for flow regulation.

SINCLAIR KNIGHT MERZ
I:\VWES\Projects\VW05100\Deliverables\Reports\r06_HQ Gauges Report_SKM.docx PAGE 37
Table 5-1 Flow regulating structures in the Campaspe River Basin
Storage Name Capacity
(GL) Construction
Date Decommission
Date
Area upstream of structure
(km2)
Lake Eppalock 312 1964 N/a 2028
Campaspe Weir 2.7 1892 N/a 3269
Malmsbury Reservoir 18 1870 N/a 306
Upper Coliban Reservoir 37.5 1903 N/a 193
Lauriston Reservoir 20 1941 N/a 219
A check was undertaken to see the extent to which the sites designated as regulated in the water
resource station catalogue (denoted as “f” in the is_regulated field) correlated with sites identified
as regulated in the above analysis. A total of 6 sites were not regulated in both analyses and 3 sites
were regulated in both analyses. A total of 11 sites showed inconsistencies between the outcomes
of the two analyses. For the sites that were inconsistently classified, the water resource station
catalogue reported these sites as regulated, whilst the analysis in this project concluded that these
sites were not regulated for at least part of the their flow record. In the water resource station
catalogue there were also some internal inconsistencies, for example, with site 406224A (Mount
Pleasant Creek at Runnymede) being reported as regulated and site 406224 being reported as not
regulated, even though they are at the same location. Through inspection of aerial imagery there do
not appear to be any flow regulating structures on this tributary of the Campaspe River. For this
reason it is recommended that this field in the water resource station catalogue should not be used
to classify high quality streamflow gauges.
7) Estimate the mean annual flow at each streamflow gauge – For this case study, mean annual
flow information was sourced from the Sustainable Diversion Limit viewer (SKM et al. 2002),
which previously presented mean annual flow data for catchments across Victoria.
8) Estimate the volume of point source discharges – The volume of wastewater discharged to the
Campaspe River was sourced from the Victorian Water Accounts for the years 2007 and 2008
(DSE 2010). The only treatment plant which currently discharges to rivers in the Campaspe
River basin is the Kyneton treatment plant, which discharges some of its water to the
Campaspe River. This discharge affected several of the remaining streamflow gauges,
however the volume of the discharge is very small relative to the flow in the Campaspe River
and was not considered to be of sufficient volume to exclude these gauges from the list of
candidate sites. The Campaspe River also receives transfers from the Waranga Western
Channel in its lower reaches, however this did not affect any remaining sites.
9) Estimate the volume of diversion licences – The volume of diversion licences was sourced
from the Sustainable Diversion Limit viewer (SKM et al. 2002). A total of 10 sites were
excluded due to a volume of diversion licences greater than 10% of the mean annual flow.

SINCLAIR KNIGHT MERZ
I:\VWES\Projects\VW05100\Deliverables\Reports\r06_HQ Gauges Report_SKM.docx PAGE 38
These included sites on Axe Creek (17-21%) and Mount Pleasant Creek (12%). Remaining
sites on the Campaspe and Coliban Rivers below flow regulating structures but with data
which existed prior to those structures being built were also excluded. The current volume of
licences is 33-50% of the mean annual flow at these sites. The volume of diversions over the
period prior to flow regulation is unknown, but is still likely to have been high on these major
streams. The number of sites remaining at this stage of the analysis was 16.
10) Combine the data records for duplicated streamflow gauges – Data at the two sites on the
Campaspe River at Redesdale (406213 and 406213 C) were amalgamated, as was data at the
two sites on Wild Duck Creek at Heathcote (406235 and 406235A). Site locations were
assessed and deemed to be consistent for the period of record for each gauge (i.e. not upstream
and downstream of an inflow). The number of sites remaining at this stage of the analysis was
14.
11) Determine the proportion of missing data – Quality codes and flow data were assessed at each
site. For codes greater than 150, data was considered to be missing and therefore did not
contribute to the continuous period of data. Quality codes were also assessed to ensure that at
least 1 period of 15 years of good quality data existed with less than 5% of missing days. Flow
data could not be obtained for 4 sites to undertake the missing data analysis (406254, 406257,
406259, 406260). These sites were assigned 100% missing data as the data could not be
obtained. The three sites on Five Mile Creek had a minimum period of missing data over a 15
year period of 23-91%. Only five sites remained after this step.
12) Determine proportion of data outside the gauging limits – Gauging information was requested
from the Department of Sustainability and Environment but was not forthcoming. Historic
maximum and minimum gauged flows up to 1987 were obtained from RWC (1990) for the
purposes of the case study only to provide an indication of the effect of applying this step of
the guidelines. It was found that all sites had sufficient high flow gaugings. A number of the
sites ceased to flow and a high proportion of the data was below the minimum gauged flow
because cease to flow events had not been gauged. It was assumed for the case study that if
the minimum gauged stage height was close to zero, then the level of extrapolation on the
rating curve is small and the site should not be excluded. No sites were excluded at this stage
of the analysis.
13) Uncertainty associated with streamflow data collected – Rating table information was
requested from the Department of Sustainability and Environment but was not forthcoming,
therefore this analysis could not be undertaken for the case study.
14) Report on land use change – Information on land use and land use change is presented below.
Table 5-2 shows that the current urban area in the five candidate catchments is low, hence any
historical changes in urbanisation are expected to be small.

SINCLAIR KNIGHT MERZ
I:\VWES\Projects\VW05100\Deliverables\Reports\r06_HQ Gauges Report_SKM.docx PAGE 39
Table 5-2 Urban area
Site
number
Site name Current urban area as a % of
total catchment area
406213 Campaspe River at Redesdale 2%
406216 Axe Creek at Sedgewick 1%
406226 Mt Ida Creek at Derrinal 5%
406235 Wild Duck Creek at Heathcote 1%
406250 Coliban River at Springhill–Tylden Road 6%
Forest cover is highest in the Mt Ida Creek and Coliban River catchments, as shown in Figure 5-2.
Over time, forest cover has increased for four of the five candidate streamflow gauges, however the
changes are relatively small. The percentage of forest cover by area increased from 41% to 55% in
the Mount Ida Creek catchment. The reason for this increase is unknown and would require further
investigation.
Figure 5-2 Change in forest cover over time
Historical information on farm dam capacity is not available. The approximate current farm dam
capacity from the SDL Viewer (SKM et al. 2002) is shown in Table 5-3, which indicates that for
three of the sites, the capacity of farm dams is greater than 10% of the mean annual flow. This
0
10
20
30
40
50
60
70
80
90
100
1972 1977 1985 1995 2005 2009
Fore
st C
ove
r (%
of a
rea)
Mt Ida Creek at Derrinal
Axe Creek at Sedgewick
Wild Duck Creek at Heathcote
Campaspe River at Redesdale
Coliban River at Springhill-Tylden Road
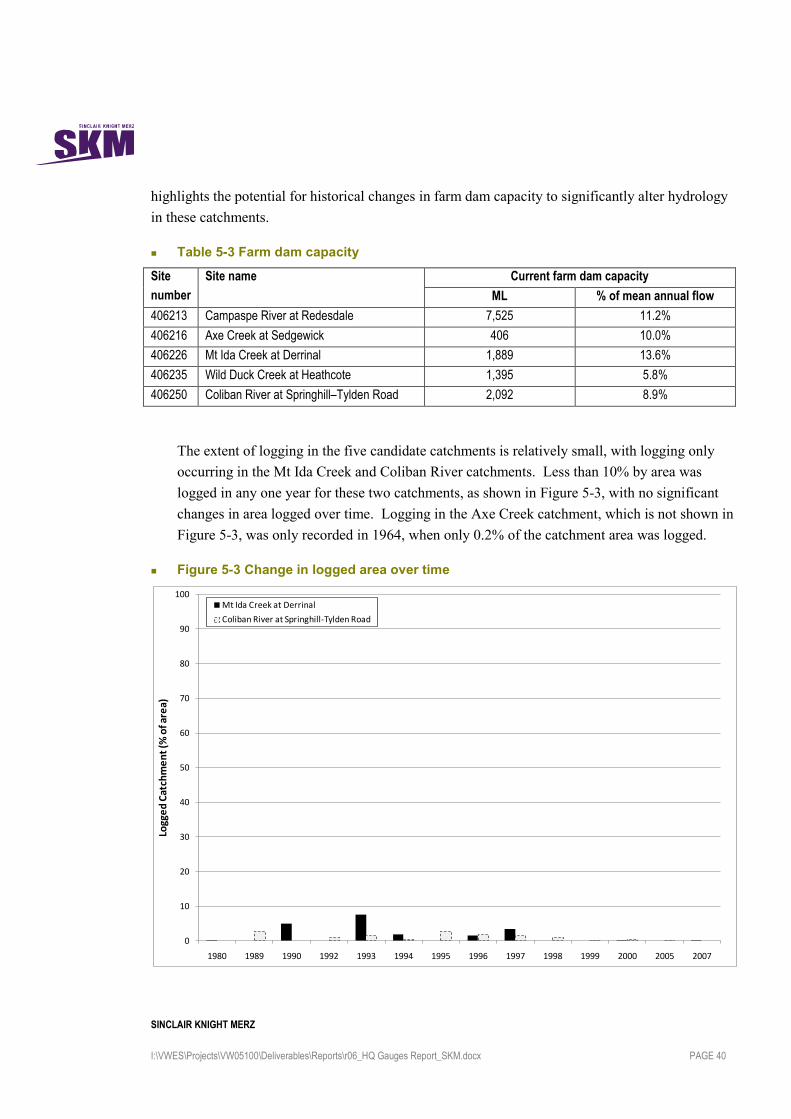
SINCLAIR KNIGHT MERZ
I:\VWES\Projects\VW05100\Deliverables\Reports\r06_HQ Gauges Report_SKM.docx PAGE 40
highlights the potential for historical changes in farm dam capacity to significantly alter hydrology
in these catchments.
Table 5-3 Farm dam capacity
Site
number
Site name Current farm dam capacity
ML % of mean annual flow
406213 Campaspe River at Redesdale 7,525 11.2%
406216 Axe Creek at Sedgewick 406 10.0%
406226 Mt Ida Creek at Derrinal 1,889 13.6%
406235 Wild Duck Creek at Heathcote 1,395 5.8%
406250 Coliban River at Springhill–Tylden Road 2,092 8.9%
The extent of logging in the five candidate catchments is relatively small, with logging only
occurring in the Mt Ida Creek and Coliban River catchments. Less than 10% by area was
logged in any one year for these two catchments, as shown in Figure 5-3, with no significant
changes in area logged over time. Logging in the Axe Creek catchment, which is not shown in
Figure 5-3, was only recorded in 1964, when only 0.2% of the catchment area was logged.
Figure 5-3 Change in logged area over time
0
10
20
30
40
50
60
70
80
90
100
1980 1989 1990 1992 1993 1994 1995 1996 1997 1998 1999 2000 2005 2007
Logg
ed
Cat
chm
en
t (%
of a
rea)
Mt Ida Creek at Derrinal
Coliban River at Springhill-Tylden Road
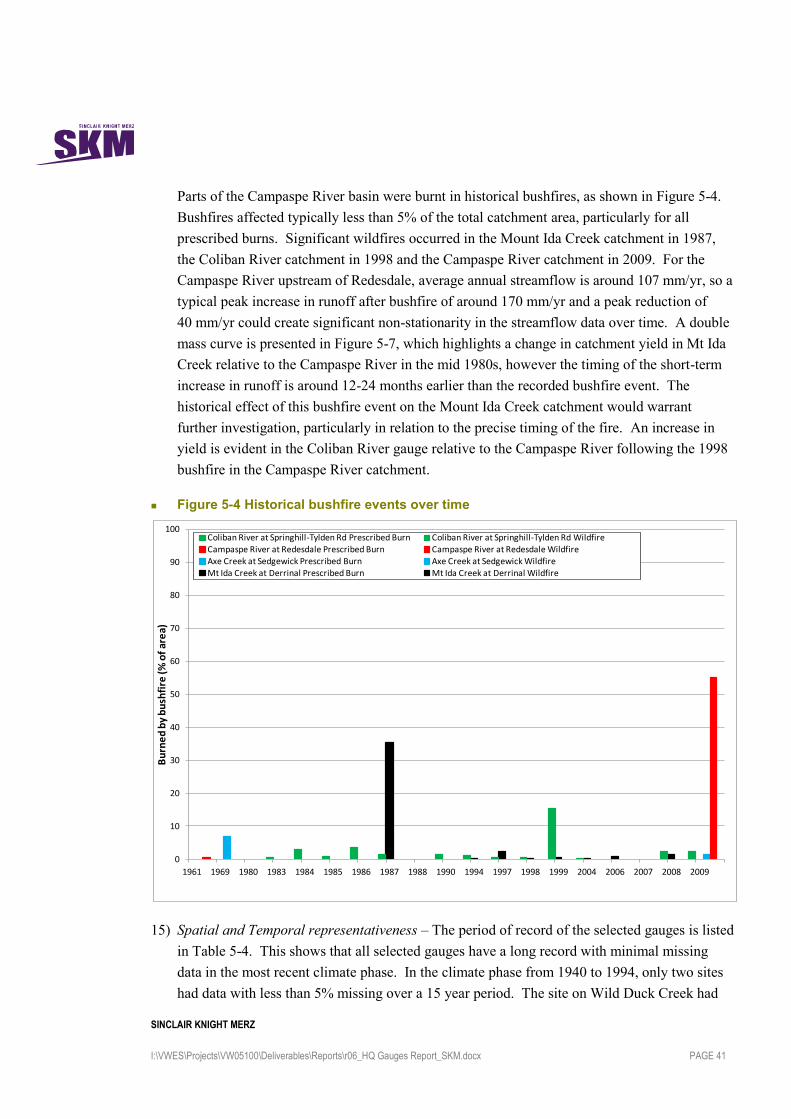
SINCLAIR KNIGHT MERZ
I:\VWES\Projects\VW05100\Deliverables\Reports\r06_HQ Gauges Report_SKM.docx PAGE 41
Parts of the Campaspe River basin were burnt in historical bushfires, as shown in Figure 5-4.
Bushfires affected typically less than 5% of the total catchment area, particularly for all
prescribed burns. Significant wildfires occurred in the Mount Ida Creek catchment in 1987,
the Coliban River catchment in 1998 and the Campaspe River catchment in 2009. For the
Campaspe River upstream of Redesdale, average annual streamflow is around 107 mm/yr, so a
typical peak increase in runoff after bushfire of around 170 mm/yr and a peak reduction of
40 mm/yr could create significant non-stationarity in the streamflow data over time. A double
mass curve is presented in Figure 5-7, which highlights a change in catchment yield in Mt Ida
Creek relative to the Campaspe River in the mid 1980s, however the timing of the short-term
increase in runoff is around 12-24 months earlier than the recorded bushfire event. The
historical effect of this bushfire event on the Mount Ida Creek catchment would warrant
further investigation, particularly in relation to the precise timing of the fire. An increase in
yield is evident in the Coliban River gauge relative to the Campaspe River following the 1998
bushfire in the Campaspe River catchment.
Figure 5-4 Historical bushfire events over time
15) Spatial and Temporal representativeness – The period of record of the selected gauges is listed
in Table 5-4. This shows that all selected gauges have a long record with minimal missing
data in the most recent climate phase. In the climate phase from 1940 to 1994, only two sites
had data with less than 5% missing over a 15 year period. The site on Wild Duck Creek had
0
10
20
30
40
50
60
70
80
90
100
1961 1969 1980 1983 1984 1985 1986 1987 1988 1990 1994 1997 1998 1999 2004 2006 2007 2008 2009
Bu
rne
d b
y b
ush
fire
(% o
f ar
ea)
Coliban River at Springhill-Tylden Rd Prescribed Burn Coliban River at Springhill-Tylden Rd WildfireCampaspe River at Redesdale Prescribed Burn Campaspe River at Redesdale WildfireAxe Creek at Sedgewick Prescribed Burn Axe Creek at Sedgewick WildfireMt Ida Creek at Derrinal Prescribed Burn Mt Ida Creek at Derrinal Wildfire
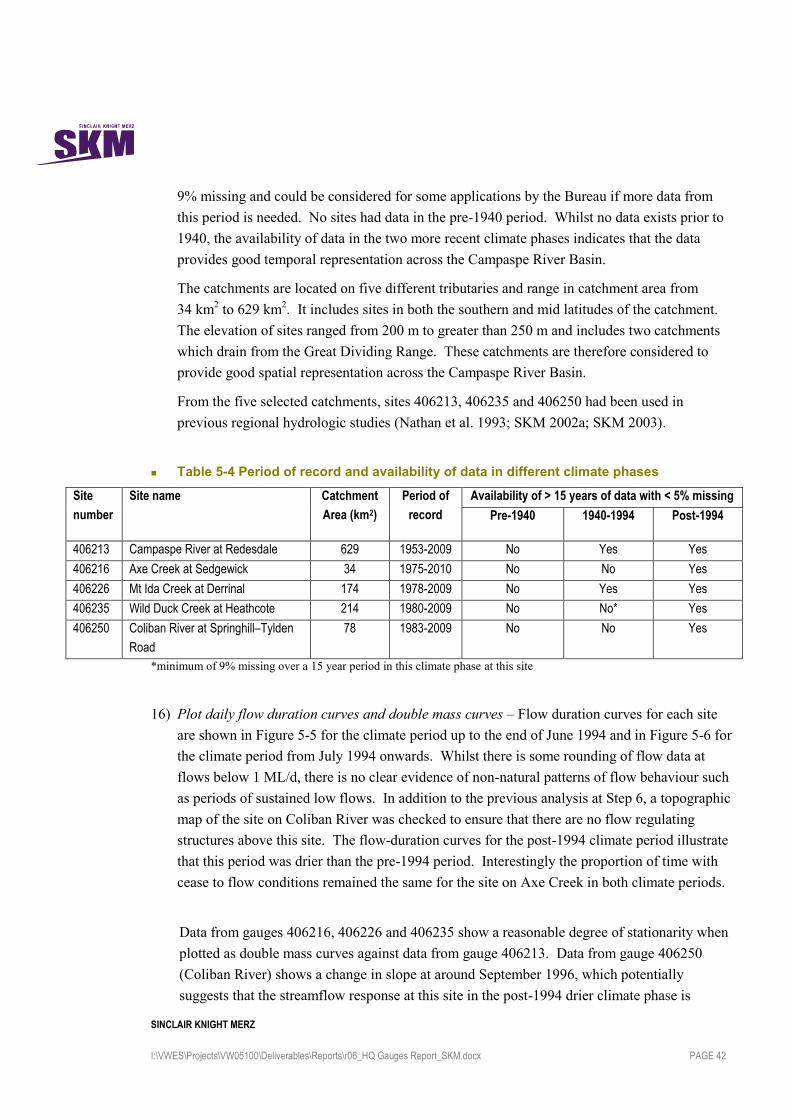
SINCLAIR KNIGHT MERZ
I:\VWES\Projects\VW05100\Deliverables\Reports\r06_HQ Gauges Report_SKM.docx PAGE 42
9% missing and could be considered for some applications by the Bureau if more data from
this period is needed. No sites had data in the pre-1940 period. Whilst no data exists prior to
1940, the availability of data in the two more recent climate phases indicates that the data
provides good temporal representation across the Campaspe River Basin.
The catchments are located on five different tributaries and range in catchment area from
34 km2 to 629 km
2. It includes sites in both the southern and mid latitudes of the catchment.
The elevation of sites ranged from 200 m to greater than 250 m and includes two catchments
which drain from the Great Dividing Range. These catchments are therefore considered to
provide good spatial representation across the Campaspe River Basin.
From the five selected catchments, sites 406213, 406235 and 406250 had been used in
previous regional hydrologic studies (Nathan et al. 1993; SKM 2002a; SKM 2003).
Table 5-4 Period of record and availability of data in different climate phases
Site
number
Site name Catchment
Area (km2)
Period of
record
Availability of > 15 years of data with < 5% missing
Pre-1940 1940-1994 Post-1994
406213 Campaspe River at Redesdale 629 1953-2009 No Yes Yes
406216 Axe Creek at Sedgewick 34 1975-2010 No No Yes
406226 Mt Ida Creek at Derrinal 174 1978-2009 No Yes Yes
406235 Wild Duck Creek at Heathcote 214 1980-2009 No No* Yes
406250 Coliban River at Springhill–Tylden
Road
78 1983-2009 No No Yes
*minimum of 9% missing over a 15 year period in this climate phase at this site
16) Plot daily flow duration curves and double mass curves – Flow duration curves for each site
are shown in Figure 5-5 for the climate period up to the end of June 1994 and in Figure 5-6 for
the climate period from July 1994 onwards. Whilst there is some rounding of flow data at
flows below 1 ML/d, there is no clear evidence of non-natural patterns of flow behaviour such
as periods of sustained low flows. In addition to the previous analysis at Step 6, a topographic
map of the site on Coliban River was checked to ensure that there are no flow regulating
structures above this site. The flow-duration curves for the post-1994 climate period illustrate
that this period was drier than the pre-1994 period. Interestingly the proportion of time with
cease to flow conditions remained the same for the site on Axe Creek in both climate periods.
Data from gauges 406216, 406226 and 406235 show a reasonable degree of stationarity when
plotted as double mass curves against data from gauge 406213. Data from gauge 406250
(Coliban River) shows a change in slope at around September 1996, which potentially
suggests that the streamflow response at this site in the post-1994 drier climate phase is

SINCLAIR KNIGHT MERZ
I:\VWES\Projects\VW05100\Deliverables\Reports\r06_HQ Gauges Report_SKM.docx PAGE 43
different to the other sites. This is consistent with the observation in Figure 5-5 that baseflow
is more sustained at site 406250 in the Coliban River catchment, because baseflow decline
would be expected to lag runoff decline due to climate change and may not be evident yet.
This effect is likely to have been exacerbated by the occurrence of a bushfire in the Coliban
River catchment in 1998. There is around 6 years of data missing for gauge 406216 on Axe
Creek between November 1982 and November 1988. This has been omitted for plotting
purposes, with an estimated cumulative flow used for the point at which the data resumes.
Figure 5-5 Flow duration curves prior to 1 July 1994
0.1
1
10
100
1000
10000
100000
0 10 20 30 40 50 60 70 80 90 100
Flo
w (
ML/
d)
Percentage of time that flow is exceeded (%)
406213 Campaspe R at Redesdale
406216 Axe Ck at Sedgewick
406226 Mt Ida Ck at Derrinal
406235 Wild Duck Ck at Heathcote

SINCLAIR KNIGHT MERZ
I:\VWES\Projects\VW05100\Deliverables\Reports\r06_HQ Gauges Report_SKM.docx PAGE 44
Figure 5-6 Flow duration curves post 30 June 1994
Figure 5-7 Double mass curves against site 406213 Campaspe R at Redesdale
0.1
1
10
100
1000
10000
100000
0 10 20 30 40 50 60 70 80 90 100
Flo
w (
ML/
d)
Percentage of time that flow is exceeded (%)
406213 Campaspe R at Redesdale
406216 Axe Ck at Sedgewick
406226 Mt Ida Ck at Derrinal
406235 Wild Duck Ck at Heathcote
406250 Coliban R at Springhill-Tylden Rd
0
50000
100000
150000
200000
250000
300000
350000
400000
450000
500000
550000
0 500000 1000000 1500000 2000000 2500000
Cu
mu
lati
ve f
low
(M
L)
Cumulative flow at 406213 (ML)
406216 Axe Ck at Sedgewick
406226 Mt Ida Ck at Derrinal
406235 Wild Duck Ck at Heathcote
406250 Coliban R at Springhill-Tylden Rd
1/07
/199
4(c
limat
e p
has
e c
han
ge)
16/0
1/19
87(B
ush
fire
in M
t Id
a C
ree
k)
22/0
3/19
98(B
ush
fire
in C
olib
an R
ive
r)

SINCLAIR KNIGHT MERZ
I:\VWES\Projects\VW05100\Deliverables\Reports\r06_HQ Gauges Report_SKM.docx PAGE 45
17) Present the list of sites to State agency representatives – For the case studies, this step has not
been undertaken.
18) Other supporting information - There are no high quality rainfall stations within the Campaspe
River catchment. The nearest high quality rainfall stations are 088060 Wallaby Ck Weir,
086117 Toorourong and 086131 Yan Yean, all of which are south of the Great Dividing
Range, around 80 km south-east of Heathcote. Elevation data was previously presented at
Step 15.
5.2. Summary of Campaspe River case study outcomes
In summary, five streamflow gauges were selected as high quality streamflow gauges in the
Campaspe River basin suitable for seasonal forecasting. These are:
406213 Campaspe River at Redesdale;
406216 Axe Creek at Sedgewick;
406226 Mt Ida Creek at Derrinal;
406235 Wild Duck Creek at Heathcote; and
406250 Coliban River at Springhill-Tylden Road
These sites are considered to provide good spatial and temporal representation of streamflow data
in the Campaspe River basin. All of the data at these streamflow gauges are affected by a high
proportion of small catchment dams in the catchments upstream of the gauges. Significant
wildfires occurred in the Mount Ida Creek catchment in 1987, the Coliban River catchment in 1998
and the Campaspe River catchment in 2009. For the 1987 and 1998 fire events, changes in
streamflow relative to the Campaspe River gauge are evident, although the timing of the yield
response in the Mount Ida Creek catchment appears to occur 12-24 months earlier than the
recorded bushfire event and would warrant further investigation.
Two streamflow gauges were selected as high quality streamflow gauges in the Campaspe
River basin suitable for long-term climate change investigations because they include at least
15 years of good quality data from two climate phases. These were the site on the Campaspe River
and the site on Mt Ida Creek. The use of these two sites is subject to the same limitations in
relation to land use change discussed above, particularly with regard to past bushfires.
Whilst there was insufficient data at gauge 406250 on the Coliban River to be regarded as high
quality in the pre-1994 climate phase, the data at this site shows a change in slope at around
September 1996, which potentially suggests that its streamflow response in the post-1994 drier
climate phase is different to the other sites. This is consistent with the observation that baseflow is

SINCLAIR KNIGHT MERZ
I:\VWES\Projects\VW05100\Deliverables\Reports\r06_HQ Gauges Report_SKM.docx PAGE 46
more sustained in the Coliban River catchment, because baseflow decline would be expected to lag
runoff decline due to climate change and may not be evident yet. This relative increase in yield is
likely to have been exacerbated by the occurrence of a bushfire in the Coliban River catchment in
1998.

SINCLAIR KNIGHT MERZ
I:\VWES\Projects\VW05100\Deliverables\Reports\r06_HQ Gauges Report_SKM.docx PAGE 47
5.3. Adelaide River, Northern Territory
This section of the report presents the outcome of the application of the guidelines at each step for
the Adelaide River Basin. The Adelaide River is located east of Darwin in the Timor Sea Drainage
Division and covers an area of around 7,500 km2. The river drains directly to the Timor Sea. The
river and its tributaries are mostly unregulated. A map of the catchment is shown in Figure 5-8.
Figure 5-8 Adelaide River Catchment

SINCLAIR KNIGHT MERZ
I:\VWES\Projects\VW05100\Deliverables\Reports\r06_HQ Gauges Report_SKM.docx PAGE 48
The steps involved in assessing streamflow data in the Adelaide River basin are outlined as
follows:
1) Identify all streamflow gauges - A total of 51 streamflow gauges were listed for the Adelaide
River catchment on the Bureau’s water resource station catalogue. The downloadable csv file
of the list of sites did not contain any data for this river basin.
2) Check against State agency lists – NRETAS previously provided a list of available streamflow
data in the Adelaide River Basin for SKM (2008g). This list included 103 sites, however of
these only 18 sites had both available data and a rating table. All of these 18 sites were
included in the Bureau’s water resource station catalogue.
3) Exclude any sites clearly identifiable as drains, channels, outfalls, lakes or other non-river
sites – This included 4 sites in the Adelaide River basin, leaving a remaining list of 47 sites.
These 4 sites included Beatrice Lagoon, the Manton Dam inlet tower, Harrison Dam and Lake
Finniss.
4) Exclude any sites clearly identifiable as affected by tidal movement – This included 3 sites on
the lower Adelaide River at Middle Point, Beatrice Hill and Arnhem Highway, which were
described as tide gauges. Any gauges on the Adelaide River with a latitude further north than
these three gauges (latitude less than -12.658 degrees) were also considered to be affected by
tidal movement, which included a further 5 sites. Other streams with a latitude further north
than these gauges were not excluded, except for one site described as “salt arm” on the
Adelaide River plains. A total of 38 sites remained after excluding sites known to be affected
by tidal movement.
5) Identify the approximate period of record –the Bureau’s water resource station catalogue and
NRETAS data generally aligned. One exception was site G8170008 on the Adelaide River
8 km downstream of Daly Road, which the catalogue listed as ceasing in 1993 but NRETAS
had data extending to 2008.
6) Identify the most downstream flow regulating structure upstream of the gauge – One structure
(Manton Dam) was identified on the ANCOLD register and is listed in Table 5-5. Manton
Dam provided urban water supply to Darwin from 1942 until the Darwin River Dam was
constructed in 1972 in the adjacent Finniss River Basin. The dam is still in place but is only
used for recreational purposes. Only one site was excluded because of the effect of Manton
Dam, namely Manton River at Acacia Gap (G817033). A number of smaller reservoirs are
located in the basin which are not large enough to be registered on ANCOLD. These include
Lake Bennett in the upper part of the catchment and a number of dams and lagoons on the
Adelaide River plains. None of these smaller dams are considered to significantly affect
streamflows at the candidate streamflow gauge locations.
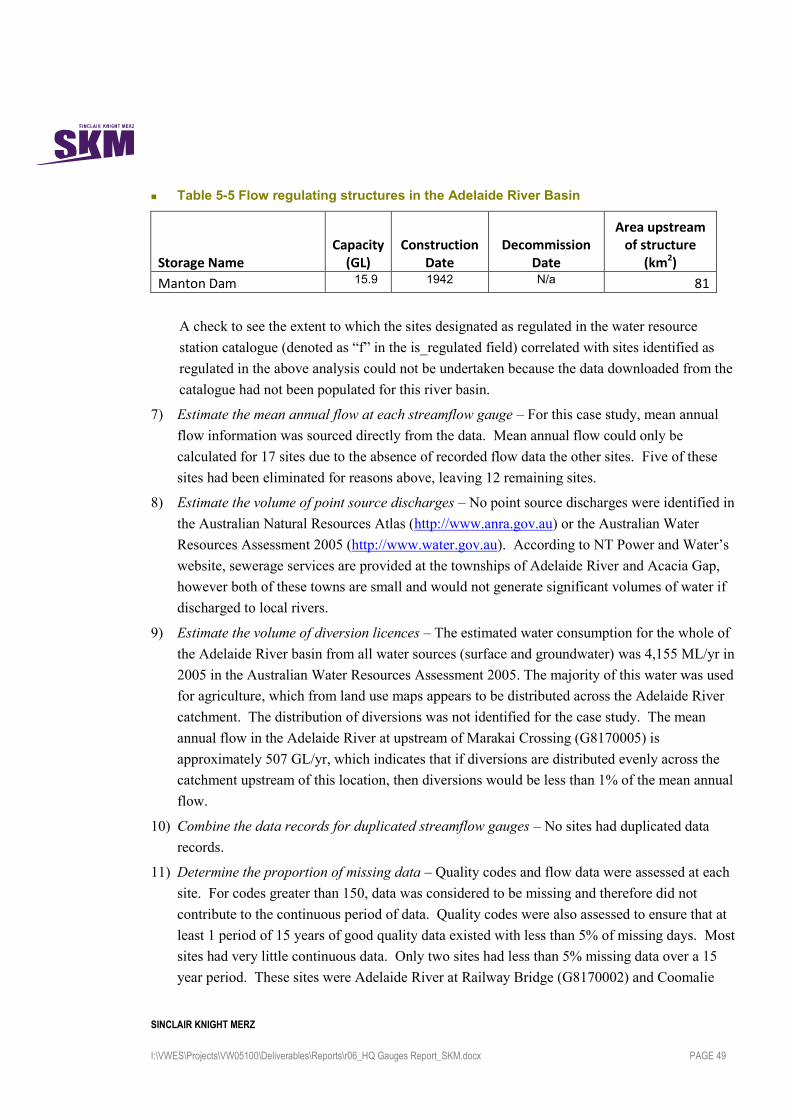
SINCLAIR KNIGHT MERZ
I:\VWES\Projects\VW05100\Deliverables\Reports\r06_HQ Gauges Report_SKM.docx PAGE 49
Table 5-5 Flow regulating structures in the Adelaide River Basin
Storage Name Capacity
(GL) Construction
Date Decommission
Date
Area upstream of structure
(km2)
Manton Dam 15.9 1942 N/a 81
A check to see the extent to which the sites designated as regulated in the water resource
station catalogue (denoted as “f” in the is_regulated field) correlated with sites identified as
regulated in the above analysis could not be undertaken because the data downloaded from the
catalogue had not been populated for this river basin.
7) Estimate the mean annual flow at each streamflow gauge – For this case study, mean annual
flow information was sourced directly from the data. Mean annual flow could only be
calculated for 17 sites due to the absence of recorded flow data the other sites. Five of these
sites had been eliminated for reasons above, leaving 12 remaining sites.
8) Estimate the volume of point source discharges – No point source discharges were identified in
the Australian Natural Resources Atlas (http://www.anra.gov.au) or the Australian Water
Resources Assessment 2005 (http://www.water.gov.au). According to NT Power and Water’s
website, sewerage services are provided at the townships of Adelaide River and Acacia Gap,
however both of these towns are small and would not generate significant volumes of water if
discharged to local rivers.
9) Estimate the volume of diversion licences – The estimated water consumption for the whole of
the Adelaide River basin from all water sources (surface and groundwater) was 4,155 ML/yr in
2005 in the Australian Water Resources Assessment 2005. The majority of this water was used
for agriculture, which from land use maps appears to be distributed across the Adelaide River
catchment. The distribution of diversions was not identified for the case study. The mean
annual flow in the Adelaide River at upstream of Marakai Crossing (G8170005) is
approximately 507 GL/yr, which indicates that if diversions are distributed evenly across the
catchment upstream of this location, then diversions would be less than 1% of the mean annual
flow.
10) Combine the data records for duplicated streamflow gauges – No sites had duplicated data
records.
11) Determine the proportion of missing data – Quality codes and flow data were assessed at each
site. For codes greater than 150, data was considered to be missing and therefore did not
contribute to the continuous period of data. Quality codes were also assessed to ensure that at
least 1 period of 15 years of good quality data existed with less than 5% of missing days. Most
sites had very little continuous data. Only two sites had less than 5% missing data over a 15
year period. These sites were Adelaide River at Railway Bridge (G8170002) and Coomalie

SINCLAIR KNIGHT MERZ
I:\VWES\Projects\VW05100\Deliverables\Reports\r06_HQ Gauges Report_SKM.docx PAGE 50
Creek at Stuart Hwy (G8170066). Two further sites had less than 10% missing data over a 15
year period and were retained in the analysis to endeavour to preserve some spatial
representativeness in the data. These sites were Manton River upstream of Manton Dam
(G8170075) and Adelaide River at Tortilla Flats (G8170084). All other sites had significantly
more than 10% missing over any 15 year period.
12) Determine proportion of data outside the gauging limits – Gauging information was provided
by NRETAS. It was found that all sites had sufficient low flow gaugings. For high flow data,
the proportion of the dataset above the maximum gauged flow ranged from 3-17%. No sites
were excluded at this stage of the analysis.
13) Uncertainty associated with streamflow data collected – Adelaide River at Railway Bridge
(G8170002) was selected as a representative site to undertake an uncertainty analysis. This
site has 3 rating tables that are relevant over the period of available flow data. The average
uncertainty (flow weighted) for this gauge over its whole period of record was estimated to be
21%, which is outside of the range recommended in the guidelines of +10%. This is not
unexpected, as uncertainty is expected to be higher in tropical northern Australia relative to the
available reference studies of uncertainty in southern Australia. Uncertainty was estimated to
have reduced in this gauge over time, with most recent flows being the most reliable. It should
be noted that this analysis has used some segments with less than 20 gaugings, which is fewer
than that recommended in the Australian Standard. This uncertainty analysis highlighted that
results are very sensitive to the delineation of rating table segments and the distribution of
gaugings within those segments. Plots of the uncertainty expected for different flow ranges is
presented in Appendix B for each rating table.
14) Report on land use change – Information on land use and land use change is presented below.
There is currently no urban area upstream of each of the four candidate high quality sites, as
shown in Table 5-6, hence any historical changes in urbanisation are expected to be negligible.
Table 5-6 Change in urban area over time
Site
number
Site name Current urban area as a % of total
catchment area
G8170002 Adelaide River at Railway Bridge 0%
G8170066 Coomalie Creek at Stuart Hwy 0%
G8170075 Manton River u/s Manton Dam 0%
G8170084 Adelaide River at Tortilla Flats 0%
Forest cover is highest in the Coomalie Creek catchment. Over time, forest cover is increasing at
each gauge, as shown in Figure 5-9. The reasons for this are unclear and may reflect the method of
data collection rather than a change in forest cover. This would warrant further investigation.

SINCLAIR KNIGHT MERZ
I:\VWES\Projects\VW05100\Deliverables\Reports\r06_HQ Gauges Report_SKM.docx PAGE 51
Figure 5-9 Change in forest cover over time
Historical information on small catchment dam (farm dam) capacity is not available, although
it is understood that given the relatively low slopes and high evaporation rates, small
catchment dams are not a popular form of water storage in the Northern Territory. A visual
inspection of aerial imagery indicated that there was not a high prevalence of small catchment
dams in the study area.
According to the Northern Territory Fire and Rescue Service (undated), bushfires are a
ubiquitous feature of the Northern Territory dry season, with the territory having the most
frequent, largest and most poorly documented vegetation fires of any part of the continent. In
the higher rainfall savanna woodlands of the northern Kimberley, the Top End and Cape York
up to half of the total area may be burned either every year or every second year. The area
burnt is not mapped because of the prevalence of fires, rather the change in forest cover
reflects any changes in area burnt from year to year.
15) Spatial and Temporal representativeness – The period of record of the selected gauges is listed
in Table 5-7. This shows that all selected gauges have a long record with minimal missing
data in the most recent climate phase. In the climate phase prior to 1960, there was very little
data available and no sites had 15 years of data with less than 5% missing. Whilst no data
0
10
20
30
40
50
60
70
80
90
100
1972 1977 1985 1995 2005 2009
Fore
st C
ove
r (%
of a
rea)
Adelaide River at Railway Bridge
Adelaide River at Tortilla Flats
Coomalie Creek at Stuart Hwy
Manton River u/s Manton Dam

SINCLAIR KNIGHT MERZ
I:\VWES\Projects\VW05100\Deliverables\Reports\r06_HQ Gauges Report_SKM.docx PAGE 52
exists prior to 1953, the availability of data in the most recent climate phase indicates that the
data provides good temporal representation across the Adelaide River Basin.
The gauges are located on five different tributaries and range in upstream catchment area from
28 km2 to 1246 km
2. It includes sites in both the southern and mid latitudes of the catchment.
The elevation of sites ranged from 28 m to 69 m, and whilst this difference in elevation is low,
it should be recognised that the Adelaide River catchment is not characterised by high
mountain ranges at its watershed boundary. These catchments are therefore considered to
provide good spatial representation across the Adelaide River Basin.
From the four selected catchments, the sites on the Adelaide River at Tortilla Flats and the
Coomalie Creek site had been used in previous regional hydrologic studies (SKM 2009a; SKM
2009b).
Table 5-7 Period of record and availability of data in different climate phases
Site
number
Site name Catchment
Area (km2)
Period of
record
Availability of > 15 years of data with < 10%#
missing
Pre-1960* Post-1960
G8170002 Adelaide River at Railway Bridge 632 1953-2007 No Yes
G8170066 Coomalie Creek at Stuart Hwy 82 1958-2008 No Yes
G8170075 Manton River u/s Manton Dam 28 1965-2007 No Yes
G8170084 Adelaide River at Tortilla Flats 1246 1958-2007 No Yes
*assessed from 1945, which is 15 years to 1960. No data existed in this river basin prior to 1953.
#criterion for missing data relaxed from 5% to 10% for this river basin to ensure spatial representativeness.
16) Plot daily flow duration curves and double mass curves – Flow duration curves for each site
are shown in Figure 5-10. The curves illustrate similar behaviour at the two Adelaide River
sites and a slightly higher baseflow in the two tributaries. There is no clear evidence of data
anomalies in these curves. The flow duration curves are plotted for the whole period of
available record and not for individual climate phases because there was insufficient data prior
to 1960 to create a flow duration curve representative of this early period. There was a
significant amount of missing data at the site at Railway Bridge (G8170002) prior to 1960.
Data from gauges G8170002, G8170066 and G8170075 show a high degree of stationarity
when plotted as double mass curves against data from gauge G8170084. The data plotted
covers the period 1965 to 2007, which is all within the one climate phase. There is some
missing data at all sites, which has been omitted for plotting purposes. The double mass curve
for the Adelaide River site is shown in Figure 5-11, whilst the remaining two sites are shown
on Figure 5-12, which is plotted on a smaller scale.

SINCLAIR KNIGHT MERZ
I:\VWES\Projects\VW05100\Deliverables\Reports\r06_HQ Gauges Report_SKM.docx PAGE 53
Figure 5-10 Flow duration curves for whole period of record
0.1
1
10
100
1000
10000
100000
1000000
0 10 20 30 40 50 60 70 80 90 100
Flo
w (
ML/
d)
Percentage of time that flow is exceeded (%)
G8170002 Adelaide River at Railway Bridge
G8170066 Coomalie Creek at Stuart Hwy
G8170075 Manton River u/s Manton Dam
G8170084 Adelaide River at Tortilla Flats

SINCLAIR KNIGHT MERZ
I:\VWES\Projects\VW05100\Deliverables\Reports\r06_HQ Gauges Report_SKM.docx PAGE 54
Figure 5-11 Double mass curve 1965-2007 for Adelaide River at Railway Bridge
Figure 5-12 Double mass curve 1965-2007 for Coomalie Crek and Manton River
0
1000000
2000000
3000000
4000000
5000000
6000000
7000000
8000000
9000000
0 2000000 4000000 6000000 8000000 10000000 12000000 14000000 16000000
Cu
mu
lati
ve f
low
(M
L)
Cumulative flow at G8150084 Adelaide River at Tortilla Flats (ML)
G8170002 Adelaide River at Railway Bridge
0
100000
200000
300000
400000
500000
600000
700000
800000
900000
0 2000000 4000000 6000000 8000000 10000000 12000000 14000000 16000000
Cu
mu
lati
ve f
low
(M
L)
Cumulative flow at G8150084 Adelaide River at Tortilla Flats (ML)
G8170066 Coomalie Creek at Stuart Hwy
G8170075 Manton River u/s Manton Dam

SINCLAIR KNIGHT MERZ
I:\VWES\Projects\VW05100\Deliverables\Reports\r06_HQ Gauges Report_SKM.docx PAGE 55
17) Present the list of sites to State agency representatives – For the case studies, this step has not
been undertaken.
18) Other supporting information - There are no high quality rainfall stations within the Adelaide
River catchment. The nearest high quality rainfall station is site 014015 at Darwin, which is
around 30 km to the west of the Adelaide River catchment boundary. Elevation data was
previously presented at Step 15.
5.4. Summary of Adelaide River case study outcomes
In summary, four streamflow gauges were selected as high quality streamflow gauges in the
Adelaide River basin suitable for seasonal forecasting. These are:
G8170002 Adelaide River at Railway Bridge;
G8170066 Coomalie Creek at Stuart Hwy;
G8170075 Manton River u/s Manton Dam; and
G8170084 Adelaide River at Tortilla Flats.
These sites are considered to provide good spatial and temporal representation of streamflow data
in the Adelaide River basin. All of the data at these streamflow gauges are affected by regular
burning, however the frequency of that burning is so often that it is not expected to affect the
stationarity of streamflow data. This would need to be confirmed with the Northern Territory
Government. There was also an increase in forest cover observed at all sites since the 1990s,
which again would warrant further investigation.
No streamflow gauges were selected as high quality streamflow gauges in the Adelaide River
basin suitable for long-term climate change investigations because none of the sites included at
least 15 years of good quality data from two climate phases.

SINCLAIR KNIGHT MERZ
I:\VWES\Projects\VW05100\Deliverables\Reports\r06_HQ Gauges Report_SKM.docx PAGE 56
6. Conclusions and Recommendations
This study for the Bureau of Meteorology prepared guidelines for selecting high quality streamflow
gauges around Australia. It included undertaking a literature review of previous studies, which
were then used to inform the development of the guidelines. The guidelines are intended to
provide direction to the Bureau but also allow flexibility in adjusting thresholds in the future to
preserve some spatial and temporal representativeness in the datasets when applied around
Australia. The guidelines were tested with two case studies. For the Campaspe River basin five
high quality streamflow sites were identified as suitable for seasonal forecasting and two of those
were considered suitable for historic climate change investigations. For the Adelaide River basin,
four high quality streamflow sites were selected for seasonal forecasting and no sites were suitable
for historic climate change investigations.
Some steps in the guidelines were not followed for the case study, notably the consultation on the
selected sites with state agency representatives. It is therefore recommended that the Bureau revisit
these two river basins prior to finalising any national datasets of high quality streamflow sites.
In undertaking the guidelines, a number of observations can be made which may assist the Bureau
in deciding the future direction of its identification of high quality streamflow gauging stations:
The order in which tasks were undertaken may need to be varied in some river basins in order
to minimise the effort required. For example, given the lack of sites with data in the Adelaide
River, starting with the elimination of sites with insufficient data may be preferable to
examining flow regulation or diversion information. In the Campaspe River basin, given the
ease of identifying flow regulation and the relatively longer lengths of available data, the order
of application of the guideline steps is probably the most efficient approach.
In the Adelaide River basin, the threshold for the proportion of missing data allowed was
relaxed from 5% to 10% in order to achieve greater spatial representation across the basin.
Such flexibility would ideally be retained by the Bureau for other river basins. Applying the
guidelines rigidly in all cases is unlikely to lead to the best outcome for the Bureau.
Land use change information was often difficult to obtain and in both case studies there were
land use changes which occurred throughout the catchments. In the Adelaide River basin
bushfires are prevalent across the basin, whilst in the Campaspe River the volume of farm
dams has grown rapidly over recent decades. The occurrence of major bushfires in the
Campaspe River basin was also evident in the historical streamflow record. The double mass
curves were quick to prepare and helpful in identifying land use changes specific to any
individual catchment within a river basin, but were unable to identify land use changes
affecting the data where it affects all sites within a river basin equally. The Bureau will need
SINCLAIR KNIGHT MERZ
I:\VWES\Projects\VW05100\Deliverables\Reports\r06_HQ Gauges Report_SKM.docx PAGE 57
to carefully consider its approach to dealing with land use change in different parts of
Australia.
Forest cover information at both case study locations indicated an increase over time, which
appears counter-intuitive. This could be attributable to a change in method in data collection.
The Bureau should investigate this issue in the two case study catchments prior to using the
forest cover information more widely.
The estimation of streamflow data uncertainty using the Australian Standard was quite
sensitive to the delineation of rating table segments. The case study site did not meet the
minimum number of gauging per segment recommended by the Australian Standard, which is
likely to be a data constraint at many sites around Australia. The benefit of using this standard
appears to be low given the effort involved, unless the Bureau can automate this calculation.
The use of quality codes and the proportion of data outside of the gauged stage range would
appear to be more practical measures of data quality for nationwide application of the
guidelines.
Automation of many of the steps in the process by the Bureau may help to reduce the potential
for manual errors in data processing and increase flexibility in adjusting thresholds in
particular river basins to achieve good spatial and temporal representation.
Some aspects of the guidelines are arbitrary and will need to be refined by the Bureau after
wider application. This includes the setting of thresholds for missing data, thresholds for data
above and below the gauged flow range, thresholds for data uncertainty and the delineation of
climate phases in different regions of Australia. The threshold of 10% for the volume of
diversions or discharges relative to mean annual flow may need to be more stringent for
climate change investigations than seasonal forecasting. The magnitude of the change being
detected may be within 10% of the mean annual flow in some climate zones, although it is
noted that in south-east Australia climate induced changes in mean annual flow post-1994 have
been well in excess of this figure.
After preparing the guidelines and applying them to the two case studies, the following
recommendations are made:
1) The Bureau should apply these guidelines more widely to test their broader applicability and
adjust the various thresholds in the guidelines accordingly if required.
2) The “stn type” field in the Bureau’s water resources station catalogue should be expanded to
differentiate between rivers, drains, channels and pipes. This would allow the Bureau to more
readily exclude streamflow gauging sites that are impaired because they are actually located on
irrigation drains, irrigation channels or wastewater treatment plant discharge outfalls.
SINCLAIR KNIGHT MERZ
I:\VWES\Projects\VW05100\Deliverables\Reports\r06_HQ Gauges Report_SKM.docx PAGE 58
3) The “is_regulated” field on the Bureau’s water resources station catalogue should have an
expanded description in the help file to illustrate the criteria by which the site has been
designated as regulated. The regulation for sites 406224 and 406224A should be checked for
consistency in the catalogue.
4) The water resources station catalogue’s csv file of the list of sites for the Adelaide River basin
did not contain any data. This should be updated by the Bureau.
5) Further work should be undertaken to classify periods of stationary streamflow data with
respect to climate in the different parts of Australia. This is because regional hydrologic
studies have examined climate shift in climate classes which are not homogenous in relation to
the magnitude and direction of historical climate shifts.
6) The Bureau should consider whether it can automate many of the steps in the guidelines,
including the uncertainty analysis. It is recommended that the uncertainty analysis is not used
in the application of the guidelines unless this calculation can be automated.
7) The Bureau should investigate whether the forest cover data used in the case studies is affected
by the data collection method prior to using this data more widely.
8) The Bureau should endeavour to standardise quality codes for streamflow gauging around
Australia. This would make the interpretation of quality codes by data collectors and users
much easier.
SINCLAIR KNIGHT MERZ
I:\VWES\Projects\VW05100\Deliverables\Reports\r06_HQ Gauges Report_SKM.docx PAGE 59
7. Abbreviations
Abbreviation Meaning
AWRC Australian Water Resources Council
FSR Flow stress ranking; which provides an indication of the relative ‘naturalness’ of the streamflow and incorporates a number of indices to describe the difference between the current and unimpacted streamflow regime. Scores range from 1 to 10, with 10 representing the smallest difference between current and natural conditions
SDL Sustainable Diversion Limits; this project calculated man annual flow and total upstream water use. The ratio of total upstream water use and the man annual flow was calculated to provide an indication of the magnitude of diversions.
SINCLAIR KNIGHT MERZ
I:\VWES\Projects\VW05100\Deliverables\Reports\r06_HQ Gauges Report_SKM.docx PAGE 60
8. References
Australia Standards International (2001). Australian Standard, Measurement of Water Flow in
Open Channels Part 3:1: Velocity-area methods - Measurement by current-meters and
floats, AS378.3.1-2001, Australian Standards International, Sydney, Australia.
Bowman, S. and J. Ruprecht (2000). Blackwood River Catchment Flood Risk Study. Surface Water
Hydrology Report Series, Water and Rivers Commission. Report No SWH 29.
Bureau of Meteorology (2010a). About High Quality Site Data,
http://www.bom.gov.au/climate/change/hqsites/about-hq-site-data.shtml.
Bureau of Meteorology (2010b). Network requirements for seasonal forecasting, Jeff Perkins for
Bureau of Meteorology, Internal Document.
Cai, W. and T. Cowan (2008). "Evidence of impacts from rising temperature on inflows to the
Murray-Darling Basin." Geophysical research letters 35(L07701).
Carlisle, D. M., J. Falcone, D. M. Wolock, M. R. Meador and R. H. Norris (2009). "Redicting the
natural flow regime: Models for assessing hydrological alteration in streams." River
Research and Applications 26: 118-136 (2010).
Chiew, F., J. T. Dewi Kirono, A. Frost, J. Bathols, J. Vaze, N. Viney, K. Hennessy and W. Cai
(2008). Climate data for hydrologic scenario modelling across the Murray-Darling Basin -
A report to the Australian Government from the CSIRO Murray-Darling Basin Sustainable
Yields Project, CSIRO.
Chiew, F. H. S. and L. Siriwardena (undated). "Estimation of SIMHYD parameter values for
application in ungauged catchments."
Chiew, F. H. S., J. Vaze, N. R. Viney, J. M. Perraud, J. Teng and D. A. Post (2008). Modelling
runoff and climate change impact on runoff in 178 catchments in the Murray -Darling
Basin using sacramento and SIMHYD rainfall-runoff modells. Water Down Under 2008,
14-17 April 2008. Adelaide, Australia.
CSIRO (2008a). Water availability in the Murray Darling Basin.
CSIRO (2008b). South West Western Australia Sustainable Yields project - Description of project
methods, November 2008.
CSIRO (2009). Water in the Timor Sea Drainage Division - A report to the Australian Government
from the CSIRO Northern Australia Sustainable Yields Project, CSIRO Water for a
Healthy Country Flagship.
CSIRO (2009a). Rainfall-runoff modelling for Tasmania, A report to the Australian Government
from the CSIRO Tasmanian Sustainable Yields Project.
CSIRO (2009b). Surface Water Yields in South West Western Australia, CSIRO for the Australian
Department of the Environment, Water, Heritage and the Arts. December 2009.
Della-Marta, P. M., D. A. Collins and K. Braganza (2004). "Updating Australia's high-quality
annual temperature dataset." Australian Meteorological Magazine 53: 75-93.
DSE (2010). Victorian Water Accounts 2007-2008 - A statement of Victorian water resources.
Gan, K. C., T. A. McMahon and I. C. O'Neill (1988). Estimation of yields and storages for small
rural ungauged catchments. Conf. on Agr. Eng., I.E.Aust. Nat. Conf. Publ. 88/12, pp. 302-
306.
ICAM, ANU and SKM (1999). Impacts and implications of farm dams on catchment yield,
Prepared by Integrated Catchment Assessment and Management Centre, The Australian

SINCLAIR KNIGHT MERZ
I:\VWES\Projects\VW05100\Deliverables\Reports\r06_HQ Gauges Report_SKM.docx PAGE 61
National University, Canberra and Sinclair Knight Merz, Victoria for Murray Darling
Basin Commission. Natural Resource Management Strategy, Project R7028.
IOCI (2009). Fact Sheet - How WA’s Climate Has Changed.
Jolly, P. and P. Jolly (2007). Analysis of long-term rainfall trends in northern Australia.
International Association of Hydrogeologists conference, Groundwater in Carbonate Rocks
in North of Australia, Darwin, Australia.
Jovanovic, B., D. A. Collins, K. Braganza, D. Jakob and D. A. Jones (2009). A high-quality
monthly total cloud amount dataset for Australia, Climatic Change (submitted).
Jovanovic, B., D. A. Jones and D. A. Collins (2006). A high quality monthly pan-evaporation data
set for Australia, Submitted to Climatic Change.
Kiem, A. S. and D. C. Verdon-Kidd (2010). "Towards understanding hydroclimatic change in
Victoria, Australia - preliminary insights into the "Big Dry"." Hydrol. Earth Syst. Sci 14:
433-445.
Lang, S., P. W. Jordan, J. Durrant and R. J. Nathan (2008). Defining sustainable diversion limits in
unregulated south-west Western Australian catchments. Water Down Under 2008.
Lavery, B., G. Joung and N. Nicholls (1997). "An extended high-quality historical rainfall dataset
for Australia." Australian Meteorological Magazine 46: 27-38.
Lavery, B., A. Kariko and N. Nicholls (1992). "A historical rainfall data set for Australia."
Australian Meteorological Magazine 40: 33-39.
Lowe, L. (2009). Addressing uncertainties associated with water accounting, University of
Melbourne, Melbourne, 502pp.
McMahon, T. A., R. M. Vogel, M. C. Peel and G. G. S. Pegram (2007). "Global streamflows - Part
1: Characteristics of annual streamflows." Journal of Hydrology (2007) 347: 243-259.
Moliere, D., J. Lowry, G. Staben and C. Humphrey (2006). Flow characteristics of streams in the
Tropical Rivers Region. 30th Hydrology and Water Symposium, 4-7 December 2006,
Launceston, TAS.
Moliere, D. R., J. B. Lowry and C. L. Humphrey (2009). "Classifying the flow regime of data-
limited streams in the wet-dry tropical region of Australia." Journal of Hydrology (2009)
367(1-2): 1-13.
Nathan, R. J., K. Austin, D. Crawford and N. Jayasuriya (1996). "The estimation of monthly yield
in ungauged catchments using a lumped conceptual model." Australian Journal of Water
Resources Vol. 1, No. 2, 1996.
Nathan, R. J., P. A. Crowe and B. Neal (undated). "The estimation of farm dam yields in small
agricultural catchments in south-eastern Australia." journal unknown.
Nathan, R. J. and T. A. McMahon (1992). "Estimating low flow characteristics in ungauged
catchments." Water Resources Management 6: 85-100.
Nathan, R. J. and P. E. Weinmann (1993). Low Flow Atlas for Victorian Streams. Drought
Management Plan for Victorian Water Resources: Long Term Planning Guidelines
Background Report - L3, Prepared by the Rural Water Corporation for the Victorian
Department of Conservation and Natural Resources. January 1993.
Neal, B. P., R. J. Nathan and R. Evans (2004). Survey of baseflows in unregulated streams of the
Murray-Darling Basin. 9th Murray-Darling Basin Groundwater Workshop.
Northern Territory Fire and Rescue Service (undated). Understanding bushfire: trends in deliberate
vegetation fires in Australia.
Ozbey, N., P. Scanlon and A. Western (2008). Investigating the uncertainty in flow at gauging sites
in Gippsland using Australian Standard 3778.2.3. Water Down Under 14-17 April 2008,
Adelaide, Australia.

SINCLAIR KNIGHT MERZ
I:\VWES\Projects\VW05100\Deliverables\Reports\r06_HQ Gauges Report_SKM.docx PAGE 62
Peel, M. C., F. H. S. Chiew, A. W. Western and T. A. McMahon (2000). Extension of unimpaired
monthly streamflow data and regionalisation of parameter values to estimate streamflow in
ungauged catchments. National Land and Water Resources Audit - Theme 1: Water
Availability, Centre for Environmental Applied Hydrology The University of Melbourne.
Petheram, C., T. A. McMahon and M. C. Peel (2008). "Flow characteristics of rivers in Northern
Australia: implications for development." Journal of Hydrology (2008) 257: 93-111.
Post, D., F. Chiew , J. Teng, J. Vaze, A. Yang, F. Mpelasoka, I. Smith, J. Katzfey, F. Marston, S.
Marvanek, D. Kirono, K. Nguyen, D. Kent, R. Donohue, L. Li and T. McVicar (2009).
Production of climate scenarios for Tasmania - A report to the Australian Government
from the CSIRO Tasmania Sustainable Yields Project, CSIRO Water for a Healthy Country
Flagship.
Rural Water Commission (1990). Victorian Surface Water Information to 1987.
SEACI (2001). Climate Variability and Climate Change in South Eastern Australia
SKM (2002a). Survey of baseflows in unregulated catchments in the Murray-Darling Basin, Final,
Sinclair Knight Merz for Murray-Darling Basin Commission, SKM Ref: WC01629.
SKM (2002b). Impact of softwood plantations on streamflow yield. Development and testing of a
simulation model for planning purposes. Final A, Prepared for State Forests, New South
Wales.
SKM (2003). Sustainable Diversion Limit Project - Estimation of sustainable diversion limit
parameters over winterfill periods in Victorian catchments, Sinclair Knight Merz for
Victorian Department of Sustainability and Environment. SKM Ref: WC02444,
WC01569.
SKM (2004). Estimating available water using sustainable diversion limits - The estimation of
farm dam impacts on selected streamflow indices in SDL catchments, Sinclair Knight Merz
for the Victorian Department of Sustainability and Environment. March 2004.
SKM (2007a). Seasonal forecasting of Victorian streamflows - Phase 1 report. Final, Sinclair
Knight Merz for Department of Sustainability and Environment.
SKM (2007b). Development and Trial of a Methodology for Total Water Resource Assessment in
Tropical Australia, Final Report. 19 November 2007. Prepared for Land and Water
Australia.
SKM (2007c). Impact of the 2003 Alpine bushfires on streamflow. Task 1 - Broadscale
assessment. Version 2, Prepared for the Department of Sustainability and Environment.
SKM (2008a). Approach for determining sustainable diversion limits for south-west Western
Australia, Final C, Sinclair Knight Merz for Western Australia Department of Water, SKM
Ref: VW03805.
SKM (2008b). Northern Australia Integrated Water Resource Assessment. Data availabiltiy
Report, Final. 22 September 2008. Prepared for the National Water Commission.
SKM (2008c). Impact of the 2006/07 bushfires on streamflow in the Gippsland Region, Prepared
for the East Gippsland Catchment Management Authority.
SKM (2008f). Statewide estimates of water use for key land use types, Sinclair Knight Merz for
Department of Sustainability and Environment.
SKM (2008g). Northern Australia Integrated Water Resource Assessment - Data Availability
Report, Sinclair Knight Merz for National Water Commission.
SKM (2009a). Northern Australia Sustainable Yields, Final, Sinclair Knight Merz for CSIRO,
SKM Ref: VW04514.
SKM (2009b). Project 7: Baseflow for catchment simulation - Data collation and catchment
characteristics, Sinclair Knight Merz for Engineers Australia Water Engineering, SKM
Ref: VW04648.

SINCLAIR KNIGHT MERZ
I:\VWES\Projects\VW05100\Deliverables\Reports\r06_HQ Gauges Report_SKM.docx PAGE 63
SKM (2009c). Impacts of Farm Dams on Streamflow. Investigation into Comparative Impacts of
Different Types of Dams, One of a series of reports prepared for the Western Australia
Department of Water on this topic.
SKM (2009d). Combined Impact of the 2003 and 2006/07 bushfires on streamflow, Prepared for
the Department of Sustainability and Environment.
SKM (2010a). MDBA Baseflow Assessment Draft Report, Sinclair Knight Merz for CSIRO.
SKM (2010b). A preliminary assessment of the potential consequences of bushfire to water
resources, Sinclair Knight Merz for Department of Sustainability and Environment.
SKM (2010c). Model to predict flows in the Googong catchment, Sinclair Knight Merz for
ActewAGL.
SKM and BRS (2010). Initial Estimates of Activities that Intercept Surface Water and
Groundwater, To be released as a National Water Commission publication in June 2010.
SKM and CRC for Freshwater Ecology (2002). Sustainable Diversion Limit Project -
Recommendations for sustainable diversions limits over winterfill periods in unregulated
Victorian catchments, Sinclair Knight Merz and Cooperative Research Centre for
Freshwater Ecology for Victorian Department of Natural Resources and Environment.
SKM Ref: WC02444, WC01569.
Slack, J. R. and J. M. Landwehr (2006). A U.S Geological Survey streamflow data set for the
United States for the study of climate variations, 1874-1988.
State Rivers and Water Supply Commission (1971). Victorian Gaugings to 1969.
State Rivers and Water Supply Commission of Victoria (1984). Victorian Surface Water
Information to 1982.
Torok, S. J. and N. Nicholls (1996). "A historical annual temperature dataset for Australia."
Australian Meteorological Magazine 45: 251-260.
Trewin, B. C. (2001). Extreme temperature events in Australia, PhD Thesis, School of Earth
Sciences, University of Melbourne, Australia.
Voorwinde, L., R. Nathan and B. Hansen (2003). Estimation of the sustainable winter diversions in
ungauged Victorian catchments. 28th International Hydrology and Water Resources
Symposium, Wollongong, NSW.
WaterCorporation (2008). Water forever - Options for our water future
WMO (2004). Commission for Hydrology, 12th Session: Abridged Final Report with Resolutions
and Recommendations: WMO-No. 979,. Geneva, World Meteorological Organization:
55p.

SINCLAIR KNIGHT MERZ
I:\VWES\Projects\VW05100\Deliverables\Reports\r06_HQ Gauges Report_SKM.docx PAGE 64
Appendix A Example streamflow data quality codes
A.1 Thiess Environmental Services in Victoria
Quality Code Description
1 Good continuous records
2 Good quality edited data
3 Linear infill to first value in block (no data lost)
4 Temporary coded for currumbeene data
5 Drawdown - chart rating applies
6 Phased Rating Applicable-gradual changing of control&channel
8 Pool reading only
9 Pool dry - no data collected
10 Data transposed from recorder chart
11 Operational data/abnormal data from op. or natural extremes
12 Routine sampling for calibration purposes
13 Accurate derived data from multiple sources (level & flow)
14 Telemetry data not stored in archive
15 Minor editing
20 Edited to measurements
26 Daily read records (MW - Good periodic data)
27 MW - Good periodic data (Other Authority)
30 Good Meas. - mult. point\044 40 sec timing (Good acc. data - MW)
31 Good Meas. - Adeq. verts & obs\044 40 sec timing (Good acc. data - MW)
32 Fair Measurement - Weighted mean gauge hieght\044 turbulent flow\044 flow angle extreme
33 3 Point Measurement - Applicable in narrow sections eg. sewers etc.
34 Bucket Measurement - Applicable to weirs\044 pipe outflow etc.
35 Composite Measurement - Segments taken from several gaugings to create a composite
36 Measurement for sampling purposes. Rough estimate
39 Catchment area defined
40 Catchment area not defined
41 MW - Good data not validated by other means - No editing required
42 Low velocity acoustic record affected by wind or gate opening
50 Medium editing >Q=15 (1996 on & MW) or HYMAN data import (pre1996)
54 Unregistered Ecowise code
55 Unregistered Ecowise code
56 Unregistered Ecowise code
60 LATROBE VALLEY DATA

SINCLAIR KNIGHT MERZ
I:\VWES\Projects\VW05100\Deliverables\Reports\r06_HQ Gauges Report_SKM.docx PAGE 65
65 Other authorities data
75 Height correction applied
76 Reliable interpolation
77 Correlation with other station\044 same variable
78 Reliable Daily Read Data (MW)
80 Accumulated
81 Wet day within accumulated rainfall period
82 Linear interpolation across gap in records.
83 BCC Below Instrument Range
90 Salinity interpolation
92 PROJECT SITE U/S DATA USED
95 Irregular time rate data - weekly/monthly read.
100 Irregular data use with caution.
101 Reliable Data Estimate (MW)
104 Records estimated
119 Unregistered Ecowise code
120 Estimated data not using correlation (MW)
130 Estimated periodic data (MW)
140 Estimated Accumulated Data (MW)
142 Unregistered Ecowise code
146 Drawdown - no rating applies
148 Theoretical rating table applied
149 Raw data as received from Serco (MW)
150 Rating extrapolated due to insufficient gaugings (Unrel. data - MW)
151 Data lost due to natural causes - NRE approved loss
152 Refer station file
153 PROBE OUT OF WATER/BELOW INSTRUMENT THRESHOLD
155 ABOVE INSTRUMENT THRESHOLD
160 Backed-up by d/s influence. (Unreliable periodic data - MW)
161 Debris Effecting Sensor.
165 Suspect or bad data supplied by other authority
166 Unregistered Ecowise code
170 Raw unedited data stored in archive (Unrel. accum. data - MW)
180 Equipment malfunction
190 Data unavailable station discontinued
200 Data available but not digitised
201 Data not rec. - no correlation available (Station not op. - MW)
205 Unregistered Ecowise code
235 Poor Measurement - Not enough verticals or observations\044 not enough information
236 Suspect or Incomplete Measurement - Equipment suspect or giving problems causing measurment to be aborted.

SINCLAIR KNIGHT MERZ
I:\VWES\Projects\VW05100\Deliverables\Reports\r06_HQ Gauges Report_SKM.docx PAGE 66
237 Surface Velocities - Velocity measurements taken on surface only.
238 Control Leaking - Control leaking\044 either as noted on measurement or chart.
239 Backed up Flow Measurement - Measurement is affected by backup.
240 Not Coded Measurement - Measurement not coded as per HYDSYS System.
250 Rating table suspended
253 Brisbane Quality code
254 Rating table exceeded
255 No Data Exists (Lost data - MW)
A.2 Melbourne Water – Victoria
Quality PrintQual Text Active
1
Very Good data - no editing required (or 1-5mm error) T
2
Good quality edited data, minor editing only T
3
Linear infill to first value in block (no data loss - Thiess Quality) T
4
Excellent Sewerage data or unknown quality from another agency T
5
Excellent Sewerage data with minor editing or unknown quality from another agency T
6
Excellent Sewerage data with major editing or Phase rating applicable - gradual changing of control and channel T
7 B Very Good data, rating not applicable due to backwater effect T
8
Pool reading only (Thiess Quality) T
9
Pool dry - no data collected (Thiess Quality) T
10
Unknown Quality (perhaps introduced from another agency) F
11
Unknown Quality (perhaps introduced from another agency) F
12
Unknown Quality (perhaps introduced from another agency) F
15
Minor editing only (Thiess Quality) T
16
Unknown Quality (perhaps introduced from another agency) F
19
Good quality rating extrapolation T
20
Unknown Quality (perhaps introduced from another agency) F
23
Unknown Quality (perhaps introduced from another agency) F
25
Unknown Quality (perhaps introduced from another agency) F
26
Good periodical data (MWH) T
27 ! Good periodical data (Others - not continuous reading) T
29
Unknown Quality (perhaps introduced from another agency) F
30 + Good accumulated data (MWH - continuous reading), Good measuement - multi point 40 sec timing T
31 # Good accumulated data (Others - continuous reading), Good measurement - adeq. verts & obs -40sec timing T
32
Fair measurement - weighted mean gauge height, turbulent flow, flow angle extreme T
33
3 point measurement - applicable in narrow sections eg. sewers T
34
Bucket measurement - applicable to weirs, pipe outflow etc. T
35
Composite measurement - segments taken from several gaugings to create a composite T
36
Measurement for sampling purposes - rough estimate T
38
Unknown Quality (perhaps introduced from another agency) F

SINCLAIR KNIGHT MERZ
I:\VWES\Projects\VW05100\Deliverables\Reports\r06_HQ Gauges Report_SKM.docx PAGE 67
40
Unknown Quality (perhaps introduced from another agency) F
41
Good Data not validated by other means T
50 Z Good or Reliable data (5-10mm error), medium editing required T
54
Good Sewerage data or unknown quality from another agency T
55
Good Sewerage data with minor editing or unknown quality from another agency T
56
Good Sewerage data with major editing or unknown quality from another agency T
57 B Good/Reliable data, rating not applicable due to backwater T
65
Other authorities data (Thiess Quality) T
69
Fair quality rating extrapolation T
70
Unknown Quality (perhaps introduced from another agency) F
75
Fair data (10-15mm error), major editing required T
76 * Fair data, edited by correlation with another site, gaps <0.5day filled by interpolation T
77 & Reliable data correlation with aother station same variable T
78 % Reliable daily read data - MWH private raingauge operator T
79 B Fair data, rating not applicable due to backwater effect T
80
Unknown Quality (perhaps introduced from another agency) F
82
Linear interpolation across gap in records T
90
Salinity interpolation T
91
Unknown Quality (perhaps introduced from another agency) F
92
Unknown Quality (perhaps introduced from another agency) F
100
Comms failure for Sewerage data - exclude from KPI or Unknown Quality (perhaps introduced from another agency) T
101 R Reliable data estimate using good correlation with other variable, Estimated Rating or regenerated velocity sewerage data T
103
Unknown Quality (perhaps introduced from another agency) F
104 ~ Estimated data edited using a reasonable correlation or fair quality sewerage data T
105
Fair Sewerage data with minor editing or unknown quality from another agency T
106
Fair Sewerage data with major editing or unknown quality from another agency T
110
Unknown Quality (perhaps introduced from another agency) F
120 I Estimated data not using correlation (ave. dry weather hydrograph used) or Rating extrapolated T
130 P Estimated periodical data, slightly suspect staff gauge readings T
135
Unknown Quality (perhaps introduced from another agency) F
140 A Estimated accumulated data, slightly suspect check bottle reading etc T
144
Poor Sewerage data or unknown quality from another agency T
145
Poor Sewerage data with minor editing or unknown quality from another agency T
146
Poor Sewerage data with major editing or Drawdown - ratings not applicable T
148 @ Theoretical rating table applied T
149
Raw data as recieved from contractor, only quality codes changed T
150 U Poor data, historical rating or rating not verified, use with caution at clients discretion T
151 ^ Poor Data (15-25mm error) or data yet to be verified. Use with caution T

SINCLAIR KNIGHT MERZ
I:\VWES\Projects\VW05100\Deliverables\Reports\r06_HQ Gauges Report_SKM.docx PAGE 68
153
Probe out of water or outside instrument threshold T
155
Poor data due to reasons beyond the control of hydrographic contractor T
157 B Poor data, rating not applicable due to backwater effect T
160 U Unreliable data (>25mm error) or unrelaible periodical data T
161
Unreliable data due to reasons beyond the control of hydrographic contractor T
165
Unknown Quality (perhaps introduced from another agency) F
170 S Unreliable accumulated data, suspect check reading T
180
Unknown Quality (perhaps introduced from another agency) F
200
Unknown Quality (perhaps introduced from another agency) F
201 ? Station not commissioned - instrument not installed or known not to be working or no sewerage data T
202
No Sewerage data or unknown quality from another agency T
204
Unknown Quality (perhaps introduced from another agency) F
205
Sewerage data lost or unknown quality from another agency T
235
Poor measurement - not enough verticals or observations T
236
Suspect or incomplete measurement - equipment problems causing measurement to be aborted T
237
Surface velocities - velocity measurement taken on surface only T
238
Control leaking as noted on measurement or chart T
239
Backed up flow measurement - measuement affected by back water T
240
Data lost due to reasons beyond the control of hydrographic contractor T
250 M Unreliable data due to SCADA system error T
254 X Rating table exceeded, data is above or below rating table limits T
255 N Invalid or lost data, instrument or operator error, unusable bad data T
A.3 NRETAS – Northern Territory
Quality
Description data type 1
Good - continuous data T
2
good quality - continuous data - some minor editing T
6
Good Point data-manually entered which adequately represents continuous record T
7
Good Isolated Point T
11
Good Gauging T
31
Reserved For WQ 31-40 T
32
Good - imported from WQ Branch spreadsheets T
41
Good Rating T
45
Good Rating Extrapolated T
51 S Satisfactory - continuous data T
52 S Satisfactory - estimated continuous data T
56 S Satisfactory Point data-manually entered which adequately represents data T
57 S Satisfactory Isolated Point T
61 S Satisfactory Gauging T
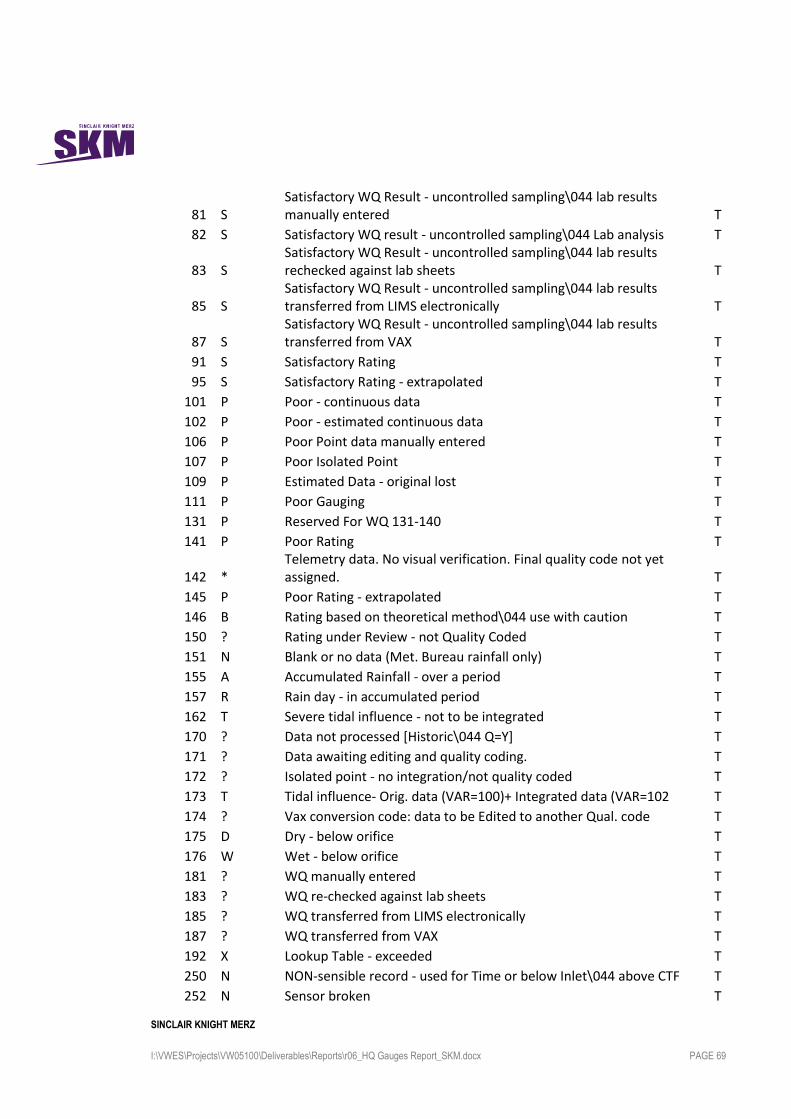
SINCLAIR KNIGHT MERZ
I:\VWES\Projects\VW05100\Deliverables\Reports\r06_HQ Gauges Report_SKM.docx PAGE 69
81 S Satisfactory WQ Result - uncontrolled sampling\044 lab results manually entered T
82 S Satisfactory WQ result - uncontrolled sampling\044 Lab analysis T
83 S Satisfactory WQ Result - uncontrolled sampling\044 lab results rechecked against lab sheets T
85 S Satisfactory WQ Result - uncontrolled sampling\044 lab results transferred from LIMS electronically T
87 S Satisfactory WQ Result - uncontrolled sampling\044 lab results transferred from VAX T
91 S Satisfactory Rating T
95 S Satisfactory Rating - extrapolated T
101 P Poor - continuous data T
102 P Poor - estimated continuous data T
106 P Poor Point data manually entered T
107 P Poor Isolated Point T
109 P Estimated Data - original lost T
111 P Poor Gauging T
131 P Reserved For WQ 131-140 T
141 P Poor Rating T
142 * Telemetry data. No visual verification. Final quality code not yet assigned. T
145 P Poor Rating - extrapolated T
146 B Rating based on theoretical method\044 use with caution T
150 ? Rating under Review - not Quality Coded T
151 N Blank or no data (Met. Bureau rainfall only) T
155 A Accumulated Rainfall - over a period T
157 R Rain day - in accumulated period T
162 T Severe tidal influence - not to be integrated T
170 ? Data not processed [Historic\044 Q=Y] T
171 ? Data awaiting editing and quality coding. T
172 ? Isolated point - no integration/not quality coded T
173 T Tidal influence- Orig. data (VAR=100)+ Integrated data (VAR=102 T
174 ? Vax conversion code: data to be Edited to another Qual. code T
175 D Dry - below orifice T
176 W Wet - below orifice T
181 ? WQ manually entered T
183 ? WQ re-checked against lab sheets T
185 ? WQ transferred from LIMS electronically T
187 ? WQ transferred from VAX T
192 X Lookup Table - exceeded T
250 N NON-sensible record - used for Time or below Inlet\044 above CTF T
252 N Sensor broken T

SINCLAIR KNIGHT MERZ
I:\VWES\Projects\VW05100\Deliverables\Reports\r06_HQ Gauges Report_SKM.docx PAGE 70
253 N Logger broken T
254 N No Recorded Data (Instrumentation removed) T
255 N No Record or Record Lost T
A.4 DERM – Queensland

SINCLAIR KNIGHT MERZ
I:\VWES\Projects\VW05100\Deliverables\Reports\r06_HQ Gauges Report_SKM.docx PAGE 71
A.5 DLWBC – South Australia
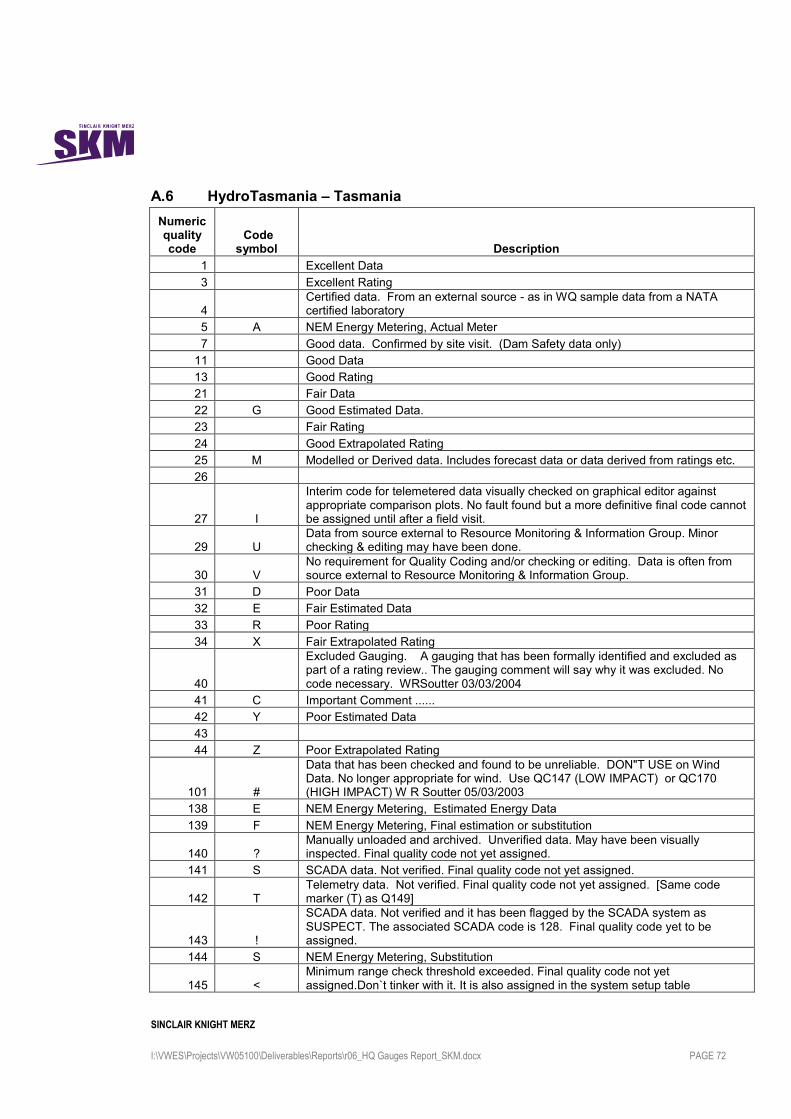
SINCLAIR KNIGHT MERZ
I:\VWES\Projects\VW05100\Deliverables\Reports\r06_HQ Gauges Report_SKM.docx PAGE 72
A.6 HydroTasmania – Tasmania
Numeric quality code
Code symbol Description
1 Excellent Data
3 Excellent Rating
4 Certified data. From an external source - as in WQ sample data from a NATA certified laboratory
5 A NEM Energy Metering, Actual Meter
7 Good data. Confirmed by site visit. (Dam Safety data only)
11 Good Data
13 Good Rating
21 Fair Data
22 G Good Estimated Data.
23 Fair Rating
24 Good Extrapolated Rating
25 M Modelled or Derived data. Includes forecast data or data derived from ratings etc.
26
27 I
Interim code for telemetered data visually checked on graphical editor against appropriate comparison plots. No fault found but a more definitive final code cannot be assigned until after a field visit.
29 U Data from source external to Resource Monitoring & Information Group. Minor checking & editing may have been done.
30 V No requirement for Quality Coding and/or checking or editing. Data is often from source external to Resource Monitoring & Information Group.
31 D Poor Data
32 E Fair Estimated Data
33 R Poor Rating
34 X Fair Extrapolated Rating
40
Excluded Gauging. A gauging that has been formally identified and excluded as part of a rating review.. The gauging comment will say why it was excluded. No code necessary. WRSoutter 03/03/2004
41 C Important Comment ......
42 Y Poor Estimated Data
43
44 Z Poor Extrapolated Rating
101 #
Data that has been checked and found to be unreliable. DON"T USE on Wind Data. No longer appropriate for wind. Use QC147 (LOW IMPACT) or QC170 (HIGH IMPACT) W R Soutter 05/03/2003
138 E NEM Energy Metering, Estimated Energy Data
139 F NEM Energy Metering, Final estimation or substitution
140 ? Manually unloaded and archived. Unverified data. May have been visually inspected. Final quality code not yet assigned.
141 S SCADA data. Not verified. Final quality code not yet assigned.
142 T Telemetry data. Not verified. Final quality code not yet assigned. [Same code marker (T) as Q149]
143 !
SCADA data. Not verified and it has been flagged by the SCADA system as SUSPECT. The associated SCADA code is 128. Final quality code yet to be assigned.
144 S NEM Energy Metering, Substitution
145 < Minimum range check threshold exceeded. Final quality code not yet assigned.Don`t tinker with it. It is also assigned in the system setup table

SINCLAIR KNIGHT MERZ
I:\VWES\Projects\VW05100\Deliverables\Reports\r06_HQ Gauges Report_SKM.docx PAGE 73
146 > Maximum range check threshold exceeded. Final quality code not yet assignedDon`t tinker with it. It is also assigned in the system setup table
147 N Non conforming data. Known errors. LOW IMPACT. Final quality code not yet assigned.
148 Temporary Qcode for ERRTS rainfall data where >1 tip recorded by sensor. WRSoutter 18/03/2008
149 t Telemetry data from an EXTERNAL source. No visual verification. Final quality code not yet assigned. [Same code marker (T) as Q142]
150 P
Partial Statistic - some data missing in period. A SYSTEM quality code applied to data when processing/outputting. Not to be applied by individuals as a quality code when editing data.
160 NULL VAL
Covers the case where a parameter value does not exist at that time. Examples (a) Null turbidity when 0 flow in a stream. (b) Data values exceed range values of deliberately limited range sensor. (c) Target level not declared for some time periods
170 BAD Non conforming data. Known errors. HIGH IMPACT. Final quality code not yet assigned.
180 [ ] Unprocessed Record, data exists (e.g. charts) but not yet imported.
190 MISSING
Lost record or insufficient data for reasonable archive. DATA lost from an OPEN site. Compare with QC200 that deals with the case of no data because the site was CLOSED for a period of its history.
191 CLIPPED
Lost data where out of range data deemed spurious has been amended as it was archived. The data value is what the spurious value was clipped to. Pre-existing clips have not been converted to output to this quality. They output to QC190. WRS 16/06/2008
200 NO DATA
No data available at this site for the current period. Generally because of an executive decision to CLOSE the site. Associated with sites that are CLOSED and later RE-OPENED. Do not confuse with QC190 that covers data that was lost from an OPEN site.
201 RAT ERR
Error occurred in applying rating equation to data QUALITY CODES GREATER THAN 201 ARE RESERVED BY TSM, THEY MUST NOT BE ALTERED UNDER ANY CIRCUMSTANCES !!!
202 RAT LOW Data point below lower limit of rating
203 RAT UPP Data point above upper limit of rating
204 NO RAT Period found but specified rating does not exist
205 RAT PER No application period found for data point. Rating period error.
206 NO CONV No conversion available
207 INTP ERR Interpolation error. This may be caused by a timing error or by incompatible data types.
208 NOINVERT Rating/conversion is non invertible.
209 DATUM Chain conversion uses datum which is outside range of rating
210 UNDF VEC Undefined vector. Resultant vector has zero length.
211 NO INTEG Integration inappropriate for this data type - data types 3,4,7
212 NO DIFFN Differentiation inappropriate for this data type - data types 2,3,4,7,8,9
213 NO AGGRG Data Type change or other problem encountered - no Aggregation allowed.
214 NO INTRP Data Type change or other problem encountered - no Interpolation allowed.
220 UNKNOWN No value or quality associated with current point.
225 <-GAP-> Gap between time series records. Code assigned when gap is filled automatically by archiving operations. Check reason and then assign appropriate quality code
230 QEXCLUDE Original quality in user specified exclusion range. Generated by QMax and QExclude transformations.
255 NULL Used for initialisation purposes

SINCLAIR KNIGHT MERZ
I:\VWES\Projects\VW05100\Deliverables\Reports\r06_HQ Gauges Report_SKM.docx PAGE 74
A.7 Department of Water – Western Australia Quality Code
Report Symbol Description
1
Very Good Record
2 ' Very Good Record - Corrections applied
3 " Good Record - Corrections or Estimations applied
4 * Estimated Record - Good
5 * Estimated Record - Fair
6 * Estimated Record - Poor
10 * Estimated Record - Not reviewed / Quality not known
11 @ Theoretical Rating
12 & Estimated Rating
21 $ Daily Read - Good Record
22 * Daily Read - Estimated
23 # Daily Read - Derived from incomplete record
24 R Daily Read - Rainday within period of accumulated record
25 A Daily Read - Accumulated Rainfall
30 " Station data, as supplied by BoM
31 " Deaccumulated using nearby station
32 " Deaccumulated using interpolated data
33 " Nearby station, data from BoM
34 " Interpolated daily observations
35 " Interpolated long term average
100 = Sample Group Code - WIN SAMP CUSTODIANS
101 < Sample Group Code - WIN SAMP CUSTODIANS
102 > Sample Group Code - WIN SAMP CUSTODIANS
103 ~ Sample Group Code - WIN SAMP CUSTODIANS
104 = Sample Group Code - WIN SITE SAMPLE CUST
105 < Sample Group Code - WIN SITE SAMPLE CUST
106 > Sample Group Code - WIN SITE SAMPLE CUST
107 ~ Sample Group Code - WIN SITE SAMPLE CUST
108 = Sample Group Code - WIN INV CUSTODIANS
109 < Sample Group Code - WIN INV CUSTODIANS
110 > Sample Group Code - WIN INV CUSTODIANS
111 ~ Sample Group Code - WIN INV CUSTODIANS
151 B Below inlet
152 [ Not available
161 U Unrated
255 [ No record

SINCLAIR KNIGHT MERZ
I:\VWES\Projects\VW05100\Deliverables\Reports\r06_HQ Gauges Report_SKM.docx PAGE 75
Appendix B Uncertainty plots for Adelaide River at Railway Bridge
The method for deriving these uncertainty plots was outlined in Section 3.5. The three plots below
illustrate the uncertainty for each rating table period over different segments of the rating table.
For example, the uncertainty plot for the rating table covering the period 1952-58 shows that
uncertainty in the first segment is high in percentage terms at low flows and reduces to a minimum
of around 42% at a flow of approximately 25 ML/d. The method appears to be affected by end
effects in estimating uncertainty, because uncertainty always rises at the ends of the segments.
Uncertainty for this rating table is lowest in the third segment covering the flow range from
approximately 1500 ML/d to 32,000 ML/d. Uncertainty rises again in the fourth segment in the
high flow range.
B.1 Uncertainty plot for 1952-1958
0
20
40
60
80
100
120
140
1 10 100 1000 10000 100000
Un
ce
rta
inty
(%
re
co
rde
d f
low
)
Discharge (ML/day)
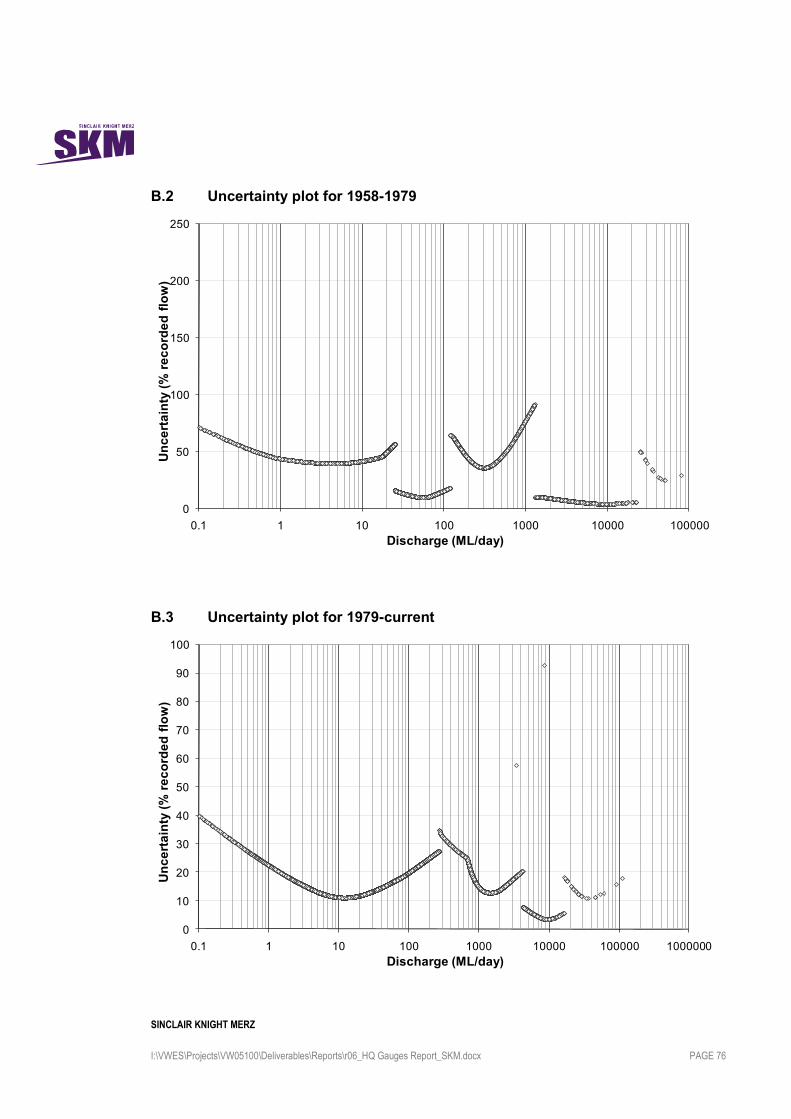
SINCLAIR KNIGHT MERZ
I:\VWES\Projects\VW05100\Deliverables\Reports\r06_HQ Gauges Report_SKM.docx PAGE 76
B.2 Uncertainty plot for 1958-1979
B.3 Uncertainty plot for 1979-current
0
50
100
150
200
250
0.1 1 10 100 1000 10000 100000
Un
ce
rta
inty
(%
re
co
rde
d f
low
)
Discharge (ML/day)
0
10
20
30
40
50
60
70
80
90
100
0.1 1 10 100 1000 10000 100000 1000000
Un
ce
rta
inty
(%
re
co
rde
d f
low
)
Discharge (ML/day)