developing functional relationships between temperature
TRANSCRIPT
Received: 8 June 2020 Accepted: 18 November 2020 Published online: 16 February 2021
DOI: 10.1002/agj2.20537
A R T I C L E
B i o m e t r y , M o d e l i n g , a n d S t a t i s t i c s
Developing functional relationships between temperature andcover crop species vegetative growth and development
Jay W. Munyon1,2 Raju Bheemanahalli1 Charles Hunt Walne1 K. Raja Reddy1
1 Dept. of Plant and Soil Sciences,
Mississippi State Univ., 117 Dorman Hall,
Box 9555, Mississippi State, MS 39762,
USA
2 Current address: Pacific Northwest
Research Station, USDA Forest Service,
3200 SW Jefferson Way, Corvallis, OR
97331, USA
CorrespondenceK. Raja Reddy, Dept. of Plant and Soil Sci-
ences, Mississippi State Univ., 117 Dorman
Hall, Box 9555, Mississippi State, MS39762.
Email: [email protected]
Funding informationNational Institute of Food and Agriculture,
Grant/Award Numbers: 2019-34263-30552:,
MIS 043050; USDA Agricultural Research
Service, Grant/Award Number: 58-6064-9-
007
AbstractCover crops planted in the offseason are subjected to uncontrollable weather variables
that limit agro-ecological services through modifications in growth and develop-
ment. The growth of five cover crop species was investigated in response to an array
of day/night temperatures, 17/9, 22/14, 27/19, 32/24, and 37/29 ˚C. Shoot and root
parameters were measured 33 d after planting. Quadratic functions best described
most of the root and shoot dynamics in response to increasing temperatures except
for a linear response of plant height in crimson clover (Trifolium incarnatum) and
mustard (Brassica juncea). Temperature minimum (Tmin), maximum (Tmax), and
optimum (Topt) for shoot traits varied from 9.8 to 10.6, 37.5 to 43.2, and 23.9 to
26.5 ˚C, respectively. The Tmin for root traits varied significantly, ranging from 8.5
to 10.8 ˚C. Topt and Tmax ranged from 22 to 25.7 and 35.2 to 40.6 ˚C, respectively.
On average, the Topt for root traits was significantly lower than shoot traits in four of
five species. Regardless of temperatures, cover crop species recorded higher biomass
partitioning to shoot (62%) than to root, with a maximum proportion of biomass par-
titioned to shoot in crimson clover and Mighty Mustard Pacific Gold (80%) than other
species (64–70%). The results of this study will help growers choose mixes of cover
crops with the same temperature range to plant in the same climatic conditions during
fallow periods. The cardinal temperatures and functional algorithms for growth and
developmental traits could be used to develop models for cover crops under different
temperature conditions.
1 INTRODUCTION
Cover crops span a diverse range of species and plant
types commonly grown for soil and water conservation
(Clark, 2015). Growing cover crops during fallow periods
can increase nitrogen for cash crops, improve cash crop yield
(Tonitto et al., 2006), and provide multiple benefits to soil
Abbreviations: DAP, days after planting; SPAR, soil–plant–atmosphere
research; Tmax, maximum temperature; Tmin, minimum temperature; Topt,
optimum temperature.
This is an open access article under the terms of the Creative Commons Attribution License, which permits use, distribution and reproduction in any medium, provided the original
work is properly cited.
© 2020 The Authors. Agronomy Journal published by Wiley Periodicals, Inc. on behalf of American Society of Agronomy
health (Dabney et al., 2001; Fageria et al., 2005). Essential
benefits of cover crops are to cover the soil over the winter to
protect the surface from erosion, high-velocity precipitation,
and provide a high-humidity environment for bacteria, fungi,
and invertebrates to break down the stubble remaining from
the previous cash crop (Wienhold et al., 2018; Clark, 2015).
Cover crop species planted in early or late fall experience
a range of air and soil temperatures (Blanco-Canqui et al.,
2014). Extreme temperatures (sub- and supra-optimal) dur-
ing the early seedling stage significantly affect the growth
Agronomy Journal. 2021;113:1333–1348. wileyonlinelibrary.com/journal/agj2 1333

1334 MUNYON ET AL.
and development of plants (Li et al., 2014; Lynch & Clair,
2004). Research on cash crops has shown that the temperature
optimum (Topt) varies among species and determines adapt-
ability of different species to different climatic zones (Gray
& Brady, 2016; Nagai & Makino, 2009; Reddy et al., 2017;
Tribouillois et al., 2016). Crop growth and development typ-
ically follow a positive linear function between minimum
temperature (Tmin) and Topt. A negative linear function
is observed between Topt and beyond Topt in many crops
(Wheeler et al., 2000). The ability of plant species to with-
stand changing microclimatic conditions depends on their
thermal adaptation ability (Luo, 2011; Urban, 2015). A range
of crop species has been evaluated for their adaptability and
response to temperature changes by considering physiologi-
cal, root and shoot parameters (Luo, 2011; Luo et al., 2020;
Nagai & Makino, 2009; Reddy et al., 2017). However, sim-
ilar thermal adaptation studies are limited in cover crops.
Recently, germination response to temperature changes and
water potential has been reported using a wide range of cover
crop species (Tribouillois et al., 2016). To help select the most
appropriate cover crops for planting as a function of tem-
perature, germination response to temperature alone is insuf-
ficient. Cover crops are exposed to extreme, both sub- and
supra-optimal, temperatures due to the diversity of planting
dates throughout the United States. These extreme tempera-
tures can prevent cover crops from producing enough biomass
to keep the land covered (Weil & Kremen, 2007), limiting the
expected agroecological services from the cover crops.
Cover crops are being incorporated into cropping sys-
tems to scavenge nitrogen from the soil profile and use
the scavenged nitrogen for cash crop growth (Nevins et al.,
2020; Singh et al., 2018). Cover crop root biomass physically
binds, anchors, and stabilizes soil particles; provides a food
source to soil organisms; and increases microbial biomass
(Blanco-Canqui et al., 2014). The significance of below-
ground cover crop biomass for building soil organic matter
has been reported across species (Austin et al., 2017). Root
biomass often decomposes faster than aboveground biomass
and plays an essential role in structuring the soil and improv-
ing soil health (Sievers & Cook, 2018). Certain cover crop
species with vigorous root growth in favorable areas of the
soil profile may provide more benefits than other species by
improving nutrient utilization and mobilizing from deeper
layers (Rosolem et al., 2002) and can maintain a better shoot–
root balance.
Early development of root systems is critical in seedling
establishment and achieving the desired functionality
throughout the fallow period. The temperatures that occur
during the early growing season are very influential on the
cover crop. Changes in growing temperature can induce sig-
nificant biomass accumulation changes and their allocations
(Boese & Huner, 1990; Nagai & Makino, 2009). There have
been reports describing how extreme temperatures affect
plant growth and development at various stages. Studies
Core Ideas∙ Functional relationships of cover crop species
growth to temperature are needed to develop
models.
∙ Determine the response of vegetative growth of
several cover crop species to temperature.
∙ Estimate cardinal temperatures for the shoot and
root traits.
∙ Among the species tested, mustard consistently
provided higher biomass across a wide range of
temperatures.
have used leaf, shoot, and root properties to explain the
functional relationship between temperature and growth (Luo
et al., 2020; Reddy et al., 2017). Shoot and root responses
to temperature changes can be species-specific and different
species are often known to have different Topt for shoot and
root growth traits (Gray & Brady, 2016; Reddy et al., 2017).
However, we are aware of no information describing the
effects of temperature on the shoot and root morphological
traits of cover crops at the early growth stage. This informa-
tion is critical to understand how plants adjust their biomass
allocation between shoot and root (Aidoo et al., 2016) and
cardinal temperatures for selecting site suitability of specific
cover crop species (Tribouillois et al., 2016).
On the other hand, field studies for understanding the effect
of temperature on the cover crop is tedious, inconsistent, and
seasonally limited. Therefore, there is a need for simple, rapid,
and reliable techniques to understand cover crops’ responses
to temperature. The soil–plant–atmosphere research (SPAR)
systems have the advantage of precise control of air tempera-
ture, CO2 concentration, and air humidity under natural solar
radiation compared to other controlled-environment facilities
(Allen et al., 2020). Functional algorithms developed from
studies using sunlit plant growth chambers helped improve
the crop models (Reddy et al., 1997a, 1997b) used for field
applications and the policy arena (Liang et al., 2012). Here,
we used the SPAR systems to quantify the effect of gradient
temperatures on the growth and development of cover crops,
a prerequisite for modeling studies.
This study used five different cover crop species since they
are widely grown in the United States and worldwide during
the fallow season. The present study hypothesized that physi-
ological, above- and belowground related parameters in cover
crops would have different temperature thresholds or cardinal
temperatures. The specific objectives of this study were to (a)
quantify the effects of gradient temperature on aboveground
and belowground traits, and (b) calculate the cardinal temper-
atures (Tmin, Topt, and maximum temperature, Tmax) for the
shoot and root traits.

MUNYON ET AL. 1335
T A B L E 1 The environmental parameters, average day, night, day/night temperatures, average day chamber CO2 concentration, and average
day/night vapor pressure deficit (VPD) were recorded during the 25 d for each treatment
Measured temperature CO2 VPDSet temperature ˚C μmol mol−1 kPaDay/Night Day Night Day/Night Day Day Night17/09 16.85 ± 0.11 10.22 ± 0.21 13.07 ± 0.14 429.29 ± 1.53 0.62 ± 0.00 0.57 ± 0.01
22/14 21.44 ± 0.07 14.22 ± 0.03 17.32 ± 0.04 427.66 ± 0.91 0.66 ± 0.01 0.60 ± 0.00
27/19 25.88 ± 0.05 18.68 ± 0.04 21.78 ± 0.03 428.71 ± 0.69 0.73 ± 0.02 0.65 ± 0.01
32/24 30.48 ± 0.10 23.20 ± 0.04 26.34 ± 0.05 429.60 ± 1.55 0.77 ± 0.03 0.68 ± 0.01
37/29 35.15 ± 0.06 27.78 ± 0.04 30.96 ± 0.03 428.88 ± 0.81 0.86 ± 0.05 0.75 ± 0.03
2 MATERIALS AND METHODS
2.1 Crop husbandry
This study included four cool-season cover crops (cereal rye
[Secale cereale], crimson clover [Trifolium incarnatum], trit-
icale [Triticum x Secale], and winter wheat [Triticum aes-tivum]) and one warm-season cover crop (Mighty Mustard
Pacific Gold, Brassica juncea). The experiment was carried
out in the controlled environment facility (SPAR units) at
the Environmental Plant Physiology Laboratory, Mississippi
State University (33˚28′N, 88˚47′W), Mississippi State, MS.
The specifications and operation of SPAR units have been
detailed in Reddy et al. (2001).
Seeds of five cover crops were sown in 30.5- by
15.2-cm (height by diameter) polyvinyl chloride pots filled
with a soil medium consisting of 3:1 sand/topsoil (v/v). The
pots were placed in SPAR units set at 27/19 ˚C day/night
temperatures with 70% relative humidity for 7 d to facili-
tate uniform emergence under natural daylengths (photope-
riod of 12/12h light/dark). The seedlings were thinned down
to one plant per pot before the start of actual temperature
treatments. The plants were watered and fertilized with full-
strength Hoagland nutrient solution (Hewitt, 1952) based on
evapotranspiration measured daily (Reddy et al., 2001). The
experiment consisted of two factors (5 levels of temperature
treatments × 5 species) with six replications. The pots were
randomly arranged within each SPAR unit to avoid positional
effects. In this study, 150 plants (5 cover crops × 5 treatments
× 6 replications) were used to estimate the five different cover
crop species’ cardinal temperatures.
2.2 Variable temperature treatments
Upon emergence, temperature setpoints were adjusted to five
different day and night temperatures (17/09, 22/14, 27/19,
32/24, and 37/29 ˚C) and maintained for 25 d (Table 1).
In all the temperature treatments, the maximum tempera-
ture was maintained from sunrise to sunset (photoperiod of
12/12 h light/dark), and the minimum (night) was held from
1 h after sunset to sunrise with a 30-min transition period
between maximum to minimum temperatures and vice versa.
In all the SPAR units, microclimatic conditions such as tem-
perature (HMV 70Y, Vaisala, St. Louis, MO), CO2 (model
LI-6252, LI-COR, Lincoln, NE), and vapor pressure deficit
(estimated following Murray, 1967) were monitored at 15-
min intervals throughout the experiment. The plants were
grown in a SPAR unit under natural daylengths in Starkville
(33˚28′N, 88˚47′W), Mississippi State, MS. Each SPAR unit
consists of a 1.27-cm thick Plexiglas, allowing 97% of the
visible solar radiation to pass without spectral variability in
absorption. The set and measured environmental variables in
this study using five different SPAR units are provided in
Table 1.
2.3 Measurements
Several physiological (leaf chlorophyll, leaf flavonoid index,
and nitrogen balance index), aboveground (height, main stem
or axis leaves, whole-plant leaf area, shoot dry weight, and
whole plant dry weight), and belowground parameters (root
tips, root forks, root crossings, total root length, root volume,
root surface area, and root dry weight) were recorded from all
five treatments.
2.4 Physiological and shoot parameters
Leaf chlorophyll content, flavonoids index, and nitrogen
balance index (the ratio of chlorophyll content/flavonoids)
were measured on the uppermost, fully expanded leaf, second
from the top, across all treatments using a handheld Dualex
Scientific instrument (Force A DX16641, Paris, France) at 32
d after planting (DAP). The following morning (33 DAP), all
plants were hand-harvested, plant height (cm) was measured,
main stem or axis leaves number were counted, and then total
leaf area (cm2 plant−1) was determined using LI-3100 leaf
area meter (LI-COR, Lincoln, NE). Plant components such

1336 MUNYON ET AL.
as shoot dry weights (leaf weight [g plant−1] + stem weight
[g plant−1]) and root weight (g plant−1) were determined
by drying the samples at 80 ˚C until a constant weight was
reached.
2.5 Root morphology
Individual plants were harvested, and the roots were sepa-
rated from the shoot. Any soil that remained adhered to the
roots was washed thoroughly with a mild speed water stream.
Roots were floated in 5 mm of water in a 0.4- by 0.3-m glass
tray and were separated and untangled using plastic forceps
to minimize any root overlap. The roots were scanned with
an Epson Expression 11000XL scanner at a resolution of 800
dots per in, and images were analyzed using WinRHIZO Pro
2009C software (Regent Instruments, Québec, Canada). The
digitized images were used to determine gradient tempera-
ture effects on root development (number of root tips, number
of root forks, and number of crossings per plant) and growth
parameters such as total root length (cm plant−1), root volume
(cm3 plant−1), and root surface area (cm2 plant−1).
2.6 Statistical analysis
The experimental layout was a split plot with a complete ran-
domized block design, considering temperature treatment as
the whole plot and species as the subplot. The variance anal-
ysis was performed to test the effects of temperature treat-
ments, species, and their interactions on the measured traits
using SAS 9.2 (SAS Institute, Cary, NC). The fit of each
regression equation for all parameters’ response to tempera-
ture was determined by comparing r2. The best-fit regression
function was used to estimate cardinal temperatures (Tmin,
Topt, and Tmax) for all the measured parameters among five
cover crops. The cardinal temperatures were estimated fol-
lowing a similar procedure described by Seepaul et al. (2011)
for a quadratic response. The Tmin and Tmax define the lim-
its of growth and development of different cover crops and
Topt at which the response (growth and development) of a
cover crop is maximal. Graphs were generated using Sigma
Plot 13.0 (Systat Software, San Jose, CA).
3 RESULTS AND DISCUSSION
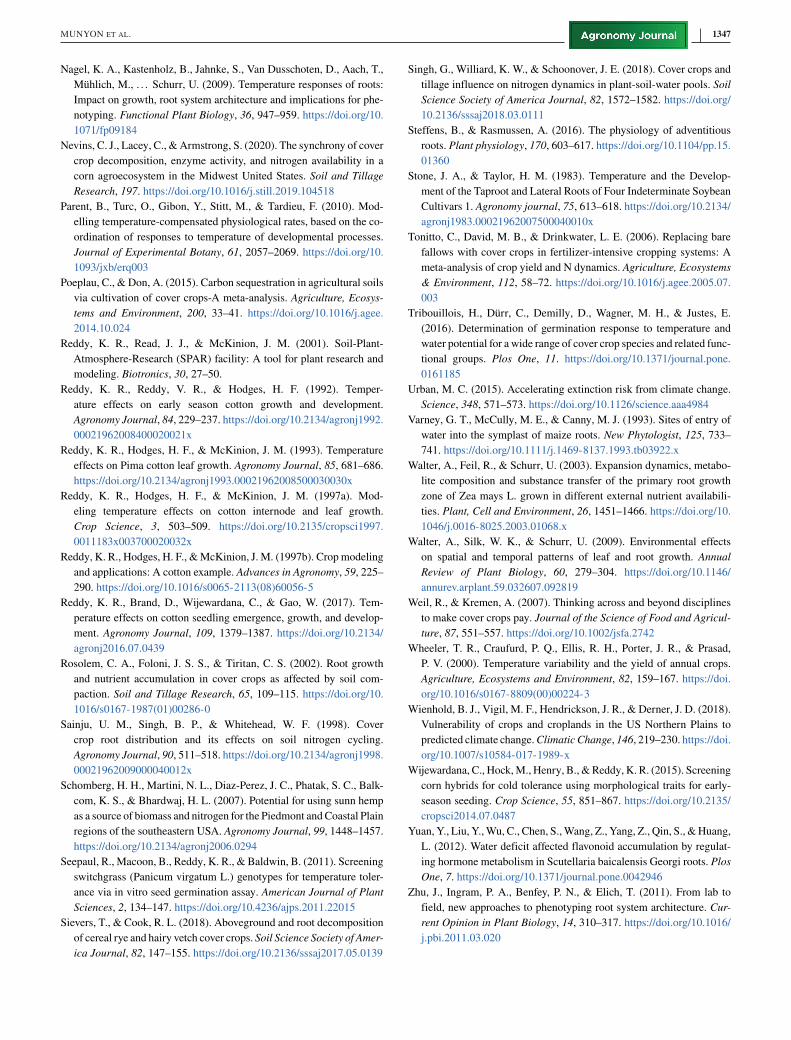
This study compared five different cover crop species for their
adaptive responses of both above- and belowground parame-
ters to temperature (Figure 1; Tables 1, 2). To our best knowl-
edge, this is the first study that tests different cover crop
species across a wide range of growing temperatures (daily
F I G U R E 1 Pictorial representation of temperature effects on shoot
growth and development of five cover crops measured 33 d after planting
or 25 d after temperature treatment
average temperature from 13 to 31 ˚C). Growing plants at
a wide range of temperatures allowed us to calculate cardi-
nal temperatures and develop functional relationships for var-
ious growth and developmental processes at the early seedling
stage (Tables 1, 2, 3). Knowledge of cover crop performance
in response to temperature changes will help select a cover
crop best suited for fallow planting depending on local cli-
matic conditions. On average, all the treatments’ day and
night temperatures were ±0.1 ˚C of the target temperatures
(Table 1). At the same time, the vapor pressure deficit was
slightly lower (0.24 kPa) with a cooler temperature (13.7 ˚C)
compared to a higher temperature (31 ˚C).
3.1 Physiological parameters
Chlorophyll content, flavonoids index, and nitrogen balance
index were affected significantly by temperature treatments
and species (Table 2). The interaction of treatment × species
for chlorophyll content was significant, whereas the interac-
tions for the flavonoids index and nitrogen balance index were
non-significant (Table 2). A decreasing trend in chlorophyll
content with increasing temperature was observed in all
species (Figure 2a). A decrease in chlorophyll content may
be due to heat-stress induced premature loss of chlorophyll or
accelerated chlorophyll degradation under high-temperature
stress (Feierabend, 1977). On average, across species, a higher
chlorophyll (33.6) and flavonoid index (0.96) was observed
at low temperature (13 ˚C), whereas at high temperature
(33 ˚C), they decreased by 14 and 43%, respectively. Under

MUNYON ET AL. 1337
TA
BL
E2
Sum
mar
yof
anal
ysi
sof
var
iance
acro
ssth
ete
mper
ature
trea
tmen
ts(T
),sp
ecie
s(S
),an
dth
eir
inte
ract
ion
(T×
S)
on
dif
fere
nt
root
and
shoot
gro
wth
,physi
olo
gic
al,
and
dev
elopm
enta
l
trai
tsm
easu
red
at33
daf
ter
pla
nti
ng.
Pla
nt
hei
ght
(PH
),num
ber
of
leav
es(L
VS
),le
afar
ea(L
A),
chlo
rophyll
conte
nt
(CC
),fl
avonoid
sin
dex
(FI)
,nit
rogen
bal
ance
index
(NB
I),
root
tips
(RT
),ro
ot
fork
s
num
ber
(RF
),ro
ot
cross
ing
num
ber
(RC
),ro
ot
length
(RL
),ro
ot
volu
me
(RV
),ro
ot
surf
ace
area
(RS
A),
root
dry
wei
ght
(RD
W),
shoot
dry
wei
ght
(SD
W)
and
whole
pla
nt
dry
wei
ght
(TD
W)
Sour
cePH
LVS
LAC
CFI
NBI
RT
RF
RC
RL
RVR
SAR
DWSD
WTD
WTe
mpe
ratu
re(T
)**
***
***
***
***
***
***
***
***
***
***
***
***
***
***
*Sp
ecie
s(S)
***
***
***
***
***
***
***
***
***
***
***
***
***
***
***
T×
S**
***
***
**
NS
NS
***
***
***
****
***
***
***
***
*Te
mpe
ratu
re17/0
9a
aba
aa
aa
aa
aa
aa
aa
a
22/1
4b
bb
ab
bb
bbc
ba
bb
bb
27/1
9c
cc
abc
bc
cc
cb
cc
cd
32/2
4c
dc
ac
bd
dd
db
cc
dd
37/2
9b
cd
bc
bab
bb
aa
abb
cc
Spec
ies
Cer
eal
Rye
dd
bb
ac
cc
cc
bc
cc
c
Cri
mso
nC
lover
aa
aa
aba
aa
aa
aa
aa
a
Mig
hty
Must
ard
Pac
ific
Gold
ee
ca
bc
dd
dd
dc
dd
dd
Tri
tica
lec
cb
cc
cb
bb
bb
bc
cc
c
Wh
eat
bb
ab
cb
bb
bb
bb
bb
b
*S
ign
ific
ant
atth
e.0
5pro
bab
ilit
yle
vel
;*
*S
ign
ific
ant
atth
e.0
1pro
bab
ilit
yle
vel
;*
**
Sig
nif
ican
tat
the
.00
1p
rob
abil
ity
level
;N
Sn
on
-sig
nif
ican
t.aD
ay/n
ight
tem
per
ature
sin
˚C.
bT
emper
ature
and
spec
ies
wit
ha
com
mon
lett
er
are
not
signif
ican
tly
dif
fere
nt
bas
edon
the
t-te
stat
P<
.05
.

1338 MUNYON ET AL.
T A B L E 3 Quadratic equation constants (a, b, and c); regression coefficients (r2); and minimum, optimum, and maximum temperatures (Tmin,
Topt, and Tmax, respectively) for the shoot and root parameters of five cover crops species. Maximum trait value (MTV) at Topt for each of the
parameters is measured in all five species. All the trait values are expressed on a per plant basis
Parameter
Equation constants
r2
Cardinal temperatures
MTV
˚Ca b c Tmin Topt Tmax
Cereal RyeLeaf number, no. −48.03 6.0804 −0.10631 .9 9.5 28.6 47.7 38.9
Leaf area, cm2 −520.29 64.6701 −1.32794 .81 10.2 24.3 38.5 267.1
Aboveground weight, g −2.59 0.3194 −0.00624 .88 10.1 25.6 41.1 1.5
Total dry weight, g −3.67 0.463 −0.00936 .85 9.9 24.7 39.5 2.1
Root crossings, no. −9,426.5 1,180.6 −26.4 .83 10.4 22.3 34.3 3,765.1
Root forks, no. −84,896.4 10,570.8 −235.0 .8 10.5 22.5 34.5 33,983.8
Root tips, no. −28,498.4 4,139.6 −93.7 .85 8.5 22.1 35.7 17,237.1
Root dry weight, g −0.92 0.1193 −0.0026 .98 9.9 23 36.1 0.4
Root length, cm −8,378.3 1,130.3 −25.2 .83 9.4 22.4 35.5 4,303.7
Root surface area, cm2 −999.7 134.7 −3.006 .83 9.4 22.4 35.4 509.8
Root volume, cm3 −9.62 1.2912 −0.02883 .83 9.4 22.4 35.4 4.8
Crimson CloverLeaf number, no. −22.43 2.8312 −0.05458 .92 9.8 25.9 42.1 14.3
Leaf area, cm2 −247.91 28.6546 −0.57415 .89 11.1 25 38.8 109.6
Aboveground weight, g −0.92 0.1076 −0.00209 .9 10.8 25.7 40.7 0.5
Total dry weight, g −1.09 0.1315 −0.00261 .98 10.5 25.2 39.8 0.6
Root crossings, no. −3,209.7 351.5 −7.03 .77 12 25 38 1183
Root forks, no. −26,630.5 3,045.1 −64.37 .83 11.6 23.7 35.7 9,382.8
Root tips, no. −8,831.0 1,207.7 −26.13 .45 9.1 23.1 37.1 5,125.8
Root dry weight, g −0.21 0.0253 −0.00055 .86 10.6 23 35.4 0.1
Root length, cm −4,023.9 496.8 −10.3 .78 10.3 24.1 37.8 1,950.6
Root surface area, cm2 −460.96 59.84 −1.29 .82 9.8 23.2 36.6 231.9
Root volume, cm3 −4.27 0.583 −0.01304 .78 9.2 22.3 35.5 2.2
Mighty Mustard Pacific GoldLeaf number, no. −3.1 0.8181 −0.01446 .93 4.1 28.3 52.5 8.5
Leaf area, cm2 −2,345.47 263.42 −5.32 .92 11.6 24.8 37.9 915
Aboveground weight, g −9.65 1.0588 −0.01984 .91 11.7 26.7 41.7 4.5
Total dry weight, g −12.22 1.3472 −0.02574 .93 11.7 26.2 40.7 5.4
Root crossings, no. −6,409.4 793.4 −13.67 .82 9.7 29 48.4 5,106.3
Root forks, no. −163,877.4 18,017.6 −343.2 .93 11.7 26.2 40.8 72,602
Root tips, no. −18,603.7 2,463.6 −46.1 .93 9.1 26.7 44.3 14,276.8
Root dry weight, g −2.57 0.2857 −0.00587 .83 11.9 24.3 36.7 0.9
Root length, cm −8,229.6 1,089.8 −21.68 .87 9.3 25.1 41 5,464.2
Root surface area, cm2 −2,540.1 291.0 −5.94 .86 11.4 24.5 37.6 1,023.9
Root volume, cm3 −54.99 5.94 −0.12371 .77 12.5 24 35.5 16.3
TriticaleLeaf number, no. −12.76 2.3912 −0.04248 .96 6 28.1 50.3 20.9
Leaf area, cm2 −811.56 91.9592 −1.94193 .95 11.7 23.7 35.6 277.1
Aboveground weight, g −3.04 0.3544 −0.00693 .97 10.9 25.6 40.2 1.5
Total dry weight, g −3.86 0.4704 −0.00949 .97 10.4 24.8 39.2 2
Root crossings, no. −4,488.3 595.1 −12.9 .57 9.5 23.1 36.6 2,370.7
(Continues)

MUNYON ET AL. 1339
T A B L E 3 (Continued)
Parameter
Equation constants
r2
Cardinal temperatures
MTV
˚Ca b c Tmin Topt Tmax
Root forks, no. −55,950.8 7,201.7 −159.9 .76 10 22.5 35.1 25,130.1
Root tips, no. −14,496.3 2,423.4 −55.3 .92 7.1 21.9 36.6 12,037.6
Root dry weight, g −0.64 0.093 −0.00206 .79 8.5 22.5 36.5 0.4
Root length, cm −4,236.48 688.4903 −15.47935 .75 7.4 22.2 37.1 3,419.2
Root surface area, cm2 −689.91 103.947 −2.36769 .88 8.2 22 35.8 451
Root volume, cm3 −8.56 1.2253 −0.02818 .91 8.7 21.7 34.7 4.8
WheatLeaf number, no. −33.75 4.5931 −0.09018 .98 8.9 25.5 42 24.7
Leaf area, cm2 −400.58 47.6359 −1.01935 .96 11 23.4 35.7 155.9
Aboveground weight, g −2.4 0.2842 −0.00602 .99 11 23.6 36.2 1
Total dry weight, g −3.19 0.3917 −0.0084 .95 10.5 23.3 36.1 1.4
Root crossings, g −4,752.6 645.0 −14.7 .97 9.4 22 34.6 2,332
Root forks, no. −49,438.0 6,493.8 −148.3 .98 9.8 21.9 34 21,646.4
Root tips, no. −11,255.6 1,984.8 −45.1 .49 6.7 22 37.3 10,563.3
Root dry weight, g −0.68 0.0876 −0.00192 .98 9.9 22.8 35.8 0.3
Root length, cm −5,326.5 797.4 −18.2 .93 8.2 21.9 35.6 3,403.6
Root surface area, cm2 −681.2 100.3 −2.3 .96 8.4 21.7 35 408.2
Root volume, cm3 −6.95 1.0074 −0.02336 .99 8.6 21.6 34.5 3.9
low temperature, triticale recorded the highest chlorophyll
content (Figure 2a) and flavonoid index (Figure 2b). Con-
versely, increased chlorophyll content and decreased leaf
flavonoids were recorded in Mighty Mustard Pacific Gold
(Figure 2a, b). Under high temperature, wheat recorded
the highest leaf chlorophyll and flavonoids, followed by
triticale, cereal rye, and crimson clover (Figure 2a, 2b).
The nitrogen balance index (ratio of chlorophyll/flavonoids)
increased quadratically with increasing temperature in all
species, except Mighty Mustard Pacific Gold. The maximum
nitrogen balance index was observed at 27/19 ˚C in cereal
rye, 32/24 ˚C in triticale, crimson clover, and wheat, and
37/29 ˚C in Mighty Mustard Pacific Gold (Figure 2c). The
adverse effects (% decrease from Topt) of Tmin and Tmax
on nitrogen balance index were most significant for crimson
clover (31%) and cereal rye (20%), respectively. These
results indicate that plants grown under extreme temperatures
may partition more carbon to synthesize polyphenols than
chlorophyll (Li et al., 2015). Similar to other abiotic stress
studies (Liu et al., 2013; Ma et al., 2014; Yuan et al., 2012),
our results indicate that total flavonoid accumulation was
most significant in response to low and high temperatures for
all species (Figure 2b). These results suggest that flavonoids
may serve a protective role by preventing the generation
and scavenging of reactive oxygen species when exposed to
extreme events (Agati & Tattini, 2010; Jaakola & Hohtola,
2010).
3.2 Root morphology of cover crops
The spatial configuration of the root system architecture in
the soil is important because it can play an essential role in
increasing the soil organic carbon concentration along with
optimizing the acquisition of water and nutrients by plants in
response to different environments (Bardgett et al., 2014; Zhu
et al., 2011). Significant (P < .001) effects of temperature,
species, and the interaction between temperature and species
were observed for root morphological parameters (Table 2).
Variation in the root traits of cover crop species in response to
temperature change might signify adaptive significance at the
seedling stage, as similarly observed in other crops (Luo et al.,
2020). The root development (tips, forks, and crossings) traits
gradually increased from the minimum temperature (Tmin)
to the optimal temperature (Topt) and then sharply decreased
at the highest temperature (Figure 3). The quadratic functions
best described, the root tips (Figure 3a), forks (Figure 3b), and
crossing (Figure 3c) dynamics in response to increasing tem-
perature treatments (Table 3). This quadratic trend resulted in
the different cardinal temperatures for the number of root tips,
forks, and crossings (Figure 3, Table 3). Based on the fits, the
mean Topt of all cover crop species was 23.1 ˚C for root tip
(ranged from 21.9 ˚C for triticale to 26.7 ˚C for Mighty Mus-
tard Pacific Gold), 23.4 ˚C for root forks (ranged from 21.9
˚C for wheat to 26.2 ˚C for Mighty Mustard Pacific Gold),
and 24.3 ˚C for root crossing (ranged from 22 ˚C for wheat to

1340 MUNYON ET AL.
F I G U R E 2 Temperature effect on chlorophyll content (a),
flavonoid index (b), and nitrogen balance index (c) measured 33 d after
planting or 25 d after temperature treatment. Values are the mean of six
replications for each cover crop at each of the temperature treatment
29 ˚C for Mighty Mustard Pacific Gold; Figure 3; Table 3).
Similar to rice (Oryza sativa; Luo et al., 2020) and other
studies (Gray & Brady, 2016), our results showed the exis-
tence of different Topt for root growth for different species.
Mighty Mustard Pacific Gold had a higher Topt and a greater
percentage of root forks (31%) and crossings (47.2%) than
that of other species (Figure 3; Table 3). Wheat had a lower
Topt (4.4−7.1 ˚C) than the Mighty Mustard Pacific Gold for
root tips (Topt = 26.7 ˚C; Figure 3a), forks (Topt = 26.2 ˚C;
Figure 3b) and crossings (Topt = 29 ˚C; Figure 2c). At Topt,
the maximum number of root tips production was found to be
F I G U R E 3 Temperature effects on root tips (a), root forks (b), and
root crossings (c) measured 33 d after planting or 25 d after temperature
treatment. Values are the mean of six replications for each cover crop at
each temperature treatment, and the curves are fitted lines using quadratic
functions
at 21.1 ˚C in cereal rye and the minimum number of root tips
in crimson clover at 23.1 ˚C (Figure 3a; Table 3). For Tmax,
Mighty Mustard Pacific Gold recorded a smaller reduction
in the number of root tips (6%), forks (10%), and crossings
(1%) than other species compared to its Topt (Figure 3). For
Tmin, the maximum reduction in the number of root tips
(60%) and the number of root forks (82%) was observed in
Mighty Mustard Pacific Gold compared to its Topt. It sug-
gests that Mighty Mustard Pacific Gold may be more highly
sensitive to cold temperatures than other cover crops. Root
growth in response to extreme temperatures can be inhibitive
or promotive (Luo et al., 2020). This observed root growth
MUNYON ET AL. 1341
phenomenon in our study under sub- and supra-optimal tem-
peratures might be due to delayed or inhibited root meristem
cell division (Francis, & Barlow, 1988; Zhukovskaya et al.,
2018). This result implies that different cover crop species
exhibit a differential adaptive response to low and high tem-
peratures; thus, their performance would vary as growing tem-
perature varies. For example, a cover crop with more branch-
ing throughout the root system may provide a greater ability
to scavenge for nutrients and water from the soil profile than a
species with less branching (Varney et al., 1993) at any given
temperature.
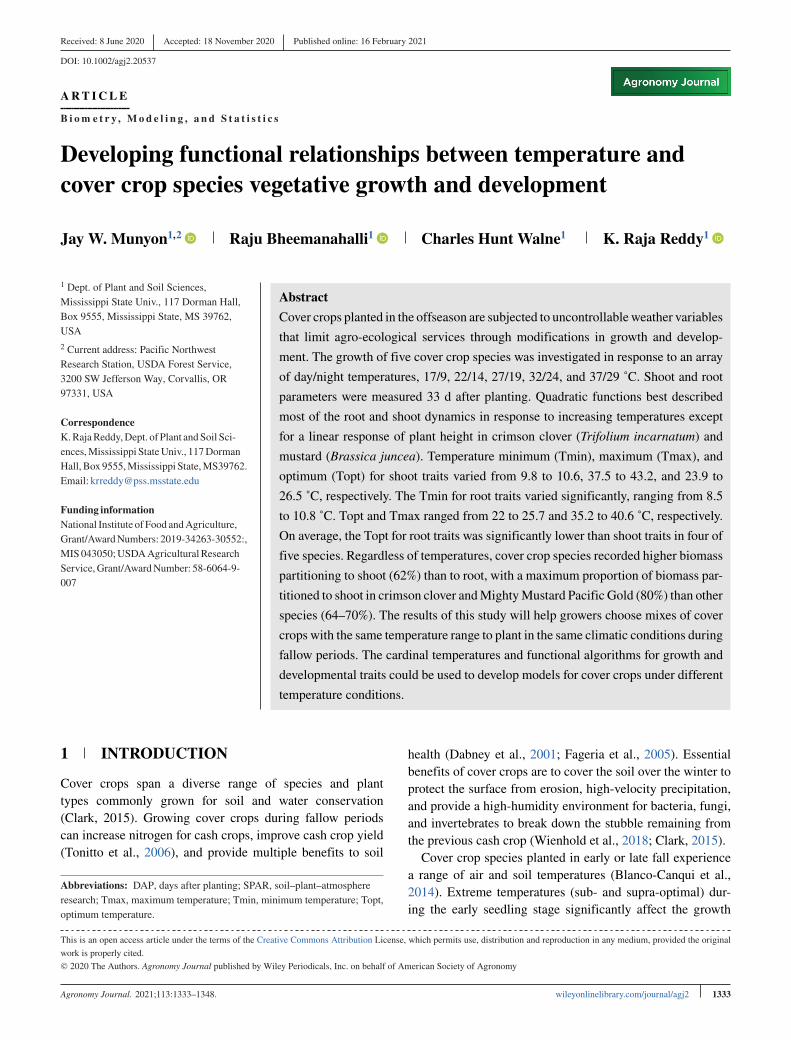
Total root length, root volume, and root surface area are
indicators of root size and play an essential function in water
and nutrient uptake as well as resource use efficiency under
varied abiotic stress conditions in crops (Calleja-Cabrera
et al., 2020; Costa et al., 2002; Hammer et al., 2009), includ-
ing in cover crops (Dabney et al., 2001). Our study revealed
significant treatment, species, and treatment × species inter-
action (P < .001) for root length and root volume (Table 2).
Similar to other studies (Luo et al., 2020; Reddy et al., 1992,
2017), root traits were significantly affected by temperature,
while the magnitude of the temperature effect differed by
species (Figure 4). Root length, volume, and surface area fol-
lowed a quadratic trend in response to an increase in tem-
peratures (Figure 4; Table 3) similar to root development
traits. Among the cover crop species, Topt ranged from 21.9
(wheat) to 25.3 ˚C (Mighty Mustard Pacific Gold) for root
length, 21.6 (wheat) to 24 ˚C (Mighty Mustard Pacific Gold)
for root volume, and 21.7 (wheat) to 24.5 ˚C (Mighty Mus-
tard Pacific Gold) for root surface area (Table 3; Figure 4).
Mighty Mustard Pacific Gold exhibited a greater maximum
total root length (5,464.2 cm, Topt = 25.1 ˚C; Figure 4a), root
volume (16.3 cm3, Topt = 24 ˚C; Figure 4b), and root sur-
face area (1,023.9 cm2, Topt = 24.5 ˚C; Figure 4c) than the
other four species. On average, the plants grown at Tmin had
lower total root length (51%), root volume (56%), and root
surface area (54%) than the plants grown at Topt (Figure 4;
Table 3). Similar to Tmin, the Tmax also significantly low-
ered the root length along with root volume and root surface
area by 32, 45, and 38% compared to its Topt (Figure 4). Trit-
icale (2.6 cm3), cereal rye (2.3 cm3), and wheat (2.2 cm3) had
higher root volume at Tmin than the other two species at the
same temperature (Figure 4b). Mighty Mustard Pacific Gold
showed significantly higher root surface area (Figure 4c) at all
temperatures compared to crimson clover at 33 DAP. Overall,
a decrease in total seedling root length was accompanied by a
massive reduction of root volume and surface area (Figure 4),
indicating reduced root biomass allocation per unit root length
(Figure 4). These results mean that extreme temperatures not
only affect seed germination events (Tribouillois et al., 2016),
but they also have a significant negative effect on the parti-
tioning of resources during growth and development in cover
crops. The nutrient retentions in the root zone and their losses
F I G U R E 4 Temperature effects on cover crop root length (a), root
volume (b), and root surface area (c) measured 33 d after planting or
25 d after temperature treatment. Values are the mean of six replications
for each cover crop at each temperature treatment, and the curves are
fitted lines using quadratic functions
from the fields are predicted to be controlled by the root sys-
tem architecture of cover crops. Therefore, the inclusion of
cover crops with a vigorous root system may alleviate soil
compaction by acting like bio-drills and enhance forage for
resources (Cresswell & Kirkegaard, 1995).
When comparing the root growth and development traits,
there is clear evidence that sub- and supra-optimal tem-
peratures suppressed most of the measured root parameters
(Figures 3, 4). In agreement with the root volume and sur-
face area results, root branching traits (tips, forks, and cross-
ings) of cover crops also exhibited high sensitivity to tem-
perature change (Figure 3). Suppression of root development
and growth under sub- and supra-optimal temperatures could

1342 MUNYON ET AL.
be due to reduced water permeability of the root, decreased
hydraulic conductivity, increased root respiration, and an
imbalance of phytohormones (Ali et al., 1998; Fatichi et al.,
2014; Huang, 1991; Luo et al., 2020; Morales et al., 2003;
Steffens & Rasmussen, 2016). Other studies have reported
that plants are grown in the field with different soil tem-
peratures and diurnal oscillations strongly affect root growth
(Stone & Taylor, 1983; Walter et al., 2009) by changing their
root morphology, physiology, anatomy, and cellular compo-
nents (Calleja-Cabrera et al., 2020; Nagel et al., 2009; Wal-
ter et al., 2003). During the fallow planting in most of the
United States and other parts of the temperate world, extreme
temperatures may coincide with a rainfall shortage. In such
environments, cover crops with a more in-depth rooting sys-
tem could help overcome the negative effect of combined
water deficit and high-temperature stresses (Calleja-Cabrera
et al., 2020; Sievers & Cook, 2018). Our results suggest that
Mighty Mustard Pacific Gold may have better adaptive poten-
tial to combat water deficit with its more in-depth root system
(Figure 3, 4). Evaluation of root traits provides better insights
to distinguish root growth and development at the Topt. Better
root traits enable maximization of soil carbon sequestration,
nitrogen acquisition (Kristensen & Thorup-Kristensen, 2004),
and controls the dynamics of the carbon and nitrogen ratio
(Justes et al., 2009) which ultimately benefits the following
cash crops (Blanco-Canqui et al., 2014; Tonitto et al., 2006).
The assumption is that cover crops with higher total root
length, volume, and surface area coupled with active devel-
opmental traits (more tips, forks, and crossings) would maxi-
mize resource uptake more readily than a species with fewer
numbers of those traits under unfavorable environments. The
cardinal temperatures identified for root growth and develop-
ment in this study can help select the right cover crop accord-
ing to local climatic conditions.
3.3 Aboveground morphology parameters
There is no doubt that the selection of cover crop species for
fallow planting is dependent on several factors. Among all,
species choice largely depends on the climatic conditions of
the site and the characteristics of the cover crop to produce
high biomass (Blanco-Canqui et al., 2014). It is crucial to
know the cardinal temperatures for aboveground traits (leaf
number, leaf area, and biomass) to select the most appropri-
ate species to plant during the fallow season. Plant height,
number of leaves, and leaf area parameters were significantly
affected by treatment, species, and interaction (Table 2). All
three parameters increased quadratically across the tempera-
tures in triticale, cereal rye, and wheat (Figure 5; Table 3).
A similar quadratic trend has been observed between temper-
ature and leaf traits in other crops (Luo et al., 2020; Reddy
et al., 1992; Reddy et al., 1993), whereas a linear increase or
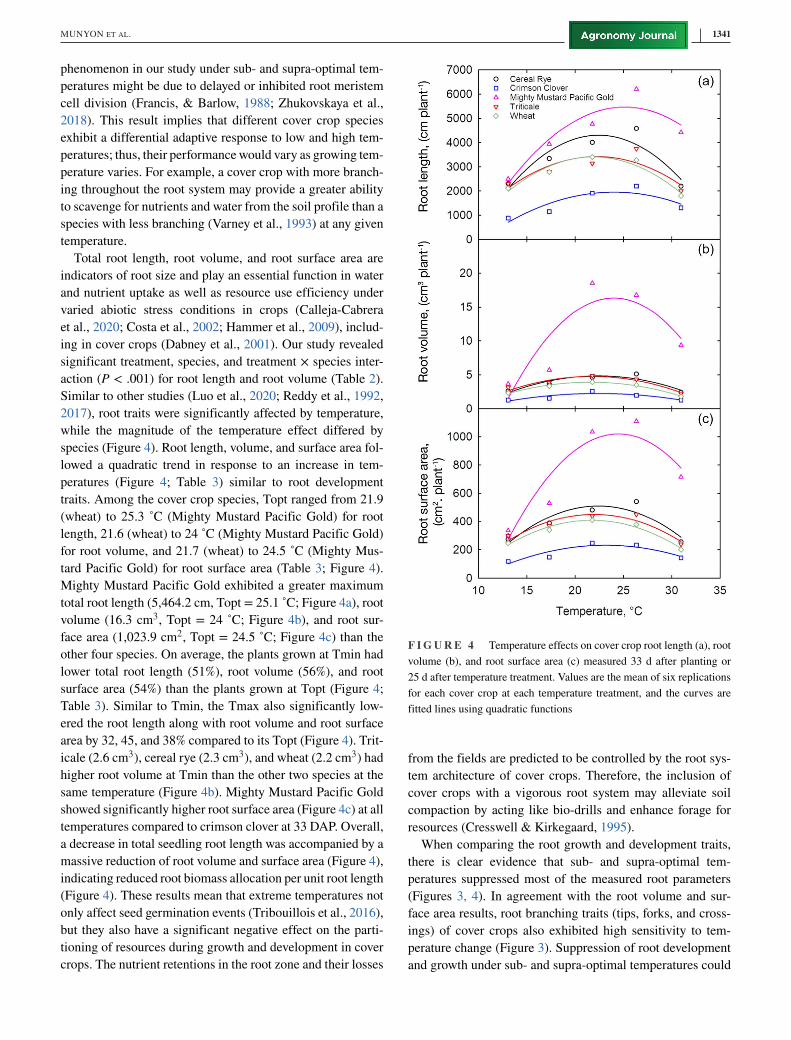
F I G U R E 5 Temperature effect on plant height (a), main stem
and/or axis leaves (b), and whole-plant leaf area of five cover crops mea-
sured 33 d after planting or 25 d after temperature treatment. Values
are the mean of six replications for each cover crop at each temperature
treatment, and the curves are fitted lines using quadratic or linear (plant
height, triticale, and wheat) functions
no change in the height of seedlings were recorded in response
to increasing temperature in Mighty Mustard Pacific Gold and
crimson clover (Figure 5a). Therefore, we have not empha-
sized the plant height parameter in this report. The Topt for the
number of leaves varied from 24.5 (wheat) to 28.6 ˚C (cereal
rye), wherein cereal rye significantly outperformed all other
species (Figure 5b).
Interestingly, Mighty Mustard Pacific Gold exhibited the
lowest temperature (4 ˚C) limits for leaf number, followed
by triticale (6.0 ˚C). In contrast, the remaining three species
MUNYON ET AL. 1343
showed a minimum temperature of slightly above 8.9 ˚C
(Table 3). Mighty Mustard Pacific Gold recorded the high-
est leaf area per plant at all temperatures than the other four
species (Figure 5c). Averaged across species, increased tem-
perature from Topt to Tmax decreased leaf number by 5%
(ranged from 11 to 1%; Table 3) and whole plant leaf area by
28% (varied from 38 to 19%; Figure 5c, Table 3). Likewise,
plants grown at Tmin exhibited a decrease in both leaf num-
ber (54%) and leaf area (73%) compared to the Topt (Table 3).
The adverse effects (% decrease from optimum) of Tmax on
leaf area were most pronounced in wheat (38%) followed by
triticale (37%), and thus were classified as highly sensitive
to high temperature (Figure 5c; Table 3). The adverse effects
(% decrease from Topt) of Tmin on leaf area were most sig-
nificant in triticale (79%), and thus classified as highly sen-
sitive to low temperature (Figure 5c). Leaf area development
depends on multiple processes such as initiation of the axillary
shoot, initiation of new leaves, and leaf expansion. Generally,
extreme temperatures are known to affect the rate of leaf ini-
tiation and expansion. Sub-optimal temperatures reduce the
number of leaves due to the slowing of the rate of leaf initia-
tion and delayed cell division and elongation (Ben-Haj-Salah
& Tardieu, 1995); such events are known to decrease leaf
area and final dry weight of plants (Wijewardana et al., 2015).
Our results suggest that the leaf initiation event in cover crops
may better withstand supra-optimal temperature compared to
sub-optimal temperatures as we did not see a significant
reduction in leaf number above Topt (Figure 5b).
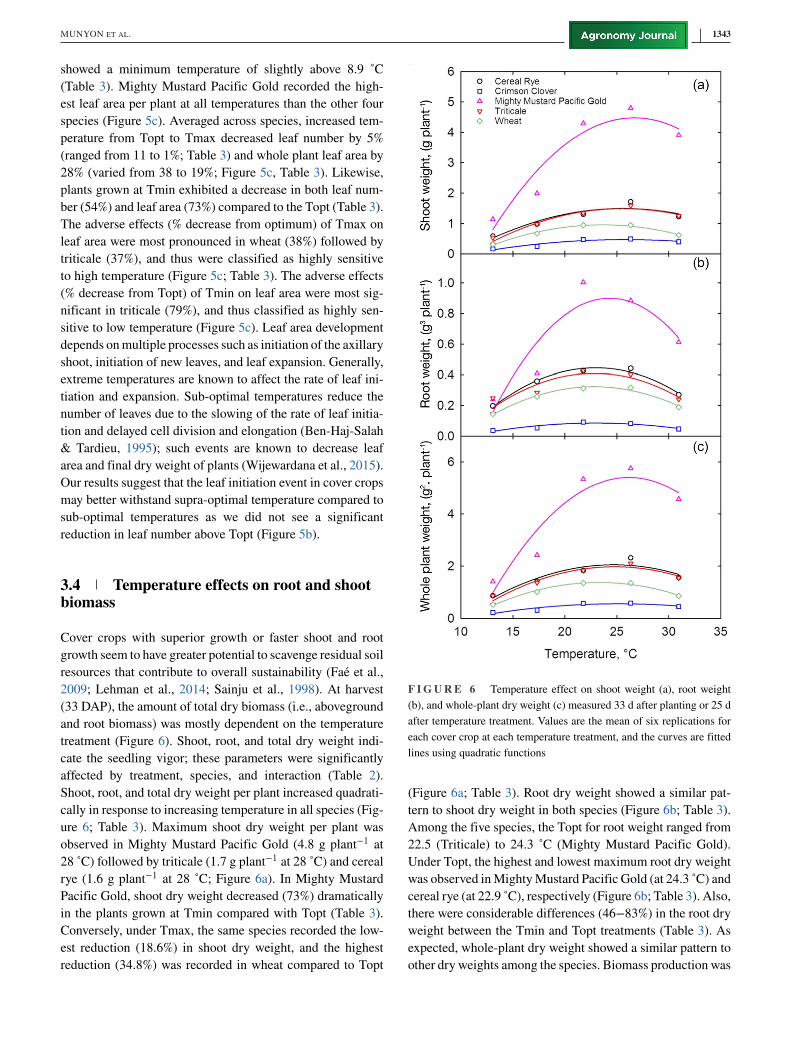
3.4 Temperature effects on root and shootbiomass
Cover crops with superior growth or faster shoot and root
growth seem to have greater potential to scavenge residual soil
resources that contribute to overall sustainability (Faé et al.,
2009; Lehman et al., 2014; Sainju et al., 1998). At harvest
(33 DAP), the amount of total dry biomass (i.e., aboveground
and root biomass) was mostly dependent on the temperature
treatment (Figure 6). Shoot, root, and total dry weight indi-
cate the seedling vigor; these parameters were significantly
affected by treatment, species, and interaction (Table 2).
Shoot, root, and total dry weight per plant increased quadrati-
cally in response to increasing temperature in all species (Fig-
ure 6; Table 3). Maximum shoot dry weight per plant was
observed in Mighty Mustard Pacific Gold (4.8 g plant−1 at
28 ˚C) followed by triticale (1.7 g plant−1 at 28 ˚C) and cereal
rye (1.6 g plant−1 at 28 ˚C; Figure 6a). In Mighty Mustard
Pacific Gold, shoot dry weight decreased (73%) dramatically
in the plants grown at Tmin compared with Topt (Table 3).
Conversely, under Tmax, the same species recorded the low-
est reduction (18.6%) in shoot dry weight, and the highest
reduction (34.8%) was recorded in wheat compared to Topt
F I G U R E 6 Temperature effect on shoot weight (a), root weight
(b), and whole-plant dry weight (c) measured 33 d after planting or 25 d
after temperature treatment. Values are the mean of six replications for
each cover crop at each temperature treatment, and the curves are fitted
lines using quadratic functions
(Figure 6a; Table 3). Root dry weight showed a similar pat-
tern to shoot dry weight in both species (Figure 6b; Table 3).
Among the five species, the Topt for root weight ranged from
22.5 (Triticale) to 24.3 ˚C (Mighty Mustard Pacific Gold).
Under Topt, the highest and lowest maximum root dry weight
was observed in Mighty Mustard Pacific Gold (at 24.3 ˚C) and
cereal rye (at 22.9 ˚C), respectively (Figure 6b; Table 3). Also,
there were considerable differences (46−83%) in the root dry
weight between the Tmin and Topt treatments (Table 3). As
expected, whole-plant dry weight showed a similar pattern to
other dry weights among the species. Biomass production was
1344 MUNYON ET AL.
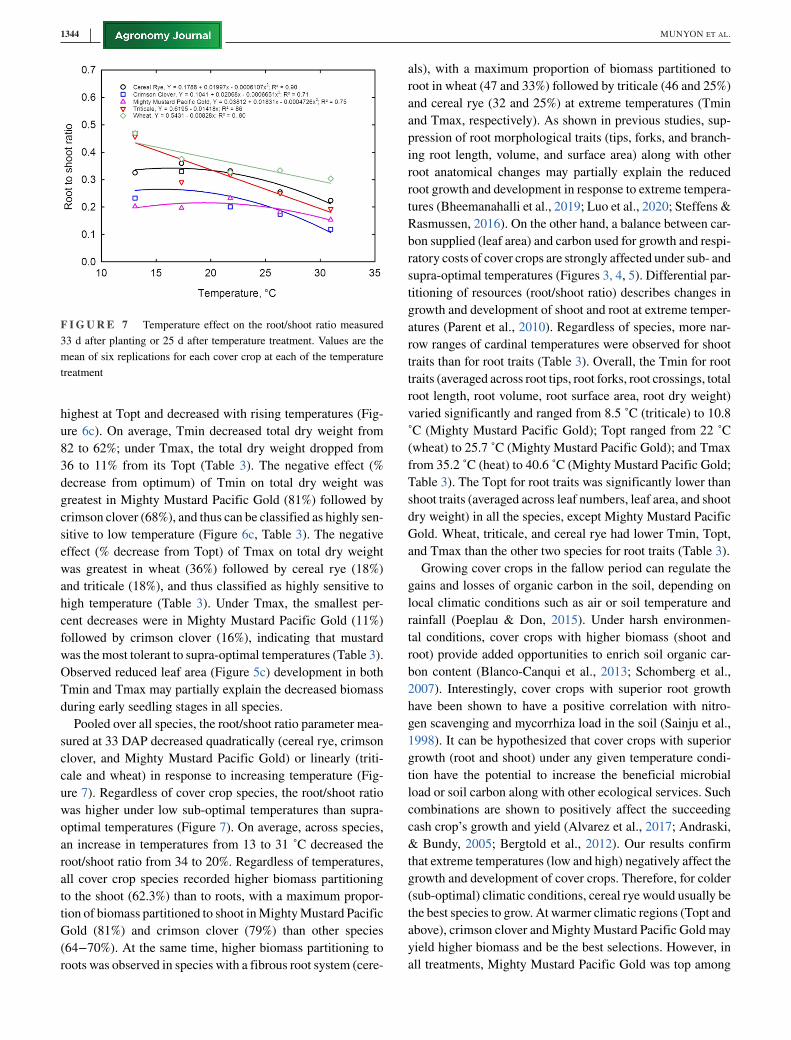
F I G U R E 7 Temperature effect on the root/shoot ratio measured
33 d after planting or 25 d after temperature treatment. Values are the
mean of six replications for each cover crop at each of the temperature
treatment
highest at Topt and decreased with rising temperatures (Fig-
ure 6c). On average, Tmin decreased total dry weight from
82 to 62%; under Tmax, the total dry weight dropped from
36 to 11% from its Topt (Table 3). The negative effect (%
decrease from optimum) of Tmin on total dry weight was
greatest in Mighty Mustard Pacific Gold (81%) followed by
crimson clover (68%), and thus can be classified as highly sen-
sitive to low temperature (Figure 6c, Table 3). The negative
effect (% decrease from Topt) of Tmax on total dry weight
was greatest in wheat (36%) followed by cereal rye (18%)
and triticale (18%), and thus classified as highly sensitive to
high temperature (Table 3). Under Tmax, the smallest per-
cent decreases were in Mighty Mustard Pacific Gold (11%)
followed by crimson clover (16%), indicating that mustard
was the most tolerant to supra-optimal temperatures (Table 3).
Observed reduced leaf area (Figure 5c) development in both
Tmin and Tmax may partially explain the decreased biomass
during early seedling stages in all species.
Pooled over all species, the root/shoot ratio parameter mea-
sured at 33 DAP decreased quadratically (cereal rye, crimson
clover, and Mighty Mustard Pacific Gold) or linearly (triti-
cale and wheat) in response to increasing temperature (Fig-
ure 7). Regardless of cover crop species, the root/shoot ratio
was higher under low sub-optimal temperatures than supra-
optimal temperatures (Figure 7). On average, across species,
an increase in temperatures from 13 to 31 ˚C decreased the
root/shoot ratio from 34 to 20%. Regardless of temperatures,
all cover crop species recorded higher biomass partitioning
to the shoot (62.3%) than to roots, with a maximum propor-
tion of biomass partitioned to shoot in Mighty Mustard Pacific
Gold (81%) and crimson clover (79%) than other species
(64−70%). At the same time, higher biomass partitioning to
roots was observed in species with a fibrous root system (cere-
als), with a maximum proportion of biomass partitioned to
root in wheat (47 and 33%) followed by triticale (46 and 25%)
and cereal rye (32 and 25%) at extreme temperatures (Tmin
and Tmax, respectively). As shown in previous studies, sup-
pression of root morphological traits (tips, forks, and branch-
ing root length, volume, and surface area) along with other
root anatomical changes may partially explain the reduced
root growth and development in response to extreme tempera-
tures (Bheemanahalli et al., 2019; Luo et al., 2020; Steffens &
Rasmussen, 2016). On the other hand, a balance between car-
bon supplied (leaf area) and carbon used for growth and respi-
ratory costs of cover crops are strongly affected under sub- and
supra-optimal temperatures (Figures 3, 4, 5). Differential par-
titioning of resources (root/shoot ratio) describes changes in
growth and development of shoot and root at extreme temper-
atures (Parent et al., 2010). Regardless of species, more nar-
row ranges of cardinal temperatures were observed for shoot
traits than for root traits (Table 3). Overall, the Tmin for root
traits (averaged across root tips, root forks, root crossings, total
root length, root volume, root surface area, root dry weight)
varied significantly and ranged from 8.5 ˚C (triticale) to 10.8
˚C (Mighty Mustard Pacific Gold); Topt ranged from 22 ˚C
(wheat) to 25.7 ˚C (Mighty Mustard Pacific Gold); and Tmax
from 35.2 ˚C (heat) to 40.6 ˚C (Mighty Mustard Pacific Gold;
Table 3). The Topt for root traits was significantly lower than
shoot traits (averaged across leaf numbers, leaf area, and shoot
dry weight) in all the species, except Mighty Mustard Pacific
Gold. Wheat, triticale, and cereal rye had lower Tmin, Topt,
and Tmax than the other two species for root traits (Table 3).
Growing cover crops in the fallow period can regulate the
gains and losses of organic carbon in the soil, depending on
local climatic conditions such as air or soil temperature and
rainfall (Poeplau & Don, 2015). Under harsh environmen-
tal conditions, cover crops with higher biomass (shoot and
root) provide added opportunities to enrich soil organic car-
bon content (Blanco-Canqui et al., 2013; Schomberg et al.,
2007). Interestingly, cover crops with superior root growth
have been shown to have a positive correlation with nitro-
gen scavenging and mycorrhiza load in the soil (Sainju et al.,
1998). It can be hypothesized that cover crops with superior
growth (root and shoot) under any given temperature condi-
tion have the potential to increase the beneficial microbial
load or soil carbon along with other ecological services. Such
combinations are shown to positively affect the succeeding
cash crop’s growth and yield (Alvarez et al., 2017; Andraski,
& Bundy, 2005; Bergtold et al., 2012). Our results confirm
that extreme temperatures (low and high) negatively affect the
growth and development of cover crops. Therefore, for colder
(sub-optimal) climatic conditions, cereal rye would usually be
the best species to grow. At warmer climatic regions (Topt and
above), crimson clover and Mighty Mustard Pacific Gold may
yield higher biomass and be the best selections. However, in
all treatments, Mighty Mustard Pacific Gold was top among

MUNYON ET AL. 1345
the five species in root and shoot growth. With the results pre-
sented here, a producer could choose potential species to grow
based on local climatic conditions.
4 CONCLUSIONS
Our results demonstrated different cardinal temperature
requirements for the growth and development of several cover
crop species. Our study suggests that cover crops’ character-
ization for root and shoot traits could be used as potential
parameters to quantify sub- and supra-optimal temperature
tolerance of cover crops. As we tested different species with
the same range of temperatures, the identified cardinal tem-
peratures for growth and development traits can be used in
crop models to simulate the crop species’ biomass production
under different climatic conditions. The study aids in select-
ing mixes of cover crops with the same temperature range
to plant at the same climatic conditions during fallow peri-
ods. However, the wide range of cardinal temperatures of the
studied species, cereal rye and Mighty Mustard Pacific Gold
seems to have consistently exhibited superior shoot and root
traits at Topt. As a result, these two species could provide
better ecological services by rapidly acquiring resources after
sowing and establishing aerial cover faster than other species.
The characteristic changes in shoot and root morphology in
response to extreme temperatures are likely associated with
the disruption of physiological and biochemical processes.
Thus, we suggest that future studies primarily address the
thermal limits of enzymes involved in carbohydrate metabo-
lites to clarify the biochemical puzzle.
A C K N O W L E D G M E N T SWe thank David Brand for technical assistance and graduate
students of the Environmental Plant Physiology Lab at Mis-
sissippi State University for their support during data collec-
tion. We would also like to thank Green Cover Seed (Bladen,
NE) for donating the seeds used for this study. This article
is a contribution from the Department of Plant and Soil Sci-
ences, Mississippi State University, Mississippi Agricultural,
and Forestry Experiment Station. Mention of trade names or
commercial products in this publication is solely to provide
specific information and does not imply recommendation or
endorsement by the United States Department of Agriculture
(USDA). The USDA is an equal opportunity provider and
employer. The National Institute of Food and Agriculture-
2019-34263-30552, USDA-Agricultural Research Service
(USDA-ARS)- 58-6064-9-007, and MIS 043050 funded this
research.
C O N F L I C T O F I N T E R E S TThe authors report no conflict of interest.
O R C I DJay W. Munyon https://orcid.org/0000-0002-8855-6104
Raju Bheemanahalli https://orcid.org/0000-0002-9325-
4901
K. Raja Reddy https://orcid.org/0000-0002-7906-7755
R E F E R E N C E SAgati, G., & Tattini, M. (2010). Multiple functional roles of flavonoids
in photoprotection. The New Phytologist, 186, 786–793. https://doi.
org/10.1111/j.1469-8137.2010.03269.x
Aidoo, M. K., Bdolach, E., Fait, A., Lazarovitch, N., & Rachmilevitch,
S. (2016). Tolerance to high soil temperature in foxtail millet (Setaria
italica L.) is related to shoot and root growth and metabolism. PlantPhysiology and Biochemistry, 106, 73–81. https://doi.org/10.1016/j.
plaphy.2016.04.038
Allen, L. H., Boote, K. J., Jones, J. W., Jones, P. H., Pickering, N. B.,
Baker, J. T., . . . Prasad, P. V. V. (2020). Sunlit, controlled-environment
chambers are essential for comparing plant responses to various cli-
mates. Agronomy Journal, 112, 4531–4549. https://doi.org/10.1002/
agj2.20428
Alvarez, R., Steinbach, H. S., & De Paepe, J. L. (2017). Cover crop
effects on soils and subsequent crops in the pampas: A meta-analysis.
Soil and Tillage Research, 170, 53–65. https://doi.org/10.1016/j.still.
2017.03.005
Andraski, T. W., & Bundy, L. G. (2005). Cover crop effects on corn yield
response to nitrogen on an irrigated sandy soil. Agronomy Journal, 97,
1239–1244. https://doi.org/10.2134/agronj2005.0052
Bergtold, J. S., Duffy, P. A., Hite, D., & Raper, R. L. (2012). Demo-
graphic and management factors affecting the adoption and perceived
yield benefit of winter cover crops in the southeast. Journal of Agri-cultural and Applied Economics, 44, 99–116. https://doi.org/10.1017/
s1074070800000195
Ali, I. E. A., Kafkafi, U., Yamaguchi, I., Sugimoto, Y., & Inanaga, S.
(1998). Response of oilseed rape plant to low root temperature and
nitrate: Ammonium ratios. Journal of Plant Nutrition, 21, 1463–1481.
https://doi.org/10.1080/01904169809365496
Austin, E. E., Wickings, K., McDaniel, M. D., Robertson, G. P., &
Grandy, A. S. (2017). Cover crop root contributions to soil carbon in
a no-till corn bioenergy cropping system. GCB Bioenergy, 9, 1252–
1263. https://doi.org/10.1111/gcbb.12428
Bardgett, R. D., Mommer, L., & De Vries, F. T. (2014). Going under-
ground: Root traits as drivers of ecosystem processes. Trends in Ecol-ogy & Evolution, 29, 692–699. https://doi.org/10.1016/j.tree.2014.10.
006
Ben-Haj-Salah, H., & Tardieu, F. (1995). Temperature affects expan-
sion rate of maize leaves without change in spatial distribution of
cell length (analysis of the coordination between cell division and cell
expansion). Plant Physiology, 109, 861–870. https://doi.org/10.1104/
pp.109.3.861
Bheemanahalli, R., Hechanova, S., Kshirod, J. K., & Jagadish, S. K.
(2019). Root anatomical traits of wild-rices reveal links between
flooded rice and dryland sorghum. Plant Physiology Reports, 24,
155–167. https://doi.org/10.1007/s40502-019-00451-1
Blanco-Canqui, H., Shapiro, C. A., Wortmann, C. S., Drijber, R. A.,
Mamo, M., Shaver, T. M., & Ferguson, R. B. (2013). Soil organic
carbon: The value to soil properties. Journal of Soil and Water Con-servation, 68, 129A–134A. https://doi.org/10.2489/jswc.68.5.129a

1346 MUNYON ET AL.
Blanco-Canqui, H., Ferguson, R. B., Jin, V. L., Schmer, M. R., Wien-
hold, B. J., & Tatarko, J. (2014). Can cover crop and manure maintain
soil properties after stover removal from irrigated no-till corn?. SoilScience Society of America Journal, 78, 1368–1377. https://doi.org/
10.2136/sssaj2013.12.0550
Boese, S. R., & Huner, N. P. (1990). Effect of growth temper-
ature and temperature shifts on spinach leaf morphology and
photosynthesis. Plant Physiology, 94, 1830–1836. https://doi.org/10.
1104/pp.94.4.1830
Calleja-Cabrera, J., Boter, M., Oñate-Sánchez, L., & Pernas, M. (2020).
Root growth adaptation to climate change in crops. Frontiers in PlantScience, 11. https://doi.org/10.3389/fpls.2020.00544
Clark, A. (2015). Cover crops for sustainable crop rotations. SARE.
Retrieved from https://www.sare.org/resources/cover-crops/
Costa, C., Dwyer, L. M., Zhou, X., Dutilleul, P., Hamel, C., Reid, L.
M., & Smith, D. L. (2002). Root morphology of contrasting maize
genotypes. Agronomy Journal, 94, 96–101. https://doi.org/10.2134/
agronj2002.0096
Cresswell, H. P., & Kirkegaard, J. A. (1995). Subsoil amelioration by
plant-roots-the process and the evidence. Soil Research, 33, 221–239.
https://doi.org/10.1071/sr9950221
Dabney, S. M., Delgado, J. A., & Reeves, D. W. (2001). Using winter
cover crops to improve soil and water quality. Communications in SoilScience and Plant Analysis, 32, 1221–1250. https://doi.org/10.1081/
css-100104110
Faé, G. S., Sulc, R. M., Barker, D. J., Dick, R. P., Eastridge, M. L., &
Lorenz, N. (2009). Integrating winter annual forages into a no-till corn
silage system. Agronomy Journal, 101, 1286–1296. https://doi.org/10.
2134/agronj2009.0144
Fageria, N. K., Baligar, V. C., & Bailey, B. A. (2005). Role of cover crops
in improving soil and row crop productivity. Communications in soilscience and plant analysis, 36, 2733–2757. https://doi.org/10.1080/
00103620500303939
Fatichi, S., Leuzinger, S., & Körner, C. (2014). Moving beyond pho-
tosynthesis: From carbon source to sink-driven vegetation modeling.
New Phytologist, 201, 1086–1095. https://doi.org/10.1111/nph.12614
Feierabend, J. (1977). Capacity for chlorophyll synthesis in heat-
bleached 70S ribosome-deficient rye leaves. Planta, 135, 83–88.
https://doi.org/10.1007/bf00387980
Francis, D., & Barlow, P. W. (1988). Temperature and the cell cycle.
Symposia of the Society for Experimental Biology, 42, 181–201.
Gray, S. B., & Brady, S. M. (2016). Plant developmental responses to
climate change. Developmental Biology, 419, 64–77. https://doi.org/
10.1016/j.ydbio.2016.07.023
Hammer, G. L., Dong, Z., McLean, G., Doherty, A., Messina, C.,
Schussler, J., . . . Cooper, M. (2009). Can changes in canopy and/or
root system architecture explain historical maize yield trends in the
US corn belt? Crop Science, 49, 299–312. https://doi.org/10.2135/
cropsci2008.03.0152
Hewitt, E. J. (1952). Sand and water culture methods used in the studyof plant nutrition. Bucks, England: Commonwealth Bureau of Hor-
ticulture and Plantation Crops, Commonwealth Agriculture Bureau
Farnham Royal.
Huang, B. (1991). Wheat root morphology, root anatomy, and hydraulicconductivity as affected by temperature (Doctoral dissertation). Lub-
bock, TX: Texas Tech University.
Jaakola, L., & Hohtola, A. (2010). Effect of latitude on flavonoid biosyn-
thesis in plants. Plant, Cell & Environment, 33, 1239–1247. https:
//doi.org/10.1111/j.1365-3040.2010.02154.x
Justes, E., Mary, B., & Nicolardot, B. (2009). Quantifying and modelling
C and N mineralization kinetics of catch crop residues in soil: Param-
eterization of the residue decomposition module of STICS model
for mature and non mature residues. Plant and Soil, 325, 171–185.
https://doi.org/10.1007/s11104-009-9966-4
Kristensen, H. L., & Thorup-Kristensen, K. (2004). Root growth and
nitrate uptake of three different catch crops in deep soil layers. SoilScience Society of America Journal, 68, 529–537. https://doi.org/10.
2136/sssaj2004.5290
Lehman, R. M., Ducey, T. F., Jin, V. L., Acosta-Martinez, V.,
Ahlschwede, C. M., Jeske, E. S., . . . Varvel, G. E. (2014). Soil micro-
bial community response to corn stover harvesting under rain-fed, no-
till conditions at multiple US locations. BioEnergy Research, 7, 540–
550. https://doi.org/10.1007/s12155-014-9417-9
Li, H., Wang, F., Chen, X. J., Shi, K., Xia, X. J., Considine, M. J.,
Yu, J. Q., & Zhou, Y. H. (2014). The sub/supra-optimal temperature-
induced inhibition of photosynthesis and oxidative damage in cucum-
ber leaves are alleviated by grafting onto figleaf gourd/luffa root-
stocks. Physiologia Plantarum, 152, 571–584. https://doi.org/10.
1111/ppl.12200
Li, J., Zhang, F., Qian, X., Zhu, Y., & Shen, G. (2015). Quantifica-
tion of rice canopy nitrogen balance index with digital imagery from
unmanned aerial vehicle. Remote Sensing Letters, 6, 183–189. https:
//doi.org/10.1080/2150704x.2015.1021934
Liang, X. Z., Xu, M., Gao, W., Reddy, K. R., Kunkel, K., Schmoldt, D.
L., & Samel, A. N. (2012). Physical modeling of US cotton yields and
climate stresses during 1979 to 2005. Agronomy Journal, 104, 675–
683. https://doi.org/10.2134/agronj2011.0251
Liu, M., Li, X., Liu, Y., & Cao, B. (2013). Regulation of flavanone 3-
hydroxylase gene involved in the flavonoid biosynthesis pathway in
response to UV-B radiation and drought stress in the desert plant,
Reaumuria soongorica. Plant Physiology and Biochemistry, 73, 161–
167. https://doi.org/10.1016/j.plaphy.2013.09.016
Luo, H., Xu, H., Chu, C., He, F., & Fang, S. (2020). High temperature can
change root system architecture and intensify root interactions of plant
seedlings. Frontiers in Plant Science, 11. https://doi.org/10.3389/fpls.
2020.00160
Luo, Q. (2011). Temperature thresholds and crop production: A review.
Climatic Change, 109, 583–598. https://doi.org/10.1007/s10584-
011-0028-6
Lynch, J. P., & Clair, S. B. S. (2004). Mineral stress: The missing link
in understanding how global climate change will affect plants in real
world soils. Field Crops Research, 90, 101–115. https://doi.org/10.
1016/j.fcr.2004.07.008
Ma, D., Sun, D., Wang, C., Li, Y., & Guo, T. (2014). Expression
of flavonoid biosynthesis genes and accumulation of flavonoid in
wheat leaves in response to drought stress. Plant Physiology andBiochemistry, 80, 60–66. https://doi.org/10.1016/j.plaphy.2014.03.
024
Morales, D., Rodríguez, P., Dell’Amico, J., Nicolas, E., Torrecillas, A.,
& Sánchez-Blanco, M. J. (2003). High-temperature preconditioning
and thermal shock imposition affects water relations, gas exchange
and root hydraulic conductivity in tomato. Biologia Plantarum, 47.
https://doi.org/10.1023/b:bIop.0000022252.70836.fc
Murray, F. W. (1967). On the computation of saturation vapor pressure.
Journal of Applied Meteorology, 6, 203–204.
Nagai, T., & Makino, A. (2009). Differences between rice and wheat in
temperature responses of photosynthesis and plant growth. Plant andCell Physiology, 50, 744–755. https://doi.org/10.1093/pcp/pcp029
MUNYON ET AL. 1347
Nagel, K. A., Kastenholz, B., Jahnke, S., Van Dusschoten, D., Aach, T.,
Mühlich, M., . . . Schurr, U. (2009). Temperature responses of roots:
Impact on growth, root system architecture and implications for phe-
notyping. Functional Plant Biology, 36, 947–959. https://doi.org/10.
1071/fp09184
Nevins, C. J., Lacey, C., & Armstrong, S. (2020). The synchrony of cover
crop decomposition, enzyme activity, and nitrogen availability in a
corn agroecosystem in the Midwest United States. Soil and TillageResearch, 197. https://doi.org/10.1016/j.still.2019.104518
Parent, B., Turc, O., Gibon, Y., Stitt, M., & Tardieu, F. (2010). Mod-
elling temperature-compensated physiological rates, based on the co-
ordination of responses to temperature of developmental processes.
Journal of Experimental Botany, 61, 2057–2069. https://doi.org/10.
1093/jxb/erq003
Poeplau, C., & Don, A. (2015). Carbon sequestration in agricultural soils
via cultivation of cover crops-A meta-analysis. Agriculture, Ecosys-tems and Environment, 200, 33–41. https://doi.org/10.1016/j.agee.
2014.10.024
Reddy, K. R., Read, J. J., & McKinion, J. M. (2001). Soil-Plant-
Atmosphere-Research (SPAR) facility: A tool for plant research and
modeling. Biotronics, 30, 27–50.
Reddy, K. R., Reddy, V. R., & Hodges, H. F. (1992). Temper-
ature effects on early season cotton growth and development.
Agronomy Journal, 84, 229–237. https://doi.org/10.2134/agronj1992.
00021962008400020021x
Reddy, K. R., Hodges, H. F., & McKinion, J. M. (1993). Temperature
effects on Pima cotton leaf growth. Agronomy Journal, 85, 681–686.
https://doi.org/10.2134/agronj1993.00021962008500030030x
Reddy, K. R., Hodges, H. F., & McKinion, J. M. (1997a). Mod-
eling temperature effects on cotton internode and leaf growth.
Crop Science, 3, 503–509. https://doi.org/10.2135/cropsci1997.
0011183x003700020032x
Reddy, K. R., Hodges, H. F., & McKinion, J. M. (1997b). Crop modeling
and applications: A cotton example. Advances in Agronomy, 59, 225–
290. https://doi.org/10.1016/s0065-2113(08)60056-5
Reddy, K. R., Brand, D., Wijewardana, C., & Gao, W. (2017). Tem-
perature effects on cotton seedling emergence, growth, and develop-
ment. Agronomy Journal, 109, 1379–1387. https://doi.org/10.2134/
agronj2016.07.0439
Rosolem, C. A., Foloni, J. S. S., & Tiritan, C. S. (2002). Root growth
and nutrient accumulation in cover crops as affected by soil com-
paction. Soil and Tillage Research, 65, 109–115. https://doi.org/10.
1016/s0167-1987(01)00286-0
Sainju, U. M., Singh, B. P., & Whitehead, W. F. (1998). Cover
crop root distribution and its effects on soil nitrogen cycling.
Agronomy Journal, 90, 511–518. https://doi.org/10.2134/agronj1998.
00021962009000040012x
Schomberg, H. H., Martini, N. L., Diaz-Perez, J. C., Phatak, S. C., Balk-
com, K. S., & Bhardwaj, H. L. (2007). Potential for using sunn hemp
as a source of biomass and nitrogen for the Piedmont and Coastal Plain
regions of the southeastern USA. Agronomy Journal, 99, 1448–1457.
https://doi.org/10.2134/agronj2006.0294
Seepaul, R., Macoon, B., Reddy, K. R., & Baldwin, B. (2011). Screening
switchgrass (Panicum virgatum L.) genotypes for temperature toler-
ance via in vitro seed germination assay. American Journal of PlantSciences, 2, 134–147. https://doi.org/10.4236/ajps.2011.22015
Sievers, T., & Cook, R. L. (2018). Aboveground and root decomposition
of cereal rye and hairy vetch cover crops. Soil Science Society of Amer-ica Journal, 82, 147–155. https://doi.org/10.2136/sssaj2017.05.0139
Singh, G., Williard, K. W., & Schoonover, J. E. (2018). Cover crops and
tillage influence on nitrogen dynamics in plant-soil-water pools. SoilScience Society of America Journal, 82, 1572–1582. https://doi.org/
10.2136/sssaj2018.03.0111
Steffens, B., & Rasmussen, A. (2016). The physiology of adventitious
roots. Plant physiology, 170, 603–617. https://doi.org/10.1104/pp.15.
01360
Stone, J. A., & Taylor, H. M. (1983). Temperature and the Develop-
ment of the Taproot and Lateral Roots of Four Indeterminate Soybean
Cultivars 1. Agronomy journal, 75, 613–618. https://doi.org/10.2134/
agronj1983.00021962007500040010x
Tonitto, C., David, M. B., & Drinkwater, L. E. (2006). Replacing bare
fallows with cover crops in fertilizer-intensive cropping systems: A
meta-analysis of crop yield and N dynamics. Agriculture, Ecosystems& Environment, 112, 58–72. https://doi.org/10.1016/j.agee.2005.07.
003
Tribouillois, H., Dürr, C., Demilly, D., Wagner, M. H., & Justes, E.
(2016). Determination of germination response to temperature and
water potential for a wide range of cover crop species and related func-
tional groups. Plos One, 11. https://doi.org/10.1371/journal.pone.
0161185
Urban, M. C. (2015). Accelerating extinction risk from climate change.
Science, 348, 571–573. https://doi.org/10.1126/science.aaa4984
Varney, G. T., McCully, M. E., & Canny, M. J. (1993). Sites of entry of
water into the symplast of maize roots. New Phytologist, 125, 733–
741. https://doi.org/10.1111/j.1469-8137.1993.tb03922.x
Walter, A., Feil, R., & Schurr, U. (2003). Expansion dynamics, metabo-
lite composition and substance transfer of the primary root growth
zone of Zea mays L. grown in different external nutrient availabili-
ties. Plant, Cell and Environment, 26, 1451–1466. https://doi.org/10.
1046/j.0016-8025.2003.01068.x
Walter, A., Silk, W. K., & Schurr, U. (2009). Environmental effects
on spatial and temporal patterns of leaf and root growth. AnnualReview of Plant Biology, 60, 279–304. https://doi.org/10.1146/
annurev.arplant.59.032607.092819
Weil, R., & Kremen, A. (2007). Thinking across and beyond disciplines
to make cover crops pay. Journal of the Science of Food and Agricul-ture, 87, 551–557. https://doi.org/10.1002/jsfa.2742
Wheeler, T. R., Craufurd, P. Q., Ellis, R. H., Porter, J. R., & Prasad,
P. V. (2000). Temperature variability and the yield of annual crops.
Agriculture, Ecosystems and Environment, 82, 159–167. https://doi.
org/10.1016/s0167-8809(00)00224-3
Wienhold, B. J., Vigil, M. F., Hendrickson, J. R., & Derner, J. D. (2018).
Vulnerability of crops and croplands in the US Northern Plains to
predicted climate change. Climatic Change, 146, 219–230. https://doi.
org/10.1007/s10584-017-1989-x
Wijewardana, C., Hock, M., Henry, B., & Reddy, K. R. (2015). Screening
corn hybrids for cold tolerance using morphological traits for early-
season seeding. Crop Science, 55, 851–867. https://doi.org/10.2135/
cropsci2014.07.0487
Yuan, Y., Liu, Y., Wu, C., Chen, S., Wang, Z., Yang, Z., Qin, S., & Huang,
L. (2012). Water deficit affected flavonoid accumulation by regulat-
ing hormone metabolism in Scutellaria baicalensis Georgi roots. PlosOne, 7. https://doi.org/10.1371/journal.pone.0042946
Zhu, J., Ingram, P. A., Benfey, P. N., & Elich, T. (2011). From lab to
field, new approaches to phenotyping root system architecture. Cur-rent Opinion in Plant Biology, 14, 310–317. https://doi.org/10.1016/
j.pbi.2011.03.020

1348 MUNYON ET AL.
Zhukovskaya, N. V., Bystrova, E. I., Dubrovsky, J. G., & Ivanov, V.
B. (2018). Global analysis of an exponential model of cell prolifer-
ation for estimation of cell cycle duration in the root apical meristem
of angiosperms. Annals of Botany, 122, 811–822. https://doi.org/10.
1086/297487
How to cite this article: Munyon JW, Bheemanahalli
R, Walne CH, Raja Reddy K. Developing functional
relationships between temperature and cover crop
species vegetative growth and development.
Agronomy Journal. 2021;113:1−16.
https://doi.org/10.1002/agj2.20537