developing dystopia: manila, from colonial to post-colonial city in crisis
DESCRIPTION
This paper is intended as Chapter 4 to the forthcoming book preliminarily entitled, " Urban Dystopia Made in Manila, From Colonial to Post-Colonial City in Crisis" (Third Eye Publishers, forthcoming, Fall 2011). The text embodied in this chapter plots and analyses the structural genesis of post-colonial urban crisis in metropolitan Manila. Said text should, in the event of excerpts, accordingly be considered as work in progress. Eventual changes and reformulations will appear in its finality in said forthcoming book.TRANSCRIPT

Chapter 4
City and Crisis - Convolution in the Post-Colonial City
Post-war metropolitan Manila’s transformation into a veritable mega-city underscores
on the one hand its historical role as key urban axis and locus of dependent capitalist
accumulation and the hyper-magnification of the convolution and contradictions
generated by dependency, on the other. In the following sections we will sketch the
contours of convolution across demographic, spatial, ecological and social dimensions
of the urban landscape, as it unravelled in spectacular fashion after de-colonisation.
Spatial and Demographic Convolution
Far eclipsing population and primacy indices given for the urban centres in the
Philippines, Manila’s explosive post-war growth portrays the spatial convolutions of
Third World urbanisation. Its aggregate population in 1975 was more than 10 times that
of the country’s second largest city, or four times that of the combined total of the next
three major cities. The capital continues to provide “one of the most extreme cases” of
urban primacy in the world. Occupying less than 1% of the total land area, Manila holds
12% of the national population, placing it among the most primate cities in the Third
World, surpassed only by those of Argentina, Venezuela, Peru, Egypt, Senegal, Taiwan,
Hongkong, South Korea, Colombia and Iran.
Using the percentage of the national urban population residing in the principal
city, Manila’s dominance is even more prominently revealed, ranking sith among Third
World capitals. If the largest city population is contrasted to the sum of the population

2
of the next three largest cities in a country, Manila would rank third behind Hongkong
and Lima.1
Whereas longitudinal data on urbanisation level (% population in urban areas)
and tempo (urban-rural growth rate differentials) for the whole country generally
suggest a sluggish and slackening pattern (27-33.4% or 1/3 of the national total, and 3-
1.46 respectively between 1948-1975, albeit respective increments of 3.9% and 2 had
been noted in 1980), the metropolitan share of the total urban population had been
invariably substantial and accounted for a stable increase over time (30.3-37.4% during
the same period slightly tapering off to 33% in 1980, see Table 1 & 2 below). Moreover,
Manila had surpassed all other regions in terms of being the first and only are to
completely urbanise in 1970 to almost 6 million in 1980, and with a growth rate of 3.6
per annum, it is expected to double in roughly 27 years.2
Extreme conurbation and congestion of metropolitan landscape chaperons the
explosive population phenomenon. While the average national population density was
pegged at 161 persons sq km, an staggering metropolitan ratio of 9,317 persons per sq
km overshot national figures by 58 times in 1980.3 The corollary impact of conurbation
and population on urban ecology is as predictable as it is disproportionately distributed
intra-city-wise, and will be the subject of elaboration further on.
Decomposing census data on urban growth into its components (i.e. natural
increase of urban population, in-migration rates and changes related to territorial re-
classifications), a study in urban demography establishes the significant weight that net-
migrational movements exert on Manila’s incremental expansion across time. As a
proportion of metropolitan growth from 1903-1939, average net migration was 33.4%,

3
jumping to a peak of 50.7% between 1939-1960, and receding slightly to a substantial
41.9% during the intervening decade.4
More recent data5 from official quarters tend to reaffirm the axiom, estimating
the National Capital Region (= Greater Manila area) to have had the highest in-
migration rate in 1985. However, the general picture elsewhere appears to be more
complex. While about a third of the overall movements between 1965-1970 sorted under
the rural to urban category, about 26% of the moves were in fact urban to urban, nearly
24% were rural to rural, and roughly 17% urban to rural, the latter indicating the
occurrence of return migration.6
Among the important propellants behind the intermittent influx of rural labour
to the capital and inter-regional differentials in urbanisation often summoned in
demographic and the critical literature are: postwar development strategies resulting
in unbalanced capital-intensive, import-dependent and urban-biassed industrialisation;
highly skewed income and property ownership structures in the rural hinterland and
relatively high urban wage rates; accelerating
Table 1Levels & Tempo of Urbanisation
Census Years, 1903-1980
Census year Level of urbanisation* Tempo (urbanisation)**
1903 13.1 ---
1918 12.5 -0.32
1939 21.6 3.36
1948 27.0 3.09
1960 29.8 1.27
1970*** 32.9 1.45

Table 1Levels & Tempo of Urbanisation
Census Years, 1903-1980
4
1975 33.4 1.46¤
1980 37.3 3.54
*percent in urban areas. The 1963 urban definition was used for census prior to 1975.The 1970 definition was applied fin the 1975 and subsequent censuses.**difference between urban and rural growth rates.***1963 urban definition was used in both 1960 and 1970 census data for compatibility.If the 1970 definition is applied to the 1970 data, the level of urbanisation is 31.8 insteadof 32.9%.¤Initial 1975 population figures were based on the 1970 definition.Note: For the 1963 and 1970 urban definitions, see e.g. Callanta, 1988: 100-01; Pernia &Paderanga, 1980: 44-43; UNICEF, 1986: 66-67.Source: UNICEF, 1986, Table 2: 5 (cf Pernia & Paderanga, 1980: Table 1)
Table 2Metropolitan Manila: Level of urbanisation, urban population,percentage of national urban population, annual growth rate, &
population density1948-1980
Year Level*%
Urban pop.(000)
% Nationalurban pop.
Annualgrowth rate
Densitypers/sq km
1948 97.1 1,569.1 30.3 5.5 2,467.2
1960 98.1 2,426.5 30.5 3.8 3,871.8
1970 100.0 3,966.6 34.0 4.9 6,236.9
1975 100.0 4,970.0 37.4 4.6 7,814.5
1980 100.0 5,925.9 33.0 3.6 9,317.4
*level of urbanisation as defined by Pernia (see Pernia in Caoili, 1988:3) is the proportion(%) of the population living in urban places (the 1963 definition of urban used in censussurveys was redefined in 1970). Metropolitan Manila as used here embraces four citiesand thirteen municipalities, administratively integrated by Presidential Decree 824under the auspices of the Metropolitan Manila Commission in 1975, and covers an areaof 636 sq km.Note: Absolute aggregate data for national as well as rural and urban for the aboveperiods can be found in Table 3 as indicated in the source below.Sources: UNICEF (1986), Table 4: 7; Pernia & Paderanga (1980), Table 3.

5
commercialisation, land concentration and displacement of rural labour; and most
recently, dislocations as a result of massive counter-insurgency military operations in
the countryside.7
The Ecology of Convolution - Squatters in the Shanty-“Townships”
The penalties imposed by the tremendous postwar population growth and heavy in-
migration on urban ecology are most vividly reliefed in the proliferation of slum
settlements and shantytowns at the margins of the metropolitan landscape. It must be
pointed out, however, that these penalties have been unequally distributed over space,
the variations of which are, as we shall later demonstrate, essentially contingent upon
class-specific factors and manifest the growing inability of the formal urban sector to
accommodate large segments of urban and displaced rural labour.
Postwar suburban development in the metropolis summarizes and hyper-
contrasts inter-class and inter-household variances in urban living standards,
reincarnating images of “apartheid” in terms of the increasing residential segregation
of the urban elite in exclusive subdivisions with, on the one hand, living standards on
par with western counterparts, and the city poor condemned to sub-human standards,
congestion and blight in bourgeoning squatter and shanty-“townships” mostly located
on illegally occupied land, on the other.
Immediately after the war, squatter and spontaneous settlements mushroomed
in the city’s waterfront and harbour districts and in Intramuros (the original fortress
wall of the colonial city) with an estimated population of 26,000 in 1946. These early
squatters were composed mostly of rural migrants from the distant Visayas and

6
adjacent rice-growing Central Plains. In the 50s, 93,000 squatters settled on marginal
urban swamplands, along estuaries, on idle public land, or inactive streets, railroad
lines and disputed private lands, with the squatter population merely keeping in pace
with the city’s overall growth. By mid-60s their ranks had already swelled to a
staggering 700,000. In the early 1970s, slum and squatter growth captured almost 30%
(1.3 million) of the capital’s total population (3.7 million),8 a percentage which would
be carried over throughout the next decade.
Official data in 1985 approximated a squatter population of over 1.9 million for
Metropolitan Manila (28% of total metropolitan population) and over 3 million more
in other major cities of the Philippines, climbing to 2.2 and 5 million respectively two
years after. Dispersed in 415 colonies, 60% of which occupy public lands all over the city
and populated by over a fourth of the metropolitan population, 9 these settlements vary
in size and density from super-conurbations in the Tondo Foreshore-land Area, reputed
to be Southeast Asia’s largest slum, to mini-squatter communities with more scattered
occupancy patterns dotting the urban landscape.
-------------------- Map of Manila----------------------------------------------
Intra-city disparities in ecology denoted by pronounced variations in density, are
eloquently elucidated by Caoili (1988) employing 1975 statistics.10 During that year,
there were 7,500 persons per sq km in Metropolitan Manila versus the national average
of 140. Among its 17 metropolitan units (i.e. 4 cities and 13 municipalities), population

7
densities varied considerably with Manila (see Fig. 1) and Navotas having over 37,000
respectively versus Muntinlupa with the lowest density of 1,968. Within the city of
Manila, the density among the districts in 1970 ranged from the highest estimates at
over 50,000 to the lowest at 98. The Tondo Foreshore-land Area alone had a population
of 160,000, which was 37% of the Tondo district’s share and about 12% of the city’s total.
Density there was 120,000 per sq km, more than three times the city’s average in 1970.
Teasing out the class dimension of density variances, another comparison reported:11
“Tondo, the biggest slum in Southeast Asia, had a density of 57,745
inhabitants per sq km in 1975. While the average for Metropolitan Manila
was “only” 9,316, more than 6 times as dense. The new elite parts of the city
like Forbes Park and Dasmarinas village (with average plots of 2,500 sq m)
on the other hand, have densities of about 2,000 inhabitants per sq km or less
(author’s observation at 1985 (sic.)). This means a ratio of almost 30 to 1
population density between the richest and poorest parts of the city.”
The Urban Dilemma of Dependency- Travails of the Urbanisation-Industrialisation Equation
Regional Distortions: A Spatial Satire
Postwar town and country development, following the twisting dynamics of
dependency and industrialisation strategies gone haywire, are spatially satirised in
terms of pervasive and acute inter-regional disequilibrium and super-agglomeration of
economic resources in the metropolitan capital.
Both in the degree and magnitude of physical and spatial concentration of
industrial, financial, commercial capital and social infra-structure, post-colonial Manila

8
would undoubtedly qualify as the country’s “capital city of capital.”
In terms of population, total output (gross regional domestic product, GRDP)
and per capita output per region in 1975, Metro-Manila with 12.3% of the national
population contributed 35% of total output. Its per capita output was the highest among
the 12 regions,, beating the national average almost thrice. With token deviation, this
record would be vindicated with stability well into the 80s.12
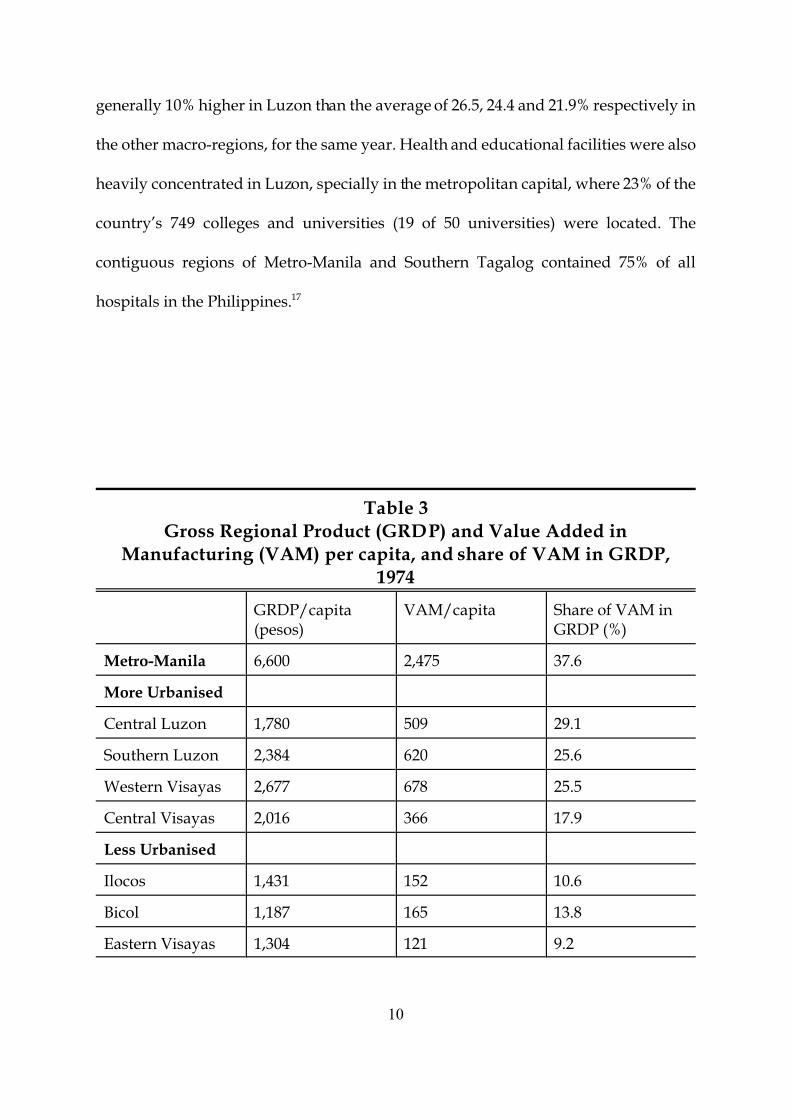
Manufacturing, a key factor in the relatively high metropolitan GRDP, accounted
for 37.6% of total city output in 1974. Cross-regional comparisons (Pernia & Paderanga,
1980) indulging data on manufacturing establishments, employment and value added
for 1956 and 1974, fortify Manila and its adjoining regions’ reputation as solo
stronghold and prime locus of industrial capital and wage labour. Over this long
interval, spanning across the entire ISI into the infant years of the EOI period, relative
shares in economic activity remained roughly stable, with the combined regions of
Metro-Manila and Southern Tagalog claiming the lion’s share (varying within the range
of 60-70% of national total at given intervals on all three counts) and the more urbanised
category coming a far second. Notably, metropolitan output per capita was more than
twice the highest in the more urbanised cluster, and four times that of the lowest
registered output in the less urbanised bracket. (See Tables 3 and 4 below)
Detailed sectoral gross value added (GVA) breakdowns in 1974, similarly
communicated the tenor of titanism couched in the same jargon of spatial and physical
over-concentration of capital and wage labour in other secondary and tertiary industries
(Caoili, 1988), where metropolitan share of the national total - in construction (39%),
electricity, gas and water (72%), transport, communication and storage (56%), commerce

9
(39%), and services (56%) - overshadowed all other regions. In terms of large
establishments and the corresponding wage-employment they provided for selected
sectors in the country, the city of Manila and the surrounding Rizal province claimed
over 3/5 (66%) of the total number of firms in construction (with 20 employees or
more), engaging in concert 81% of the nation’s total workforce in that sector. Parallel
patterns existed in the tertiary sectors.13
In similar vein, Manila functions as a prime powerhouse of financial capital and
key point in the import-export nexus and international trade. In 1971, manila had 298
commercial banks, 53 savings and mortgage banks, and 10 development banks,
amounting to 44%, 93% and 11% respectively, of the total number of such
establishments in the whole country. A study by the First National City Bank estimated
that between 1968-1971, Greater Manila accounted for 68% of the total bank deposit
liabilities in the Philippines.14
While total export tonnage being handled in the capital had dramatically declined
(although still substantial) to 20% (in 1970-76) after the war in favour of secondary cities,
Manila’s 85% control over all incoming imports displays the city’s immense dominance
in commerce.15 Broadly, the colossal concentration of capital was strikingly spelled out
by the fact that between 1970-79, the National Capital Region captured the cumulative
total of 57% of aggregate paid in capital of all business enterprises in the country.16
Ultimately, regional differentials in economic development were clearly mirrored
by the disproportionate spatial dispersion of physical and social infra-structure. Luzon
the macro-region of Metro-Manila, had almost half of the total road length and number
of airports in 1975. Household access to electricity, potable water and toilets were
10
generally 10% higher in Luzon than the average of 26.5, 24.4 and 21.9% respectively in
the other macro-regions, for the same year. Health and educational facilities were also
heavily concentrated in Luzon, specially in the metropolitan capital, where 23% of the
country’s 749 colleges and universities (19 of 50 universities) were located. The
contiguous regions of Metro-Manila and Southern Tagalog contained 75% of all
hospitals in the Philippines.17
Table 3Gross Regional Product (GRDP) and Value Added in
Manufacturing (VAM) per capita, and share of VAM in GRDP,1974
GRDP/capita(pesos)
VAM/capita Share of VAM in GRDP (%)
Metro-Manila 6,600 2,475 37.6
More Urbanised
Central Luzon 1,780 509 29.1
Southern Luzon 2,384 620 25.6
Western Visayas 2,677 678 25.5
Central Visayas 2,016 366 17.9
Less Urbanised
Ilocos 1,431 152 10.6
Bicol 1,187 165 13.8
Eastern Visayas 1,304 121 9.2

Table 3Gross Regional Product (GRDP) and Value Added in
Manufacturing (VAM) per capita, and share of VAM in GRDP,1974
11
Rural
Cagayan 1,325 78 5.9
NorthernMindanao
1,775 249 14.1
WesternMindanao
1,472 116 7.9
Eastern Mindanao 1,426 196 13.5
SouthernMindanao
2,755 403 14.5
Philippines 2,418 492 24.8
Note: The above categorisation has been drawn from Pernia & Paderanga for analyticalconvenience according to the criteria for urban classification defined by the NationalCensus and Statistics Office (NCSO) in 1963 and revised in 1970.Source: Pernia & Paderanga (1980), Table 8: 13.
The precipitous infra-structural build-up following in the wake of the industrialisation
drive in the 50s-70s in the Capital Region can also be inferred from inter-regional figures
on allocation of infra-structural expenditures, where the Capital Region registered
respectively 56% of total investments in public infra-structures (postal services,
waterworks, highways, schools and hospitals) for fiscal years 1959-61 and 1971-73.18
Table 4Indicators of Regional Concentration of Manufacturing (M), 1956 and 1974
% share of M % share of M % share of M firms employment real value added
1956 1974 1956 1974 1956 1974

% share of M % share of M % share of M firms employment real value added
12
Metro-Manila &SouthernLuzon*
70.8 67.5 64.5 67.5 64.5 62.0
Moreurbanised
CentralLuzon
8.4 8.8 6.0 8.0 8.9 8.4
WesternVisayas
4.5 3.7 10.4 6.6 15.1 14.2
CentralVisayas
5.9 6.0 5.4 4.4 4.1 5.3
Lessurbanised
Ilocos 1.9 1.7 2.0 1.3 1.3 0.8
Bicol 1.1 2.0 1.3 0.6 0.6 0.4
EasternVisayas
1.3 0.4 0.9 0.3 0.5 0.5
Rural
Cagayan 0.7 1.7 -– -- 0.1 0.5
NorthernMindanao
1.8 2.4 4.2 2.8 1.9 2.1
WesternMindanao
0.6 1.0 0.9 0.9 0.3 0.4
EasternMindanao
1.3 0.4 0.6 1.3 0.7 1.9

% share of M % share of M % share of M firms employment real value added
13
SouthernMindanao
2.5 3.3 2.3 4.3 1.0 3.7
Phil.(100%)
1,833 2,843 150,878 450,200 2,330** 10,041**
Note: % figures rounded; *Data not available separately for Metropolitan Manila andSouthern Luzon; **In million pesos at constant 1972 prices.Source: Moran (1978, Table 2.6b: 47) based on: BCS, Annual Survey of Manufactures,1956; NCSO, Annual Survey of Establishments, 1974; and NEDA, Philippine StatisticalYearbook, 1977. Derived from Pernia & Paderanga (1980), Table 7: 12.
The parody of regional distortions suggested by the dazzling titan-ism of metropolitan
economy is replayed with even greater pathos within the very walls of this economic
giant. Indeed, gross disparities in income distribution, high unemployment and
underemployment rates, vast poverty incidence dramatise the exacting social costs and
bogus features of economic titan-ism. Features which in turn typify contradictions
arising from the previously noted urbanisation-industrialisation process and the secular
incapacity of the formal urban economy to sustain phenomenal postwar population
growth.
City and Circuits: “Atrophy” and “Hypertrophy”
Analogically, “upper (or formal) circuit atrophy” and “lower (informal) circuit
hypertrophy” portray the long-term impact of industrialisation on the postwar urban
economy, labour and occupational structures. “Atrophy,” or the constricted nature of
modern formal employment generation - imputed earlier by critics on the structural
idiosyncrasies of capital-intensive, import-dependent and external market biassed

14
industrialisation - has been most spatially condensed in Metropolitan Manila. As the
uncontested industrial nucleus of the country, it is expected where one finds the most
compulsive “upper circuit” unemployment and labour dislocation.
A graphic résumé of this phenomenon is furnished by the diagram (Figure 2)
below, illustrating the relationship between sustained inertia in aggregate
manufacturing output and employment (A & C) and the general pattern of
metropolitan unemployment (B) over a ten-year period. In the late 70s and early 80s,
the adverse effects of world recession coinciding ill with a major national economic
crisis redounded automatically and most savagely on metropolitan economy and
labour. The steep decline in industrial output critically intersecting with inflationary
costs of imported industrial inputs obviously had immediate repercussions on urban
labour and employment given the substantial concentration of industrial activity in the
metropolis.
While this vulnerability is suggested by the scissors relationship between
powerfully decelerating total manufacturing output and metropolitan unemployment
rates accelerating beyond yearly national and regional averages (A & B),19 the lethargic
trend imparted by the stable 10-12% annual contribution of manufacturing to total
employment (C) manifests the sectoral paralysis and limitations imposed by dependent
industrialisation on “upper circuit” employment generation. In fact, manufacturing
employment figures have statically congealed around this magic range since 1945,
regardless of the intervening shifts in industrialisation strategies.
Whereas above standard unemployment maladies have traditionally plagued the
post-colonial city, the ferocity and magnitude of industrial labour displacements in the

15
critical 80s had been biblical as one report confides: “Out of 49,036 lay-offs recorded
nationwide from January to September 1980, 30,86" or two-thirds were in the
metropolitan capital.20
With employment options in industry stymied, a large portion of the growing
postwar urban population has increasingly been assimilated into tertiary enterprises
and informal “lower circuit” activities - broadly characterised by self-employment,
unpaid family labour, paltry wages below the official minimum and the absence of any
social security protection - or join the traffic of labour intermittently commuting
between circuits. Although this trend had previously been noted in the prewar years,
it started to take “hypertrophic” proportions in the post-colonial era.
Thus in contra-distinction to the gradual decline in manufacturing (12.3-9.5%)
and agricultural employment (52-49%) between 1975-1985, the tertiary sector hiked its
share of total employment from 31-37% over the 15-year interval.21
Given the paucity of reliable and accurate dis-aggregated data on metropolitan
equivalents, we may here, albeit with caution, extrapolate replication of the recorded
general pattern of constriction-expansion nationwide, considering the veteran over-
concentration of the country’s secondary and tertiary sectoral employment in Manila.
Microcosmic versions of this trend are provided by a series of urban community
studies in the 70s. In the densely populated slum sprawl of the Tondo Foreshore Area
(TFA), the most frequented area for urban research, a cross-sectional look at the
occupational structure in 1977 showed that almost two-thirds were employed in the
tertiary sector. A third of those who did not have regular salaried employment were
self-employed in “lower circuit” small-scale trade and petty commodity production.22

16

17
The Social and Class Articulation of Convolution
Distended social and class aberrations deliver the clinching finale in the dependency
drama of structural and sectoral distortions, parading on review the select cast of
victims and victors of underdevelopment. Distortions which have socially polarised
during the post-colonial period into reinforced affluence for an exclusive minority and
conversely protracted poverty for an ever expanding legion of the underprivileged. At
the core of postwar poverty lies the selective and skewed state of property relations in
the Philippines. A relation further aggravated by eroding wage and income levels, and
inflationary living costs. Spiralling class differentials vis-a-vis access, appropriation and
control over material resources find their most dramatic expression in the sphere of
consumption and the increasingly subverted ability of the rural and urban labouring
classes to defray the market cost of social reproduction.
Distended Differentials: Wage, Property Relations and the Poverty Syndrome
To what extent the capacity of labour to meet the basic minimum of social reproduction
has been undermined in the recent decades, can be deduced from absolute and relative
quantification of poverty. Absolute poverty studies, although departing from diverging

18
poverty line estimates, point, by and large, at the alarming upsurge of poverty
incidence in the last two decades. Poverty incidence is defined here as the head count
ratio of the population falling below the poverty threshold or the cut-off point below
which incomes cannot buy for the family recommended nutritional and other basic
requirements. Accordingly, the pauperised cadre falling anywhere between 30 to 56%
of total families nationwide in 1971 swelled from 30% to 64.3% in 1975. The spirit of this
distressing trend was to be rekindled by official data in 1985, counting the poverty
incidence at more or less 60%.23
While the poverty scenario had been most extensive in the least developed rural
regions it had increasingly become most condensed in the urban environs of Metro-
Manila, as indicated by the precipitous jump of the capital’s impoverished population
from somewhere between 9-14% in 1971 to 31-36% in 1975, eventually shifting to
overdrive at 44% in 1985.24
The progressive economic liquidation of a substantial segment of the labouring
classes since the 70s is underscored by the rapid erosion of real wage and income levels
in the face of sustained inflationary spurts in living costs. Moreover, deliberate wage
freezing policies to hold down already deflating wage levels as part of the official
strategy to seduce foreign corporate investments by the Marcos regime during the EOI
heydays of the 70s, doubly jeopardised labour’s position. With steep rises in consumer
prices by decade’s end (100-305 rise in the consumer price index between 1970-79!),
double-digit drops in real wages (25-30%, 1970-1980) and with Southeast Asia’s
reputedly lowest wages, the fate of many rural and urban households was virtually
sealed to bankruptcy in the 80s.25

19
Thus, in 1984, the highest legislated minimum monthly wages, inclusive of
supplements for both non-agricultural workers in Metro-Manila ($76) and agricultural
workers ($62) even failed to coincide with the most conservatively drawn poverty line
at $77.31 per month at current prices for a family of six.26
Decoding absolute poverty trends in the relative terminology of income
distribution and Gini-coefficients essentially filter out the class nomenclature of the
poverty syndrome. Vulgar inequalities in the control and appropriation of social
product in the Philippines are summarized in an Asian Development Bank study on
Philippine income distribution patterns between 1956-1981. The study detailed the
omnipresence of uniformly high Gini-coefficients27 over time and the deterioration of
income inequalities since 1961, revealed by quantile share comparisons of low and high
income earners. During the 25-year interval, the share of the lowest quantile declined
from about 5% to less than 3%, while that of the top quantile increased to nearly 60%.
Zooming in on the urban extension of income inequality, a 1975 study of intra-
Manila income pattern drew an even more appalling picture. While the richest 10% of
families nationwide received an annual average income of 26,863 pesos that year, 19
times as much as the average of the poorest 10% households (1,425 pesos/yr), this
already huge discrepancy was to pale in comparison with that of the capital city’s score,
where the top 10% (52,720 pesos) income average exceeded by over 20 times the bottom
10% (2,376 pesos).
Income disparities tended to be most acute in the ghettos of the Tondo Foreshore
Area, the locus of the city’s largest urban poor community, where median family
incomes registered a little more than half of the 1975 metropolitan level. Overall, the

20
study concluded that the “lowest 70% of MMA (Metropolitan Manila Area) families had
average incomes below the poverty line.”
Table 5Legislated minimum money and real daily wage rates*
Metro-Manila Agriculture highest minimum ** lowest minimum***
Money wage Real wage¤ Money wage Real wage¤
1972 8.00 16.25 4.75 10.34
1974 8.80 11.59 5.57 10.34
1976 12.09 13.94 8.03 9.48
1978 15.74 15.74 11.40 11.40
1980 27.39 19.36 17.03 12.31
1982 31.82 18.06 19.65 11.38
1984 48.47 16.63 29.92 10.48
1986 (April) 57.08 15.54 35.67 10.07
Notes: *Weighted average by duration of minimum wage rates legislated during theyear. The Table represents only the highest and lowest-paying of the 12 differentminimum wage categories. **Minimum wage payable by a large firm (capitalisation of> 1 million pesos) in Metro-Manila. ***Minimum wage payable by a small-scaleemployer in non-plantation agriculture. ¤Money wage deflated by the Consumer PriceIndex (1978 = 100)Source: World Bank Country Study, Philippines: A Framework for Economic Recovery(1987), Table 11.4: 153.
Table 6Quantile share of low & high income earners and Gini-
coefficients, Philippines, 1956-1981
Year Share of bottom20%
Share of top 20% Gini-coefficient
1956 4.9 54.8 .4540
1961 4.2 56.2 .4644
1965 3.6 55.4 .4632
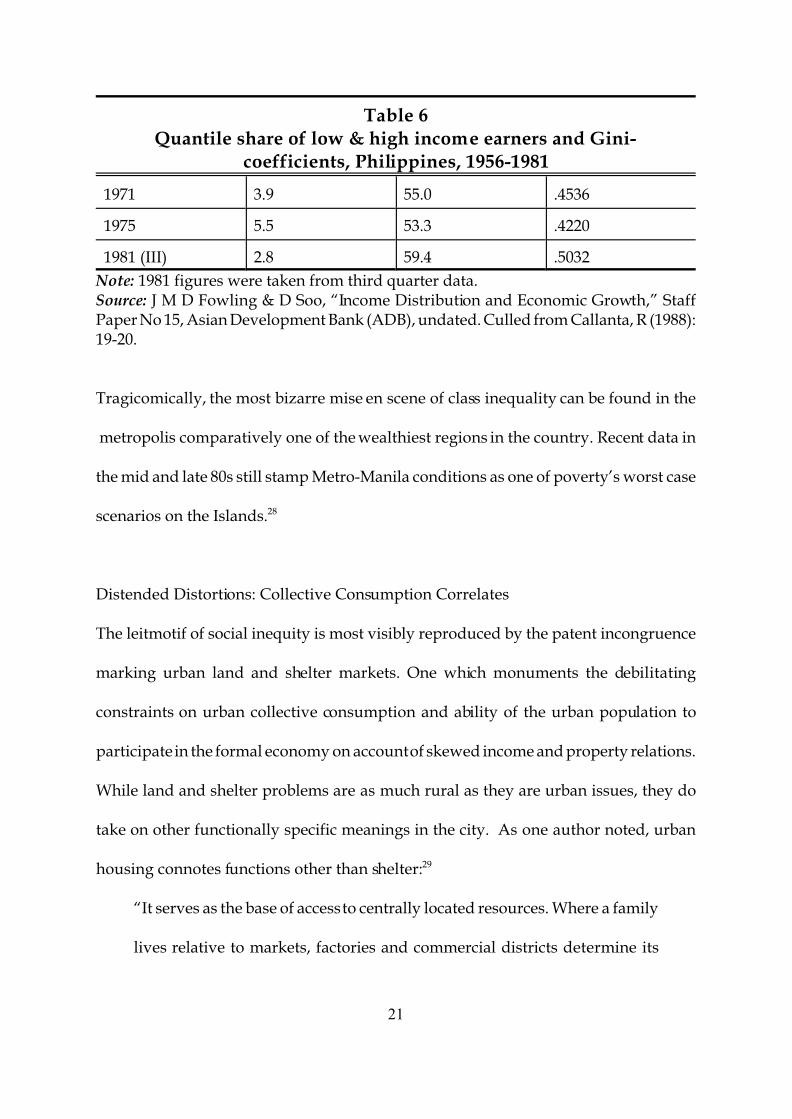
Table 6Quantile share of low & high income earners and Gini-
coefficients, Philippines, 1956-1981
21
1971 3.9 55.0 .4536
1975 5.5 53.3 .4220
1981 (III) 2.8 59.4 .5032
Note: 1981 figures were taken from third quarter data.Source: J M D Fowling & D Soo, “Income Distribution and Economic Growth,” StaffPaper No 15, Asian Development Bank (ADB), undated. Culled from Callanta, R (1988):19-20.
Tragicomically, the most bizarre mise en scene of class inequality can be found in the
metropolis comparatively one of the wealthiest regions in the country. Recent data in
the mid and late 80s still stamp Metro-Manila conditions as one of poverty’s worst case
scenarios on the Islands.28
Distended Distortions: Collective Consumption Correlates
The leitmotif of social inequity is most visibly reproduced by the patent incongruence
marking urban land and shelter markets. One which monuments the debilitating
constraints on urban collective consumption and ability of the urban population to
participate in the formal economy on account of skewed income and property relations.
While land and shelter problems are as much rural as they are urban issues, they do
take on other functionally specific meanings in the city. As one author noted, urban
housing connotes functions other than shelter:29
“It serves as the base of access to centrally located resources. Where a family
lives relative to markets, factories and commercial districts determine its

22
ability to participate and partake of the urban economy ... Unlike in the
countryside where land is vital for its fertility, in urban centres land is vital
for its locational specificity. However, in both town and country, unequal
access to land (and by extension to shelter) implies unequal incomes.”
Inequality is also clearly stated in the substandard state of urban services available to
a significant slice of the urban population.
The “Helter Skelter” State of Shelter
Phenomenal postwar proliferation of slum and squatter settlements on marginal public
and private urban lands bears witness to the haphazard state of urban shelter.
According to official surveys conducted in the mid- and late 80s, there were 1.9 million
squatters in the capital (one-third of city population) and 3.3 million in other cities
living in 415 shanty and hovel enclaves under extremely overcrowded substandard
structures and dismal environmental conditions.
With a yearly increase in squatting at 11%, it is estimated that by the end of the
millennium more than half of metropolitan population will be squatters. Quantum
escalation of the slum and squatter phenomenon had been noted between the 60s and
80s, when the proportion of makeshift barong-barong structures in Metro-Manila shot
up by 200% from a little less than 15,000 to a staggering 49,000 even as corresponding
figures for other regions declined during the same period.
With an average annual rise in city population by over 4% since the 70s and the
city’s low income households mounting by perhaps 12% (upsetting the 2.4% yearly

23
standard output of new dwelling units), the crevice between annual supply backlog and
new demand in the urban shelter stock has indeed prominently widened in the last
decades.30
The nightmarish metropolitan housing situation has thus compelled official
housing efforts to focus on Manila. According to the recent official five-year plan (1987-
1992), Manila accounted for 17% of the total housing need of 3.4 million units(576,000
units) or 36% of total urban requirements targeted for the whole period. However, the
lacklustre performance of previous state housing delivery programs raises serious
doubts about the ability o'f the incumbent plan to hit its declared targets.
Beyond that, the generally low subsidisation of state housing, posting a mere
1.9% and 2.7% of the national budget outlay for previous and present periods, leaves
the urban majority practically at the mercy of ransom double-digit rent rises and
amortisation rates, inflationary building costs and spiralling land prices ravaging the
open housing markets. Moreover, the proclivity of commercial housing construction to
cater to an exclusive high income clientele had been noted in the past. As Keyes (1980),
examining the shelter situation in the 70s, observed:
“It is estimated that only 12% of Manila households can afford open market
housing. Yet 80% of all construction activity, carried out by more than 3,000
private construction firms, serve only this narrow market...”31
Expelled from the open housing market by affordability constraints and mediocre state
subsidisation, the urban underprivileged have addressed the shelter problem through
informal housing construction. And judging from figures given by the 1980 census on
housing, the contribution of the informal housing sector, according to an official

24
admission, had in fact been substantial, defeating by a wide margin the combined
performance of both government and private formal sectors. As such, of the total
housing output of 675,000 units between 1976-1980 only 15% originated from the
government and private formal sectors. Informal housing activities accounted for
virtually all rural and a significant portion of urban housing delivered among others in
the form of makeshift and transitional structures by urban squatters.32
“Land Poverty Amid Land Plenty”
Squatter and slum settlements are a natural response to an unbalanced urban land
market. A World Bank study comparing land values at the urban periphery to per
capita GNP in selected developing countries, ranked the Philippines among one of the
most incongruous cases. While other countries offered 100 sq m home-sites at less than
one year’s per capita GNP and even half that amount, land for home-sites in the
Philippines was estimated at 246% per capita GNP. Further, around Manila, the inverse
relationship between land costs and distance to the urban core frequently does not
apply.
In 1977, land development was judged the highest growth “industry,” returning
an average yield of 43%. With increments in wages constituting only a fraction of
increases in land values, the pressures on low income families to squat or otherwise
house themselves illegally are self-evident.33
Essentially, contemporary housing problems are rooted in the acute lopsidedness
of urban landownership structures, which favour a few big landlords and institutions.
This pattern evolved during the Spanish colonial regime, when vast tracts of traditional

25
communal lands in the present Metro-Manila area were awarded to single families and
institutions and turned into private estates. American colonialism did little to disturb
landlord property relations. Many of these are now prime urban lands, some of which
lie in gestation as urban landlords speculate on their holdings. This kind of land
hoarding has consequently limited the supply of land for residential purposes and
generated spiralling land prices.34
Once trade and industrial incentives required of the immediate postwar
industrialisation drive in the 50s were in place, urban centres began to expand into what
were once agricultural estates held by the powerful landed elite, who naturally became
prominent in the urban real estate business. They wielded monopolistic sway over the
growing land market because of their land-holdings then at the edge of the traditional
cities were locationally unique. Ownership concentration allowed for the withdrawal
of land from development, making it difficult for rural to urban migrants to access and
afford residential land. Urban residents found it hard to compete with commercial and
industrial users, who were in a better position to pay for monopoly rents demanded by
landlords.
Not surprisingly, urban squatting and housing became a problem of epic
proportions only in the postwar period when rapid urbanisation began in response to
the spatial bias of the industrial strategy approach. However, urban growth cannot be
entirely blamed for this, rather, it was the inability of property rights to develop in a
manner compatible with urban expansion that fuelled the problem. The historical
necessity that the dissolution of feudal property, both rural and urban, precede
industrial development remains unfulfilled.

26
While ownership concentration of urban lands co of urban lands continues, the
housing problem defined in terms of unequal access will prevail. As of 1983, close to
40% of total the total Metro-Manila land area remain undeveloped and lie close to
existing commercial and industrial centres. And while 65% of total idle lands in 1988
were privately owned, 70% of metropolitan homeowners did not possess any legal title
to land. The cost of housing, significantly determined by the price of land, will remain
high and many will continue to be denied access to the urban economy.35
The conflict for urban space will likely intensify as sections of the urban poor
continue to occupy hoarded land, a conflict augured by a leading erudite on Third
World urbanisation 27 years ago:36
“The land problem in the Philippines is not of scarcity but of refusal to sell.
Much of the acreage in the urban and urbanising districts are frozen in the
hands of owners who have no present intention of developing it. Neither the
magnetism of demand nor the temptation of profit can persuade the larger
landholders to make use of their holdings or sell to others who will. The
situation is most acute in the environs of Manila, where land poverty exists
amid land plenty ... Because of high land costs, low income families pay the
price of slumlife, overcrowding and ransom rents - or they simply take the
law into their own hands and squat on private and public lands.”
Urban Service: Sorrows of Service
As the ranks of the economically insolvent urban classes swell and demographic
pressures beef up the urban population, demand on state delivery of basic services

27
critically mounts. However, the contradictions of unequal income and property
relations discussed above are themselves “alter-egoed” in the sorry state of urban
services.
Even though service availability is as a rule generally high in the metropolis,
intra-city disparities in service accessibility are extremely pronounced. In the congested
Tondo Foreshore area, for example, only 40% of households had access to an adequate
water supply, in sharp contrast to the otherwise extensive 82% city-wide household
coverage by the public waterworks system in the mid-70s. Whereas a low 12% of city
population availed of sewerage services, Tondo residents were found to have had
virtually no sanitary sewers save for a 42-inch sewer outfall traversing the area and
three 36-inch pipelines for storm drainage.
Makati, home of the suburban elite and middle-class households where 82% of
homes enjoyed flush/water-sealed toilets in the early 70s, stood in diametrical
opposition to Tondo. There, 40% generally disposed of human waste through the “wrap
and throw” method.
Some of the effects of the uneven distribution of public services may be seen in
the incidence of disease in Metro-Manila. In 1975, a comparison of mortality and
morbidity data for non-squatter and squatter areas in the Tondo area revealed the
leading causes of death - pneumonia, tuberculosis, diseases of the heart, vascular system
and early infancy, malignant neoplasms, gastroenteritis and colitis, and accidents - were
those commonly associated with urban poverty conditions (malnutrition, congestion,
poor hygiene and sanitation). On all counts the mortality rate in the non-squatter area
was surpassed by those in the squatter colonies. For tuberculosis alone, respective ratios

28
1.Keyes, 1980: 1; Caoili, op cit: 69. Pernia, Paderanga & Hermoso (1983) invoking World Bank1980 estimates, approximate the primacy index or the ratio of population of the largest city vis-a-vis the combined population of the three next largest cities for Metro-Manila to 3.7. See Perniaet al (1983), Table 2.3: 24.
2.Figures vary conspicuously. Some authors have employed a 5% growth rate in their estimates,e.g. Callanta puts the city’s population at 8.2 and 10 million respectively in 1982-85, while otherslike Grinsven gauge metropolitan population at a more modest 6.9 million in 1987. See callanta,1988: 104; van Grinsven, 1988: 8.
3.Computed from figures given in Table 2.4, Population Density by Region (1980, 1985) inMedium-Term Philippine Development Plan, 1987-1992: 55.
4.Caoili, op cit: 74, using Pernia, 1977: 56-ff.
5.See NEDA: 1985 Chart 8-07 & Table 8-07: 198-99; consult also Medium-Term PhilippineDevelopment Plan 1987-1992, Table 2.6: 55.
6.Derived from Abad, 1981: 132.
7.For insightful discussions see e.g. Ruland, 1985:1; Bello, op cit; Canlas, 1988; Callanta, op cit.Data on forced migrations and displacements as a result of growing militarisation in certain ruralareas can be found in van Grinsven, 1988: 31; Amawim, July-Spet. 1987: 6.
8.Meijer, 1986: 34-35. Other authors invoking figures from UN estimates, put the 1968 squatterpopulation at a much higher 1.1 million. Cf Keyes, 1980: 6.
9.See the 1985 Joint Survey on slum dweller population tabulations for Metropolitan Manila andother major urban centres appearing in AMAWIM Vol 1 No 3 (1987). See also Makil (1983) asquoted in van Grinsven, op cit: 10; Meijer, op cit: 37.
10.Caoili, op cit: 78.
11.Note that Meijer, referring to Oosterhout (1985): 13, uses estimates for the whole Tondodistrict to which the Tondo Foreshore-land Area is but a sub-district. (Cf Caoili, ibid: 68).Discrepancies between Caoili and Oosterhout’s 1975 figures on average density for Metropolitan
for squatter and non-squatter were 1:122 versus 1:14. In 1988, the capital city registered
the highest total death and infant mortality rates nationwide.37
Notes

29
Manila
12.Derived from Caoili, op cit: 77. Relevant figures are presented in Annex Table III-E. UsingWorld Bank data (Table 12.3 GRDP at constant 1972 prices, 1975-85, World Bank (1987): 156),this author calculated metropolitan GRDP percentage shares bordering at plus-minus 30% perannum from mid-1970 to mid-1980, revealing a stable trend. Computations made from the mostrecent figures available reaffirmed the rule. With 12.8% (7.7 million) of the country’s predictedtotal population (60 million) in 1988, the National Capital Region (Metro-Manila) generated 31%(31.3 million pesos) of total GRDP (101.7 million) pesos. Its GRDP per capita that year (4,143pesos) overshot the national mark (1,733 pesos) twice. For details on the regional estimate, seeIBON Facts and Figures, Vol XII, No 21 (1989): centrefold.
13.Caoili, ibid: 69-70. Other authors echo similar observations: Oosterhout (1985: 134) notedthat 66% of companies with more than 500 employees were located in the capital in 1975. FarEastern Economic Review (1976-03-05: 31) even mentions a concentration of 80% of thenation’s industries located in and around the metropolis. Einsiedal and Ranjo (1985) of theMetropolitan Manila Commission (MMC) reported a high figure of 88% of the nation’s industryand business situated in the capital (quoted in Meijer, op cit: 31).
14.Lopez, 1975: 23-24.
15.Oosterhout, 1985 quoted in Meijer, op cit: 31-32.
16.See Pernia et al, 1983, Table 6: 263.
17.Meijer, op cit: 32; Caoili, op cit: 74.
18.Pernia et al, et al, 1983, op cit, Table 4: 262.
19.For national and regional estimates see NEDA, 1985 Table 6-02: 127.
20.Villegas, op cit: 138; Lopez, 1975: 24; Callanta, 1988: 119.
21.WB, op cit, Table i.3: 74.
22.Sembrano, 1977: 52-56.
23.For the 1970-75 figures, see Callanta, op cit: 7; 1985 estimates can be found in the MediumTerm Philippine Development Plan, 1987-92, Table 2.1: 55 & Table 9.1: 257.
24.Conservative and radical estimates account for the d iscrepancies. See estimates of Tan,World Bank for 1971-75 in Callanta, op cit, Table 5: 11, and Medium Term ... ibid, for 1985.
25.Lichauco, 1981: 82; Jose, op cit: 237; Broad, op cit: 119.
26.Canlas, op cit: 2-3.

30
27.A common yardstick in gauging the degree of income inequality, introduced by the Italianstatistician, C. Gini in 1912. The Gini ratio ranges from 0.0 (absolute inequality) to 1.0 (absoluteequality). For the Gini ratio formula, see NEDA, 1985: 157.
28.Caoili, op cit: 83-84; Meijer, op cit: 37.
29.Solon, 1988: 160.
30.Philippine Agenda, 1988: 2; IBON, 1988: 7 (24/5?); Angeles, 1985: 6: Keyes, 1980: 4.
31.Keyes, 1980: 4.
32.Medium Term Plan, 1987: 242.
33.Keyes, op cit: 15.
34.Caoili, op cit: 94.
35.Historical passages on the evolution of landed property were mainly culled from Caoili, ibid:94; Solon, op cit 118-19. On postwar urban land use patterns refer to Keyes, 1975 (32b): 406.:
36.Charles Abrams (1964) quoted in Keyes, 1975 (32b): 406.
37.Caoili, op cit: 79-99; IBON, op cit: centrefold.