developing and validating energy models for indirect …
TRANSCRIPT

DEVELOPING AND VALIDATING ENERGY MODELS FOR INDIRECT AND DIRECT
EVAPORATIVE COOLING USED IN DATACENTERS
by
RAJESH KASUKURTHY
Presented to the Faculty of the Graduate School of
The University of Texas at Arlington in Partial Fulfillment
of the Requirements
for the Degree of
MASTER OF SCIENCE IN MECHANICAL ENGINEERING
THE UNIVERSITY OF TEXAS AT ARLINGTON
August 2016

ii
Copyright © by Rajesh Kasukurthy 2016
All Rights Reserved

iii
Acknowledgements
I would like to thank Dr. Dereje Agonafer for his continued support and guidance
over the course of my thesis research. He motivated me in improving myself. Without his
resources and knowledge this would not be possible.
I would like to thank Dr. Abdolhossein Haji Sheikh and Dr. Fahad Mirza for being
on my committee and giving their valuable time in reviewing my work.
I would like to acknowledge my family for believing in me and send overseas for
studies. I would not be who I am today without your love and support. I would like to
thank my mother for being by my side and for always trusting my decisions. I would like
to thank my sister for her sacrifices and heard work to support me.
I would like to thank my friend and the members of EMNSPC team for their
support and valuable advices throughout my time at the university.
April 18, 2016
iv
Abstract
DEVELOPING AND VALIDATING ENERGY MODELS FOR INDIRECT AND DIRECT
EVAPORATIVE COOLING USED IN DATACENTERS
Rajesh Kasukurthy, MS
The University of Texas at Arlington, 2016
Supervising Professor: Dereje Agonafer
In the present day to day life, Internet of things is everything, i.e., we need
internet and telecommunication for almost every task of our life and these require data
from data centers. These data centers provide various facilities like data processing,
storage, and transmission, and maintenance, operations etc., for performing these tasks,
a huge amount of power is consumed by the data center, which in turn generates large
amount of heat. As these data centers are to be made operational throughout the year,
cooling of data centers is of utmost importance. These cooling systems like air
conditioners, economizers and evaporative cooling systems also require a considerable
amount of power. Evaporative Cooling is one of the effective methods available for
cooling data centers.
Developing and validating a thermodynamical model for evaporative
cooling used in data centers. Environmental data such as temperature, humidity etc., for
a particular location is used for computing the cooling capacity and performance (PUE
and water consumption) of the data centers. For the purpose of validation, the actual data
from the existing evaporative cooling unit is compared to the computed data from our
model. The type of evaporative cooling system suitable for particular environmental
conditions can also be known from this model.

v
Table of Contents
Acknowledgements .............................................................................................................iii
Abstract .............................................................................................................................. iv
List of Illustrations ..............................................................................................................vii
List of Tables ...................................................................................................................... ix
Chapter 1 Introduction......................................................................................................... 1
1.1 Data Center Cooling ................................................................................................. 2
1.1.1 Oil immersion cooling ........................................................................................ 3
1.1.2 Air cooling ......................................................................................................... 4
Chapter 2 Psychrometry ..................................................................................................... 7
2.1 Psychrometric Terminology ...................................................................................... 7
2.2 Psychrometric Chart ................................................................................................. 9
2.3 PUE ........................................................................................................................ 11
Chapter 3 Direct Evaporative Cooling ............................................................................... 12
3.1 Model ...................................................................................................................... 13
Model ............................................................................................................................ 14
3.1.1 Assumptions and considerations ..................................................................... 15
3.1.2 Server heat ...................................................................................................... 15
3.1.3 Fan energy ...................................................................................................... 16
3.1.4 Water Pump ..................................................................................................... 18
3.1.5 Evaporating Media........................................................................................... 19
3.3 Model Validation ..................................................................................................... 19
3.3.1 Server taken in to study ................................................................................... 19
3.3.2 MESTEX Model comparison ........................................................................... 20
3.3.3 Special case .................................................................................................... 22

vi
3.4 Calculations ............................................................................................................ 22
3.5 Results .................................................................................................................... 23
Chapter 4 Indirect Evaporative Cooling ............................................................................ 26
4.1 Model ...................................................................................................................... 27
4.1.1 Server heat ...................................................................................................... 28
4.1.2 Fan Energy ...................................................................................................... 29
4.1.3 Water pumping energy .................................................................................... 30
4.2 Model Validation ..................................................................................................... 30
4.2.1 MESTEX model ............................................................................................... 30
4.2.2 Model comparison ........................................................................................... 32
4.2.3 ASHRAE A4 Envelope .................................................................................... 32
4.4 Calculations ............................................................................................................ 33
4.5 Results .................................................................................................................... 34
Chapter 5 Conclusion ........................................................................................................ 37
References ........................................................................................................................ 38
Biographical Information ................................................................................................... 40

vii
List of Illustrations
Figure 1-1 Representation of Internet of Things linked to data center. .............................. 1
Figure 1-2 Schematic diagram of flow of air in cooling data center. ................................... 2
Figure 1-3 Diagram showing the processes of oil immersion cooling. ............................... 3
Figure 1-4 Diagram showing the processes of 2 stage
liquid phase change cooling. ............................................................................................... 4
Figure 1-5 Layout diagram of stranded CRAC ................................................................... 5
Figure 1-6 Air flow in economizer ....................................................................................... 6
Figure 1-7 Evaporative cooling ........................................................................................... 6
Figure 2-1 Psychrometric chart out line .............................................................................. 8
Figure 2-2 Processes in Psychrometric chart ..................................................................... 9
Figure 2-3 Psychrometric chart representing type of
cooling system used for cooling ........................................................................................ 10
Figure 2-4 Power distribution chart ................................................................................... 11
Figure 3-1 (a) Direct Evaporative Cooling,
(b) Psychrometric chart representation ............................................................................. 12
Figure 3-2 Energy flow model diagram ............................................................................. 14
Figure 3-3 Fan efficiency curve ......................................................................................... 16
Figure 3-4 Relation among pressure, airflow and efficiency ............................................. 17
Figure 3-5 Server fan ........................................................................................................ 17
Figure 3-6 Server .............................................................................................................. 19
Figure 3-7 San Jose Direct Evaporative Cooling .............................................................. 24
Figure 3-8 DFW Direct Evaporative Cooling ..................................................................... 25
Figure 4-1 Psychrometric chart for IDEC .......................................................................... 26
Figure 4-2 Indirect Evaporative cooling pad ..................................................................... 26
viii
Figure 4-3 ASHRAE envelope .......................................................................................... 33
Figure 4-4 San Jose IDEC ................................................................................................ 35
Figure 4-5 DFW IDEC ....................................................................................................... 36

ix
List of Tables
Table 3-1 Inlet Temparatures and Delta T ........................................................................ 20
Table 3-2 Model comparition ............................................................................................ 21
Table 3-3 San Jose Economizer for DEC ......................................................................... 24
Table 3-4 DFE Economizer for DEC ................................................................................. 25
Table 4-1 IDEC model ....................................................................................................... 31
Table 4-2 San Jose Economizer for IDEC ........................................................................ 35
Table 4-3 DFW economizer for IDEC ............................................................................... 36

1
Chapter 1
Introduction
A data center is a facility that house the IT equipment used for data processing,
storage, and transmission. Data that is used in day to day activities for example Internet
of Thongs, a thing, in the Internet of Things, can be a person with a heart monitor
implant, a farm animal with a biochip transponder, an automobile that has built-in sensors
to alert the driver when tire pressure is low or any other natural or man-made object that
can be assigned an IP address and provided with the ability to transfer data over a
network [1]. So these data centers are kept secured and tightly controlled environment to
make it running throughout the year. To maintain the controlled environment a lot of
energy is used by the air conditioning systems.
Figure 1-1 Representation of Internet of Things linked to data center [2].
2
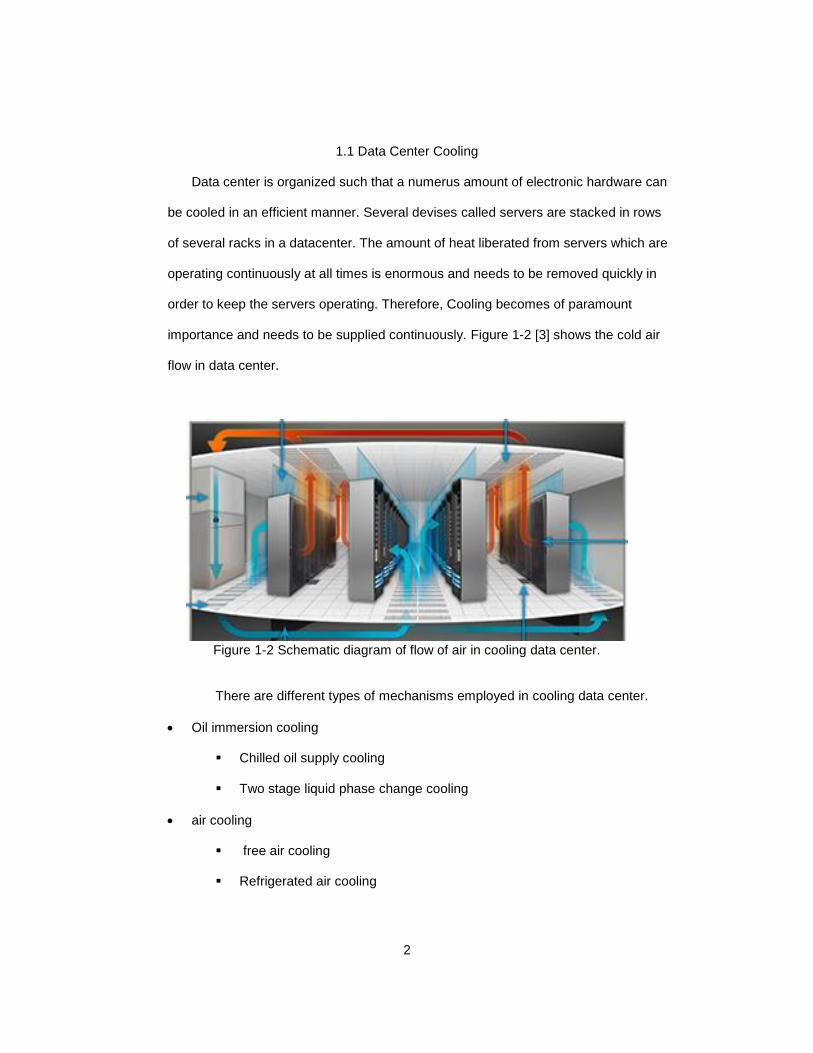
1.1 Data Center Cooling
Data center is organized such that a numerus amount of electronic hardware can
be cooled in an efficient manner. Several devises called servers are stacked in rows
of several racks in a datacenter. The amount of heat liberated from servers which are
operating continuously at all times is enormous and needs to be removed quickly in
order to keep the servers operating. Therefore, Cooling becomes of paramount
importance and needs to be supplied continuously. Figure 1-2 [3] shows the cold air
flow in data center.
Figure 1-2 Schematic diagram of flow of air in cooling data center.
There are different types of mechanisms employed in cooling data center.
Oil immersion cooling
Chilled oil supply cooling
Two stage liquid phase change cooling
air cooling
free air cooling
Refrigerated air cooling

3
Economizer cooling
Evaporative cooling
1.1.1 Oil immersion cooling
In oil immersion cooling servers are immersed in the oil and the oil is being
circulated to cool the servers. The heat exchange takes place through convection
between the oil the servers. Figure 1-3 [4] shows process of oil immersion cooling.
Figure 1-3 Diagram showing the processes of oil immersion cooling.
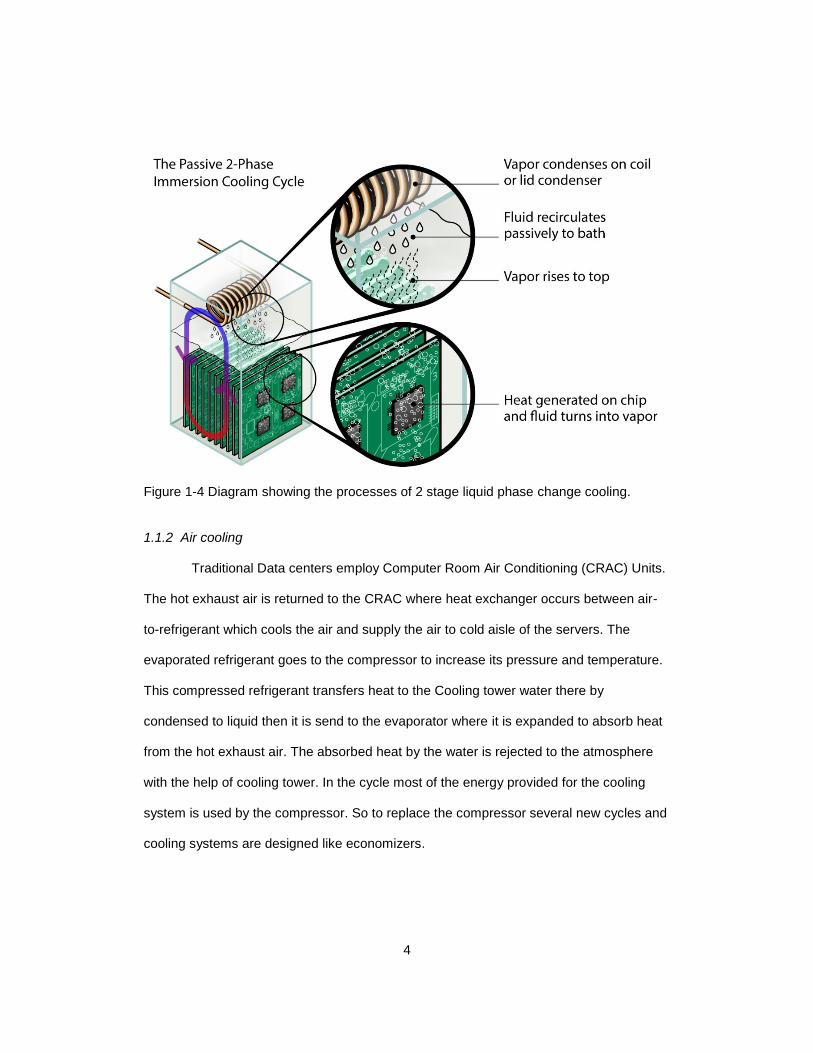
There is other type of oil cooling where oil changes its phase to cool the servers. In this
type of cooling volatile liquids are used. Natural or forced convection is used to circulate
the oil in phase change cooling. Figure 1-4 [5] shows the two phase liquid cooling
4
Figure 1-4 Diagram showing the processes of 2 stage liquid phase change cooling.
1.1.2 Air cooling
Traditional Data centers employ Computer Room Air Conditioning (CRAC) Units.
The hot exhaust air is returned to the CRAC where heat exchanger occurs between air-
to-refrigerant which cools the air and supply the air to cold aisle of the servers. The
evaporated refrigerant goes to the compressor to increase its pressure and temperature.
This compressed refrigerant transfers heat to the Cooling tower water there by
condensed to liquid then it is send to the evaporator where it is expanded to absorb heat
from the hot exhaust air. The absorbed heat by the water is rejected to the atmosphere
with the help of cooling tower. In the cycle most of the energy provided for the cooling
system is used by the compressor. So to replace the compressor several new cycles and
cooling systems are designed like economizers.

5
Figure 1-5 Layout diagram of stranded CRAC
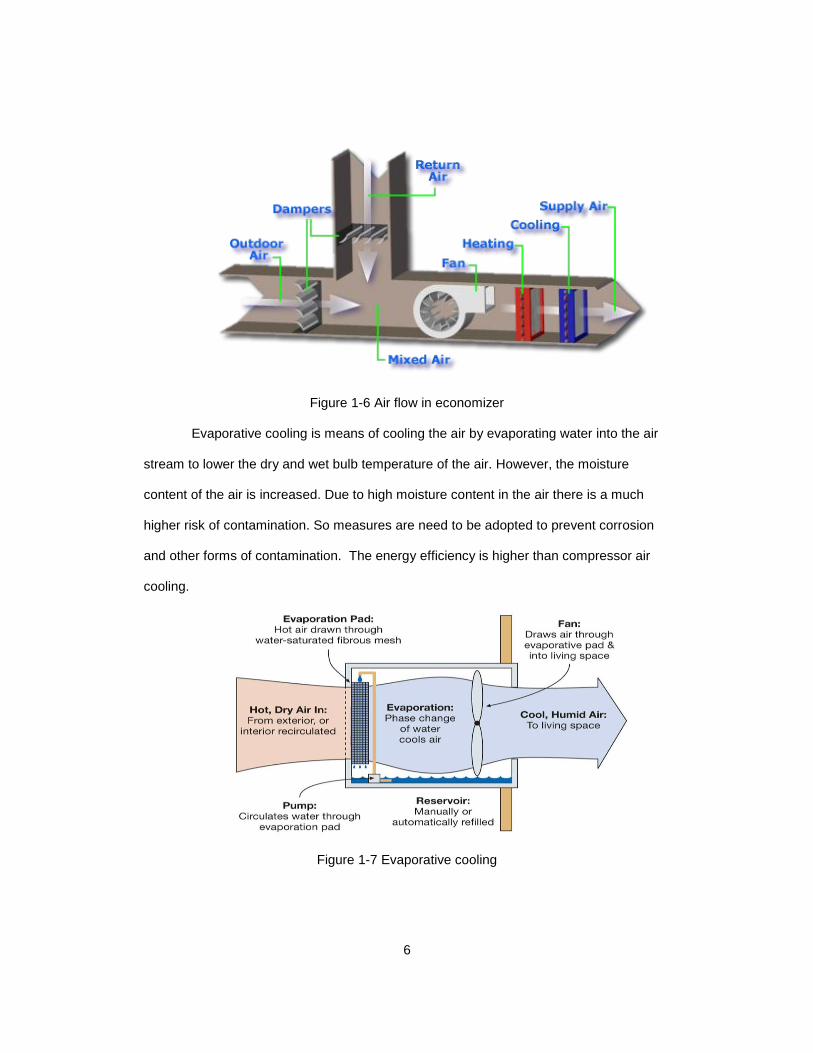
Figure 1-5 [6] shows the compressor refrigeration air cooling. Air Side
Economization is also being employed in data centers because it is efficient. Whenever
ambient air conditions are favorable to the data centers such as dry and wet bulb
temperature, and humidity, the outside air is directly fed to the data center thereby it uses
no energy to cool the air again. This gives better energy efficiency. But this involves the
risk of contamination of the hardware so prevention measures have to be adopted by the
data center. The figure below shows how the economizer works.
6
Figure 1-6 Air flow in economizer
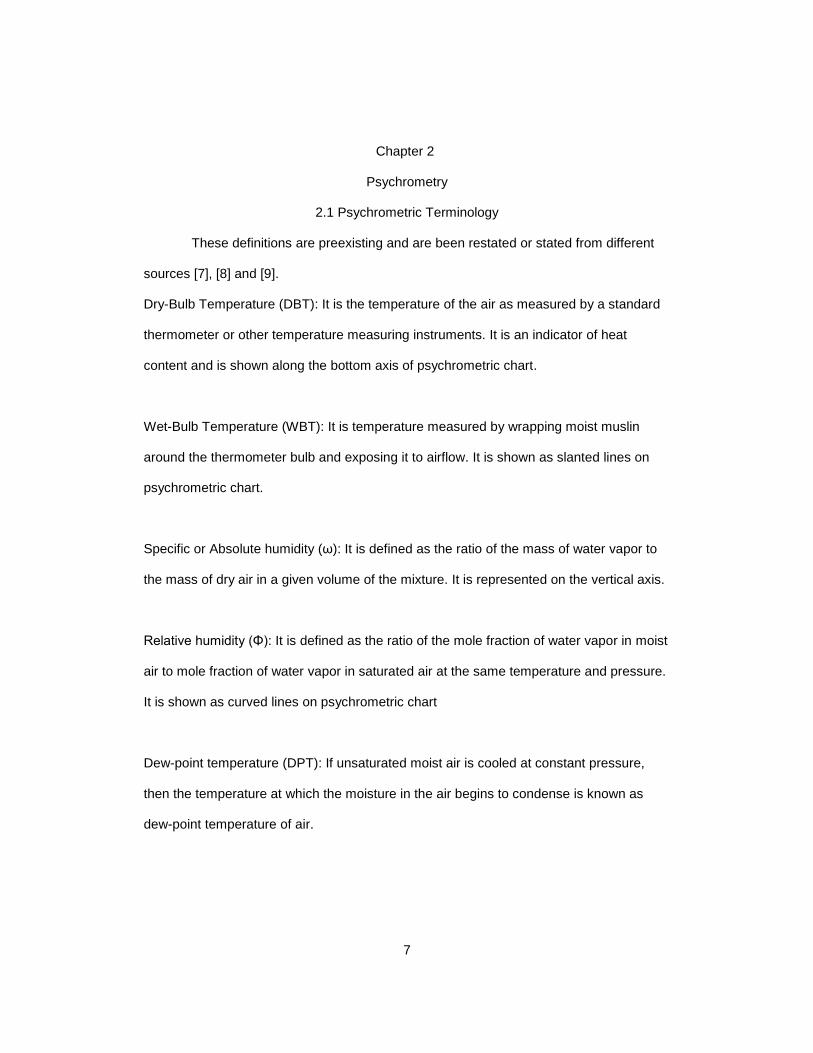
Evaporative cooling is means of cooling the air by evaporating water into the air
stream to lower the dry and wet bulb temperature of the air. However, the moisture
content of the air is increased. Due to high moisture content in the air there is a much
higher risk of contamination. So measures are need to be adopted to prevent corrosion
and other forms of contamination. The energy efficiency is higher than compressor air
cooling.
Figure 1-7 Evaporative cooling
7
Chapter 2
Psychrometry
2.1 Psychrometric Terminology
These definitions are preexisting and are been restated or stated from different
sources [7], [8] and [9].
Dry-Bulb Temperature (DBT): It is the temperature of the air as measured by a standard
thermometer or other temperature measuring instruments. It is an indicator of heat
content and is shown along the bottom axis of psychrometric chart.
Wet-Bulb Temperature (WBT): It is temperature measured by wrapping moist muslin
around the thermometer bulb and exposing it to airflow. It is shown as slanted lines on
psychrometric chart.
Specific or Absolute humidity (ω): It is defined as the ratio of the mass of water vapor to
the mass of dry air in a given volume of the mixture. It is represented on the vertical axis.
Relative humidity (Φ): It is defined as the ratio of the mole fraction of water vapor in moist
air to mole fraction of water vapor in saturated air at the same temperature and pressure.
It is shown as curved lines on psychrometric chart
Dew-point temperature (DPT): If unsaturated moist air is cooled at constant pressure,
then the temperature at which the moisture in the air begins to condense is known as
dew-point temperature of air.

8
Degree of saturation (μ): The degree of saturation is the ratio of the humidity ratio to the
humidity ratio of a saturated mixture at the same temperature and pressure.
Enthalpy (s): The enthalpy of moist air is the sum of the enthalpy of the dry air and the
enthalpy of the water vapor. Enthalpy values are always based on some reference value.
For moist air, the enthalpy of dry air is given a zero value at 0oC, and for water vapor the
enthalpy of saturated water is taken as zero at 0oC. It is represented by slanted lines
parallel to that of wet bulb temperature.
Specific volume (ʋ): The specific volume is defined as the number of cubic meters of
moist air per kilogram of dry air. From perfect gas equation since the volumes occupied
by the individual substances are the same, the specific volume is also equal to the
number of cubic meters of dry air per kilogram of dry air.
Figure 2-1 Psychrometric chart out line

9
2.2 Psychrometric Chart
A Psychrometric chart graphically represents the thermodynamic properties of
moist air. Standard psychrometric charts are bounded by the dry-bulb temperature line
and the vapor pressure or humidity ratio. The Left Hand Side of the psychrometric chart
is bounded by the saturation line. Figure shows the schematic of a psychrometric chart.
Psychrometric charts are readily available for standard barometric pressure of 101.325
kPa at sea level and for normal temperatures (0-50oC). ASHRAE has also developed
psychrometric charts for other temperatures and barometric pressures (for low
temperatures: -40 to 10oC, high temperatures 10 to 120oC and very high temperatures
100 to 120oC).
Figure 2-2 Processes in Psychrometric chart
If we know any two properties of moist air we can figure out all other
psychrometrics by just plotting the point on the chart. Depending on the end conditions of

10
the moist air we can determine whether we require to heat, cool, humidify, dehumidify or
any two process together need to be applied. If we move to the right on the chart, we
have undergone heating. Similarly, if we move to left on the chart we need to undergo
cooling. Likewise, if we need to go to right upper corner we need heating and humidifying
simultaneously and similarly all other processes. We need to look out for our air and
determine whether it is in the permissible limits of the allowable envelope. If not we need
to work on the air accordingly to bring the product air within the allowable limits specified
by the Technical committee 9.9 of ASHRAE
Figure 2-3 Psychrometric chart representing type of cooling system used for cooling

11
2.3 PUE
Power Usage Effectiveness: This is a metric defined by the Green Grid to
measure the effectiveness of a data center. It is a ratio of Total power required by the
facility to the IT compute power. Figure 3-6 [5] shows the power distribution among the
data center.
Figure 2-4 Power distribution chart
Power Usage Effectiveness (PUE):
PUE = Total Facility Power
Compute Power =
Compute Power+Cooling Power+Misc. Power
Compute Power
This gives us a sense of understanding as to how much of power is spent on
other activities which is not for the prime use. Therefore, we aim to reduce the Cooling
Power to achieve better values of PUE without affecting the working of IT equipment.
Ideal PUE =1.0

12
Chapter 3
Direct Evaporative Cooling
This model has been developed and is in practice in the industry. Dodia N has
already designed the layout of formulation of the cycle and this is the improved version
that concentrates on the fan efficiencies in the cycle[16]. This also adds more information
on the efficiency and PUE of the evaporative cooling.
Direct evaporative cooling (DEC) water is sent directly into the supply airstream
with a spray or wetted media. As the water absorbs heat from the air, it evaporates and
cools the air. In direct evaporative cooling the dry bulb temperature is lowered but the wet
bulb temperature remains unchanged. The latent heat of water is observed from the hot
air. The water vapor mixes with the air and makes it more humid.
(a) (b)
Figure 3-1 (a) Direct Evaporative Cooling, (b) Psychrometric chart representation
In operation, the blower pulls air through a permeable, water-soaked pad. As the
air passes through the pad, it is filtered, cooled, and humidified. A recirculation pump
13
keeps the media wet, while air flows through the media. To make sure that the entire
media is wet, more water is usually pumped than can be evaporated and excess water
drains from the bottom into a sump. An automatic refill system replaces the evaporated
water.
3.1 Model
This model is developed on the energy flow basis of data center cooling. This
model considers the cycle from the entry of the ambient air to the exit of the exhaust air
form the server room. For this the cycle has been divided into three sub levels where
energy is calculated.
The cycle starts with the ambient air entering into the evaporating pad. The water
is pumped from the top of the cooling media, which drifts down to the sink at the bottom
of the media. The water evaporates to cool the air. Excess amount of water is sent in to
the media so that the cooling pad is wet at all times. Water is cycled to the top from the
sunk tank and makeup water is added every time. The cool air is then passed through
filters to reduce the moister content in the air and also to purify the air from IT equipment
pollutants. Large fans are used to force the air into the server room with the required
pressure.
The air entering into the server room is fed into the cold isle. The server fans help
to suck the cold air from the cold isle side to hot isle side and prevents the back pressure.
This hot air from the hot isle is sucked by the exhaust fan.

14
Model
Figure 3-2 Energy flow model diagram

15
3.1.1 Assumptions and considerations
Assumptions for this model are
1. Each rack in the computer room is operating at the same performance level
with the same loading conditions that is at 98% CPU utilization.
2. No losses exist in the system, requiring that the full heat load dissipated
within the data center system must be released to the ambient environment.
3. The facility has a IT capacity of 25kW.
4. Adequate cooling resources.
5. All server fans are equally efficient.
3.1.2 Server heat
The rack is composed of the IT hardware. The amount of heat dissipation from
the racks is fixed, and is independent of fan power. There is additional heat dissipation
due to the inefficiency of the system fan’s operation. An inlet air temperature and air
temperature rise across the rack is taken from published values for the model. The air
inlet temperatures are varied from 15oC to 45oC in the intervals of 5oC across the
ASHRAE A4 envelope. The temperature rise across the rack is taken from published
values which were experimentally found out. The mass flow rate of air required through
the rack can hence be determined using the heat balance of
𝑚𝑟𝑎𝑐𝑘𝑎𝑖𝑟 =𝑄𝑟𝑎𝑐𝑘
𝐶𝑝∆𝑇𝑟𝑎𝑐𝑘𝑎𝑖𝑟
The power demand for these server fans in operation can be determined
through scaling of the fans’ reference operating condition using the fan laws. The total
power demand for the rack is the summation of server fans power demand for all racks in
the data center. An additional amount of heat dissipation from the inefficiency of this

16
server fan’s operation is taken into account with the IT heat dissipation for the total heat
dissipation into the room determined by
3.1.3 Fan energy
We used fans at several steps of the cooling cycle. The electrical energy
supplied to the fan is used to produce a pressure head but it also liberates heat due to
the friction and current. The efficiency of the fan can be understood by the fan curves.
Figure 3-3 Fan efficiency curve
From figure 3-3 [11] we can see that the fan efficiency increases as the
diameter of the fan impeller increases. It also depends on the fan efficiency grade (FEG)
of the selected fan. So the server fan efficiency can be taken as 45% approximately.
Figure 3-4 [11] shows the relation between pressure air flow and efficiency.

17
Figure 3-4 Relation among pressure, airflow and efficiency
The specifications of the server fan I have considered is
Voltage: 12V
Current: 1.88A
Speed: 13900 rpm
Power of fan = 22.56W
Figure 3-5 Server fan
18
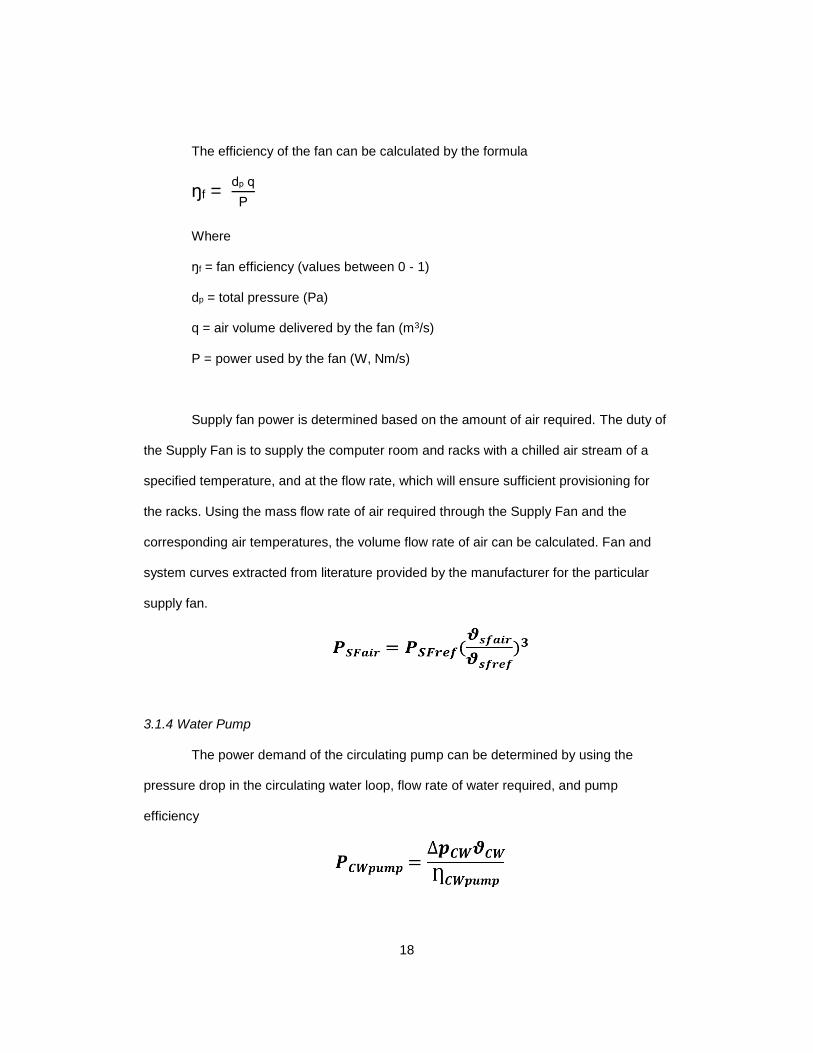
The efficiency of the fan can be calculated by the formula
ŋf = dp q
P
Where
ŋf = fan efficiency (values between 0 - 1)
dp = total pressure (Pa)
q = air volume delivered by the fan (m3/s)
P = power used by the fan (W, Nm/s)
Supply fan power is determined based on the amount of air required. The duty of
the Supply Fan is to supply the computer room and racks with a chilled air stream of a
specified temperature, and at the flow rate, which will ensure sufficient provisioning for
the racks. Using the mass flow rate of air required through the Supply Fan and the
corresponding air temperatures, the volume flow rate of air can be calculated. Fan and
system curves extracted from literature provided by the manufacturer for the particular
supply fan.
3.1.4 Water Pump
The power demand of the circulating pump can be determined by using the
pressure drop in the circulating water loop, flow rate of water required, and pump
efficiency
19
The amount of water evaporated can be calculated by measuring the humidity
ratio gain at the end of the evaporative media and multiplying it by the mass flow rate of
the air
3.1.5 Evaporating Media
The cold airstream to the supply fan is supplied by evaporative media. The hot
and dry air flows over the media which is constantly sprayed with water with the help of a
circulating pump. This hot and dry air, then evaporates the water thereby lowering its dry-
bulb temperature enough to provide cooling to the Computer Room. The air at exit of the
media contains relatively much higher humidity in comparison to the air that enters the
media. The lowest dry-bulb temperature possible for the hot air to achieve is its own wet-
bulb temperature where the air is completely saturated. The amount of cooling possible
also depends on the saturation efficiency of the evaporative media. The efficiency of the
media varies from 60% to 90% depending on the number of cycles and time period.
3.3 Model Validation
3.3.1 Server taken in to study
The servers considered for study are the 1.5 RU Open Compute Servers. A
study on effects of Rack Inlet Temperature on the performance of a chiller based Cooling
System was done experimentally. Values for individual components and all temperature
measurements were taken during this experiment. The values for density and

20
temperature rise across the racks at different rack inlet temperatures were taken from this
experiments.
Table 3-1 Inlet Temparatures and Delta T
Rack Inlet Temperature Delta T
15 ℃ 17.5 ℃
20 ℃ 17 ℃
25 ℃ 17.5 ℃
30 ℃ 10.75℃
35 ℃ 7.62 ℃
40 ℃ 4.85 ℃
45 ℃ 4 ℃
3.3.2 MESTEX Model comparison
The development of this model has been based on similar previous work
conducted by Breen et al. For the model outlined in this research to be considered

21
appropriate, the operating conditions determined using the current model must correlate
with the parameters specified in the Baseline DC.
The Baseline DC is an IT Pod of 25 kW at outdoor facility of MESTEX, Dallas. It
employs a hybrid direct/indirect evaporative cooling unit with following specifications
• AZTEC DIRECT/INDIRECT EVAPORATIVE UNIT
• Model: ASC-15-2A11-00-HLS
• SUPPLY FAN: 10HP, 6250 CFM
• COOLING TOWER FAN:2 HP, 5000 CFM
• CIRCULATING PUMP: ½ HP, 67GPM
• DIRECT PUMP: 1/3 HP, 16 GPM
• 3 FULLY POPULATED RACKS WITH HP SE1102 SERVERS
• TOTAL LOAD: 25 KW
Table 3-2 Model comparition
BASELINE MODEL %ERROR
Total Load 25KW 25KW 0
Supply fan Power 0.791
kW
0.71kW -11.5%
Direct Pump 0.83 kW 0.75 -7.5%
Cooling Power 1.621 1.45 -10%
PUE 1.065 1.0578 -0.745%
Water Consumption Not Metered 0.135 -
The Baseline DC can be summarized as a typical air cooled data center, with
Direct Evaporative Cooling. The data center computer room contains rack units of 25 kW
heat dissipation. The supply air temperature to the room has been assumed as 25°C.

22
The computer room is served by 1 AZTEC unit. Data for the AZTEC unit were taken from
manufacturer data for a suitable unit.
3.3.3 Special case
If the ambient temperature is below the set point, the air is mixed with the
exhaust air in right proportions to reach the set point. During this mode water is not
circulated over the media and the pump does not consume any power. On occasion
where ambient temperature is higher than the set point, the outside air is mixed with
return exhaust air in such proportions that hot air flows over met media lowering its dry
bulb temperature to the set point. The psychrometric values are calculated by in-built
functions of MS-Excel.
3.4 Calculations
Calculations for PUE and Water consumption has been made in following way,
Q= 25 kW;
Density = 1.185 kg/m3
∆T = 17oC
Qsf = Q+∑12*(1-0.45) = 25k+1.58k = 26.58k
If ambient temperature is less than set point temperature, Direct Evaporative
Cooling mode is not operated and Water consumption is Zero.
Therefore, m = 26.58/(1.05*17) = 1.489 kg/s = 1.489/0.0004719 = 3155 cfm
Psupplyfan = 7.5*(3155/6250)3 = 0.94 kW
Pdirectpump= 0.75 kW
Pcooling = 0.75 + 0.94 =1.69 kW
PUE = (25 +1.69)/25 = 1.067
Humidity ratio at inlet = 0.01135
Humidity ratio at inlet = 0.015437
23
Evaporation loss = 1.46*(0.015437 – 0.01135) = 0.0005967kg/s = 0.021 m3/hr
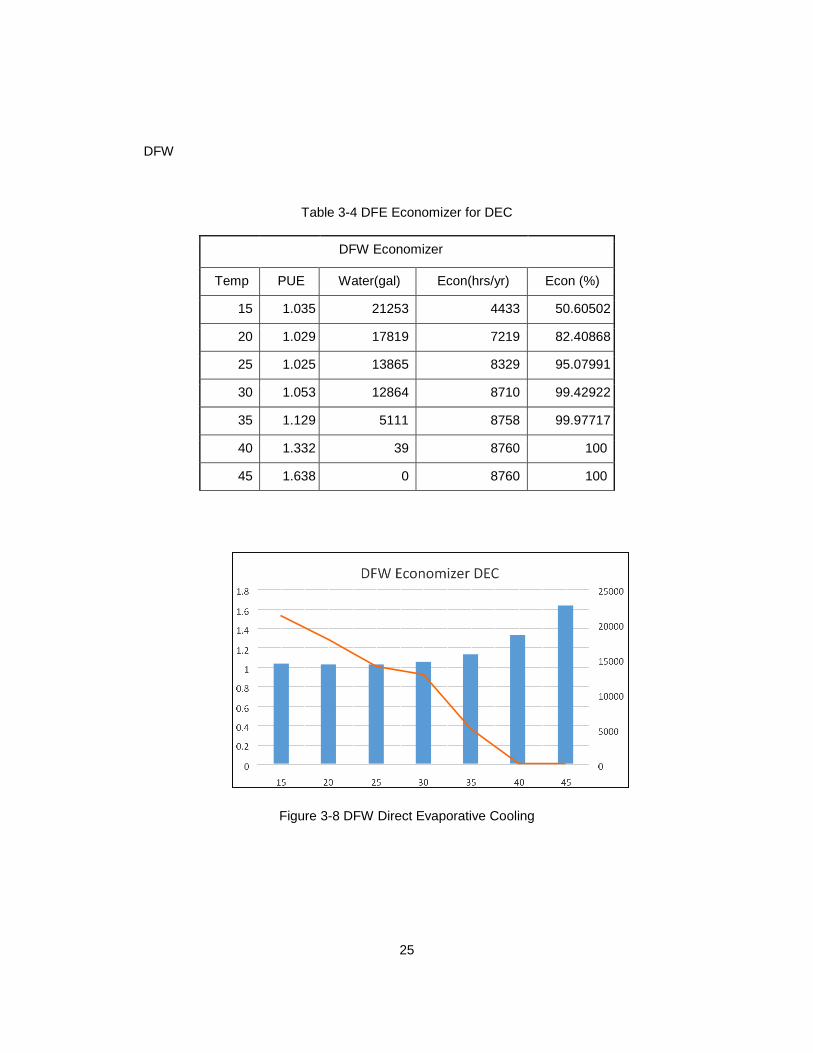
3.5 Results
As rack inlet temperature of the air increases, the mass flow rate required to cool
the server increases. Therefore, the power consumed by the supply fan increases which
overall increases the Total cooling power consumption. For both the cities economizer
mode varies due to the ambient conditions and therefore water consumption varies
across both cities.

24
Table 3-3 San Jose Economizer for DEC
SAN JOSE
Figure 3-7 San Jose Direct Evaporative Cooling
San Jose Economizer
Temp PUE Water(gal) Econ(hrs/year) Econ (%)
15 1.029 14135 4433 50.60502
20 1.019 7555 7219 82.40868
25 1.016 2895 8329 95.07991
30 1.05 781 8710 99.42922
35 1.129 56 8758 99.97717
40 1.332 0 8760 100
45 1.64 0 8760 100
San Jose Economizer DEC
0
0.2
0.4
0.6
0.8
1
1.2
1.4
1.6
1.8
15 20 25 30 35 40 45
0
2000
4000
6000
8000
10000
12000
14000
16000
25
DFW
Table 3-4 DFE Economizer for DEC
DFW Economizer
Temp PUE Water(gal) Econ(hrs/yr) Econ (%)
15 1.035 21253 4433 50.60502
20 1.029 17819 7219 82.40868
25 1.025 13865 8329 95.07991
30 1.053 12864 8710 99.42922
35 1.129 5111 8758 99.97717
40 1.332 39 8760 100
45 1.638 0 8760 100
Figure 3-8 DFW Direct Evaporative Cooling
26
Chapter 4
Indirect Evaporative Cooling
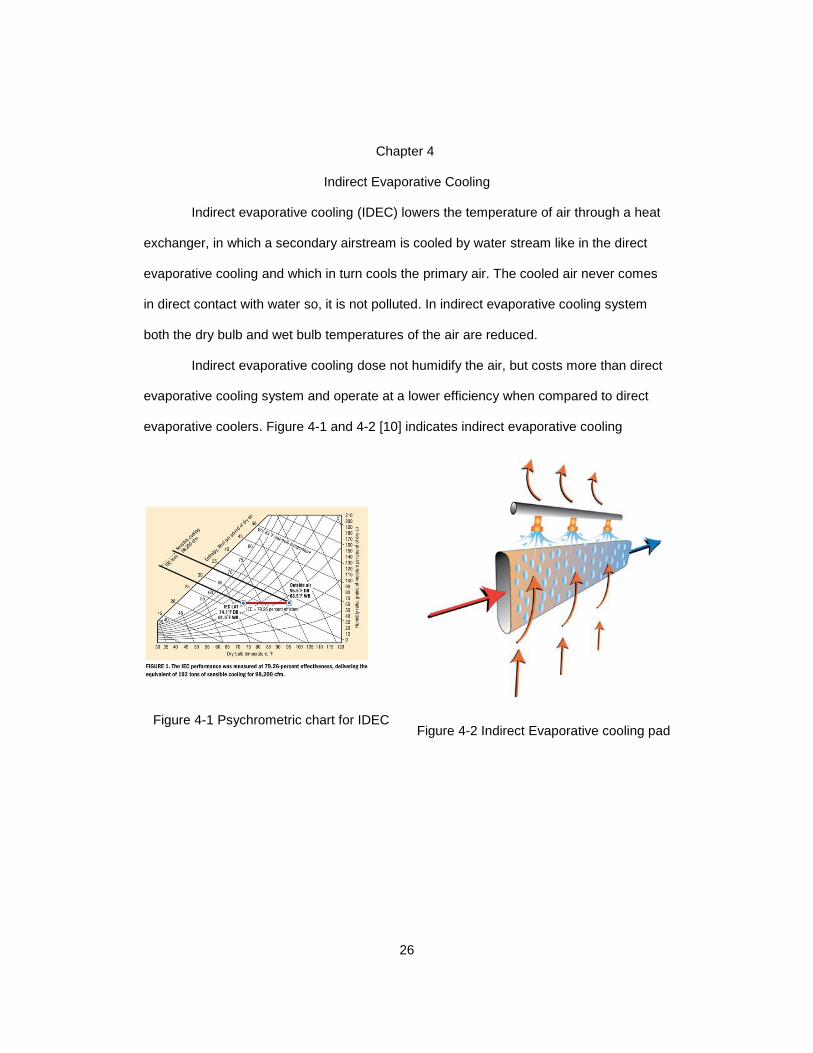
Indirect evaporative cooling (IDEC) lowers the temperature of air through a heat
exchanger, in which a secondary airstream is cooled by water stream like in the direct
evaporative cooling and which in turn cools the primary air. The cooled air never comes
in direct contact with water so, it is not polluted. In indirect evaporative cooling system
both the dry bulb and wet bulb temperatures of the air are reduced.
Indirect evaporative cooling dose not humidify the air, but costs more than direct
evaporative cooling system and operate at a lower efficiency when compared to direct
evaporative coolers. Figure 4-1 and 4-2 [10] indicates indirect evaporative cooling
Figure 4-2 Indirect Evaporative cooling pad
Figure 4-1 Psychrometric chart for IDEC

27
4.1 Model

28
This model is developed by separating energy levels of the cooling system. The
model starts at rack level heat released. The amount of heat released by the servers is
calculated to find the amount of cool air needed to supply. Then power drawn by the fan
is determined. Then comes the indirect evaporative cooling system.
In this indirect evaporative cooling supply air dose not directly contact the water
or the environment. Secondary air is used for cooling the primary air. This secondary air
undergo direct evaporative cooling in which latent heat is used to cool the secondary air
and in turn primary air. So the efficiency of indirect evaporative media is less than the
direct cooling.
4.1.1 Server heat
The rack is composed of the IT hardware. The amount of heat dissipation from
the racks is fixed, and is independent of fan power. There is additional heat dissipation
due to the inefficiency of the system fan’s operation. An inlet air temperature and air
temperature rise across the rack is taken from published values for the model. The air
inlet temperatures are varied from 15oC to 45oC in the intervals of 5oC across the
ASHRAE A4 envelope. The temperature rise across the rack is taken from published
values which were experimentally found out. The mass flow rate of air required through
the rack can hence be determined using the heat balance of
𝑚𝑟𝑎𝑐𝑘𝑎𝑖𝑟 =𝑄𝑟𝑎𝑐𝑘
𝐶𝑝∆𝑇𝑟𝑎𝑐𝑘𝑎𝑖𝑟
The power demand for these server fans in operation can be determined through
scaling of the fans’ reference operating condition using the fan laws. The total power
demand for the rack is the summation of server fans power demand for all racks in the
data center. An additional amount of heat dissipation from the inefficiency of this server
29
fan’s operation is taken into account with the IT heat dissipation for the total heat
dissipation into the room determined by
4.1.2 Fan Energy
The fan efficiency derived for direct evaporative cooling system is used in the
indirect evaporative cooling model.
Primary fan power is determined based on the amount of air required. The duty
of the Supply Fan is to supply the computer room and racks with a chilled air stream of a
specified temperature, and at the flow rate, which will ensure sufficient provisioning for
the racks. Using the mass flow rate of air required through the Supply Fan and the
corresponding air temperatures, the volume flow rate of air can be calculated. Fan and
system curves extracted from literature provided by the manufacturer for the particular
supply fan.
𝑃𝑃𝐹𝑎𝑖𝑟 = 𝑃𝑃𝐹𝑟𝑒𝑓(𝜗𝑃𝑓𝑎𝑖𝑟𝜗𝑃𝑓𝑟𝑒𝑓
)3
Secondary fan power is also determined by the amount of cooling required. As
the efficiency of the indirect evaporative media is less direct that is approximately 70%
and it depend on the heat exchange material and the cooling pad efficiency. But the
power consumed by the fan can be found by the same formula

30
4.1.3 Water pumping energy
The cold air stream to the supply fan is supplied by passing the ambient air over
the cooling coil which is supplied by chilled water by the cooling tower. The hot air flows
over the media which is constantly sprayed with water with the help of a circulating pump.
The water is cooled in the cooling tower by rejecting its heat to the atmosphere. The
amount of cooling possible also depends on the saturation efficiency of the evaporative
media.
𝑄𝑐𝑡 = 𝑚𝐶𝑝(𝑇𝑖 − 𝑇𝑜)
The power demand of the circulating pump can be determined by using the
pressure drop in the circulating water loop, flow rate of water required, and pump
efficiency
The amount of water evaporated can be calculated by measuring the humidity
ratio gain at the end of the evaporative media and multiplying it by the mass flow rate of
the air
4.2 Model Validation
4.2.1 MESTEX model
The development of this model has been based on similar previous work
conducted by Breen et al. For the model outlined in this research to be
considered appropriate, the operating conditions determined using the current
model must correlate with the parameters specified in the Baseline DC.

31
The Baseline DC is an IT Pod of 25 kW at outdoor facility of MESTEX, Dallas. It
employs a hybrid direct/indirect evaporative cooling unit with following
specifications
• AZTEC DIRECT/INDIRECT EVAPORATIVE UNIT
• Model: ASC-15-2A11-00-HLS
• SUPPLY FAN: 10HP, 6250 CFM
• COOLING TOWER FAN:2 HP, 5000 CFM
• CIRCULATING PUMP: ½ HP, 67GPM
• DIRECT PUMP: 1/3 HP, 16 GPM
• 3 FULLY POPULATED RACKS WITH HP SE1102 SERVERS
• TOTAL LOAD: 25 KW
Table 4-1 IDEC model
BASELINE MODEL %ERROR
TOTAL LOAD 25KW 25KW 0
SUPPLY FAN POWER
0.791 kW 0.76 kW -3.9%
COOLING TOWER FAN POWER
0.039 kW 1.5 kW* *Modelled for fixed fan speed
for Cooling Tower
CIRCULATING PUMP POWER
2.20 2.28kW +3.6%
PUE(instantaneous) 1.12 1.17 +5%
WATER CONSUMPTION (instantaneous)
Not metered 0.3 GPM -

32
4.2.2 Model comparison
The results of the validation model run using the parameters defined above are
compiled in Table 5, with comparison to the Baseline DC. The validation model shows
good agreement against the Base DC across the range of parameters that are
considered in Table 5. Some variation in the Supply Fan power demands exists for the
Supply fan. As the power demand of the Supply Fan is also dependent on the pressure in
the cold aisle, with no specific pressure difference specified for the Base DC, the
variation here can be considered acceptable. The total cooling system power demand,
illustrates an acceptable variation between the Baseline DC and Model DC. The model
development outlined above has been shown to describe acceptable performance
parameters for this model to be valid.
4.2.3 ASHRAE A4 Envelope
The server rack inlet temperature is varied from 15oC to 45oC in the interval of
5oC and performance of the data center is monitored for all parameters. 2 cities –San
Jose and Dallas-Fort Worth are taken into consideration and calculated for performance
in terms of pPUE and Water Consumption. The ASHRAE envelopes are shown in the
figure 4-3 [6] below.

33
Figure 4-3 ASHRAE envelope [15]
4.4 Calculations
Calculations for pPUE and Water consumption has been made in following way,
Q= 25 kW;
Density = 1.185 kg/m3
∆T = 17oC
If ambient temperature is less than set point temperature, Indirect Evaporative Cooling
mode is not operated and Water consumption is Zero.
Whenever indirect mode is in operation, the cooling tower is put into operation and the
fan speed of cooling tower is fixed in our calculations.
Therefore, m = 25/(1.05*17) = 1.46 kg/s = 1.46/0.0004719 = 2616 cfm

34
Psupplyfan = 7.5*(2616/6250)3 = 0.54 kW
Pctfan = 1.5*(5000/5000)3 = 1.5 kW
Pcirculatingpump= 2.25 kW
Pcooling = 2.25+ 1.5 + 0.54 =4.24 kW
PUE = (25 +4.24)/25 = 1.169
Humidity ratio at inlet = 0.01135
Humidity ratio at inlet = 0.015437
Evaporation loss = 5000*0.0004719*(0.015437 – 0.01135) =
0.00965kg/s = 0.035 m3/hr
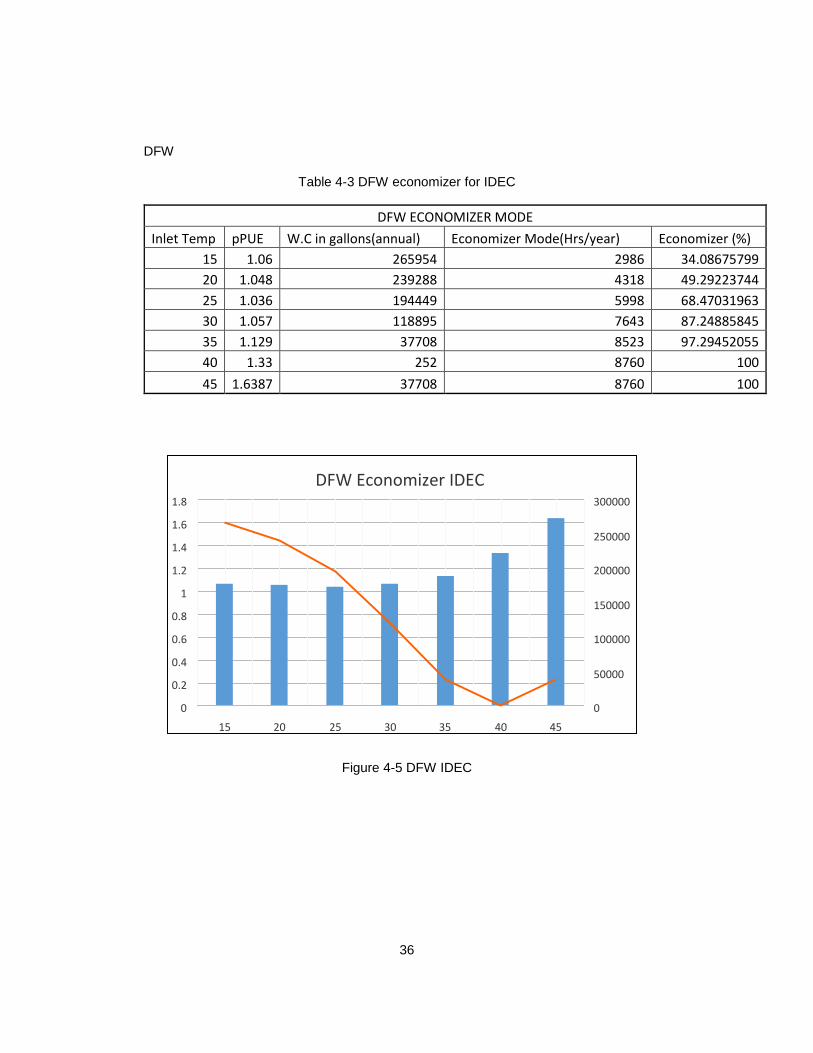
4.5 Results
As rack inlet temperature increases from lower temperature to a higher
temperature, the mass flow rate required to cool the server increases. Therefore, the
power required by the supply fan increases which overall increases the Total cooling
power. The economizer mode is operated for longer duration of the year as rack inlet
temperature increases. For both the cities economizer mode varies due to the ambient
conditions and therefore water consumption varies across both cities.

35
San Jose
Table 4-2 San Jose Economizer for IDEC
SAN JOSE ECONOMIZER
Inlet Temp pPUE W.C in gallons(annual) Economizer Mode(Hrs/year) Economizer Mode (%)
15 1.05 137105 4433 50.60502283
20 1.02 84800 7219 82.4086758
25 1.015 3700 8329 95.07990868
30 1.05 7250 8712 99.45205479
35 1.13 430 8758 99.97716895
40 1.33 0 8760 100
45 1.64 430 8760 100
Figure 4-4 San Jose IDEC
San Jose Economizer IDEC
0
0.2
0.4
0.6
0.8
1
1.2
1.4
1.6
1.8
15 20 25 30 35 40 45
0
20000
40000
60000
80000
100000
120000
140000
160000
36
DFW
Table 4-3 DFW economizer for IDEC
DFW ECONOMIZER MODE
Inlet Temp pPUE W.C in gallons(annual) Economizer Mode(Hrs/year) Economizer (%)
15 1.06 265954 2986 34.08675799
20 1.048 239288 4318 49.29223744
25 1.036 194449 5998 68.47031963
30 1.057 118895 7643 87.24885845
35 1.129 37708 8523 97.29452055
40 1.33 252 8760 100
45 1.6387 37708 8760 100
Figure 4-5 DFW IDEC
DFW Economizer IDEC
0
0.2
0.4
0.6
0.8
1
1.2
1.4
1.6
1.8
15 20 25 30 35 40 45
0
50000
100000
150000
200000
250000
300000
37
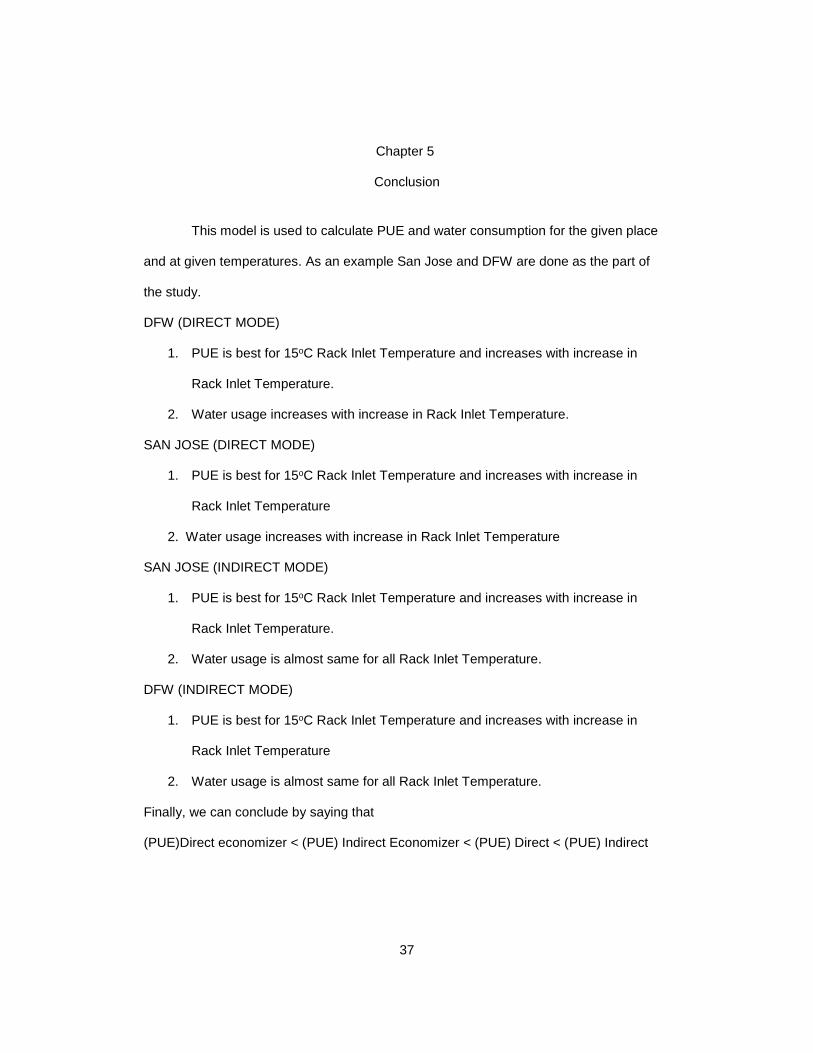
Chapter 5
Conclusion
This model is used to calculate PUE and water consumption for the given place
and at given temperatures. As an example San Jose and DFW are done as the part of
the study.
DFW (DIRECT MODE)
1. PUE is best for 15oC Rack Inlet Temperature and increases with increase in
Rack Inlet Temperature.
2. Water usage increases with increase in Rack Inlet Temperature.
SAN JOSE (DIRECT MODE)
1. PUE is best for 15oC Rack Inlet Temperature and increases with increase in
Rack Inlet Temperature
2. Water usage increases with increase in Rack Inlet Temperature
SAN JOSE (INDIRECT MODE)
1. PUE is best for 15oC Rack Inlet Temperature and increases with increase in
Rack Inlet Temperature.
2. Water usage is almost same for all Rack Inlet Temperature.
DFW (INDIRECT MODE)
1. PUE is best for 15oC Rack Inlet Temperature and increases with increase in
Rack Inlet Temperature
2. Water usage is almost same for all Rack Inlet Temperature.
Finally, we can conclude by saying that
(PUE)Direct economizer < (PUE) Indirect Economizer < (PUE) Direct < (PUE) Indirect
38
References
1. Margaret, R, Internet of Things,
http://internetofthingsagenda.techtarget.com/definition/InternetofThingsIoT
2. Jeferrd, https://pixabay.com/en/network-iot-internet-of-things-782707/
3. http://iisgroupllc.com/wp-
content/uploads/2013/02/Cooling_Overview_Data_Center_overview.jpg
4. http://minimusservers.com/cooling/
5. Sumber, Two Phase immersion cooling, https://submer.com/two-phase-
immersion-cooling/
6. http://www.wika.co/upload/WIKA_Thumbnails/Product-Detail-
Large/PIC_AN_ac_system_en_us_64122.jpg.png
7. Gibbs-Dalton Laws, IGNOU unit 6 Property of moist air. http://www.ignou.ac.in/
upload/Unit%206-32.pdf
8. Lesson 27 Psychrometry, Version 1 ME, IIT Kharagpur.
http://nptel.ac.in/courses/112105129/pdf/R&AC%20Lecture%2027.pdf
9. A. Bhatia, Overview of Psychrometrics, PDHonline
10. A. Bhatia, Principles of Evaporative Cooling System, PDHonline
11. Amir Radmehr, Kailash C. Karki, Suhas V. PatankarInnovative Research, Inc.,
12. Plymouth, MN, “Analysis of Airflow Distribution Across a Front-to-Rear Server
Rack.”
13. Paper No. IPACK2007-33574, pp. 837-843; 7 pages doi: 10.1115/IPACK2007-
3357 7. Alkharabsheh, S.; Sammakia, B.; Shrivastava, S.; Schmidt, R., "Utilizing
practical fan curves in CFD modeling of a data center," Semiconductor
Thermal Measurement and Management Symposium (SEMI-THERM), 2013
29th Annual IEEE, vol., no., pp.211, 215, 17-21 March 2013 doi:
39
10.1109/SEMI-THERM.2013.6526831. 8. Schmidt, R.R.; Cruz, E.E.; Iyengar, M.,
"Challenges of data center thermal management," IBM Journal of Research and
Development, vol.49, no.4.5, pp.709, 723, July 2005 doi: 10.1147/rd.494.0709
14. http://www.tateaccessfloors.com.au/white-papers/ Daniel Kennedy January 6,
2012, “Ramification of Server Airflow Leakage in Data Centers with Aisle
Containment”.
15. 2005 ASHRAE Handbook-Fundamentals.
16. Dodia. N, Developing and Validating Thermodynamic Models for Evaporative
Cooling Employed in Datacenters.

40
Biographical Information
Rajesh Kasukurthy received his bachelor degree (B. Tech) in Mechanical
Engineering from Jawaharlal Nehru Technological University Kakinada, University
College of Engineering Vizianagaram, Andhra Pradesh, India. In the final year of
bachelors Rajesh developed a Four Bar Spherical Mechanism for a defined path. For
perusing his masters, Rajesh joined University of Texas at Arlington, Texas, US in
August 2014. Evaporative cooling used in Data Center cooling is his main area of
research. Rajesh received his Master’s degree(MS) in Mechanical Engineering from
University of Texas at Arlington in August 2016. Rajesh is admitted in to Ph.D. program
for fall 2016 in to The University of Texas at Arlington.