developing an evidence-based discharge process for
TRANSCRIPT

Grand Valley State UniversityScholarWorks@GVSU
Master's Projects Kirkhof College of Nursing
8-2019
Developing an Evidence-Based Discharge Processfor Patients on a Cardiac/Renal Acuity-AdaptableInpatient UnitTami GallagherGrand Valley State University
Follow this and additional works at: https://scholarworks.gvsu.edu/kcon_projects
Part of the Cardiology Commons, and the Nursing Commons
This Project is brought to you for free and open access by the Kirkhof College of Nursing at ScholarWorks@GVSU. It has been accepted for inclusion inMaster's Projects by an authorized administrator of ScholarWorks@GVSU. For more information, please contact [email protected].
ScholarWorks CitationGallagher, Tami, "Developing an Evidence-Based Discharge Process for Patients on a Cardiac/Renal Acuity-Adaptable Inpatient Unit"(2019). Master's Projects. 21.https://scholarworks.gvsu.edu/kcon_projects/21

DEVELOPING AN EVIDENCE-BASED DISCHARGE PROCESS 1
Developing an Evidence-Based Discharge Process for Patients on a
Cardiac/Renal Acuity-Adaptable Inpatient Unit
Tami Gallagher
Grand Valley State University

DEVELOPING AN EVIDENCE-BASED DISCHARGE PROCESS 2
Abstract
Introduction: Readmissions continue to negatively impact patient outcomes and create a
significant financial burden. Regardless of efforts to reduce readmission rates, the cost of
readmission continues to increase.
Clinical Problem: All-cause, 30-day readmission rates on a cardiac/renal acuity-adaptable
inpatient nursing unit ranged from 11% to 33% from July to December 2018 for patients
diagnosed with COPD, AMI, HF, and sepsis. The readmission rate for the organization was
16.2% in September 2018 with a target goal of 14.8%.
Project Aim: To use quality improvement tools and an interdisciplinary team to implement the
teach-back method during discharge education and a discharge preparedness checklist during
hospitalization to enhance patient education, improve patient engagement, streamline the
discharge process, improve staff and patient satisfaction with the discharge process, and reduce
the readmission rates in patients diagnosed with COPD, AMI, HF, and sepsis.
Methods: The A3 report and Improvement Kata method were used to promote progression
through the quality improvement process. A detailed process map and a root-cause analysis were
used to gain a deeper understanding of the current state. Nurse feedback on the current discharge
process was obtained through an informal survey. Inclusion and exclusion criteria were used to
determine the data collected pre- and post-implementation. Once the interventions were
implemented, iterative PDSA cycles were completed until the target conditions were met. Post-
implementation data was collected and analyzed.
Results: Use of the teach-back method during discharge education was 75%. Frequency of the
presence of the discharge preparedness checklist in the patient’s room was 42.1% and use of the
discharge preparedness checklist was 0.7%.

DEVELOPING AN EVIDENCE-BASED DISCHARGE PROCESS 3
Developing an Evidence-Based Discharge Process for Patients on a
Cardiac/Renal Acuity-Adaptable Inpatient Unit
The Centers for Medicare and Medicaid Services (CMS) implemented the Hospital
Readmission Reduction Program (HRRP) in 2012 to reduce unplanned hospital readmissions
rates (Jun & Faulkner, 2018). With the HRRP initiation, hospitals were financially penalized for
excessive readmissions for acute myocardial infarction (AMI), heart failure (HF), and
pneumonia (Boccuti & Casillas, 2017). In 2015, additional diagnoses were added to the HRRP
initiative including chronic obstructive pulmonary disease (COPD), total hip and knee
arthroplasty replacements, and coronary bypass graft surgeries (Rau, 2014). Poor patient
outcomes and the financial burden associated with readmissions validates the importance of
addressing this clinical problem at the microsystem level.
Problem Description
It is apparent that readmissions continue to negatively impact healthcare regardless of the
countless initiatives implemented. Although the readmission rates for AMI, HF, and pneumonia
began to decrease in 2012, the financial burden continued to increase (Boccuti & Casillas, 2017).
Per CMS, $17.5 billion was spent on readmissions in 2012 (Henke, Karaca, Jackson, Marder, &
Wong, 2017). The readmission expenditure further increased in 2013, costing $26 billion (Rau,
2014). Furthermore, 75% of hospitals reimbursed by Medicare were fined in 2014 for AMI, HF,
and pneumonia readmissions, with penalties totaling in $428 million (Rau, 2014). In 2017, 79%
of hospitals reimbursed by Medicare were fined for COPD, AMI, HF, pneumonia, total hip and
knee arthroplasty replacements, and coronary bypass graft surgeries, with penalties totaling in
$528 million (Boccuti & Casillas, 2017).

DEVELOPING AN EVIDENCE-BASED DISCHARGE PROCESS 4
The national readmission rate in 2018 was 14.9% for Medicare patients 65 years and
older, and Michigan ranked 42nd with an average readmission rate of 15.4% (United Health
Foundation, 2019). For 2019, the national readmission rate remains at 14.9%, and Michigan
continues to have a readmission rate of 15.4% (United Health Foundation, 2019).
Readmission rates are tracked among patients on a cardiac/renal acuity-adaptable
inpatient nursing unit in an urban, regional hospital. At the time this clinical problem was
identified, data provided by this organization’s quality dashboard reported that the all-cause, 30-
day readmission rate for the entire hospital was 16.2% in September 2018 with the
organizational target goal set at 14.8% (R.V., personal communication, January 23, 2018).
Furthermore, review of unit-level data has identified that this inpatient unit had the highest all-
cause readmission rates within the hospital, ranging from 11% to 25% in 2018 (R.V., personal
communication, November 14, 2018). Currently, the all-cause, 30-day readmission rate for this
organization is 13.1 and the readmission rate for COPD, AMI, HF, and sepsis on this particular
inpatient unit was 12.8% in February 2019, 15.9% in March 2019, and 18.8% in April 2019
(R.V., personal communication, June 4, 2019). This inpatient’s unit average readmission rate
from February through April 2019 is 15.8%, which is higher than organizational, state, and
national readmission rates.
Additionally, a unit-level review of the Hospital Consumer Assessment of the Healthcare
Providers and Systems (HCAHPS) scores identified that patients admitted to this inpatient unit
are dissatisfied with the discharge process (CMS, 2017). Once the clinical problem was
identified, a review of the HCAHPS discharge information provided domain indicated that this
inpatient unit did not consistently score at or above the 90th percentile (R.V., personal
communication, November 20, 2018). In fact, this inpatient unit had a score of 73.3 in June
DEVELOPING AN EVIDENCE-BASED DISCHARGE PROCESS 5
2018, which was the lowest score among all the inpatient units within this organization.
Furthermore, this inpatient unit discharge information provided domain score was lower in 2018
than 2017 (89.5 vs. 93.6, respectively). More current data shows the total score for the discharge
domain was 87.7% in February 2019 (below the 75th percentile), 75.3% in March 2019 (below
the 50th percentile), and 82.9% in April 2019 (below the 50th percentile) (R.V., personal
communication, July 7, 2019). Scores for the HCAHPS question “Staff talked about help when
you left”, as part of the discharge domain, were 84.2% in February 2019 (below the 50th
percentile), 62.5% in March 2019 (below the 50th percentile), and 80.0% in April 2019 (below
the 50th percentile). Scores for the HCAHPS question “Information regarding
symptoms/problems to look for”, as part of the discharge domain, were 90.0% in February 2019
(below the 75th percentile), 88.0% in March 2019 (below the 50th percentile), and 85.7% in
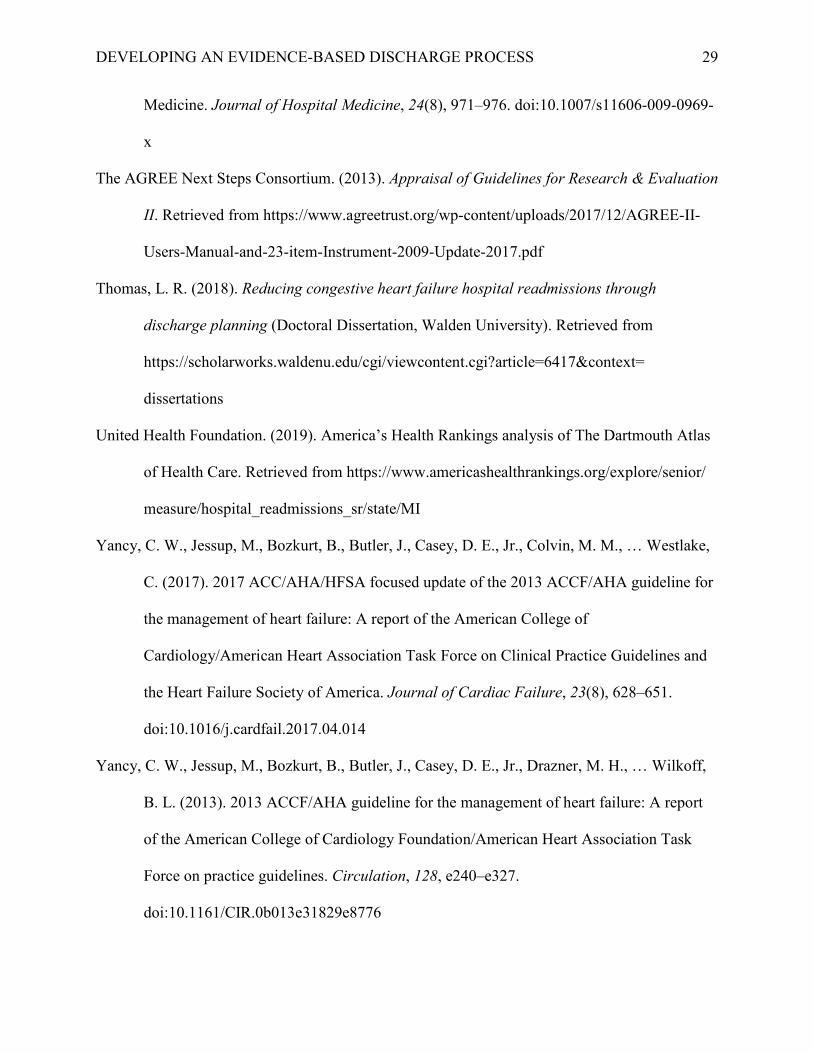
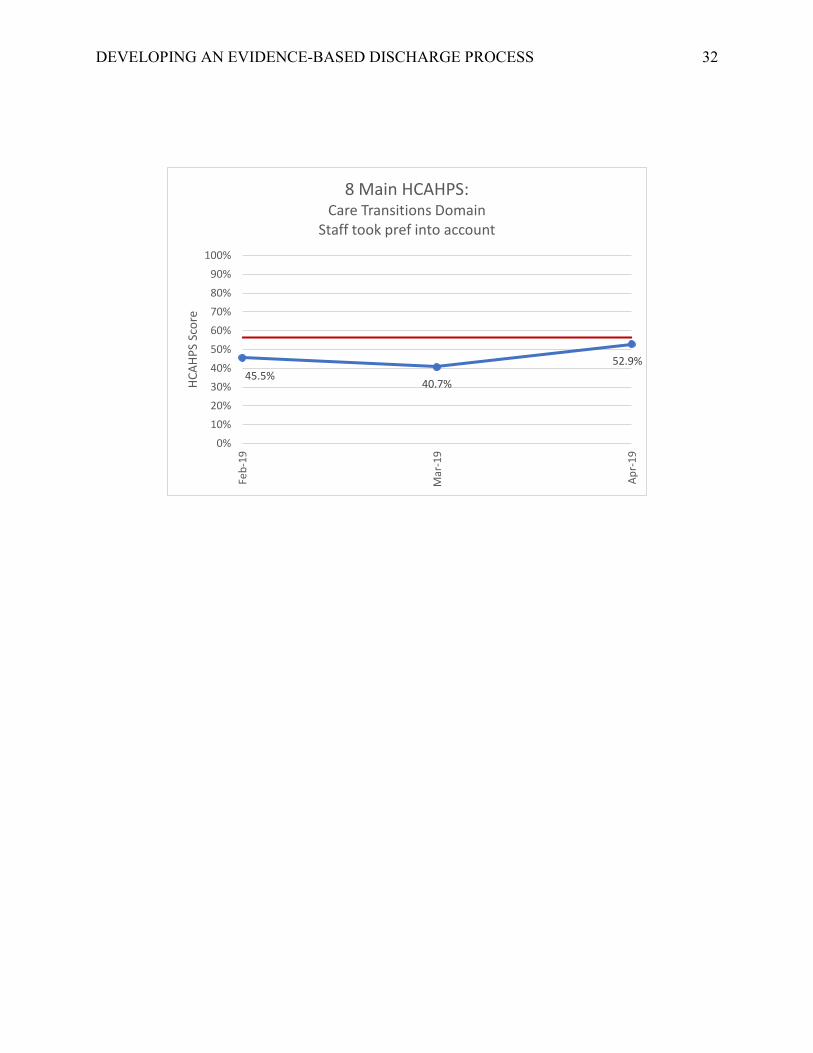
April 2019 (below the 50th percentile). Scores for the question “Staff took preference into
account”, as part of the care transitions domain, were 45.5% in February 2019 (below the 50th
percentile), 40.7% in March 2019 (below the 50th percentile), and 52.9% in April 2019 (above
the 75th percentile). Graphs depicting the above baseline data have been provided (See Appendix
A).
Auerbach et al., (2016) identified preventable readmissions are linked to insufficient
discharge planning and patient education with p-values ranging from <0.0001 to 0.01. Current
organizational guidelines surrounding the patient discharge process on this inpatient unit
emphasize the teach-back method to validate patient education and self-management
instructions. Despite having a structured discharge process, a preliminary observation of this
inpatient unit’s discharge process suggested that staff adherence to these practices are
inconsistent. Thus, these inconsistencies can lead to unnecessary and unplanned readmissions.

DEVELOPING AN EVIDENCE-BASED DISCHARGE PROCESS 6
Available Knowledge
“A hospital readmission occurs when a patient is admitted to a hospital within a specific
time period after being discharge from an earlier (initial) hospitalization” (Boccuti & Casillas,
2017, para. 7). CMS set this time frame to 30 days for all-cause readmissions, which includes all
readmissions regardless of the reason (Boccuti & Casillas, 2017). Evidence-based practice and
clinical practice guidelines (CPGs) can be used to identify and support solutions that address
gaps in the discharge process and reduce the readmission rate at the microsystem level.
Literature review. A PICOT question identifies the population of interest, intervention
and comparison of interest, expected outcome, and time frame in which the outcome will be
achieved (Melnyk & Fineout-Overholt, 2015). Using the PICOT format assists in obtaining the
best evidence in an attempt to gain the best understanding of the clinical problem (Melnyk &
Fineout-Overholt, 2015). The PICOT question related to this clinical problem is: how does
providing comprehensive discharge instructions, the utilization of the teach-back method during
the discharge education, and a discharge preparedness checklist affect 30-day readmission rates
for patients diagnosed with COPD, AMI, HF, and sepsis over the course of two months?
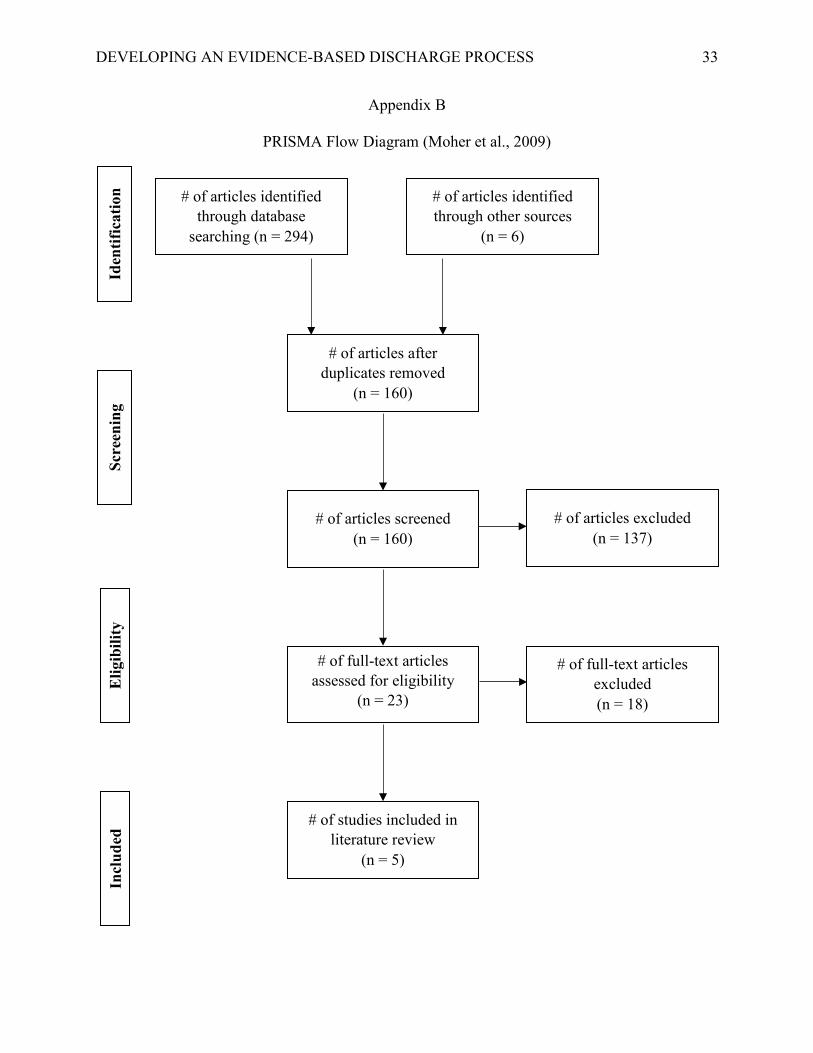
The PICOT question was used to conduct a literature review. Literary searches were done
in CINAHL, PubMed, and Web of Science databases using the key terms “teach back,” “teach
back method,” discharge education,” “discharge instructions,” “readmissions,” and “discharge
checklist.” The literary search was limited to the years from 2014 to 2018 for the purpose of
finding the most current evidence. The Preferred Reporting Items for Systematic Reviews and
Meta-Analyses (PRISMA) flow diagram created by Moher, Liberati, Tetzlaff, Altman, and the
PRISMA Group (2009) was used to outline the method used to search for evidence (see
Appendix B). The database searches resulted in 294 articles in the search result, with an

DEVELOPING AN EVIDENCE-BASED DISCHARGE PROCESS 7
additional six articles identified in secondary sources. Once duplicate articles were removed, 160
articles remained.
The articles went through a screening process to narrow the search result to those relevant
to the clinical problem. Inclusion and exclusion criteria were used during the screening process,
which were based on the microsystem’s patient population. The inclusion criteria included
English-written articles of quantitative research studies on adult patients diagnosed with COPD,
AMI, HF, and sepsis that were admitted to medical, acute-care nursing units. Articles were
excluded if the research was conducted in emergency departments and conducted on surgical
patient populations, pregnant women, and children. Additionally, articles were initially excluded
if they were master’s thesis projects or doctoral dissertations. However, due to the lack of
relevant evidence on the utilization of a discharge preparedness checklist and readmission rates,
one doctoral dissertation pertaining to this topic was included. The screening process excluded
137 articles leaving 23 articles to be further examined.
Articles were further screened by reviewing the full text of each remaining article. This
screening resulted in 18 articles being excluded, leaving five articles to include into the literature
review. The final articles included in the literature review are summarized in an evidence grid,
which include a detailed overview of the articles along with the strengths and the weaknesses of
the research methodology (see Appendix C).
In addition to research, CPGs serve as a resource to improve the quality, process, and
outcomes of care (Melnyk & Fineout-Overholt, 2015). Therefore, a literary search was
conducted to identify a relevant CPG related to the clinical problem. The CPG specific to the
care of patients with heart failure titled “2013 ACCF/AHA Guideline for the Management of
Heart Failure: A Report of the American College of Cardiology Foundation/American Heart

DEVELOPING AN EVIDENCE-BASED DISCHARGE PROCESS 8
Association Task Force on Practice Guidelines” was published in 2013 and includes
recommendations for patient education and care transitions along with recommendations specific
to diagnosing, treating, and preventing the progression of HF (Yancy et al., 2013). An update of
the CPG was published in 2017, but it did not address interventions related to discharge
education (Yancy et al., 2017). Furthermore, the literary search performed on the clinical
problem did not result in a CPG that outlined appropriate educational interventions for a
multitude of diagnoses during the discharge process. Therefore, the CPG published in 2013
relating to HF treatment will be used to address appropriate interventions for discharge
education. A detailed evaluation of the CPG using the Appraisal of Guidelines for Research and
Evaluation (AGREE II; The AGREE Next Steps Consortium, 2013) is provided (see Appendix
D).
Synthesis of the literature. Guidelines for the discharge process have been provided by
the Transitions of Care Consensus Conferences (TOCCC), The Joint Commission (TJC), and the
American College of Cardiology Foundation (ACCF) in partnership with the American Heart
Association (AHA). The TOCCC advise that comprehensive discharge instructions include the
primary diagnosis, problem list and cognitive status, medication list, outpatient providers and
organizations for follow-up care, and completed and pending test results (Snow et al., 2009). In
addition, TJC recommends that comprehensive discharge instructions include the reason for the
hospitalization, significant findings, procedures and treatment provided, patient and family
instructions, and the attending physician’s signature (Horwitz et al., 2013), and that a verbal
review of the discharge instructions is provided to the patient by the nurse (Polster, 2015).
Finally, the ACCF and the AHA created an evidence-based clinical practice guideline, which
recommends patient education and written discharge instructions be provided to patients, family
DEVELOPING AN EVIDENCE-BASED DISCHARGE PROCESS 9
members, and caregivers (Yancy et al., 2013). Furthermore, discharge education on activity, diet,
medications, follow up appointments, monitoring of weight, and symptom management has
reduced readmission rates (Yancy et al., 2013).
In addition to the mentioned guidelines, evidence has also supported the use of a
comprehensive discharge process to reduce readmission rates. One study found a reduction in
readmission rates after implementing the use of the teach-back method during discharge
education in patients with HF (Boyde et al., 2018). Additionally, Peter et al. (2015) were
successful in reducing readmission rates by 12% in HF patients by using teach-back education
throughout the hospitalization and at discharge. In addition to teach-back education, a discharge
preparedness checklist can also have an impact on the readmission rate. Thomas (2018) used
teach-back education and a discharge preparedness checklist to reduce the readmission rate
among HF patients from 22% to 1.8%.
Critique of the evidence. An extensive search was conducted for a CPG focused on
quality standards and recommendations for discharge education regardless of patient population,
which was unsuccessful. A CPG encompassing general recommendations for patient education
would be valuable to use across different patient populations and healthcare settings. CPGs
focused on providing recommendations for the diagnosis and treatment of specific diagnoses
could then be utilized to individualize patient care.
In addition to CPGs, the evidence obtained through the literary review was primarily
focused on the HF population. The literary search that was conducted did not incorporate key
words specific to any diagnosis. There is a gap in current research on the effectiveness of teach-
back education and a discharge preparedness checklist in reducing the readmission rates for
patient populations extended beyond HF.
DEVELOPING AN EVIDENCE-BASED DISCHARGE PROCESS 10
Rationale
Quality improvement models. The A3 report and the Improvement Kata (IK) model
were used to assist in the planning, implementation, and evaluation stages of this project. These
were chosen as they are utilized by the organization in quality improvement (QI) initiatives. Both
the A3 report and IK are derived from Lean methodology, which was created by Toyota to focus
on reducing waste, improving workflow, and standardizing work through the use of various tools
and methods (Nelson, Batalden, & Godfrey, 2007). The A3 report uses a standard format to
provide a succinct summary of the problem, target condition, and current state with the Plan-Do-
Study-Act (PDSA) cycle embedded to allow for rapid-cycle changes and sustainability (Scoville
& Little, 2014). The PDSA cycle allows for continuous improvement, another aspect of Lean
methodology, and rapid changes to effectively addresses gaps in care at the bedside (Scoville &
Little, 2014). Even though the PDSA cycle can be an effective QI tool, it is not recommended
that it be used as the sole method to implement any QI project (Reed & Card, 2016). “PDSA
needs to be used as part of a suite of QI methods, the exact nature of which may be influenced by
the broader methodological approach that is being followed (e.g. model for improvement, lean)”
(Reed & Card, 2016, p. 148).
The IK model is a four-step process will be used in conjunction with the A3 report and
the PDSA cycle to encourage movement towards the final target condition or challenge. The four
steps of the IK model include 1) determining a vision, 2) understanding the current state, 3)
defining the target condition, and 4) using the PDSA cycle to move towards the target condition
(Lean Enterprise Institute, 2014). By pairing these two QI methods together, a systematic
approach is used to fully understand the clinical problem (Reed & Card, 2016).

DEVELOPING AN EVIDENCE-BASED DISCHARGE PROCESS 11
The absence of a systematic approach causes chaotic, ineffective, and inefficient work
towards QI (Agency for Healthcare Research and Quality [AHRQ], 2013). It is easy to blame
individuals for poor patient outcomes, creating a punitive environment (AHRQ, 2013). By
utilizing systematic and scientific methods to implement change, the blame shifts from the
individuals to the broken processes and systems (AHRQ, 2013). The safe, systematic, and data-
driven approach of the A3 report and IK model make them appropriate to use in collaboration to
address readmission rates by focusing on the discharge process within this microsystem.
In addition to the A3 report and IK model, a detailed process map with delineated roles
and a root-cause analysis (RCA) in the form of a fishbone diagram were developed and analyzed.
The detailed process map and fishbone diagram were utilized to gain a deeper understanding of
the current state of the discharge process within the microsystem.
Proposed interventions. Based on current evidence and observations of the current
discharge process, it was hypothesized that streamlining the microsystem’s discharge process
will lead to improvements in patient satisfaction with the discharge process and a reduction in
the readmission rates. This QI project involved implementing practices changes to include the
teach-back method during discharge education and a discharge preparedness checklist to enhance
patient education and engagement. A discharge preparedness checklist was introduced to the
organization by the overarching health system. The proposed discharge preparedness checklist
was modified to meet the needs of the microsystem, and the modified discharge preparedness
checklist was implemented as one part of this QI project.
Given the magnitude of this problem, this QI project was focused on evaluating and
restructuring the discharge process, to reduce the readmissions rates at a unit level, which aligned
with the organization’s strategic plan to reduce the overall readmission rates. This is supported
DEVELOPING AN EVIDENCE-BASED DISCHARGE PROCESS 12
by evidence-based practice, which shows the use of the teach-back method during discharge
education (Axon et al., 2016; Boyde et al., 2018; Haney & Shepherd, 2014; Peter et al., 2015;
Thomas, 2018) and the use of a discharge preparedness checklist (Thomas, 2018) can
significantly reduce readmission rates.
Project Aims
Engaging an interdisciplinary team to evaluate current processes, gaps, barriers, and
bottlenecks guided by evidence-based recommendations for the discharge process to prevent
readmissions in this microsystem will culminate a streamlined process map and delineated roles,
metrics, and expected practice for improvement. The aim of this QI project was to implement the
use of teach-back method during discharge education and a discharge preparedness checklist to
enhance patient education, improve patient engagement, streamline the current discharge
process, improve staff and patient satisfaction with the discharge process, and reduce the
readmission rates in patients diagnosed with COPD, AMI, HF, and sepsis.
Methods
Overview
Once a clinical problem was identified, a microsystem assessment of the unit and
preliminary observations of the discharge process were completed. Key metrics were identified,
and baseline data was collected. Staff education was provided just prior to the implementation of
the process change. A detailed timeline has been provided (see Appendix E).
Microsystem Assessment
An assessment of the microsystem was completed using the 5Ps framework. The 5Ps
framework defines the purpose, patients, professionals, processes, and patterns of the
microsystem (Nelson, Batalden, Godfrey, & Lazar, 2011). A thorough microsystem assessment

DEVELOPING AN EVIDENCE-BASED DISCHARGE PROCESS 13
provides meaningful insights and perspectives of how a microsystem operates, which provides
the healthcare professional with the essential knowledge needed to improve patient care,
services, and system processes (Nelson et al., 2011).
Through the microsystem assessment, the purpose of the microsystem was identified as
“to provide high-quality, holistic, and patient-centered care with respect, confidence, and trust
throughout our patients’ hospital stay. We strive to bring our diverse patient population to their
optimum health through education, patient-focused outcomes, teamwork, and continuity of care”
(R.V., personal communication, August 3, 2018). This microsystem serves a variety of patient
populations over the age of 18, including those diagnosed with HF, AMI, atrial fibrillation, acute
and chronic kidney disease, kidney transplant, and vascular surgeries. Because this microsystem
strives to provide excellent care to a multitude of diagnoses using an acuity-adaptable model, the
American Association of Critical-Care Nurses Silver Beacon Award for Excellence was obtained
on March 13, 2017.
The microsystem consists of a leadership team including a clinical services director,
clinical services manager, clinical supervisor, clinical nurse leader (CNL), clinical nurse
specialist, professional developmental specialist, and eight charge nurses. Furthermore, 16% of
the registered nurses (RNs) within the microsystem hold a professional nursing certification in
either Progressive Care Certified Nursing or Certified Medical-Surgical RN. With a dedicated
leadership team and engaged staff members, QI initiatives are a focus of the microsystem. The
CNL works closely with the leadership team and staff to collect and use data for outcomes
management. Nursing sensitive indicators, patient experience, and regulatory requirements are a
priority to the microsystem. Furthermore, the organization has implemented a strategic plan,
known as People-Centered 2020, which is focused on improving patient outcomes and reducing

DEVELOPING AN EVIDENCE-BASED DISCHARGE PROCESS 14
healthcare costs. Therefore, the professionals of the microsystem embody a culture of continuous
improvement and are dedicated to providing quality patient care.
Although the staff nurses and care managers of this inpatient unit were enthusiastic about
this process change, several potential barriers to a successful implementation and sustainment
were identified during the planning phase. These barriers included: competing priorities,
resistance to change, and using a paper process for the discharge preparedness checklist.
Study of the Process Change
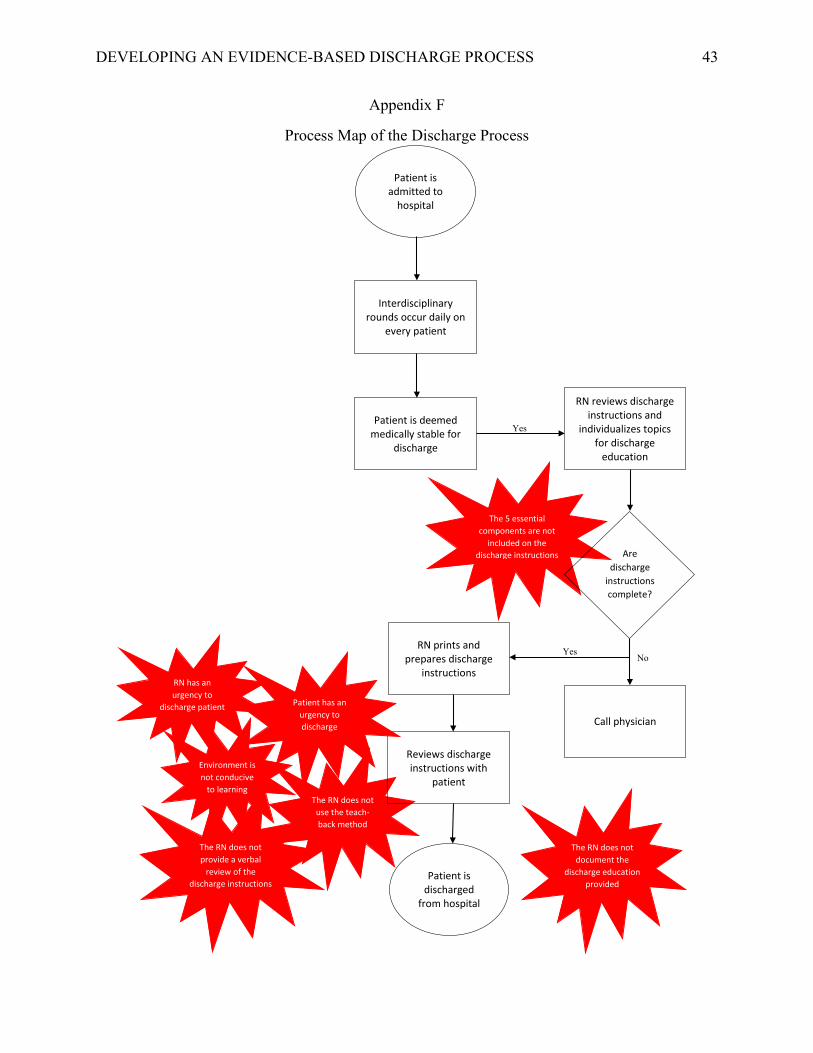
Planning phase. Preliminary observations of the discharge process were completed prior
to baseline data collection to obtain a superficial assessment. From the preliminary observations,
a detailed process map of the discharge process was created, which incorporated potential gaps
in the process (see Appendix F). The detailed process map and an RCA indicate that
comprehensive discharge instructions, teach-back education provided during discharge
education, and a discharge preparedness checklist are the appropriate interventions to address the
clinical problem. The key stakeholders for this QI project were identified through the
microsystem assessment, which included the clinical services director, clinical services manager,
CNL, two bedside nurses on day shift, members (bedside staff nurses) of the Unit-Based Council
(UBC), and the two primary care managers (CMs) specific to this inpatient unit.
Prior to all data collection, an RCA was completed on patients who met the inclusion
criteria, which provided a deeper understanding of the current state. A fishbone diagram was
utilized to brainstorm all possible causes for communication breakdown during the discharge
process (see Appendix G). The fishbone diagram was presented to the stakeholders to obtain
feedback on their perception of the current state along with the proposed interventions and
potential barriers to the success of this QI project.

DEVELOPING AN EVIDENCE-BASED DISCHARGE PROCESS 15
Each potential barrier that was identified during the microsystem assessment was
examined in detail to determine appropriate solutions. The first potential barrier, competing
priorities, was addressed by delaying the implementation date. The original date for
implementation was set for March 31, 2019, which was pushed back to May 26, 2019. The
implementation date was changed to increase staff engagement and prevent information overload
and QI burnout.
The second potential barrier identified, resistance to change, was mitigated by creating
buy-in from the early adopters of the microsystem. Early adopters are those who are motivated to
adopt new changes, and their willingness and engagement in the change stems from an
understanding of the reasoning and rationale that the change is necessary (O’Connell, 2018).
Early adopters were identified during the microsystem assessment. The microsystem’s CMs, the
UBC members, and other staff nurses who expressed interest in discharge planning were
identified as early adopters.
The third potential barrier, creating a paper process for the discharge preparedness
checklist, was identified through informal feedback from staff nurses. Staff nurses expressed
concerns about the efficiency of a paper form as it would require a standardized process to
ensure utilization and sustainment. Based on feedback from staff nurses, it was decided that 1)
the discharge preparedness checklist would be included in the welcome folders, which would be
created in advance by the health-unit secretary, 2) the welcome folder would be provided to the
patient upon admission to this inpatient unit, and 3) the staff nurse admitting the patient would
introduce the discharge preparedness checklist to the patient and place it in the clear plastic
sleeve hanging on the hook next to the whiteboard in the patient’s room.

DEVELOPING AN EVIDENCE-BASED DISCHARGE PROCESS 16
Once the clinical problem was identified, the current state was revealed, and potential
barriers were addressed, the implementation phase was initiated through the identification of
several target conditions. “A target condition should describe how your process should operate
when you are at the desired state” (Forss, 2013, para. 23). Each obstacle preventing progression
towards the final condition, or challenge, was used as a target condition to continue movement
towards the ideal state. Each target condition has been provided (see Appendix H) along with
details of each PDSA cycle (see Appendix I).
Measures. To evaluate the effectiveness of the proposed practice change, the following
metrics were selected: 30-day readmission rates for COPD, AMI, HF, and sepsis diagnoses,
HCAHPS scores for the discharge domain and care transitions domain specific to the
microsystem, feedback from the nurses’ opinion on the effectiveness of the discharge process,
chart audits on discharge instructions to ensure they are comprehensive, and observations of the
nurse providing discharge instructions to indicate if an adequate review of the discharge
instructions and teach-back education were provided (see Appendix J). Conceptual and
operational definitions were used to gain a better understanding of each metric (see Appendix
K).
Data from readmission rates was chosen to assess the effectiveness of teach-back
education and discharge preparedness in reducing readmissions within this microsystem.
Readmission rates were determined as the main outcome and lag measure used to determine
improvement. Readmission rate data for COPD, AMI, HF, and sepsis patients admitted to this
microsystem was an existing report provided by a data analyst on a monthly basis. A goal for
readmission rates was set at 14.8%, which mirrored the organization’s goal for 30-day, all-cause
readmission rates. In addition to readmission rates, a review of the HCAHPS scores for the

DEVELOPING AN EVIDENCE-BASED DISCHARGE PROCESS 17
discharge information provided domain and the care transitions domain also served as additional
outcomes and lag measures to determine if patient satisfaction with the discharge process
improved. Specifically, the scores for the following questions on the HCAHPS survey were
reviewed: the total score for the discharge information provided domain, discharge information
provided domain question “Staff talked about help when you left,” discharge information
provided domain question “Info regarding symptoms/problems to look for,” and care transitions
domain question “Staff took preferences into account.” The HCAHPS scores was an existing
report provided by the data analyst team on an organizational dashboard. Goals for each
HCAHPS survey question were set at the 90th percentile for top-box scores. The goals for each
question were: 92.1% for the total score for the discharge information provided domain, 91.2%
for “Staff talked about help when you left”, 94.6% for “Info regarding symptoms/problems to
look for”, and 56.3% for “Staff took preferences into account.” Data for both readmission rates
and HCAHPS scores were reviewed monthly.
In addition to outcome measures, process measures were chosen to ensure the discharge
process within this microsystem was streamlined. The following metrics served as process
measures. Visual audits of discharge education assessed if the nurse provided an adequate review
of the patient’s discharge instructions. Visual audits focused on the occurrence of a verbal review
of discharge instructions and use of teach-back education to encourage the patient to explain
three aspects of their discharge instructions. Initially, a goal was set to complete 50 visual audits
both pre- and post-implementation. However, lack of opportunity prevented this from occurring
during the pre-implementation phase. Therefore, the goal was modified to complete 10 visual
audits. Chart audits were also be performed to determine if all components, identified by
TOCCC, TJC, ACCF, and AHA, were addressed in the patient’s discharge instructions. Chart
DEVELOPING AN EVIDENCE-BASED DISCHARGE PROCESS 18
audits focused on the presence of follow-up appointments, a comprehensive medication list with
instructions, diet, activity, self-care management, when to call the physicians, and when to access
the emergency department. Each chart audit corresponded with the associated visual audit.
Again, a goal was set to complete 50 chart audits both pre- and post-implementation. However,
this pre-implementation goal was not attainable due to the lack of opportunity to complete visual
audits so the goal was modified to complete 10 chart audits.
Pre-implementation data collection. Pre-implementation data was collected based on
inclusion and exclusion criteria in the form of visual and chart audits. Inclusion criteria included
all patients 18 years and older, initial hospitalization admission diagnosis of COPD, AMI, HF,
and sepsis, and readmission within 30 days of the initial hospitalization. Exclusion criteria
included any patients who were readmitted after 30 days of their initial hospitalization and any
patients who were readmitted and did not have a diagnosis of COPD, AMI, HF, and sepsis on
their initial hospitalization. Both inclusion and exclusion criteria were modified to include all
diagnoses within the microsystem as completing observations for a specific population was
challenging due to the lack of opportunity.
Staff education. Prior to implementation, all staff were educated on the current state of
the discharge process along with proposed interventions at staff meetings conducted by the
clinical services manager and the CNL. This education occurred on two separate occasions.
Additionally, the members of the UBC were consulted for feedback on the process map and
fishbone diagram as well as input on effective implementation strategies. Nurse education
continued to occur throughout each phase of this QI project.
Post-implementation data collection. Due to time constraints, it was not possible to
obtain data for the lag measures as data collection ended on July 10. Therefore, post-

DEVELOPING AN EVIDENCE-BASED DISCHARGE PROCESS 19
implementation data for readmission rates and HCAHPS scores for the microsystem were not
obtained or compared to pre-implementation data. However, visual and chart audits were
completed. To ensure any drifts in the discharge process were captured, the same data that was
collected before implementation was also collected after implementation. While visual audits
captured if the nurse provided a verbal review of the discharge instructions to the patient and if
the teach-back method was used during discharge education, chart audits focused on the presence
of follow-up appointments, a comprehensive medication list with instructions, diet, activity, self-
care management, when to call the physicians, and when to access the emergency department.
The same inclusion and exclusion criteria were used during post-implementation data
collection. In addition to visual and chart audits, audits of the discharge preparedness checklist
were also conducted. These audits entailed tracking the presence of the discharge preparedness
checklist in occupied patient rooms along with documentation on the discharge preparedness
checklist. Documentation on the discharge preparedness checklist was considered completed if at
least one item on the checklist was marked off by the nurse or CM assigned to that patient. Both
audits pertaining to the discharge checklist were performed on a weekly basis starting June 3,
2019 and ending on July 10, 2019.
Analysis of Data
All pre-implementation data were analyzed to identify trends and patterns for
readmission rates, HCAHPS scores, and visual and chart audits. Run charts were utilized to
graph trends overtime for readmission rates and HCAHPS scores. “A run chart is a graphical
data display that shows trends in a measure of interest; trends reveal what is occurring over time”
(Nelson et al., 2007, p. 342). Additionally, simple bar charts were used to display frequency
distributions for the informal feedback received from staff regarding perceived use of teach-back
DEVELOPING AN EVIDENCE-BASED DISCHARGE PROCESS 20
education along with observed teach-back education used during visual audits. Per American
Society for Quality (2019), frequency distributions show how often each value within the data
set occurs, which is helpful when analyzing data.
In reviewing the pre-implementation data, it was discovered that the readmission rates
within this microsystem had a sawtooth-like pattern from July 2018 to January 2019 followed by
a gradual upward drift from January 2019 to April 2019. Furthermore, seven out of the 10 data
points were at or above the goal readmission rate of 14.8%. Regarding HCAHPS scores, all
scores for each of the four domains were consistently below the 90th percentile from February
2019 through April 2019. Unfortunately, data trends could not be deciphered with HCAHPS
scores as data were collected and graphed for only three months. However, the fact that the
HCAHPS scores were consistently below the 90th percentile solidified the concern of the impact
the current discharge processes have on patient satisfaction. Furthermore, the inconsistent pattern
of the readmission rates led to the belief that a standardize discharge process should eventually
improve readmission rates leading to a downward drift trend line and a readmission rate
consistently below 14.8%.
While reviewing data from the nine completed visual and chart audits, it was discovered
that each verbal review of discharge instructions occurred 100% of the time and each chart audit
revealed a 100% compliance rate for including follow-up appointments, a comprehensive
medication list with instructions, diet, activity, self-care management, when to call the
physicians, and when to access the emergency department. Therefore, these data points were not
graphed or trended. However, it was discovered that use of teach-back education by nursing staff
was inconsistent. In fact, the overall rate of the use of the teach-back method during discharge
education was only 22.2%. Interestingly, 17% of the staff felt they used the teach-back method
DEVELOPING AN EVIDENCE-BASED DISCHARGE PROCESS 21
during discharge education all of the time, while 25% felt they used it most of the time, and 42%
felt they used it some of the time. While 42% of the staff felt they used teach-back education
consistently, only 22.2% of the visual audits completed on discharge education actually
incorporated the teach-back method.
Ethical Considerations
A proposal for QI was submitted to the Institutional Review Board and approved as non-
human research (see Appendix L). During pre- and post-implementation data collection, no
protected health information was collected, documented, or stored. Furthermore, all data was
stored on an encrypted, password-protected website specifically for data storage. Protected
health information was not collected, documented, or stored during post-implementation data
collection. This project was undertaken as a Clinical Quality Improvement Initiative at the
organization and, as such, was not formally supervised by the organization’s Institution Review
Board per their policies.
Results
Post-implementation visual audits revealed that again there was 100% compliance with
verbal review of discharge instructions, and post-implementation chart audits showed a 100%
compliance rate for follow-up appointments, a comprehensive medication list with instructions,
diet, activity, self-care management, when to call the physicians, and when to access the
emergency department. Additionally, nurses used the teach-back method 75% of the time during
discharge education post-implementation.
Audits that were performed on the discharge preparedness checklist identified that the
discharge preparedness checklist was rarely documented on. In fact, the overall rate of the
discharge preparedness checklist being documented on was only 0.7%, as there was only one

DEVELOPING AN EVIDENCE-BASED DISCHARGE PROCESS 22
occurrence out of 152 audits performed. Additionally, the overall rate for the presence of the
checklist in occupied patient rooms was 42.1%. More specifically, the rate that the discharge
preparedness checklist was in occupied patient rooms was 47.4% during the week of June 3,
2019, 53.8% during the week of June 10, 2019, 43.3% during the week of June 17, 2019, 41.4%
during the week of June 24, 2019, 38.1% during the week of July 1, 2019, and 29.6% during the
week of July 8, 2019. All results were presented using the A3 report to the key stakeholders.
Additionally, results were posted in a common work area on the unit for all staff to review.
Discussion
Key Findings and Interpretation
A comparative analysis was used to assess for any improvement in either intervention
between pre- to post-implementation. Because the goals for teach-back education and the
discharge preparedness checklist were not achieved, the results were not clinically significant for
either intervention. However, utilization of teach-back education increased from 22% pre-
implementation to 75% post-implementation. A substantial improvement was made, and it is
likely the goal of 80% compliance could be achieved with additional PDSA cycles involving
staff reminders and close monitoring.
Thomas (2018) reduced readmission rates in CHF patients from 22% to 1.8% though the
utilization of teach-back education and a discharge checklist. Additionally, teach-back education
has been used as the sole intervention in effectively reducing readmission rates (Haney &
Shepherd, 2014; Peter et al., 2015; Thomas, 2018). Although post-implementation readmission
rates were not obtained due to time constraints, it is still believed that the discharge preparedness
checklist and use of teach-back education can reduce readmission rates. However, a reduction in

DEVELOPING AN EVIDENCE-BASED DISCHARGE PROCESS 23
readmission rates would likely not occur until the processes for use of teach-back education and
the discharge preparedness checklist were successful, consistent, and sustained.
Strengths
The planning phase of this QI project used an extensive approach, which contributed to
increased staff engagement, successful implementation of the interventions, and likelihood of
sustainability. The planning phase included a thorough literary review to ensure the proposed
interventions were supported by evidence-based practice. Additionally, the planning phase also
involved identifying and defining metrics specific to the clinical problem and collecting pre-
implementation data.
As previously mentioned, this microsystem’s clinical staff and leadership team were
supportive and engaged during the planning, implementation, and evaluations phases of this QI
project. The engagement of the clinical staff and leadership team was maintained through this
process by creating opportunities for feedback and suggestions of the processes implemented.
Because of this engagement, the clinical staff remained positive regardless of the results and felt
it was necessary to continue this project.
Limitations
This QI project had several limitations. The small sample sizes used in this QI project
was identified as one limitation. Due to time constraints and lack of availability, visual audits
performed on nursing staff providing discharge instructions and education were limited.
However, the sample sizes used were able to provide the necessary data to identify gaps and
trends in the discharge process. Furthermore, the patient population included was specific to
cardiac, renal, and vascular diagnoses. Due to the small sample sizes and the specific patient
population, the generalizability of this QI project is limited.
DEVELOPING AN EVIDENCE-BASED DISCHARGE PROCESS 24
This microsystem’s patient population commonly includes patients who are not agreeable
to participate in certain aspects of their care. On several occurrences after the implementation
phase of this QI project, patients refused to review discharge planning with the nurse regardless
of the attempts made. Another hospital under the same overarching health system that
implemented the same discharge preparedness checklist had compliance and adherence rates
consistently at or above 80%. However, this hospital disclosed that the discharge preparedness
checklist was only presented and utilized in patients who were willing and appropriate. This QI
project implemented the discharge preparedness checklist with the goal that every patient within
the microsystem would have the opportunity to utilize the tool. If this QI project included a
process to screen patients for willingness and appropriateness, the compliance with the discharge
preparedness checklist may have been closer to, at, or above the goal of 80%. Despite this
knowledge, the clinical staff felt it was appropriate to use this discharge preparedness checklist
on every patient within the microsystem so families and support systems could also benefit from
the tool in cases where the patient could not directly use it.
Sustainment Plan
A sustainment plan was created during the planning phase and modified during the
implementation and evaluation phases to accommodate for the fluidity of the healthcare setting.
At the close of this QI project, the UBC stated they would continue to monitor the use of the
discharge preparedness checklist on a monthly basis. Furthermore, the CNL functioning within
this microsystem was provided a handoff along with the A3 report, pre- and post-implementation
data, and graphs. It was suggested that iterative PDSA cycles continue until use of the discharge
preparedness checklist is consistent. It was also suggested that monitoring of teach-back
education continued until the adherence consistently remains at or above 80%. Once the

DEVELOPING AN EVIDENCE-BASED DISCHARGE PROCESS 25
processes for teach-back education and the use of the discharge preparedness checklist are
standardized and sustained, the readmission rates and HCAHPS scores should be collected and
trended to determine the presence of a causal relationship. These processes have a high
likelihood of sustainability if the above suggestions are pursued.
Conclusion
The CNL is a master’s-prepared nurse that can utilize improvement science methods to
address clinical problems. “Through assessment, critiquing, and analysis of information sources,
the CNL becomes an informed consumer, thus enhancing synthesis of knowledge to evaluate and
achieve optimal patient outcomes” (Harris et al., 2018, p. 209). Furthermore, the American
Association of Colleges of Nursing (2011) has identified the CNL as a change agent who has the
appropriate knowledge to identify problems in the clinical setting and the ability to use the
appropriate tools to improve the quality of patient care. Although results of this QI project were
not clinically significant, use of teach-back education increased substantially after
implementation. Teach-back education and a discharge preparedness checklist have the potential
of improving the quality of care, preventing unnecessary healthcare expenditures that are
associated with readmissions, and enhancing patient and staff satisfaction with the discharge
process. Therefore, future work should continue to focus on strengthening the evidence-based
practices of utilizing teach-back education and a discharge preparedness checklist to promote and
streamline discharge planning.
Funding Disclosures
No funding from any organization or grants of any kind were provided or used for this QI
project.

DEVELOPING AN EVIDENCE-BASED DISCHARGE PROCESS 26
References
Agency for Healthcare Research and Quality. (2013). Practice facilitation handbook: Module 4.
Approaches to quality improvement. Retrieved from https://www.ahrq.gov/professionals/
prevention-chronic-care/improve/system/pfhandbook/mod4.html
American Society for Quality. (2019). The 7 basic quality tools for process improvement.
Retrieved from https://asq.org/quality-resources/seven-basic-quality-tools
Axon, R. N., Cole, L., Moonan, A., Foster, R., Cawley, P., Long, L., & Turley, C. B. (2016).
Evolution and initial experience of a statewide care transitions quality improvement
collaborative: Preventing avoidable readmissions together. Population Health
Management, 19(1), 4–10. doi:10.1089/pop.2014.0182
Boccuti, C., & Casillas, G. (2017). Aiming for fewer hospital u-turns: The Medicare Hospital
Readmission Reduction Program. Retrieved from https://www.kff.org/medicare/issue-
brief/aiming-for-fewer-hospital-u-turns-the-medicare-hospital-readmission-reduction-
program/
Boyde, M., Peters, R., New, N., Hwang, R., Ha, T., & Korczyk, D. (2018). Self-care educational
intervention to reduce hospitalisations in heart failure: A randomised controlled trial.
European Journal of Cardiovascular Nursing, 17(2), 178–185.
doi:10.1177/1474515117727740
Centers for Medicare & Medicaid Services. (2017). HCAHPS: Patients’ perspectives of care
survey. Retrieved from https://www.cms.gov/Medicare/Quality-Initiatives-Patient-
Assessment-Instruments/HospitalQualityInits/HospitalHCAHPS.html
Forss, H. (2013). Toyota Kata: Habits for continuous improvements. Retrieved from
http://www.methodsandtools.com/archive/toyotakata.php

DEVELOPING AN EVIDENCE-BASED DISCHARGE PROCESS 27
Haney, M., & Shepherd, J. (2014). Can teach-back reduce hospital readmissions? American
Nurse Today, 9(3), 50–52. Retrieved from https://www.americannursetoday.com/can-
teach-back-reduce-hospital-readmissions/
Henke, R. M., Karaca, Z., Jackson, P., Marder, W. D., & Wong, H. S. (2017). Discharge
planning and hospital readmissions. Medical Care Research and Review, 74(3), 345–368.
doi:10.1177/1077558716647652
Horwitz, L. I., Jenq, G. Y., Brewster, U. C., Chen, C., Kanade, S., Van Ness, P. H., …
Krumholz, H. M. (2013). Comprehensive quality of discharge summaries at an academic
medical center. Journal of Hospital Medicine, 8(8), 436–443. doi:10.1002/jhm.2021
Jun, J., & Faulkner, K. M. (2018). Scoping review: Hospital nursing factors associated with 30-
day readmission rates of patients with heart failure. Journal of Clinical Nursing, 27,
e1673–e1683. doi:10.1111/jocn.14323
Lean Enterprise Institute. (2014). Lean Lexicon: A graphical glossary for lean thinkers (5th ed.).
Cambridge, MA: Lean Enterprise Institute.
Melnyk, B., & Fineout-Overholt, E. (2015). Evidence-based practice in nursing and healthcare:
A guide to best practice (3rd ed.). Philadelphia, PA: Lippincott, Williams, & Wilkins.
Moher, D., Liberati, A., Tetzlaff, J., Altman, D. G., & The PRISMA Group. (2009). Preferred
Reporting Items for Systematic Reviews and Meta-Analyses: The PRISMA statement.
Public Library of Science Medicine, 6(6), e1000097.
doi:10.1371/journal.pmed.1000097.g001
Nelson, E. C., Batalden, P. B., & Godfrey, M. M. (2007). Quality by design: A clinical
microsystems approach. San Francisco, CA: Jossey-Bass.

DEVELOPING AN EVIDENCE-BASED DISCHARGE PROCESS 28
Nelson, E. C., Batalden, P. B., Godfrey, M. M., & Lazar, J. S. (2011). Value by design:
Developing clinical microsystems to achieve organizational excellence (2nd ed.). San
Francisco, CA: Jossey-Bass.
O’Connell, B. (2018). What is diffusion of innovation and why is it important in 2019? Retrieved
from https://www.thestreet.com/technology/what-is-diffusion-of-innovation-14804157
Peter, D., Robinson, P., Jordan, M., Lawrence, S., Casey, K., & Salas-Lopez, D. (2015).
Reducing readmissions using teach-back: Enhancing patient and family education. The
Journal of Nursing Administration, 45(1), 35–42. doi:10.1097/NNA.0000000000000155
Polster, D. (2015). Preventing readmissions with discharge education: Arm your patients with
tools for success. Nursing Management, 46(10), 30–37.
doi:10.1097/01.NUMA.0000471590.62056.77
Rau, J. (2014). Medicare fines 2,610 hospitals in third round of readmission penalties. Retrieved
from https://khn.org/news/medicare-readmissions-penalties-2015/
Reed, J. E., & Card, A. J. (2016). The problem with the Plan-Do-Study-Act cycles. British
Medical Journal Quality & Safety, 25(3), 147–152. doi:10.1136/bmjqs-2015-005076
Scoville, R., & Little, K. (2014). Comparing lean and quality improvement. Institute for
Healthcare Improvement. White Paper. Retrieved from http://www.ihi.org/resources/
Pages/IHIWhitePapers/ComparingLeanandQualityImprovement.aspx
Snow, V., Beck, D., Budnitz, T., Miller, D. C., Potter, J., Wears, R. L., … Williams, M. V.
(2009). Transitions of Care Consensus policy statement American College of Physicians-
Society of General Internal Medicine-Society of Hospital Medicine-American Geriatrics
Society-American College of Emergency Physicians-Society of Academic Emergency
DEVELOPING AN EVIDENCE-BASED DISCHARGE PROCESS 29
Medicine. Journal of Hospital Medicine, 24(8), 971–976. doi:10.1007/s11606-009-0969-
x
The AGREE Next Steps Consortium. (2013). Appraisal of Guidelines for Research & Evaluation
II. Retrieved from https://www.agreetrust.org/wp-content/uploads/2017/12/AGREE-II-
Users-Manual-and-23-item-Instrument-2009-Update-2017.pdf
Thomas, L. R. (2018). Reducing congestive heart failure hospital readmissions through
discharge planning (Doctoral Dissertation, Walden University). Retrieved from
https://scholarworks.waldenu.edu/cgi/viewcontent.cgi?article=6417&context=
dissertations
United Health Foundation. (2019). America’s Health Rankings analysis of The Dartmouth Atlas
of Health Care. Retrieved from https://www.americashealthrankings.org/explore/senior/
measure/hospital_readmissions_sr/state/MI
Yancy, C. W., Jessup, M., Bozkurt, B., Butler, J., Casey, D. E., Jr., Colvin, M. M., … Westlake,
C. (2017). 2017 ACC/AHA/HFSA focused update of the 2013 ACCF/AHA guideline for
the management of heart failure: A report of the American College of
Cardiology/American Heart Association Task Force on Clinical Practice Guidelines and
the Heart Failure Society of America. Journal of Cardiac Failure, 23(8), 628–651.
doi:10.1016/j.cardfail.2017.04.014
Yancy, C. W., Jessup, M., Bozkurt, B., Butler, J., Casey, D. E., Jr., Drazner, M. H., … Wilkoff,
B. L. (2013). 2013 ACCF/AHA guideline for the management of heart failure: A report
of the American College of Cardiology Foundation/American Heart Association Task
Force on practice guidelines. Circulation, 128, e240–e327.
doi:10.1161/CIR.0b013e31829e8776

DEVELOPING AN EVIDENCE-BASED DISCHARGE PROCESS 30
Appendix A
Baseline Data
87.7%
75.3%82.9%
0%
10%
20%
30%
40%
50%
60%
70%
80%
90%
100%
Feb-
19
Mar
-19
Apr-
19
HCAH
PS S
core
8 Main HCAHPS:Discharge Domain Total
33.3%n=13
14.8%n=4
32.3%n=10
16.3%n=8
11.1%n=5
21.1%n=8
10.0%n=4
12.8%n=5
15.9%n=7
18.8%n=6
0%
5%
10%
15%
20%
25%
30%
35%Ju
l-18
Aug-
18
Sep-
18
Oct
-18
Nov
-18
Dec-
18
Jan-
19
Feb-
19
Mar
-19
Apr-
19
Read
miss
ion
Rate
8 Main Readmission Rate

DEVELOPING AN EVIDENCE-BASED DISCHARGE PROCESS 31
90.0% 88.0% 85.7%
0%10%20%30%40%50%60%70%80%90%
100%Fe
b-19
Mar
-19
Apr-
19
HCAH
PS S
core
8 Main HCAHPS:Dicharge Domain
Info re symptoms/prob to look for
84.2%
62.5%
80.0%
0%10%20%30%40%50%60%70%80%90%
100%
Feb-
19
Mar
-19
Apr-
19
HCAH
PS S
core
8 Main HCAHPS:Discharge Domain
Staff talked about help when you left
DEVELOPING AN EVIDENCE-BASED DISCHARGE PROCESS 32
45.5%40.7%
52.9%
0%10%20%30%40%50%60%70%80%90%
100%Fe
b-19
Mar
-19
Apr-
19
HCAH
PS S
core
8 Main HCAHPS:Care Transitions Domain
Staff took pref into account
DEVELOPING AN EVIDENCE-BASED DISCHARGE PROCESS 33
Appendix B
PRISMA Flow Diagram (Moher et al., 2009)
# of articles identified through database
searching (n = 294)
# of articles identified through other sources
(n = 6)
# of articles screened (n = 160)
# of articles after duplicates removed
(n = 160)
# of full-text articles assessed for eligibility
(n = 23)
# of studies included in literature review
(n = 5)
# of articles excluded (n = 137)
# of full-text articles excluded (n = 18)
Iden
tific
atio
n Sc
reen
ing
Elig
ibili
ty
Incl
uded

DEVELOPING AN EVIDENCE-BASED DISCHARGE PROCESS 34
Appendix C
Evidence Grid (Melnyk & Fineout-Overholt, 2015)
Citations Conceptual Framework
Design/ Method
Sample/ Setting
Major Variables
Measurement of Major Variables
Data Analysis Study Findings
Appraisal of Worth to Practice
Axon, R. N., Cole, L., Moonan, A., Foster, R., Cawley, P., Long, L., Turley, C. B. (2016) Evolution and initial experience of a statewide care transitions quality improvement collaborative: Preventing avoidable readmissions together
Batalden and Berwick’s principles in Breakthrough Series Collabora- tives led by IHI IHI State Action on Avoidable Rehospitaliz-ations (STAAR) program
Prospective research design Purpose: Design/ implement a statewide program to reduce readmissions PART program involved statewide education, a 3-month planning phase, and subsequent action phases implementing different transitional strategies (dependent variables)
Sample: Acute care hospitals (n=59) and hospital systems (n = 9) Setting: N = 19 rural hospitals n = 40 urban hospitals
Independent variable: Readmission rates Dependent variables: Risk assessment; teach-back education; follow-up phone calls; follow-up appoint- ments; transition record; discharge summaries; transition coaches; multidiscip-linary rounds
2x2 McNemar test (tested for significance between proportions of readmissions for 2009-2011 and 2011-2013) Paired-sample t test (tested for significance in readmission rates between 2009-2011 and 2011-2013)
Readmission data: all-cause (7-day and 30-day), rates organized by payer and diagnosis (COPD, AMI, HF, and pneumonia) Transitional strategies: hospitals filled out surveys indicating the adopted strategies and the implem-entation phases of each strategy
Multidiscip-linary rounds and follow-up phone calls were implemented by 58% of the hospitals Teach-back education was implemented by 32% of the hospitals More hospitals had decreased readmission rates for AMI (p = 0.03) COPD, HF, and pneumonia readmission rates were not significant
Strengths: large sample size (59 out of 64 hospitals in South Carolina) Limitations: QI skills varied between hospitals, hospitals did not consistently report their data, single-state initiative, unable to control for extraneous variables

DEVELOPING AN EVIDENCE-BASED DISCHARGE PROCESS 35
Boyde, M., Peters, R., New, N., Hwang, R., Ha, T., Korczyk, D. (2018) Self-care educational intervention to reduce hospitalisations in heart failure: A randomized controlled trial
Adult learning/ andragogy
Randomized controlled trial using computer-generated sequence; prospective study design Intervention group: participants learning needs were assessed; DVD and written manual on HF; 60 to 90-minute teaching session including teach back
Sample: n = 200 (269 excluded; n = 100 in each group); Inclusion criteria and exclusion criteria provided Setting: single centre tertiary referral hospital
Independent variable: teach-back education Dependent variables: All cause unplanned readmission rates; HF related readmission rates; knowledge; self-care maintenance; management; confidence
Dutch Heart Failure Knowledge Scale (DHFKS; measures HF knowledge, treatment, symptoms); Self-Care of Heart Failure Index (SCHFI; measures self-care maintenance, management, confidence) Pearson’s chi squared and student’s t-tests (determined if randomiza-tion was adequate) Pearson’s chi squared tests (compared readmissions between control and intervention group)
At 12 months, the intervention group had less readmissions (59 vs. 44; p = 0.005; the only statistically significant finding) Knowledge, self-care maintenance, management, and confidence were measured with DHFKS and SCHFI Descriptive statistics were provided for baseline demograph-ics
Readmission rates: 28-day and 3-month intervals weren’t statistically significant; at 12 months the interven-tion group had less readmissions Knowledge and self-care maintenance, management, and confidence: no statistical difference between control and intervention groups at 3- or 12-month intervals
Strengths: RCT, scripting used for follow-up phone calls Limitations: single site only, follow-up phone calls were not blinded, SCHFI is based on self-reports (not direct observations), unable to control for further education outside of setting No risk of harm if study interventions are trialed

DEVELOPING AN EVIDENCE-BASED DISCHARGE PROCESS 36
Haney, M., Shepherd, J. (2014) Can teach-back reduce hospital readmissions?
None mentioned
“Educational study” Prospective design High-risk HF patients were consented (identified by HF NP) Study period: 11/1/2012 through 4/30/2013 High-risk HF patients received 60-minute teach-back education (given by PI and co-PI) Follow-up phone calls assessed HF knowledge Goal: 13.8% readmission rate for all HF patients
Sample: n = 23 HF patients considered high-risk Setting: An acute-care hospital in Arkansas
Independent variable: teach-back education Dependent variables: all-cause readmi-ssions, HF readmissions, HF know-ledge
No statistical tests were reported Chart were audited for 30 days after the participants were discharged to monitor readmissions HF NP used scripting during follow-up phone calls (completed at 72 hours postdischarge and weekly)
Readmission data: all-cause and HF readmission within 30 days of discharge Assessment of HF knowledge (follow-up phone calls): The 72-hour phone call asked “What’s one thing you learned from your teach-back session” The weekly phone call asked “Have you made any lifestyle changes to manage your heart failure at home since your teach-back session? If yes, what were the changes? If no, why not?”
No statistical results were reported 13% (n = 3) of the sample were readmitted within 30 days (one readmission was related to HF) 16.2% was the average readmission rate (for all HF patients who did and didn’t receive the teach-back education) during the study period HF knowledge assessment: n=10 made lifestyle changes
Strengths: standardized HF education was provided, follow-up phone call questions were standardized Limitations: Small sample size, statistical tests and results were not reported

DEVELOPING AN EVIDENCE-BASED DISCHARGE PROCESS 37
Peter, D., Robinson, P., Jordan, M., Lawrence, S., Casey, K., Salas-Lopez, D. (2015) Reducing readmissions using teach-back: Enhancing patient and family education
None mentioned
Quality-improvement method using Lean Data was collected via observations, chart audits, and question-naires Purpose: 1. Create a standardized process to identify a “key learner” for the patient 2. Effectively evaluate the identified “key learner’s” educational needs Team was multidiscip-linary
Sample: n = 1488 individuals completed the learning module; n = 137 individuals attended train-the-trainer work-shops; n = 469 patients were sampled Setting: Tertiary Magnet facility
Independent variables: Teach-back education, adequate documenta-tion, identification of “key learner,” assessment of “key learner’s” educational needs, assessment of patient’s retention of knowledge, attitude, and behavior on HF Dependent variables: Readmission rates, 2nd-stay average length of stay
HF teach-back questions (from IHI recommend-ations) Patients were asked 4 teach-back questions every day (Day 1: knowledge Day 2: attitudes Day 3: behaviors) Readmission rates and 2nd stay average length of stay prior to implementa-tion vs. post implementa-tion
No p-values or other statistics were reported Readmission rates were tracked Readmission rates were lower when patients received teach-back education Data was collected on the patient’s knowledge, attitude, and behavior about HF
n = 200 patients were provided HF education using teach-back method from January-June 2010 Knowledge average score: 94% Attitude average score: 85% Behavior average score: 90% Readmission rates for HF patients decreased by 12% from July 2010-July 2011 Decrease in 2nd average length of stay
Strengths: Large amount of staff were educated; data was collected over a long period of time (1 year); large patient sample Limitations: Behavior may not be impacted by knowledge, baseline data was not collected prior to implementing the HF teach-back questions No risk of harm if QI project is implemented Project is feasible

DEVELOPING AN EVIDENCE-BASED DISCHARGE PROCESS 38
Thomas, L. R. (2018) Reducing congestive heart failure hospital readmissions through discharge planning
HRRP Project RED Iowa model
QI project using the Iowa model to: 1. Select a topic 2. Form a team 3. Retrieve evidence 4. Grade evidence 5. Develop an EBP standard 6. Implement and evaluate Nurse education (using risk stratification tool scores to determine the correct discharge checklist to use; proper teach-back education techniques)
Sample: n = 193 patients Predominat-ely African American, lower-middle class; n = unknown number of nurses involved (convenience sample) Setting: 471-bed hospital (rural area; serves 11 counties) 34-bed step-down cardiology unit
Independent variables: Teach-back education, discharge checklist Dependent variables: Readmission rates
Use of the correct discharge checklist based on the risk stratification tool score Readmission rates
No p-values reported 30-day readmission rates were tracked for CHF patients
n = 106 (CHF); CHF readmission rate 1 month after implement-ation: 1.8% (from 22%) Readmission rate for CHF with a high-risk stratification score: 8.6%
Strengths: Interdiscipl-inary engagement; decent sample size for a QI project Weaknesses: post- implement-ation data is preliminary (only 1 month out); risk stratification tool is used by case managers (implemented at the same time); limited to CHF patients

DEVELOPING AN EVIDENCE-BASED DISCHARGE PROCESS 39
Appendix D
AGREE II Appraisal of the Guideline (The AGREE Next Steps Consortium, 2013)
Citation Overall Guideline
Assessment (Initial)
Domain 1. Scope and Purpose
Domain 2. Stakeholder Involvement
Domain 3. Rigour of
Development
Domain 4. Clarity of
Presentation
Domain 5. Applicability
Domain 6. Editorial
Independence
Overall Guideline
Assessment
Yancy et al. (2013) 2013 ACCF/AHA guideline for the management of heart failure: A report of the American College of Cardiology Foundation/ American Heart Association Task Force on practice guidelines
Rating: 7 Based on a superficial evaluation of professional-ism, organi-zation, and comprehen- siveness of the CPG
Aim was hard to find but is implied in the Preamble and in a section describing cardiomyo-pathy. Table of contents and headings allow easy identification of health questions Adult patients are the target population; Excluded children and adult patients with congenital heart lesions; HF is defined in detail
Included physicians from multiple specialties and multiple professional organizations and one nurse Did not include stakeholders from other disciplines (Nutrition, pharmacy, therapy) Patient preferences influenced recommenda-tions (Continued on next page)
Key terms and databases searched are provided; Criteria for selecting evidence is not stated Limitations of evidence is discussed; evidence supporting each recommenda-tion is graded Methods used to formulate evidence is explained; COR and LOE grading are used (Continued on next page)
Evaluated Domain 4 on patient education guidelines Recommend-ations for patient education are clear; specific topics for education are provided Alterative recommenda-tions are not provided other than including patient’s caregivers Bullet format; easy to read
No formal implementa-tion section discussing applicability There is mention of the effective-ness of using nurse educators to provide discharge education “Clinical support tools” are mentioned; specific tools are not discussed Monitoring of recommenda-tions are suggested
No apparent bias Conflicts of interest are disclosed in full detail Rigorous process used to review and publish CPG reduced the risk of bias
Rating: 6 Would recommend with modifications Key Suggestions Include other disciplines in the development of CPG Address the procedure for updating the CPG Formally address applicability of recommenda-tions

DEVELOPING AN EVIDENCE-BASED DISCHARGE PROCESS 40
Citation Overall Guideline
Assessment (Initial)
Domain 1. Scope and Purpose
Domain 2. Stakeholder Involvement
Domain 3. Rigour of
Development
Domain 4. Clarity of
Presentation
Domain 5. Applicability
Domain 6. Editorial
Independence
Overall Guideline
Assessment (Final)
Yancy et al. (2013) 2013 ACCF/AHA guideline for the management of heart failure: A report of the American College of Cardiology Foundation/ American Heart Association Task Force on practice guidelines
No discussion on the meth-odology on obtaining patient input Target users are implied. CPG identifies “clinicians” as target users and implies payers and researchers are users
Recommend-ations are supported by evidence throughout Several individuals from professional organizations reviewed the CPG Procedure for updating the guideline is not explained
ACCF = American College of Cardiology Foundation; AHA = American Heart Association; CPG = clinical practice guideline; COR = Class of Recommendation; LOE = Level of Evidence

DEVELOPING AN EVIDENCE-BASED DISCHARGE PROCESS 41
Appendix E
Timeline for QI Project
Activity Completion Date(s) Complete microsystem assessment August 2018 Identified readmission rates are linked to understanding of discharge instructions August 23, 2018
Met with data analyst to discuss current process for collecting data on readmissions specific to unit
August 23, 2018
Discussed QI project with unit leadership team to gain support August 23, 2018
Met with project advisor to discuss project scope and IRB process October 24, 2018
Defined the clinical problem October 24, 2018
Observed the discharge process on the unit October 24, 2018 November 14, 2018 November 20, 2018
Meeting with Process Excellence to discuss appropriate QI models January 16, 2019
Meeting with finance specialist and data analyst to discuss project metrics January 23, 2019
Care Coordination meeting with Trinity Health to discuss discharge preparedness checklist
January 23, 2019
IRB Submission February 5, 2019 IRB Approval February 11, 2019
Complete visual audits (observe discharges) and chart audits on discharge instructions
February 20, 2019 February 27, 2019 March 20, 2019 March 21, 2019 March 27, 2019
Obtain feedback from nurses and CC on current discharge process February 21, 2019 – March 22, 2019
Prepare for staff meeting to introduce QI project February 21, 2019
Update A3 and fishbone diagram February 28, 2019
Present clinical problem and proposed intervention to staff at staff meetings
March 26, 2019 March 27, 2019 March 28, 2019
Obtain feedback from nurses and CC on discharge preparedness checklist
May 2, 2019 May 8, 2019
Prepare for staff meeting to discuss implementation plan of scholarly project May 8, 2019
Present implementation plan of scholarly project to staff at staff meetings
May 13, 2019 May 14, 2019 May 15, 2019

DEVELOPING AN EVIDENCE-BASED DISCHARGE PROCESS 42
Implement ⋅ Add discharge preparedness checklist to
welcome folders ⋅ Place discharge preparedness checklist in
clear sleeves ⋅ Place sleeves in each patient room on
designated hooks ⋅ Educate nurses ⋅ Place information on shift huddle board
May 29, 2019
Display baseline data on unit IK board May 30, 2019
Document IK process ⋅ Define target condition ⋅ Document PDSA cycles
June 5, 2019 June 12, 2019 June 19, 2019 July 3, 2019 July 10, 2019
Audit use of discharge preparedness checklist
June 5, 2019 June 12, 2019 June 19, 2019 July 3, 2019 July 10, 2019
Audit use of teach-back education
June 19, 2019 June 26, 2019 July 3, 2019 July 10, 2019
DEVELOPING AN EVIDENCE-BASED DISCHARGE PROCESS 43
The 5 essential components are not
included on the discharge instructions
Patient is admitted to
hospital
Interdisciplinary rounds occur daily on
every patient
Patient is deemed medically stable for
discharge
RN reviews discharge instructions and
individualizes topics for discharge
education
Are discharge
instructions complete?
Call physician
RN prints and prepares discharge
instructions No
Yes
Patient is discharged
from hospital
The RN does not use the teach-back method
Environment is not conducive
to learning
The RN does not document the
discharge education provided
The RN does not provide a verbal
review of the discharge instructions
Reviews discharge instructions with
patient
Patient has an urgency to discharge
RN has an urgency to
discharge patient
Yes
Appendix F
Process Map of the Discharge Process

DEVELOPING AN EVIDENCE-BASED DISCHARGE PROCESS 44
Appendix G
Fishbone Diagram for Discharge Process
DEVELOPING AN EVIDENCE-BASED DISCHARGE PROCESS 45
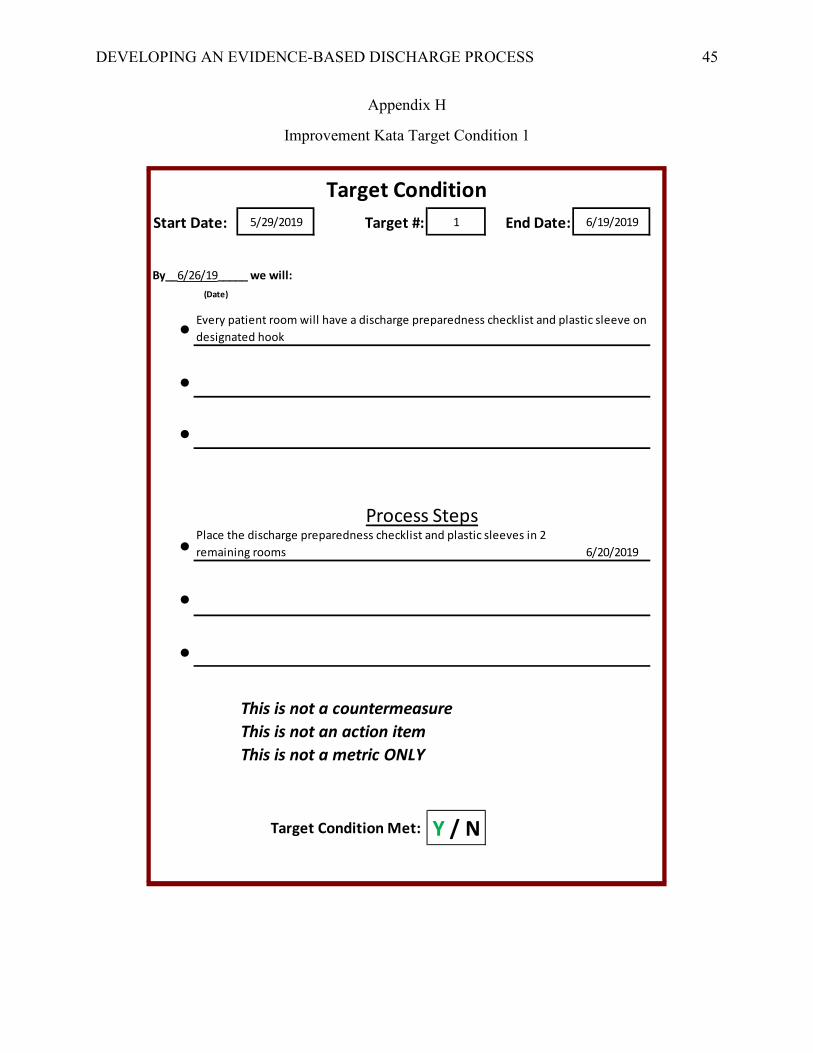
Appendix H
Improvement Kata Target Condition 1
Start Date: 5/29/2019 Target #: 1 End Date: 6/19/2019
(Date)
•
•
•
• 6/20/2019
•
•
This is not a countermeasureThis is not an action itemThis is not a metric ONLY
Y / NTarget Condition Met:
Target Condition
By__6/26/19_____ we will:
Every patient room will have a discharge preparedness checklist and plastic sleeve on designated hook
Process StepsPlace the discharge preparedness checklist and plastic sleeves in 2 remaining rooms

DEVELOPING AN EVIDENCE-BASED DISCHARGE PROCESS 46
Improvement Kata Target Condition 2
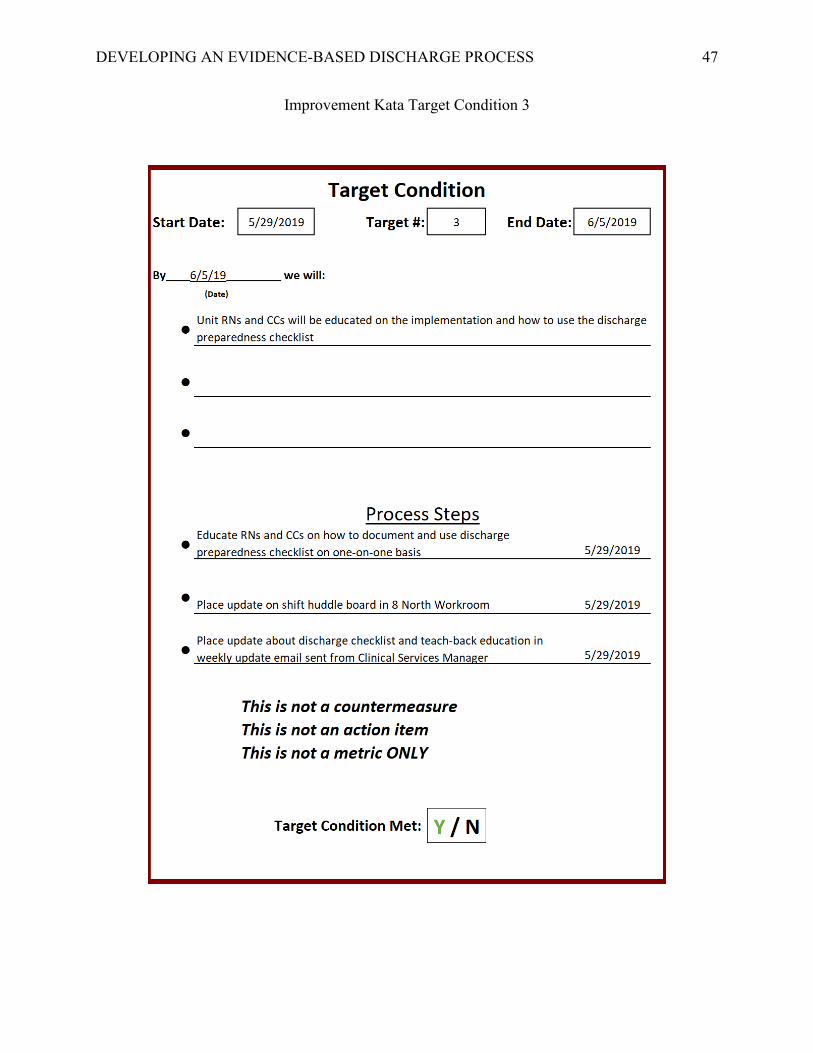
DEVELOPING AN EVIDENCE-BASED DISCHARGE PROCESS 47
Improvement Kata Target Condition 3

DEVELOPING AN EVIDENCE-BASED DISCHARGE PROCESS 48
Improvement Kata Target Condition 4

DEVELOPING AN EVIDENCE-BASED DISCHARGE PROCESS 49
Appendix I
Improvement Kata Target Condition 1: PDSA Cycle
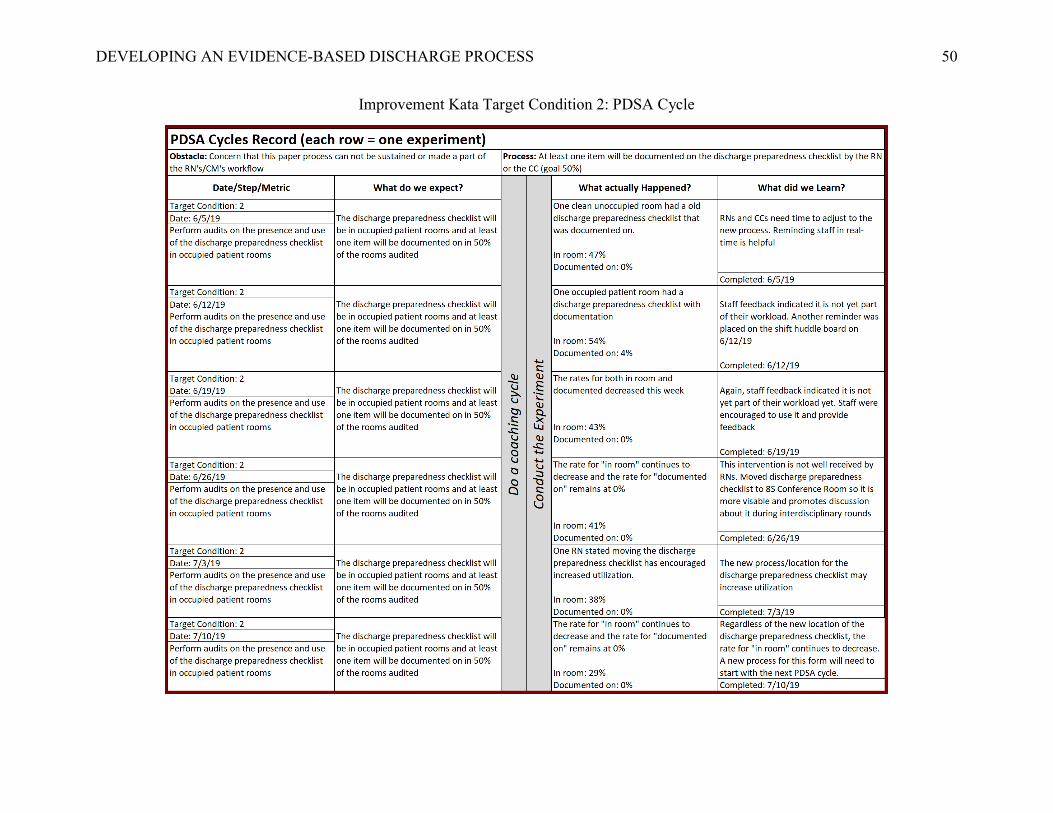
DEVELOPING AN EVIDENCE-BASED DISCHARGE PROCESS 50
Improvement Kata Target Condition 2: PDSA Cycle

DEVELOPING AN EVIDENCE-BASED DISCHARGE PROCESS 51
Improvement Kata Target Condition 3: PDSA Cycle

DEVELOPING AN EVIDENCE-BASED DISCHARGE PROCESS 52
Improvement Kata Target Condition 4: PDSA Cycle

DEVELOPING AN EVIDENCE-BASED DISCHARGE PROCESS 53
Appendix J
Metric Table
Metric Defined Source Frequency Purpose
Lag Measures
Readmission Rates
30-day, all-cause, unplanned readmissions COPD AMI HF Sepsis
Existing report from data analyst Monthly Determine readmission rate for each diagnosis before and after implementation
HCAHPS Scores Discharge Domain
Total score Existing report from unit manager Monthly Determine patient satisfaction with discharge process before and after implementation
"Staff talked about help when you left"
Existing report from unit manager Monthly
"Info re symptoms/prob to look for"
Existing report from unit manager Monthly
HCAHPS Scores Care Transition Domain
"Staff took pref into account"
Existing report from unit Monthly
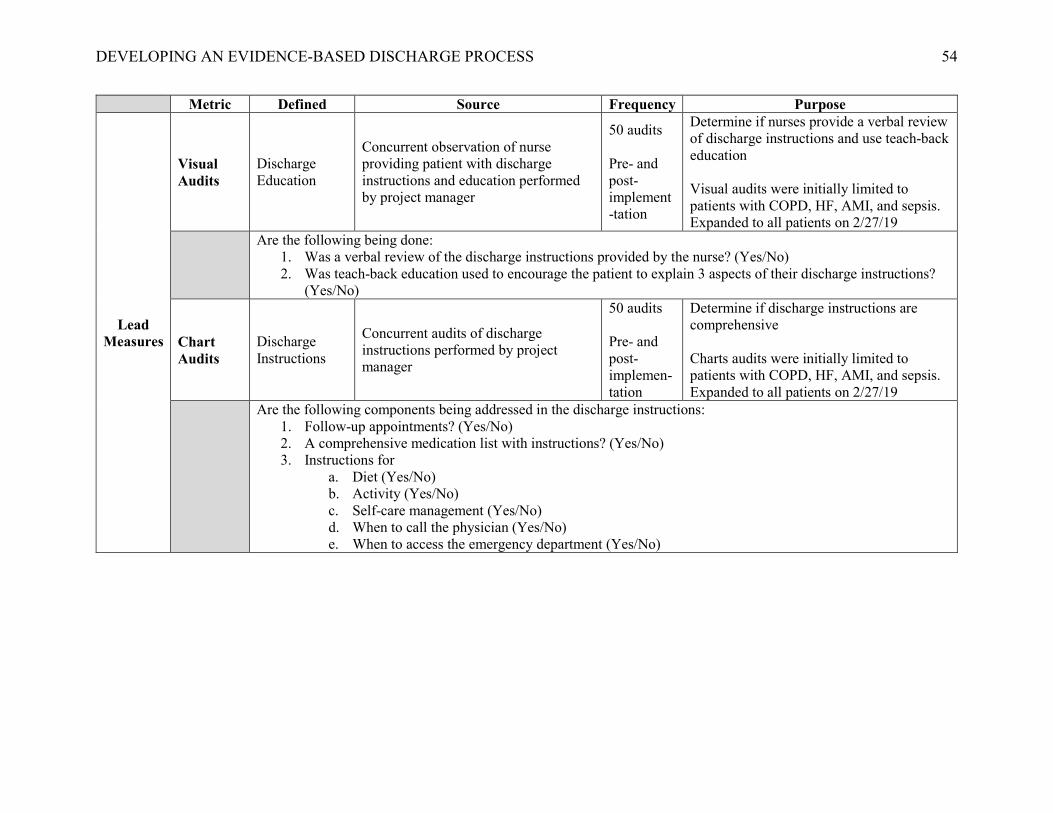
DEVELOPING AN EVIDENCE-BASED DISCHARGE PROCESS 54
Metric Defined Source Frequency Purpose
Lead Measures
Visual Audits
Discharge Education
Concurrent observation of nurse providing patient with discharge instructions and education performed by project manager
50 audits
Pre- and post- implement-tation
Determine if nurses provide a verbal review of discharge instructions and use teach-back education Visual audits were initially limited to patients with COPD, HF, AMI, and sepsis. Expanded to all patients on 2/27/19
Are the following being done: 1. Was a verbal review of the discharge instructions provided by the nurse? (Yes/No) 2. Was teach-back education used to encourage the patient to explain 3 aspects of their discharge instructions?
(Yes/No)
Chart Audits
Discharge Instructions
Concurrent audits of discharge instructions performed by project manager
50 audits Pre- and post- implemen-tation
Determine if discharge instructions are comprehensive Charts audits were initially limited to patients with COPD, HF, AMI, and sepsis. Expanded to all patients on 2/27/19
Are the following components being addressed in the discharge instructions: 1. Follow-up appointments? (Yes/No) 2. A comprehensive medication list with instructions? (Yes/No) 3. Instructions for
a. Diet (Yes/No) b. Activity (Yes/No) c. Self-care management (Yes/No) d. When to call the physician (Yes/No) e. When to access the emergency department (Yes/No)

DEVELOPING AN EVIDENCE-BASED DISCHARGE PROCESS 55
Appendix K
Indicator Grid
Metric Title Rational Conceptual Definition Operational Definition Frequency Source
Readmission rates
Identifies if the intervention had an impact on 30-day readmission rates
The number of 30-day readmissions for patients with COPD, HF, AMI, and sepsis
Total # of readmissions for COPD, AMI, HF, and sepsis patients out of total # of discharges in 30 days.
Monthly Lag measure
Data analyst
HCAHPS Scores Discharge Domain Total
Identifies if the intervention improved the patient’s total experience with the discharge process
The total score (percentage) from HCAHPS survey questions: • During this hospital stay, did
doctors, nurses or other hospital staff talk with you about whether you would have the help you needed when you left the hospital?
• During this hospital stay, did you get information in writing about what symptoms to look out for after you left the hospital?
Total percentage per month Provided by Press Ganey
Monthly Lag measure
Unit manager
HCAHPS Scores Discharge Domain “Staff talked about help when you left”
Identifies if the intervention addressed resources available after discharge
Total score (percentage) from HCAHPS survey question: • During this hospital stay, did
doctors, nurses or other hospital staff talk with you about whether you would have the help you needed when you left the hospital?
Total percentage per month Provided by Press Ganey
Monthly Lag measure
Unit manager
HCAHPS Scores Discharge Domain “Info re symptoms/ prob to look for”
Identifies if the intervention addressed signs and symptoms to monitor
Total score (percentage) from the HCAHPS survey question: • During this hospital stay, did you
get information in writing about what symptoms to look out for after you left the hospital?
Total percentage per month Provided by Press Ganey
Monthly Lag measure
Unit manager

DEVELOPING AN EVIDENCE-BASED DISCHARGE PROCESS 56
Metric Title Rational Conceptual Definition Operational Definition Frequency Source HCAHPS Scores Care Transition Domain “Staff took pref into account”
Identifies if the intervention improved the patient’s perception that their preferences was considered
Total score (percentage from the HCAHPS survey question: • During this hospital stay, staff
took my preferences and those of my family or caregiver into account deciding what my health care needs would be when I left.
Total percentage per month Provided by Press Ganey
Monthly Lag measure
Unit manager
Discharge Instructions Visual Audits
Identifies if the intervention had an impact the use of the teach-back method during discharge education
Observation of nurse reviewing discharge instructions with the patient
Total # of occurrences involving the nurse using the teach-back method during discharge education out of the total # of visual audits performed
Real time Lead measure
Project manager
Discharge Instructions Chart Audits
Identifies if the intervention improved the comprehensiveness of the discharge instructions
Review of the chart to determine if the discharge instructions included follow-up appointment(s), comprehensive medication list, diet, activity, self-care management, when to call the physician, and when to access the emergency department
Total # of occurrences of comprehensive discharge instructions out of the total # of chart audits performed
Real time Lead measure
Project manager

DEVELOPING AN EVIDENCE-BASED DISCHARGE PROCESS 57
Appendix L
IRB Approval Letter