developing an adequacy metric resource adequacy forum technical subcommittee meeting october 16,...
TRANSCRIPT

Developing an Adequacy Metric
Resource Adequacy ForumTechnical Subcommittee Meeting
October 16, 2009
October 16, 2009 Resource Adequacy Technical Committee
2
Outline
• Current Adequacy Metric: LOLP
• The Problem with LOLP
• LOLP Subcommittee Suggestions
• Next Steps
Current NW Resource Adequacy Metric: LOLP

October 16, 2009 Resource Adequacy Technical Committee
4
January 1930
-5000
0
5000
10000
15000
20000
25000
30000
35000
40000
45000
1 27 53 79 105
131
157
183
209
235
261
287
313
339
365
391
417
443
469
495
521
547
573
599
625
651
677
703
729
Hour in Month
Meg
awat
ts
Net Demand NW Thermal NW Hydro Unserved Net Imports
Cold
Hydro Limited
GENESYS Simulation Illustrative Example Only

October 16, 2009 Resource Adequacy Technical Committee
5
What do we Count?• Ideally, we count “significant” events (those
that we want to avoid)• Energy threshold (or contingency resource)
is 1,200 MW for one day or 28,800 MW-hours from Dec-Mar
• Capacity threshold (or contingency resource) is 3,000 MW in any hour from Dec-Mar and from Jun-Sep
October 16, 2009 Resource Adequacy Technical Committee
6
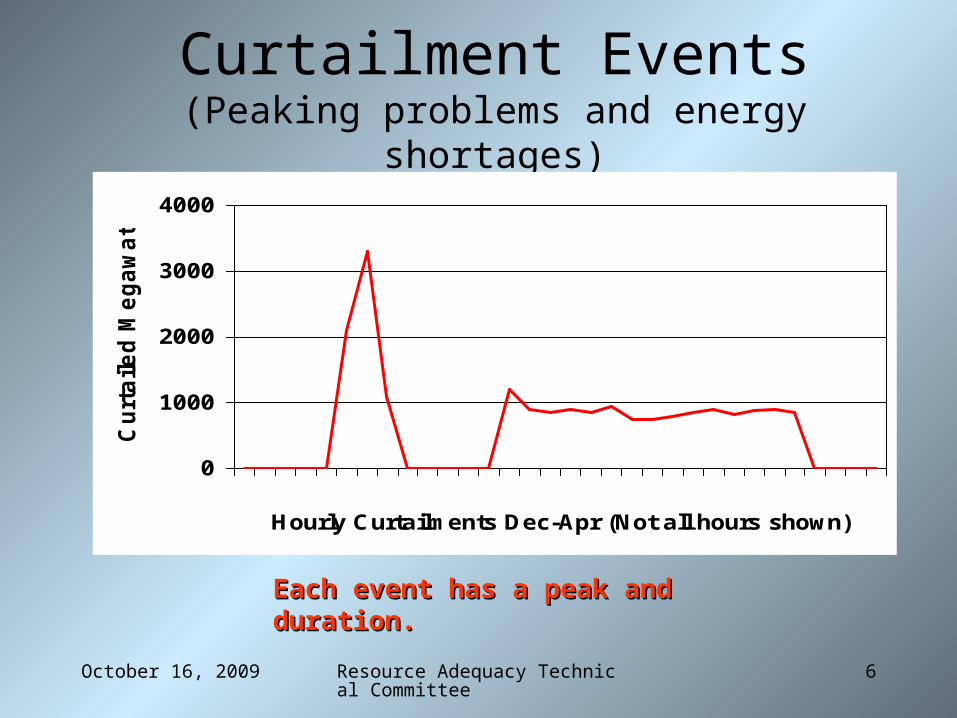
Curtailment Events(Peaking problems and energy shortages)
0
1000
2000
3000
4000
Hourly Curtailments Dec-Apr (Not all hours shown)
Curt
aile
d M
egaw
atts
Peak Event > 3,000 MW
Energy Event > 28,800 MW-hrs
Each event has a peak and Each event has a peak and duration.duration.
October 16, 2009 Resource Adequacy Technical Committee
7
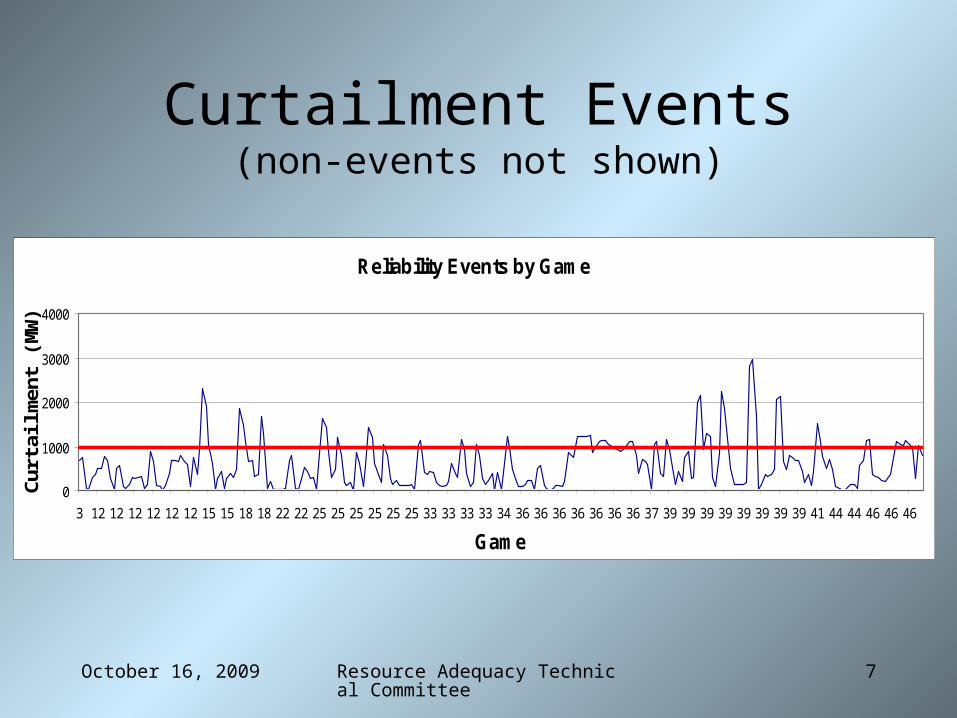
Curtailment Events(non-events not shown)
Reliability Events by Game
0
1000
2000
3000
4000
3 12 12 12 12 12 12 15 15 18 18 22 22 25 25 25 25 25 25 33 33 33 33 34 36 36 36 36 36 36 36 37 39 39 39 39 39 39 39 39 41 44 44 46 46 46
Game
Cur
tailm
ent (
MW
)
Seattle
October 16, 2009 Resource Adequacy Technical Committee
8
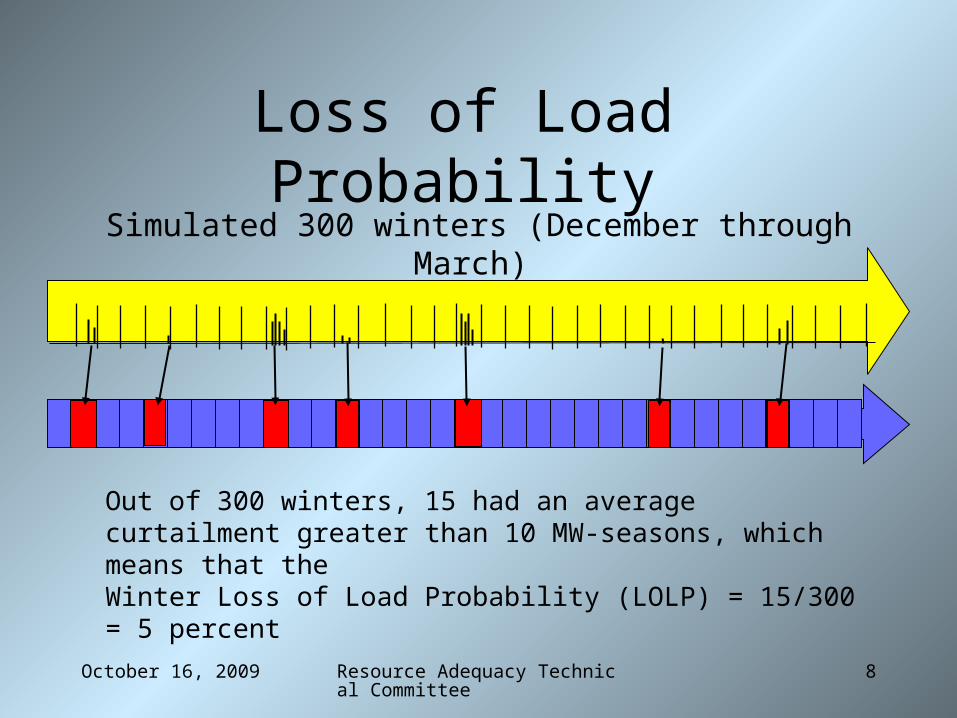
Loss of Load ProbabilitySimulated 300 winters (December through March)
Out of 300 winters, 15 had an average curtailment greater than 10 MW-seasons, which means that the Winter Loss of Load Probability (LOLP) = 15/300 = 5 percent

October 16, 2009 Resource Adequacy Technical Committee
9
Energy LOLP(Sum of Curtailed Energy Dec-Mar)
0102030405060708090
100
0 1 2 3 4 5 6 7 8 9 10Probability (%)
Mag
nitu
de
(MW
-S
easo
ns)
We plot the average seasonal curtailment for every
simulation in descending order. We then observe where that
curve crosses the 10 MW- Season level on the probability
axis - - that identifies the LOLP for this scenario.

October 16, 2009 Resource Adequacy Technical Committee
10
LOLP vs. Contingency Resource
05
10152025303540
0 10000 20000 30000 40000
Contingency Resource Generation (MW-Hours)
LO
LP
(%
)
28,800 MW-HrsLOLP = 4%
10,000 MW-HrsLOLP = 12%

October 16, 2009 Resource Adequacy Technical Committee
11
Study StatisticsNumber of Simulations (Games) 50
Hours in the Dec-Mar period 2,904
Total number of hours simulated 145,200
Number of games with at least one hour of curtailment
18
Number of curtailment hours (over all games) 275
Number of curtailment events 83
Average magnitude per event 1,953 MW-hrs
Average duration per event 3.4 hours
Average number of events per game with curtailments
4.6

October 16, 2009 Resource Adequacy Technical Committee
12
LOLP Type Statistics
Types of events
No. of Games
LOLP
(%)
At least 1 hour of curtailment 18 36
Total curtailment > 28,800 mw-hrs 2 4
Total curtailment > 10,000 mw-hrs 6 12
At least one event > 4 hours 13 26
At least one event > 4,000 mw-hrs 9 18
At least one event > 4-hour & > 4,000 mw-hrs 5 10
At least five hours with curtailment > 1,000 mw 5 10
At least ten hours with curtailment > 1,000 mw 2 4
At least one hour with curtailment > 1,000 mw 11 22

The Problem with LOLP

October 16, 2009 Resource Adequacy Technical Committee
14
Potential Problem with LOLPSame LOLP – Bigger Magnitude
0
0.2
0.4
0.6
0.8
1
1.2
1 2 3 4 5 6
Probability
Mag
nitu
de

October 16, 2009 Resource Adequacy Technical Committee
15
Potential Problem with LOLPLower LOLP – Bigger Magnitude
00.20.40.60.8
11.21.41.6
1 2 3 4 5 6
Probability
Mag
nitu
de
October 16, 2009 Resource Adequacy Technical Committee
16
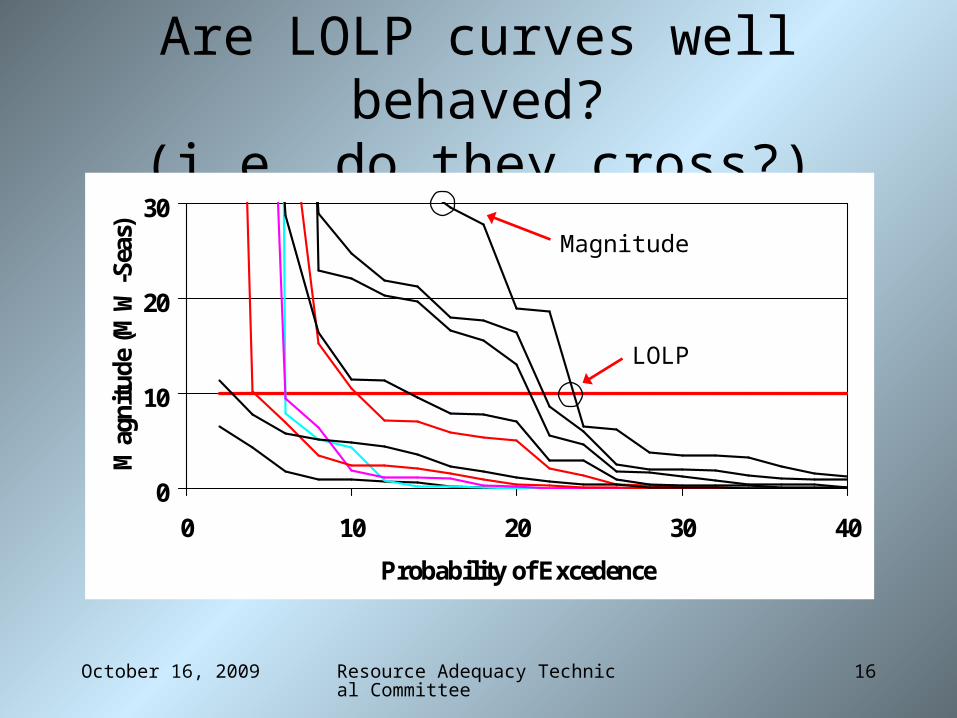
Are LOLP curves well behaved?(i.e. do they cross?)
0
10
20
30
0 10 20 30 40
Probability of Excedence
Mag
nitu
de (
MW
-Sea
s)
LOLP
Magnitude

October 16, 2009 Resource Adequacy Technical Committee
17
LOLP vs. Magnitude(If this relationship were dependable, the magnitude of the problem could
be estimated by knowing the LOLP)
y = 64.333x + 54.308
R2 = 0.6418
0
500
1000
1500
2000
2500
0 5 10 15 20 25 30
LOLP (%)
Mag
nitu
de

LOLP Subcommittee Reportand Recommendations

October 16, 2009 Resource Adequacy Technical Committee
19
LOLP Subcommittee Report• Clearly define all reserve requirements
– Operating reserves– Planning reserves– Wind integration reserves
• Determine which reserve curtailments count toward LOLP• Add temperature-correlated wind as a random variable• Decouple temperature and water condition • Define a “contingency” resource for each month of the
year instead of defining threshold events • Record curtailment events across all months of the year• Consider using other adequacy metrics • Continue to assess climate change impacts

October 16, 2009 Resource Adequacy Technical Committee
20
LOLP Review Status• Reserves
– Work being done by PNUCC committee• Temperature-correlated wind
– BPA working on a test data set• Decouple temp and water
– Done• Contingency resource
– Work needs to be assigned• Annual metric
– Not yet started• Other metrics
– BPA draft methodology– PSRI review
• Climate change – Ongoing

Next Steps
October 16, 2009 Resource Adequacy Technical Committee
22
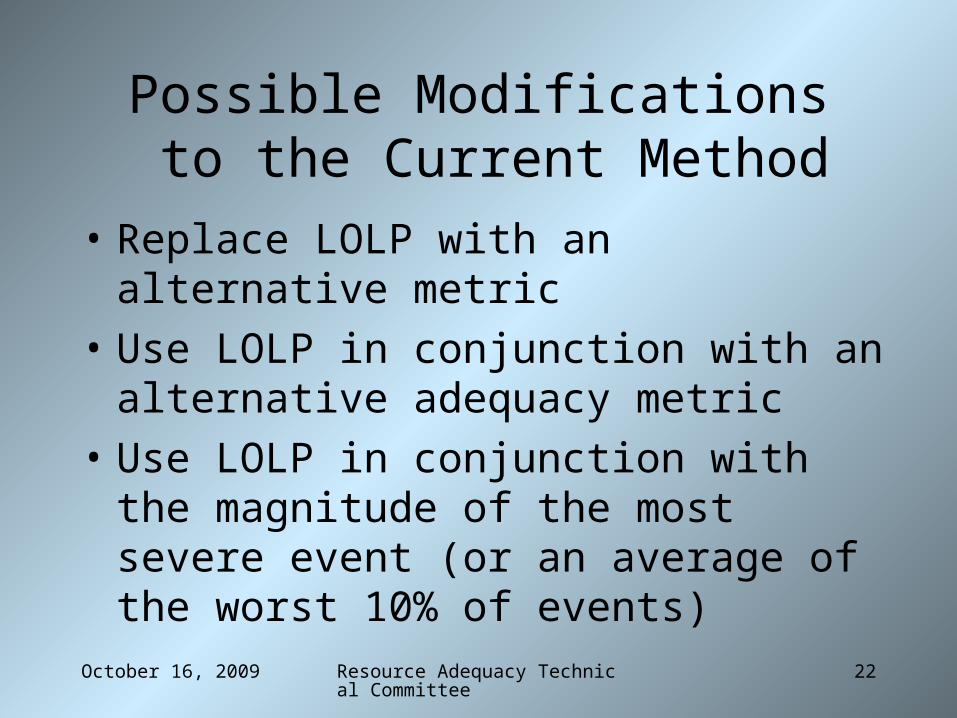
Possible Modifications to the Current Method
• Replace LOLP with an alternative metric
• Use LOLP in conjunction with an alternative adequacy metric
• Use LOLP in conjunction with the magnitude of the most severe event (or an average of the worst 10% of events)

October 16, 2009 Resource Adequacy Technical Committee
23
Examples of Other Adequacy Metrics
• LOLE: loss of load expectation (%)– Number of hours with curtailment divided by the
total number of hours simulated– Can be more intuitive, i.e. 99.5% reliable– Does not address magnitude
• EUE: expected unserved energy (MW-hr)– Average amount of unserved energy per year– Lacks specific information about severe events

October 16, 2009 Resource Adequacy Technical Committee
24
Work Plan• PSRI review complete by early 2010
• Benchmark GENESYS by early 2010
• Tech Committee propose new metric and threshold by April of 2010
• Use new metric to assess 3 and 5 year adequacy by June 2010