developing air quality sensors: perspectives and ......node 6: airport in bari pm sensor (ppd20v,...
TRANSCRIPT

Developing Air Quality Sensors:
Perspectives and Challenges for Real Applications Michele Penza
Head of Laboratory
Functional Materials & Technologies for Sustainable Applications - Brindisi Research Center, Brindisi, Italy
Chair of COST Action TD1105 - EuNetAir
US EPA AIR SENSORS 2018 WORKSHOP
EPA Campus, Research Triangle Park, Durham, NC, USA, 25-27 June 2018
EPA AIR SENSORS 2018 - Deliberating Performance Targets for Air Quality Sensors

OUTLINE • ENEA profile
• Context of the air pollution control
• ENEA efforts in performance standards for AQ sensors
• Sensor performance: transducers, measurement parameters
• Rationale for the sensor performance:
EU Directive 2008/50/EC, certification standards
• Examples of certification standards in air quality:
WSN in Bari (Italy): PM10, Saharan dust, AQI, mobile sensing (bus)
AQ sensors: biofuel-powered aircraft emissions
EuNetAir joint-exercise, Aveiro, Portugal (Oct. 2014)
• Sensor market and value chain
• Selected current European projects on AQ sensors
• Concluding remarks

About ENEA • ENEA - Italian National Agency for New Technologies,
Energy and Sustainable Economic Development
• It is a public RTO (Research and Technology Organization) operating in the fields of energy, the environment and new technologies to support the Country’s competitiveness and sustainable development
• ENEA’s mission is to develop new technological solutions to meet the societal challenges, fostering transition to a low-carbon and circular economy
• The institutional mandate of the Agency is to disseminate and transfer knowledge, innovation and technology to industry, institutions and civil society at large

Activities ENEA • ENEA’s activities span many fronts ranging from basic to applied research and innovation
• Research: Basic, mission-oriented, applied and industrial research, also through the development of prototypes and product industrialization
• Technology Transfer: Dissemination and transfer of research results to industry and public administrations, and exploitation for production purposes
• Advanced services: Studies, measurements, tests and assessments tailored to both public and private bodies and enterprises
• Training and information: Activities aimed at broadening sector expertise and public knowledge and awareness

Research Facilities and Staff
Research facilities: • 9 Research Centres • 5 Research Laboratories • 13 Territorial offices • Brussels Liaison Office • Headquarters in Rome
Human Resources: About 2500 permanent staff:
• 36% women • 59% graduates
Foggia Research Laboratories
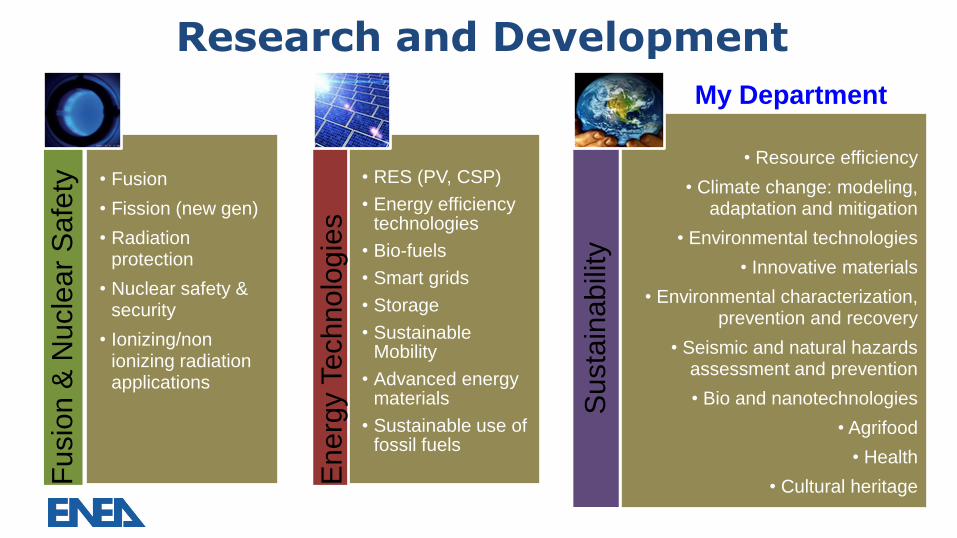
Research and Development
My Department
• Resource efficiency
• Climate change: modeling,adaptation and mitigation
• Environmental technologies
• Innovative materials
• Environmental characterization,prevention and recovery
• Seismic and natural hazardsassessment and prevention
• Bio and nanotechnologies
• Agrifood
• Health
• Cultural heritage
ity
ilnab
tai
Sus
• Fusion
• Fission (new gen)
• Radiati onprotection
• Nuclear safety & security
• Ionizing/ nonionizing radiation applications
es
gi
lohno
ec
Ty
Energ
• RES (PV, CSP)
• Energy efficiencytechnologies
• Bio-fuels
• Smart grids
• Storage
• SustainableMobility
• Advanced energymaterials
• Sustainable use offossil fuels
ty
Safe
ar
leN
uc
&
n
ioF
us

Almost one third of the Europe's citizens are exposed to excessive concentrations of airborne particulate matter.
Exposure to PM2.5, NO2 and O3 lead to respectively 431 000, 75 000, and 17 000 premature deaths in Europe (2012 conc.).
Cristina Guerreiro
Context of Air Pollution in Europe
8
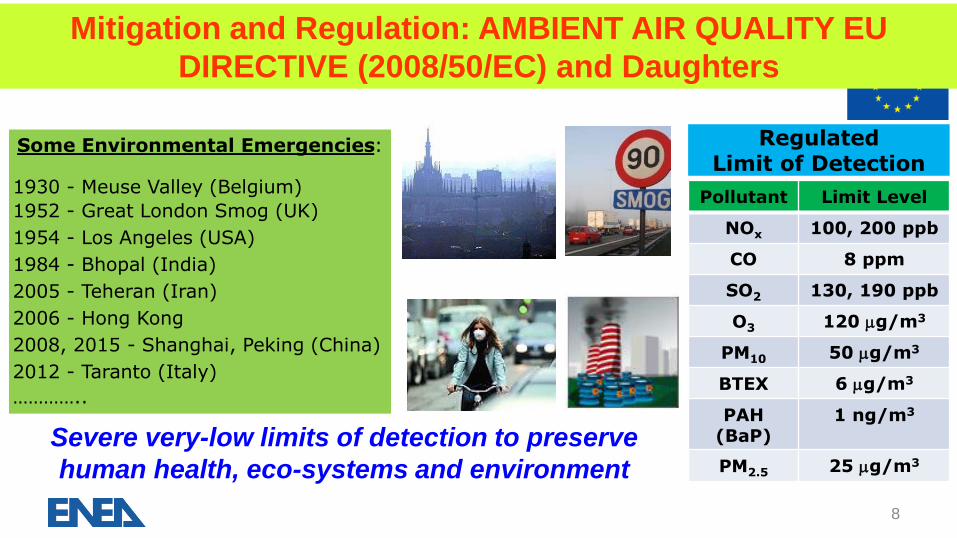
Some Environmental Emergencies:
1930 - Meuse Valley (Belgium)
1952 - Great London Smog (UK)
1954 - Los Angeles (USA)
1984 - Bhopal (India)
2005 - Teheran (Iran)
2006 - Hong Kong
2008, 2015 - Shanghai, Peking (China)
2012 - Taranto (Italy)
…………..
Mitigation and Regulation: AMBIENT AIR QUALITY EU
DIRECTIVE (2008/50/EC) and Daughters
Pollutant Limit Level
NOx 100, 200 ppb
CO 8 ppm
SO2 130, 190 ppb
O3 120 mg/m3
PM10 50 mg/m3
BTEX 6 mg/m3
PAH (BaP)
1 ng/m3
PM2.5 25 mg/m3
Regulated Limit of Detection
Severe very-low limits of detection to preserve
human health, eco-systems and environment

ENEA efforts in performance standards for AQ sensors (1/2)
• COST Action TD1105: European Network on New Sensing Technologies for Air
Pollution Control and Environmental Sustainability - EuNetAir (2012-2016)
Chair: M. Penza - www.cost.eunetair.it
International Networking on sensor materials, gas sensors, sensor-systems,
measurements, protocols, standards with more than 120 teams from 31 COST
Countries and 7 International Partner Countries (including USA)
• ESSC: European Sensor Systems Cluster (2014-present)
Chairman: M. Penza - www.cluster-essc.eu
Working Group on sensor-systems to define a Roadmap Towards European
Leadership in Sensor-Systems for H2020 Calls 2018-2020, as requested by EC
• Italian Project ABC: Aerocrafts powered by Biofuel (2017-2019)
Partnership: CNR, ENEA, Italian Air Force
Working Group to study the impact of the emissions from aircrafts powered by
biofuel, as funded by Italian Ministry of Environment, Landscape and Sea

ENEA efforts in performance standards for AQ & Climate (2/2)
• MINNI: Italian National Atmospheric Modelling System (Italian Legislative Law
152/2010 (2010-present) by ENEA - www.minni.org
Air Quality Scenario Simulations at medium-long term to support the Italian
Environment Ministry in negotiation to define European and International policies
on air pollution, including National Air Quality Forecasting System
• ENEA Station for Climate Observation Roberto Sarao, Lampedusa (Sicilia):
ENEA - www.lampedusa.enea.it
A Research Facility in the Mediterranean to measure the climatic parameters.
The atmospheric/oceanic observatory is composed by two sections:
- ground-based laboratory (35.52°N, 12.63°E) since 1997
- oceanic buoy (35.49°N,12.47°E) for air-sea and satellite observations since 2015
• EIT CLIMATE-KIC: European Institute of Innovation and Technology (EIT) -
Climate Knowledge and Innovation Community (KIC) - www.climate-kic.org
ENEA linked partner on Innovation for Climate Action
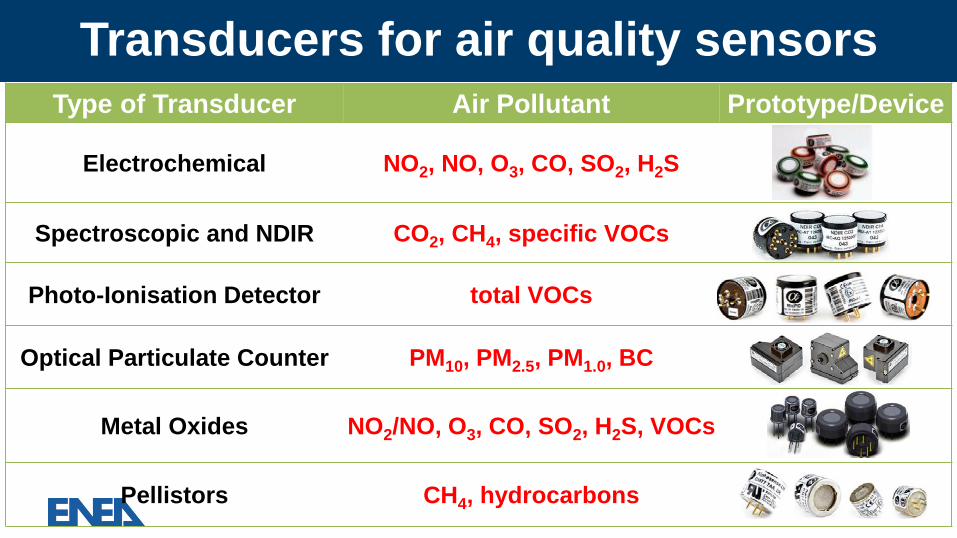
Transducers for air quality sensors
Type of Transducer Air Pollutant Prototype/Device
Electrochemical NO2, NO, O3, CO, SO2, H2S
Spectroscopic and NDIR CO2, CH4, specific VOCs
Photo-Ionisation Detector total VOCs
Optical Particulate Counter PM10, PM2.5, PM1.0, BC
Metal Oxides NO2/NO, O3, CO, SO2, H2S, VOCs
Pellistors CH4, hydrocarbons

Measurement parameters for air sensor performance
Transducer Sensitivity Selectivity Stability Limit of
Detection
Open
Questions
Electrochemical High Variable Improved ppb Interference,
calibration, signal proc.
Spectroscopic and
NDIR High Variable Low ppm
Interference,
calibration, signal proc.
Photo-Ionisation
Detector High Low Improved ppm
Interference,
calibration, signal proc.
Optical Particulate
Counter High Improved Improved µg/m3 Interference ,
calibration, signal proc.
Metal Oxides High Variable Low sub-ppm Interference,
calibration, signal proc.
Pellistors High Low Improved ppm Interference,
calibration, signal proc.
Good electronics (low noise), good mechanical design, software/firmware/cloud are needed

● Study of sensor elements active control techniques on all levels:
− Sensor module enhanced electronics (i.e. for self-monitoring)
− Sensor node improved selectivity and stability via information correlation
− Sensor network enhanced reliability, auto-configuration/calibration
Sensor/Node/Network for air quality

Rationale for the choice of the sensor performance
EU Directive 2008/50/EC: Sensors-versus-Analyzers 1/2
EU Directive 2008/50/EC: Ambient Air Quality and Cleaner Air for Europe, art. 2
Definition
Fixed
Measurements
It means measurements taken at fixed sites to determine
the levels in accordance with the relevant Data Quality
Objectives (DQO).
They are mandatory in zones and agglomerations where
the upper assessment thresholds are exceeded.
Indicative
Measurements
It means measurements which meet Data Quality
Objectives (DQO) that are less strict than those required
for “Fixed Measurements”. The “Indicative Measurements”
are considered as Informative Measurements.

EU Directive 2008/50/EC: Sensors-versus-Analyzers 2/2
Data Quality Objectives (DQO)
Max UNCERTAINTY Requested by Directive DEVICES FOR
MEASURE NO2/NO/NOx,
SO2, CO Benzene O3 PM10/PM2.5
Fixed
Measurements
(High Accuracy)
15% 25% 15% 30%
Analyzers:
Fluorescence,
Chemilumin., GC,
UV Photometry,
Optical Absorption,
Gravimetry
Indicative
Measurements
(Low Accuracy)
25% 30% 30% 50% Low Cost Sensors
(diffusive samplers)

Examples of certification standards for air quality
European Standard EN
performance criteria and test procedures for certified Automated Measuring Systems
(AMS) for ambient air quality for gases and PM are defined in:
• EN 14211:2012 for NOx, and daughters
• EN 14212:2012 for SO2, and daughters
• EN 14625:2012 for O3, and daughters
• EN 14626:2012 for CO, and daughters
• EN 14662-3:2005 for C6H6, and daughters
• EN 12341:2014 for PM10, and daughters
• EN 14907:2005 for PM2.5, and daughters
• EN 16450: 2017 for PM10 and PM2.5, and daughters
• Guide to the Demonstration of Equivalence of Ambient Air Monitoring - GDE
CEN/TS 16450 supposed to become an EN Standard in future after validation work

Air Quality Sensors Network operating in BARI (Italy)
Case-Study Italian Project RES-NOVAE: Sensors-vs-Analyzers
11 Sensor Nodes (10 stationary + 1 mobile)
managed by ENEA and deployed in Bari Air Quality Monitoring Stations (10 units)
managed by ARPA-Puglia in Bari

NO2 O3
SO2 CO
PM10
Air Quality Sensors Network operating in Bari (Italy)
Case-Study Italian Project RES-NOVAE: Virtual Private Network
• 10 Stationary Nodes in City
• 1 Mobile Node on Public Bus
• Campaign Period: 30 Months
1 July 2015 - 31 Dec. 2017
• Big Data: 5Gb
• Sampling Rate: 10 sec
CO-B4 Alphasense, UK
NO2-B4 Alphasense, UK
O3-B4 Alphasense, UK
SO2-B4 Alphasense, UK
CO2-IRC-A1 Alphasense, UK
VOCs-PID-A1 Alphasense, UK
PPD20V Shinyei, JP
TC1047A Microchip
HIH5031 Honeywell

Node 6: AIRPORT in Bari PM sensor (PPD20V, Shinyei)
PM10: Sensors Network Data operating in Bari (Italy)
Node 6 Airport: May 2017, Sensor vs Analyzer - Saharan Dust
PREV’AIR
PM10
13 May 2017
Y = 0.91587*X + 0.04289
R2 = 0.88
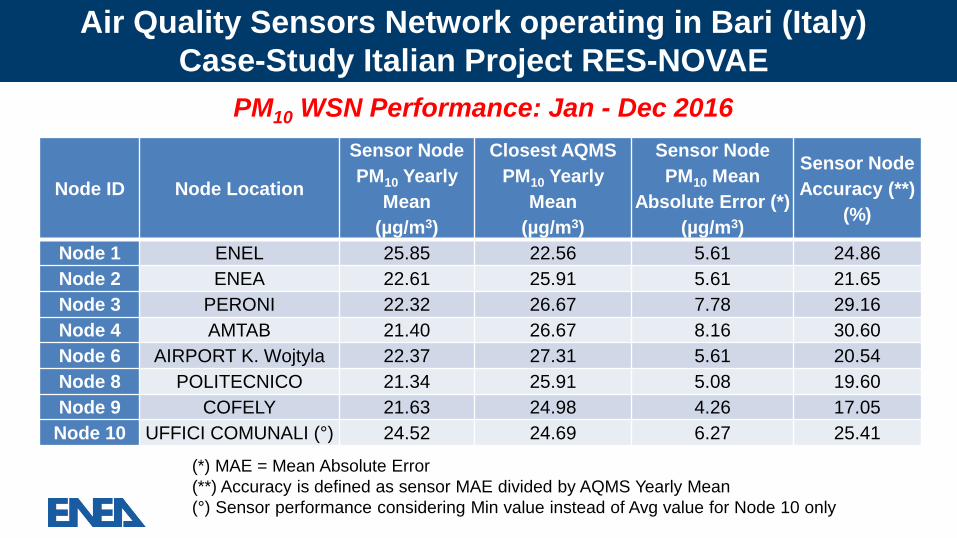
Air Quality Sensors Network operating in Bari (Italy)
Case-Study Italian Project RES-NOVAE
PM10 WSN Performance: Jan - Dec 2016
Node ID Node Location
Sensor Node
PM10 Yearly
Mean
(µg/m3)
Closest AQMS
PM10 Yearly
Mean
(µg/m3)
Sensor Node
PM10 Mean
Absolute Error (*)
(µg/m3)
Sensor Node
Accuracy (**)
(%)
Node 1 ENEL 25.85 22.56 5.61 24.86
Node 2 ENEA 22.61 25.91 5.61 21.65
Node 3 PERONI 22.32 26.67 7.78 29.16
Node 4 AMTAB 21.40 26.67 8.16 30.60
Node 6 AIRPORT K. Wojtyla 22.37 27.31 5.61 20.54
Node 8 POLITECNICO 21.34 25.91 5.08 19.60
Node 9 COFELY 21.63 24.98 4.26 17.05
Node 10 UFFICI COMUNALI (°) 24.52 24.69 6.27 25.41
(*) MAE = Mean Absolute Error
(**) Accuracy is defined as sensor MAE divided by AQMS Yearly Mean
(°) Sensor performance considering Min value instead of Avg value for Node 10 only
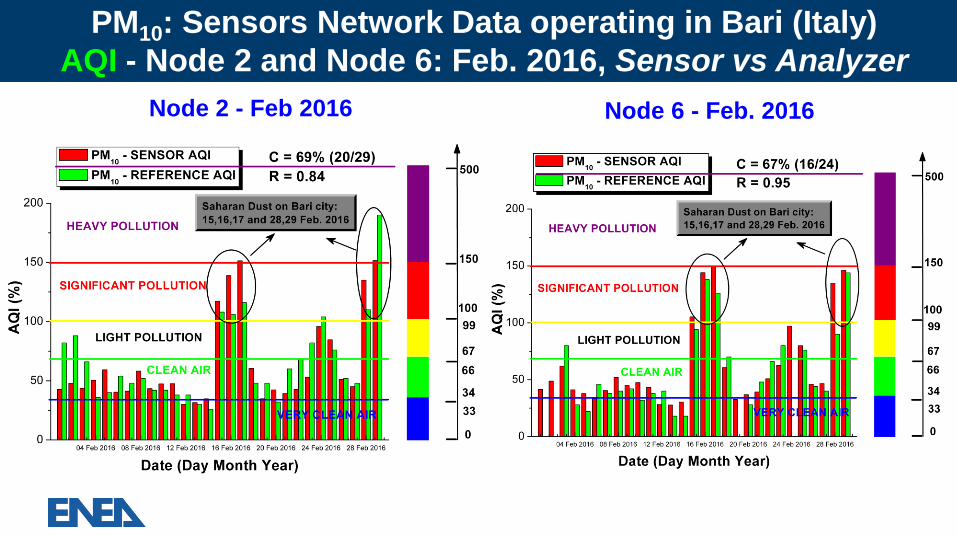
Node 2 - Feb 2016 Node 6 - Feb. 2016
PM10: Sensors Network Data operating in Bari (Italy)
AQI - Node 2 and Node 6: Feb. 2016, Sensor vs Analyzer

Air Quality Sensors Network operating in Bari (Italy)
Case-Study RES-NOVAE: Mobile Sensing on Public Bus
iAQI: CO iAQI: NO2 9 November 2015
Clean air: low CO AQI (blue) Clean air: low NO2 AQI (blue - green)
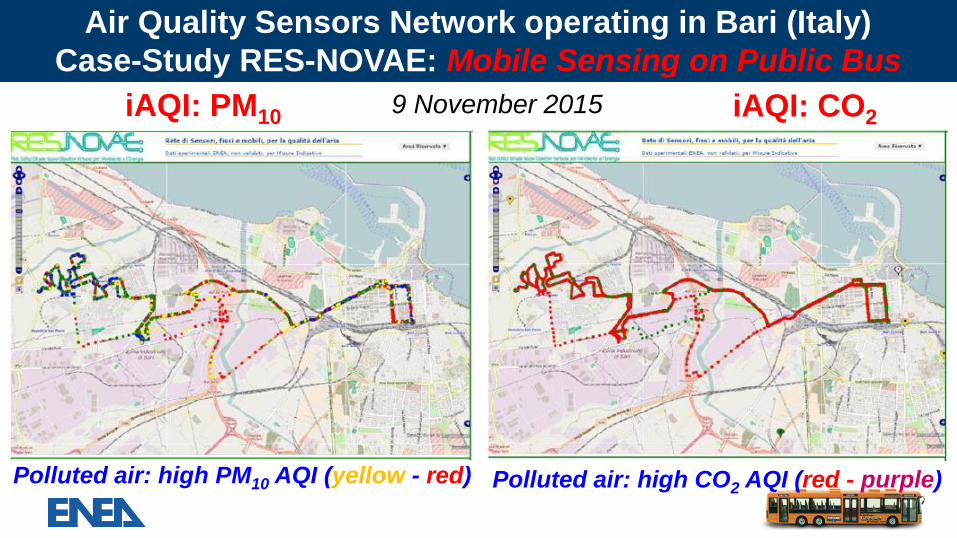
Polluted air: high PM10 AQI (yellow - red) Polluted air: high CO2 AQI (red - purple)
Air Quality Sensors Network operating in Bari (Italy)
Case-Study RES-NOVAE: Mobile Sensing on Public Bus
iAQI: PM10 iAQI: CO2 9 November 2015

0
10
20
30
40
50
60
70
80
90
09
.00
09
.10
09
.20
09
.30
09
.40
09
.50
10
.00
10
.10
10
.20
10
.30
10
.40
10
.50
11
.00
11
.10
11
.20
11
.30
11
.40
11
.50
12
.00
OPCN2 PM1
OPCN2 PM2.5
OPCN2 PM10
AQMS Daily Mean 28 June 2017
PM10 (µg/m3) PM2.5 (µg/m3) PM1.0 (µg/m3)
14.8 10.1 6.4
PM
10 (
µg
/m3)
Time (hh:mm) on 28 June 2017
__ PM10
__ PM2.5
__ PM1.0
Air Quality Sensors: Biofuel-powered Aircraft Emissions
Airport Pratica di Mare (Italy): PM10/PM2.5/PM1.0 emissions monitored by OPC sensors

Joint-Exercise EuNetAir: Sensors-versus-Analyzers 1/2

PM2.5
0.0
10.0
20.0
30.0
40.0
50.0
60.0
70.0
24
h a
ve
rag
e c
on
ce
ntr
ati
on
(µ
g.m
-3)
reference analyser #1 #2 #3 #4
0.00
0.10
0.20
0.30
0.40
0.50
0.60
0.70
0.80
0.90
1.00
0 10 20 30 40 50 60 70 80 90 100
R2
Data collection efficiency (%)
OPC #1 OPC #2 OPC #3 OPC #4
The optical particle counters (OPC) for PM2.5 presented correlations varying
between 0.45-0.85 and data collection efficiencies in the range of 67-80%.
Joint-Exercise EuNetAir: Sensors-versus-Analyzers 2/2
C. Borrego et al., Atmospheric Environment 147 (2016) 246-263

TD Environmental Services LLC
Value Chain for Air Quality Sensors
State of the Market:

Sensors Market Evolution
2015 2020 2025
What we need:
• Sensor Performance
• Standards
• Protocols for Measurements
• Successful Proof-of-Concepts
• Ecosystems
• Users & Suppliers

Selected EU projects on air quality sensors (1/2)
Project Acronym Title of Project / Coordinator / Website
iSCAPE
H2020-SC5-04-2015
Improving the Smart Control of Air Pollution in Europe
Coordinator: Dr. Francesco Pilla, University College Dublin,
Ireland - Website: www.iscapeproject.eu
ClairCity
H2020-SC5-04-2015
Citizen-led Scenarios to Improve Air Quality in EU Cities
Coordinator: Prof. Enda Hayes, University of the West of
England, Bristol, UK - Website: www.claircity.eu
ICARUS
H2020-SC5-04-2015
Integrated Climate forcing and Air pollution Reduction in
Urban Systems
Coordinator: Prof. Dimosthenis Sarigiannis, Aristotle University
of Thessaloniki, Greece - Website: www.icarus2020.eu
ENoLL European Network of Living Labs - www.openlivinglabs.eu

Selected EU projects on air quality sensors (2/2)
Project
Acronym
Title of Project / Coordinator / Website
CAPTOR
H2020 GA:
688110
Collective Awareness Platform for Tropospheric Ozone Pollution
Coordinator: Prof. Jorge Garcia Vidal, Universitat Politecnica de
Catalunya, Barcelona, Spain - Website: www.captor-project.eu
PREPAIR
LIFE15
IPE IT013
Po Regions Engaged to Policies of Air
Coordinator: Regione Emilia-Romagna, Bologna, Italy - Website:
www.lifeprepair.eu
PhotoCityTex
LIFE13
ENV/ES/000603
Air Pollution Treatment in European Urban Environments by
means of Photocatalytic Textiles
Coordinator: Dr. Amalia Muñoz Cintas, CEAM, Valencia, Spain -
Website: www.ceam.es/PHOTOCITYTEX/home.htm

Air Quality Sensors Network: Lessons Learned (1/2)
Open Questions of the Air Quality Sensors
• Lower Accuracy compared to Reference Methods
• Cross-sensitivity and low Selectivity
• Low Stability and Drift to be corrected periodically
• Calibration needs periodically (e.g., at least 1 calibration/month ??)
• Regular Maintenance of the in-field AQ sensor nodes
• Data Quality Objective (European Directive 2008/50/EC) to be addressed for
Indicative Measurements by demonstration of the equivalence to use
microsensors for AQ monitoring

Air Quality Sensors Network: Lessons Learned (2/2)
Advantages and Benefits of the Air Quality Sensors
• Low-cost for deployment in Cities at high spatial-temporal resolution
• Suitability for personal exposure studies
• Suitability for emission source information
• Outdoor monitoring of gases (NO2/NO, O3, CO, SO2, H2S, tVOCs, CO2, NH3,
etc.)
• Outdoor monitoring of particulate matter (PM10, PM2.5, PM1.0, UFP)
• Indoor monitoring of gases (CO, VOCs, benzene, formaldehyde,
naphthalene, toluene, etc.) and PM (PM10, PM2.5, PM1.0)
• Combination of sensors with modelling for micro-scale analysis (1-2 mt
resolution)

CONCLUSIONS
• Micro-Sensors should not substitute but supplement routine
environmental monitoring equipments/devices
• Future Routine Environmental Networks may look very different from
today and include low-cost and accurate Sensors ?
• Green Routes through the city or access to information about air-
pollution load at specific local address might be future goals
• Pervasive low-cost Micro-Sensors for Indoor Energy Efficiency should
be a must for future Green-Buildings
• What do we want to provide (e.g. AQI) on the long-term in relation to
Routine Monitoring and Public Information to enhance Environmental
Awareness ? C. Borrego et al., Atmospheric Environment 147 (2016) 246-263

ACKNOWLEDGEMENTS
ENEA co-workers: D. Suriano, V. Pfister, S. Dipinto, M. Prato, G. Cassano, M. Alvisi
COST Action TD1105 EuNetAir
Kick-off Meeting at COST Office
16 May 2012, Brussels (Belgium)
Final Meeting COST Action TD1105
at J. Heyrovsky Institute of Physical Chemistry
Academy of Sciences of Czech Republic
Prague, Czech Republic, 5 - 7 October 2016
ACKNOWLEDGEMENTS
AIR SENSORS 2018 - Deliberating Performance Targets for Air Quality Sensors
THANK YOU
VERY MUCH
FOR KIND ATTENTION
RTP, Durham, USA
25-27 June 2018
Dr. Michele Penza ENEA - Head of Laboratory
Functional Materials and Technologies
for Sustainable Applications