developing a web-based integrated dashboard for health information systems, department of health,...
TRANSCRIPT

Developing a Web-based Integrated Dashboard for Health Information Systems,
Department of Health, Government of Sindh
Session 4328.0: Systems Thinking (ID=50443)
Tuesday, November 7, 2017: 2:30 p.m.-4:00 p.m.
Arshad Mahmood Deputy Chief of Party
Health Systems Strengthening USAID’s MCH Program Pakistan

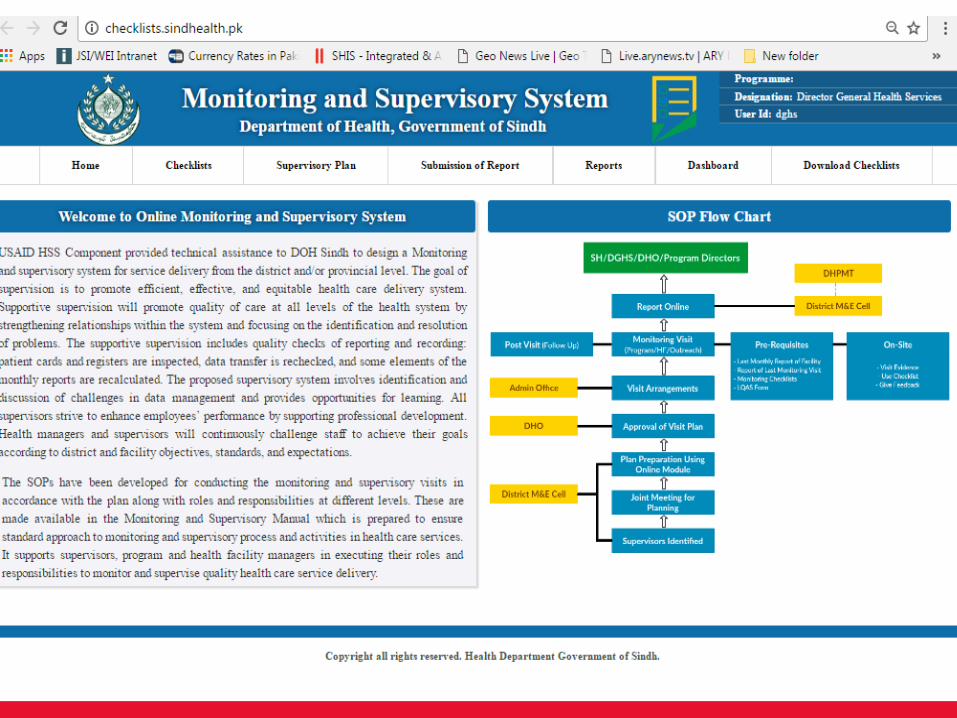
• Demonstrate the web-based, interoperable, integrated dashboard for health information, that is currently being used by the Department of Health, Government of Sindh, Pakistan
• Describe steps taken to ensure quality data, and built in mechanisms to track data quality
• Discuss the importance of transparent data to increase accountability in health care financing and delivery
Objectives

Health System Strengthening Project
• One of the five components of USAID’s MCH Program;
• The goal is to support innovative, cost‐effective, quality programs around reproductive, maternal, and child health services for improved outcomes;

Health System Strengthening: Approach Adopted
• Assessment of health systems strengths and weaknesses
• Identified key constraints and interventions required
• Identified potential solutions & developed concept papers
• Presented to DOH to build consensus
• Worked with DOH, no Parallel Infrastructure

District Health
Systems Strengthening
Health Systems Strengthening Package
Health Care Commission
District Health
& Population
Management
Teams
(DHPMT)
Leadership/
Management
Capacity
Building
Health
Information
System
Monitoring
&
Supervisory
System
District Action Plan with/MTBF

• District wise DHIS performance reports were not accessible
• Non availability of Provincial DHIS reports
• Baseline assessment shows data accuracy was less than 50% of DOH facilities
• Data utilization was limited
• Monitoring and supervisory system not existed
• No evidence based decision making
Baseline Assessment Findings

Objectives of online Dashboard (A managerial perspective)
What: Identify Key Information
To Provide Information for Management & Performance Improvement
of Healthcare Services at all levels
• Policy formulation
• Planning
• Monitoring
• Decision making
• Health facilities • Service Delivery • Stock outs of commodities • HR position • Financial utilization
• Community workers
Why: Assist Managers in
1 2
• Aggregation to
unit level
How: Drill Down
3

Integrated Dashboard Covers
Integrated SHIS
Dashboard
M&E KPIs Dashboard (Performance
Ranking of Districts KPIs)
DHIS Dashboard &
Analytical Report
CMW-MIS Dashboard &
Analytical Reports
LHW-MIS Dashboard &
Analytical Reports
Consolidated FP Dashboard of all Sources
vLMIS and cLMIS
Dashboards
Dashboard of periodic
surveys PSLM, PDHS, MICS,
Nutrition

Online M&E System: Ranking of Districts on KPIs

M&E: District Ranking based on KPIs

Lady Health Workers Reporting Compliance

Lady Health Workers: Dashboard

Monitoring and Supervisory System: Pre-requisites
• Dedicated health managers team with the technical skills, knowledge and motivation to improve the quality of services;
• Availability of monitoring tools, guidelines and protocols;
• Resources required for monitoring and supervision (Vehicle, POL, Daily Allowances)
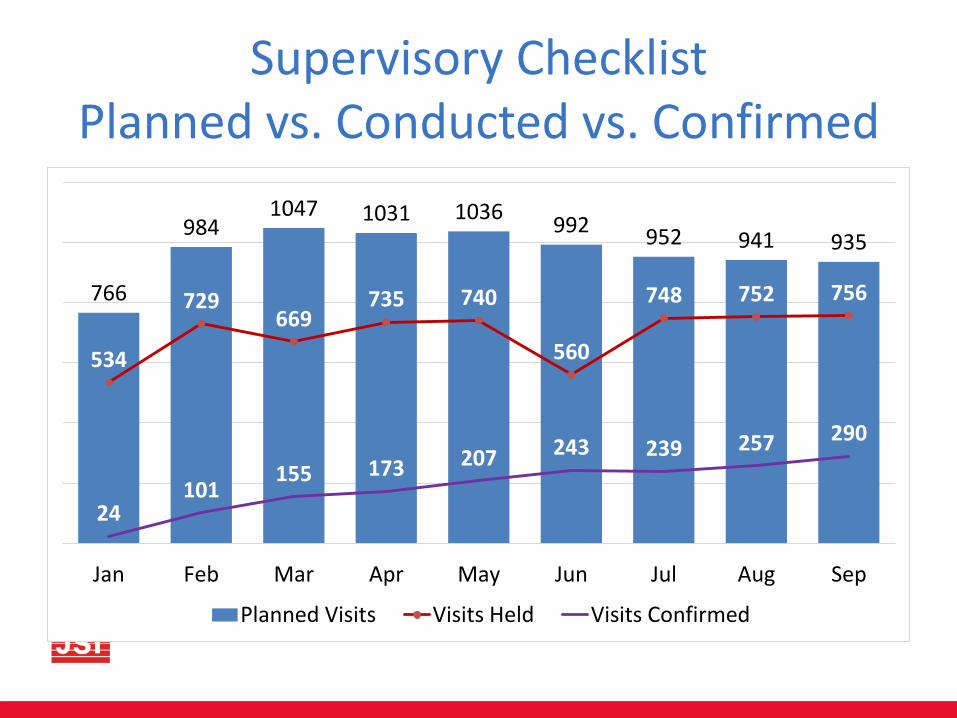
Supervisory Checklist Planned vs. Conducted vs. Confirmed
766
984 1047 1031 1036
992 952 941 935
534
729 669
735 740
560
748 752 756
24 101
155 173 207 243 239 257 290
Jan Feb Mar Apr May Jun Jul Aug Sep
Planned Visits Visits Held Visits Confirmed

Monitoring and Supervisory System: Validation of Data
• Standardized checklists/tools of all programs available online
• District teams trained on Monitoring & Supervision and Validation of data
• Checklists are filled on-line
• Continued capacity building of district management and M&E Cells

Visit Verification through Mobile App

Findings of Supervisory Visits

District M&E Cells Established
Ensure effective DHPMT meetings
Track progress on DAP implementation
Improve MIS reporting compliance
Ensure use of M&S online system
Use of information beyond numbers: focus on challenges of coverage and quality

Significant Increase in Health Facilities Reporting Complete, Accurate and Timely Monthly Reports
15
56
69
Dec, 2013 March, 2016 August, 2017

28.1%
71.0% 75.6%
187.1%
0.0%
50.0%
100.0%
150.0%
200.0%
2013-14 2014-15 2015-16 2016-17 2017-18
Increase in Non Development Annual Budget
13,049 13,251
16,712
22,317
22,910
37,469
10,000
15,000
20,000
25,000
30,000
35,000
40,000
Figures in Millions (PAK Rs.) Percent Increase from Baseline 2013-14

Conclusion • Health Facilities Reporting Compliance is
approaching 100%;
• LHW reporting compliance in over 95%;
• Error reports significantly reduced over time;
• DOH started using Dashboard for evidence based decision making;
• Primary Health Care Budget increased significantly
• DOH supervisory visits improved;
• Data quality improved significantly;

Thank you!