developing a total quality management framework for public sector universities in pakistan
TRANSCRIPT
DEVELOPING A TOTAL QUALITY
MANAGEMENT FRAMEWORK FOR PUBLIC SECTOR UNIVERSITIES IN PAKISTAN
By Faridullah Khan
NATIONAL UNIVERSITY OF MODERN LANGUAGES ISLAMABAD
May 2010

DEVELOPING A TOTAL QUALITY MANAGEMENT
FRAMEWORK FOR PUBLIC SECTOR UNIVERSITIES IN PAKISTAN
By Faridullah Khan
M.Ed., University of Peshawar, 2003
A THESIS SUBMITTED IN PARTIAL FULFILMENT OF THE REQUIREMENTS FOR THE DEGREE OF
DOCTOR OF PHILOSOPHY
In Education
To
FACULTY OF ADVANCED INTEGRATED STUDIES AND RESEARCH
(Education)
NATIONAL UNIVERSITY OF MODERN LANGUAGES, ISLAMABAD
May 2010
Faridullah Khan, 2010

ii
Name of Student
Degree Name in Full (e.g Master of Philosophy, Doctor of Philosophy)
Name of Discipline
Name of Research Supervisor Signature of Research Supervisor
Name of Dean (FAISR) Signature of Dean (FAISR)
Name of Rector Signature of Rector
NATIONAL UNIVERSITY OF MODERN LANGUAGES FACULTY OF ADVANCED INTEGRATED STUDIES & RESEARCH
THESIS/DISSERTATION AND DEFENCE APPROVAL FORM The undersigned certify that they have read the following thesis, examined the defense, are satisfied with the overall exam performance, and recommend the thesis to the Faculty of Advanced Integrated Studies & Research for acceptance: Thesis/ Dissertation Title: DEVELOPING A TOTAL QUALITY MANAGEMENT FRAMEWORK FOR PUBLIC SECTOR UNIVERSITIES IN PAKISTAN Submitted By: Faridullah Khan Registration #: 261-PhD/Edu/2004 (Aug) ____________ Doctor of Philosophy_____________________________________ __________________Education_________________ _Dr. Muhammad Zafar Iqbal__ ______________________________ _Dr. Shazra Munnawer_____ ______________________________ _Maj. Gen. ® Masood Hasan _ ______________________________ _______________________ Date

iii
CANDIDATE DECLARATION FORM I MR. FARIDULLAH KHAN Son of MR. MUHAMMAD ALI KHAN Registration # 261-PhD/Edu/2004 (Aug) Discipline EDUCATION Candidate of DOCTOR OF PHILOSOPHY at the National University of Modern Languages do hereby declare that the thesis (Title) DEVELOPING A TOTAL QUALITY MANAGEMENT FRAMEWORK FOR PUBLIC SECTOR UNIVERSITIES IN PAKISTAN submitted by me in partial fulfillment of PhD degree, is my original work, and has not been submitted or published earlier. I also solemnly declare that it shall not, in future, be submitted by me for obtaining any other degree from this or any other university or institution.
I also understand that if evidence of plagiarism is found in my thesis/dissertation at any stage, even after the award of a degree, the work may be cancelled and the degree revoked.
______________________________
______________ Signature of Candidate
Date
MR. FARIDULLAH KHAN Name of Candidate

iv
ABSTRACT
Thesis Title: Developing a Total Quality Management Framework for Public Sector Universities in Pakistan
Total Quality Management (TQM) is a management philosophy and practices that aims to
harness the human and material resources of an organization in the most effective way to achieve
the objectives of the organization. This descriptive study investigated the preparedness of public
sector universities in Pakistan for ISO 9001:2008 implementation and proposed a TQM
framework. The study was carried out in the backdrop of National Educational Policy 1998-2010
recommendations for implementation of ISO 9000 and Higher Education Commission (HEC)
push for enhancing the quality of education. The objectives of the study were to: (a) survey the
presence of effective quality assurance processes in HEIs (b) explore the problems faced by HEIs
to improve the quality of education (c) explore critical success factors for TQM implementation
(d) explore correlation among different management practices in HEIs (e) find out the factors
influencing Customer Focus and Satisfaction (f) propose a TQM implementation framework. It
studied 25 HEIs through the perceptions of 25 VCs, 25 Registrars, 25 Deans, 500 Teachers and
1500 Students regarding the quality management practices. The study focused on the core
activities i.e. teaching, learning and research; and the aspects which had a direct impact on the
quality of the educational product. ISO 9001 requirements were used as a survey instrument for
Gauging Absence of Prerequisite (GAP) analysis for the implementation of ISO 9001.
Descriptive Statistics, Correlation, Regression and ANOVA were performed to analyze the data.
The findings indicated that HEIs were strong in the area of measurement, analysis and
improvement but weak in resource management and their standing regarding QMS, as a whole,
was above average which showed that more need to be done and improved. Customer focus and
satisfaction was a dependent variable and a proxy to measure TQM level of implementation. The
study revealed management commitment, internal communication, work environment,
infrastructure, teaching processes and assessment processes as significant predictors of customer
focus and satisfaction. Moreover, all selected TQM factors were positively correlated to one
another. The study proposed a TQM implementation framework. It also revealed insufficient
financial and physical resources, lack of planning and lack of quality assurance at feeding
colleges as top detriments to education quality in HEIs. The study adds to academic knowledge,
provides a solid foundation for future research in the area of quality assurance and offers
recommendations for quality assurance in HEIs.

v
TABLE OF CONTENTS
Chapter Page
THESIS/DISSERTATION AND DEFENCE APPROVAL FORM……………...ii
CANDIDATE DECLARATION FORM………………………………………...iii
ABSTRACT……………………………………………………………………...iv
TABLE OF CONTENTS………………………………………….………………v
LIST OF TABLES…………………………………………………...…….…......xi
LIST OF FIGURES………………………………………………………....…..xiii
LIST OF ABBREVIATIONS …………………………………………....……..xiv
ACKNOWLEDGEMENT……………………………………………...……..…xv
1. INTRODUCTION AND OVERVIEW OF THE STUDY……………………..1 1. Introduction…………………………………………………………….………1
1.1 Significance of the Study…..………………………………….....……………7
1.2 Statement of the Problem ……………………………………………...……...8
1.3 Research Questions……………………………………………………………9
1.4 Research Objectives………………………………………………………….10
1.5 Research Hypotheses………………………………………………………...10
1.6 Research Methodology………………………………………………………12
1.6.1 Research Instrument for Data Collection.........................................…...12
1.6.2 Population and Sample……………………………………….………..12
1.7 Ethical Considerations……………………………………………………….13
1.8 Delimitations of the Study………………..………………………………….13
1.9 Theoretical Framework of the Study………………………………………...13
1.10 Structure of the Thesis…………………………………..………………….15
1.11 Operational Definitions of the Terms………………………………………16
1.12 Summary ……………………………………………………………………17
2. LITERATURE REVIEW…………………………………………….………..18
2. Introduction………………………………………………….………………..18
2.1 Definition of Higher Education……………………………………………...19

vi
2.2 Education System of Pakistan………………………………………………..19
2.2.1 Administrative Set-up of Education..…………………………………..19
2.2.2 Educational Structure…………………………………………………..20
2.2.2.1 Elementary Education………………………………………….20
2.2.2.2 Secondary Education…………………………………………..20
2.2.2.3 Tertiary Education……………………………………………..21
2.2.3 Curriculum Development and Examination…………………………...23
2.2.4 Overview of Higher Education in Pakistan……………………………24
2.2.4.1 Structure of a Pakistani University ……………………………26
2.2.4.2 Problems and Issues in Higher Education………………..……27
2.2.4.3 Quality Assurance and Enhancement Practices in Higher
Education in Pakistan…………………………………………..30
2.3 The Concept of Quality………………………………………………..……..37
2.3.1 Defining Quality………………………………………………….……38
2.3.2. Dimensions of Quality……………………………………….………..40
2.4 Approaches to Quality Management………………………………………...40
2.4.1 Craftsman, Guilds and the Quality……………...…...…………………40
2.4.2 Inspection Based Quality Control……………...………………………41
2.4.3 Process Based Quality Control………………...………………………41
2.4.4 Quality Assurance……………………………...………………………42
2.4.5 Total Quality Management…………………………………………….43
2.5 The Philosophy of TQM……………………………………………………..44
2.5.1 Basic Definitions of Total Quality Management………………………45
2.5.2 Quality in Education…………………………….……………………..46
2.5.2.1 Product and Customer in Education…………………………...48
2.5.3 Quality Assurance……………………………………………...………50
2.6 Models and Frameworks of TQM……………………………………………52
2.6.1 Standardized Models...……………………………………………...….52
2.6.1.1 The Malcolm Baldrige National Quality Award………………52
2.6.1.2 Prime Minister Quality Award and Excellence Model of
Pakistan………………………………………………………...59

vii
2.6.1.3 The European Foundation for Quality Management (EFQM)
Business Excellence Model……………………………………62
2.6.1.4 International Organization for Standardization (ISO 9000)…...65
2.6.2 Individuals’ Frameworks for TQM Implementation…………………..67
2.6.2.1 Moosa’s Seven-stages of TQM Implementation Model……….67
2.6.2.2 Vankatraman’s Framework for TQM Implementation in Higher
Education Programme………………………………………….69
2.6.2.3 Sakthivel & Raju’s TQM 9-C Education Excellence
(EDEX) Model…………………………………………………71
2.6.2.4 Besterfield’s Framework for TQM Implementation…………...72
2.6.2.5 Motwani and Kumar’s Five-step TQM Implementation Model.74
2.6.2.6 Van den Berghe’s Framework for ISO 9000 Implementation....75
2.6.2.7 McKinsey’s Four Levels of TQM……………………………...76
2.7 Critical Success Factors for TQM Implementation.……………….………...78
2.8 Tools and Techniques of TQM………………………………………………96
2.9 Challenges to TQM Implementation in Public Sector ServiceOrganisations101
2.10 Introduction to ISO 9000…………………………………………..….…..105
2.10.1 Origin of ISO 9000 Standards……….…….…………..…………..108
2.10.2 Revision of ISO 9000………………………………..….…….…...109
2.10.3 Structure of ISO 9001………………………………….…....…….111
2.10.4 ISO 9000 in Education………………………....………….………114
2.10.5 Implementation of ISO 9001 Quality Management System……....114
2.11 TQM and ISO 9000………….……………..……………………………..115
2.12 Why ISO 9000………………………………………………………….…117
2.13 Case Studies of TQM and ISO 9000 Implementation……..………….…..118
2.13.1 International Studies……………………………...….……………118
2.13.2 National Studies…………………………………...………….…...128
2.14 Summary…………………………………………………………………..129 3. RESEARCH DESIGN AND METHODOLOGY…………………………...131
3. Introduction…………………………………………………………………131

viii
3.1 Research Design ……….……………………………………………..……131
3.1.1 Research Methodology………………………………..……………...132
3.1.2 Research Instrument………………………………………..………...135
3.2 Questionnaire Construction……………………………….………………..136
3.2.1 Research Instrument Development...…………………………………137
3.2.2 Design of the Instrument…………………………………...…………139
3.2.3 Cover Letter ………………………………………………….………140
3.2.4 Validity and Reliability of the Research Instrument…………….…...141
3.3 Population of the study………………….………………………………….143
3.4 Sample and Sampling Techniques…...….………………………………….144
3.5 Data collection Procedures…………………………………………...…….146
3.6 Follow-up Procedures………………………………..……………………..147
3.7 Data Analysis………………….………………………………..…………..149
3.8 Limitations and Hassles in Data Collection….………………………..……150
3.9 Summary…………..……………………………......................……………150
4. DATA ANALYSIS………………………………………………………….…151
4. Introduction…………………………………………………………………151
4.1 Demographic Profile of the Respondents…………………………………..151
4.2 Analysis and Interpretations………………………………………………..153
4.2.1 Survey Results of Higher Education Institutions……………………..153
4.2.1.1 Descriptive Statistics………………………………………….155
4.2.1.2 Inferential Statistics…………………………………………..172
4.2.1.2.1 Correlation Analysis..………………………..……..172
4.2.1.2.2 Multiple Regression Analysis….…………………...178
4.2.1.2.3 Analysis of Variance (ANOVA)…………………...187
5. FINDINGS, CONCLUSION AND RECOMMENDATIONS……………...205
5. Introduction…………………………………………………………………205
5.1 Summary……………………………………………………………………205
5.2 Findings of the Study……………………...………………………………..208

ix
5.2.1 Findings from Literature Review……………………………………..208
5.2.2 Findings from Descriptive Analysis………………………………….209
5.2.3 Findings from Inferential Analysis…………………………………...212
5.2.3.1 Findings from Correlation Analysis……………...…………..212
5.2.3.2 Findings from Multiple Regression Analysis………….…….214
5.2.3.3 Findings from Analysis of Variance (ANOVA)………...…...215
5.3 Discussion…………………………………………………….……….……222
5.4 Conclusion………………………………………………………………….333
5.4.1 Conclusion from Literature……………………………………..…….233
5.4.2 Conclusion from Descriptive Analysis……………………….………234
5.4.3 Conclusion from Inferential Analysis…………………………..…….235
5.5 Recommendations …………………………………….…………………….237
5.5.1 Proposed TQM Framework (Model)…………………………………239
5.5.2 Implementation of Proposed TQM Framework………………………245
5.6 Limitation of the Study……………………………………………………..251
5.6.1 Research Topic………………………………………………………..251
5.6.2 Research Design………………………………………………………251
5.6.3 Self-Reporting Perception Measure …………………………………..252
5.6.4 Dependence on Studies from Developed Countries………………….252
5.7 Recommendations for the Future Research…………..…………………….252
REFERENCES…………………………………………………………....……254 Appendix – A: Items Bank as per ISO 9001 QMS for the Stakeholders..……...272
Appendix – B: Questionnaires for the Stakeholders…………………….……...279
Appendix – C: ISO 9001 Contents……………………………………………..303
Appendix – D: Cover Letters for the Respondents….………………………….305
Appendix – E: Demographic Profile of the Respondents...…………………….308
Appendix – F: Regression Model - 1 Summary…....................…………….….309
Appendix – G: Regression Model - 2 Summary..................……………..….….312
Appendix – H: Regression Model - 3 Summary................………………….….314
Appendix – I: Descriptive Statistics Tables of ANOVA……………………….316

x
Appendix – J: Strategy Matrix for Answering Research Questions and
Achieving Research Objectives………………………………...329
Appendix – K: Internal Consistency of the Questionnaires for Respondents.....330
Appendix – L: List of the Universities and DAIs Participated in the Survey….334
Appendix – M: Figures of TQM Tools and Techniques……………..…………336

xi
LIST OF TABLES Title Page
Table 2-1 Education System of Pakistan……………………………...…………………21
Table 2-2 Universities/DAIs in Pakistan……………………………...…………………25
Table 2-3 Region-Wise Distribution of Universities/DAIs……………..……….………26
Table 2-4 Baldrige Criteria-items listing and Point Scoring...….....…………….………57
Table 2-5 Points Scoring Comparison of MBNQA (209-2010) and PMQA Criteria..….61
Table 3-1 Distribution of Questions According to Five Dimensions of ISO 9001….....138
Table 3-2 Sample Size and Response Rate for Pilot-Test……………………………...142
Table 3-3 Population of the Study……………………………………………………...144
Table 3-4 Region-Wise Distribution of the Sample……………………………………146
Table 3-5 Sample Size and Response Rate……………………………………….…….149
Table 4-1 Quality Management System………………………………………….….....155
Table 4-2 Dimensions of Quality Management System……………….………….……156
Table 4-3 Documentation Management...……………………...……………….………157
Table 4-4 Management Responsibility…………………………………………….…...158
Table 4-5 Resource Management………………………………………………………160
Table 4-6 Product Realization …………………………………………...…………….161
Table 4-7 Measurement, Analysis and Improvement ……………………….…….…...162
Table 4-8 Components of Documentation Management...……………………….…….164
Table 4-9 Components of Management Responsibility……………….……….……….165
Table 4-10 Components of Resource Management.……………………………..…......165
Table 4-11 Components of Product Realization………………….……………….……166
Table 4-12 Components of Measurement, Analysis and Improvement……….….……167
Table 4-13 Problems Faced by Higher Education Institutions in Enhancing Quality.....168
Table 4-14 Correlation Matrix of TQM Constructs Based on Top
Management’s Perceptions…………………………………………………173
Table 4-15 Correlation Matrix of TQM Constructs Based on Teachers’ Perceptions…174
Table 4-16 Correlation Matrix of TQM Constructs Based on Students’ Perceptions….176
Table 4-17 Correlation Matrix of Five Components of ISO 9001…………….….…….177

xii
Table 4-18 Customer Focus and Satisfaction Regression Model – 1 Estimates as per
Top Management’s Perceptions…………..................................……..……179
Table 4-19 ANOVA of Customer Focus and Satisfaction Regression Model-1. ……...180
Table 4-20 Summary of Customer Focus and Satisfaction Regression Model-1………181
Table 4-21 Customer Focus and Satisfaction Regression Model – 2 Estimates as per
Teachers’ Perceptions …………………………………..…………..……..182
Table 4-22 ANOVA of Customer Focus and Satisfaction Regression Model-2….…....183
Table 4-23 Summary of Customer Focus and Satisfaction Regression Model-2…..…..183
Table 4-24 Customer Focus and Satisfaction Regression Model – 3 Estimates as per
Students’ Perceptions ………………………………………………....……184
Table 4-25 ANOVA of Customer Focus and Satisfaction Regression Model-3..….…..185
Table 4-26 Summary of Customer Focus and Satisfaction Regression Model-3.…...…185
Table 4-27 Top Management’s Perceptions Regarding Documentation Management...187
Table 4-28 Teachers’ Perceptions Regarding Documentation Management…………..188
Table 4-29 Top Management’s Perceptions Regarding Management Commitment…...189
Table 4-30 Top Management’s Perceptions Regarding Customer Focus and
Satisfaction…………………………...……………………………………..190
Table 4-31 Teachers’ Perceptions Regarding Customer Focus and Satisfaction .……..191
Table 4-32 Students’ Perceptions Regarding Customer Focus and Satisfaction .….…..192
Table 4-33 Top Management’s Perceptions Regarding Internal Communication...…...193
Table 4-34 Students’ Perceptions Regarding Internal Communication ……….………194
Table 4-35 Top Management’s Perceptions Regarding Infrastructure………….....…...195
Table 4-36 Teachers’ Perceptions Regarding Infrastructure …………………....……..196
Table 4-37 Students’ Perceptions Regarding Infrastructure…........……………….…...197
Table 4-38 Top Management’s Perceptions Regarding Work Environment……….…..198
Table 4-39 Teachers’ Perceptions Regarding Work Environment…………...…….…..199
Table 4-40 Top Management’s Perceptions Regarding Teaching Processes…...….......200
Table 4-41 Teachers’ Perceptions Regarding Teaching Processes……………...….......201
Table 4-42 Students’ Perceptions Regarding Teaching Processes……………...….......202
Table 4-43 Teachers' Perception Regarding Assessment Processes……………..……..203
Table 4-44 Students Perception Regarding Assessment Processes……………….…....204

xiii
LIST OF FIGURES
Title Page
Figure 1-1 A Theoretical Framework of the Study………………………….……..…….14
Figure 2-1 Education System of Pakistan……………………………………….……….22
Figure 2-2 Quality Assurance Set-up of HEC……………….…………………………..36
Figure 2-3 Quality Assurance Framework of HEC………..…………………………….36
Figure 2-4 Customers of Higher Education……………………………………………...50
Figure 2-5 Baldrige Education Performance Excellence Framework………………..….56
Figure 2-6 EFQM Business Excellence Model………...…………………….………….62
Figure 4-1 Analysis Process of the Data Collected Through Questionnaire …………..154
Figure 4-2 Summary of the Regression Models (1-3)……………………...…………..186
Figure 5-1 Five Dimensions of ISO 9001 as Observed at Surveyed HEIs……………..206
Figure 5-2 A Snapshot of Quality Management Practices at Surveyed HEIs………….207
Figure 5-3 Components of Proposed TQM Framework…………………….………….240
Figure 5-4 ISO 9001:2008 Quality Management System……………….…...………....240
Figure 5-5 Proposed Conceptual Total Quality Management Framework for HEIs…...242
Figure 5-6 Stages of Proposed QM Framework with Deming's Cycle………....……....244
Figure 5-7 Proposed TQM Implementation Framework…………….………....……....249
Figure 5-8 Proposed Organogram for Proposed TQM Implementation Framework......250

xiv
LIST OF ABBREVIATIONS
AIOU Allama Iqbal Open University
AJK Azad Jammu & Kashmir
ANSI American National Standards Institute
ASQ American Society for Quality
BBA Bachelor in Business Administration
M.B.A Master in Business Administration
DAI Degree Awarding Institute
EFQM European Foundation for Quality Management
GAP Gauging Absence of Prerequisite
HEC Higher Education Commission (Pakistan)
HEI Higher Education Institution
INQAAHE International Network of Quality Assurance Agencies in Higher Education
IPO Input – Processes – Output
ISO International Organization for Standardization
MBNQA Malcolm Baldrige National Quality Award
NATO North Atlantic Treaty Organization
NIST National Institute of Standards & Technology
NPO National Productivity Organization
PEC Pakistan Engineering Council
PDCA Plan – Do – Check – Act
QC Quality Control
QMS Quality Management System
SPSS Statistical Packages for Social Sciences
TQM Total Quality Management

xv
ACKNOWLEDGEMENT
First of all, I would like thank Allah Almighty for His blessings and enabling me
to complete this dissertation. In retrospect, I feel indebted to so many people who assisted
and guided me when I was on the roller coaster of my research study.
I would like to appreciate and thank Higher Education Commission (HEC) of
Pakistan for undertaking the challenging task of introducing research culture in the higher
education institutions of Pakistan and supporting the research scholars. I am one of its
beneficiaries. Without its financial support, it would not have been possible for me to
embark on the research enterprise.
I am grateful to the Rector and the Dean of Advanced Integrated Studies &
Research for providing me with an opportunity to become a part of research team at
National University of Modern Languages, Islamabad. I would like to take my hat off to
all the professors for their inspirational teaching during the course work. I also thank the
staff of R & D lab and library for the assistance and providing environment conducive for
research.
I am greatly indebted to my supervisor Prof. Dr Zafar Iqbal for his sincere
endeavors and dedicated supervision during my research.
My heartiest gratitude goes to Prof. Dr. Khalid Hafeez, my foreign supervisor and
Head of Management Systems Group at York School of Management, University of
York, UK, for his care and endeavours to guide and facilitate me when I was there in
connection of my PhD research. He really taught me what research is. I am also thankful
to the staff and colleagues at the York School of Management for facilitating me.
I am highly grateful to Prof. Dr Ali Sajid and Assistant Prof. Dr. Waheed Akhter
for their guidance and help in completing my research study.
I am very much grateful to the Vice-chancellors, the Registrars, the Deans, the
Teachers and the Students who participated in the survey and those colleagues and
friends who helped me to collect data for the research study.
Finally my gratitude to my family and friends for the encouragement, prayers and
moral support they provided in the process of completing this research study.
THANK YOU ALL.

1
CHAPTER 1
INTRODUCTION AND OVERVIEW OF THE STUDY
1. Introduction
Twenty-first century has been rightly termed as the century of change and rapid
development. Knowledge explosion, the cutting edge developments in the field of science
and technology, globalization and depleting resources have brought every sphere of life
under tremendous pressure to respond to the changing scenario and educational
institutions are no exception. These phenomena have prompted accountability, efficient
utilization of resources, market driven approach and quick response to emerging needs
and requirements of the stakeholders in higher education institutions. There has been an
escalation in demand for value for money, time and recourses on the part of various
stakeholders like students, government, business and industry and the society as a whole.
The kaleidoscopic picture has been very aptly painted in the following para:
around the world higher education is being shaken by profound changes. Exploding enrollments over the last decade are putting severe financial strains on tertiary systems. At the same time, computers and the internet have allowed previously unimaginable forms of global knowledge transfer. Institutions are becoming increasingly competitive, vying for scarce resources at home and for the rapidly growing numbers of students studying outside their own countries. Universities, including a rapidly growing number of private universities, are making international partnerships, and opening academic programs and even branching in other countries as never before (UNESCO, 2009, para. 1).
Partington and Brown (1997) have also held identical views that noticeable
changes have taken place in education in 1990’s. The students’ population has increased
in size and diversified. There is a tremendous increase in the stakeholders’ expectations

2
and demand for quality education, efficient and effective management and greater
accountability of academic functions like research, learning and teaching.
Acknowledging the importance of higher education for national growth and
knowledge economy, developing nations have chipped more money in higher education and
opened a number of higher education institutions, however, there is a growing concern
regarding certain aspects of the higher education institutions like (Lenn, 2003):
a. Are the higher education institutions planning to produce the graduates required by
society?
b. Is the money invested being spent well and are the institutions running efficiently?
c. Are the institutions producing the desired graduates?
These globalization issues coupled with the internal pressure have forced the
higher education institutions not only to standardize the academic and professional
programmes nationally but to think and act globally as well in order to remain
competitive in the age of cut-throat competition. In such a situation, the quality of higher
education has become a prime concern. Numerous programs have been launched to
improve quality. Curricula are periodically revamped and modernized. However
curriculum can determine contents and assessment methodology but it cannot control the
core processes of imparting those contents and skills (IWA, 2003). There is a dire need of
a proper quality management system which could control these core processes to ensure
desired outcome and satisfy customers and other stakeholders.
For the purpose higher education institutions worldwide resorted to Total Quality
Management (TQM), a messiah of many corporate organizations when they were
confronted with similar challenges, and adopted various standardized quality models and
institutional assessment approaches like Malcolm Baldrige National Quality Award
(MBNQA), European Foundation Quality Model (EFQM), International Organization for
Standardization quality management system standards (ISO 9001: 2008), Deming Prize,
Australian Quality Awards and Balanced Scorecard besides some other national quality
awards and models. Accreditation of academic and professional programmes has been
started to standardize academic and professional programmes at national level. For the
purpose various accreditation bodies and quality assurance agencies have been set up
worldwide.

3
In Pakistan, Quality Assurance Agency (QAA) was set up on January 18, 2005 at
Higher Education Commission of Pakistan (HEC) to improve academic quality and
standards across the country. Moreover, Quality Enhancement Cells (QECs) have been
established in more than 45 national universities phase-wise and the target is all national
universities with QEC. The QAA at HEC with the help of QECs in the universities are
making all over efforts to improve the quality and standards of higher education in
Pakistani universities to bring them at par with international universities (Batool &
Qureshi, 2007). But external efforts from QAA cannot succeed unless and until they are
complemented by the improvement in the internal processes of the institutions:
in general, quality comes out of internal processes of the universities and institutions. Thus, experience in most of world is that the Bottom-up approach represented by internal QA Systems is inevitably important to success while at the same time, the Top-to-Bottom approach, represented by external QA Systems, operates at the national level. A basic coherence between the universities and the Quality Assurance Agency needs to be reached at earlier stages so that the institutional quality Assurance efforts and those of the system do not challenge the autonomy of an institution but rather reinforce it with improved standards of quality which are comparable with high national and international standards of quality assurance and accreditation at any level (Batool & Qureshi, 2007, p.6).
Realizing the importance of quality assurance system, Government of Pakistan
has encouraged higher education institutions in the National Education Policy 1998-2010
to implement ISO 9001 quality management system and secure certification (Government
of Pakistan, 1998). The implementation of ISO 9001:2008, bottom-up approach, at the
higher education institutions will boost the Quality Assurance Agency’s efforts, top-to-
bottom approach, for academic quality improvement plus giving the institutions
international recognition as ISO 9001:2008 being an international standards.
Keeping the above scenario in view, this empirical study was conducted to
investigate the level of preparedness (GAP Analysis) of higher education institutions in
Pakistan for the implementation of ISO 9001:2008 and subsequently propose an ISO
9001:2008 based TQM framework for implementation of TQM in Pakistani HEIs.
Scanning of the literature reveals that Total Quality Management is a recent
phenomenon in the field of education and incredible efforts, money, human and other

4
resources are being invested in this regard. However, the concepts of quality, quality
assurance and Total Quality Management in education need explanation and clarification
(Karapatovic, 1998).
Quality is a vague term and in the corporate world where the concept of quality
should have been clearly defined, lacks a single definition (Garvin, 1988). Reeves and
Bendar (1994) while tracing the evolution of quality definitions have concluded that there
is no definite and all agreed upon definition of quality. The concept of quality becomes
more illusive when it comes to services and especially education where the product is
intangible. Different stakeholders perceive quality differently.
Horsburgh (1998) has described five broad definitions of educational quality as
exceptionally high standards, perceived consistency, fitness for purpose, value for money
and students’ transformative process and argued that quality can be defined meaningfully
only in terms of transformation and value addition to students’ knowledge and skills and
developing their critical ability. He has pointed out that the five definitions are not
mutually exclusive such as 'fit for purpose' or 'consistency' possibly means fit for
transformation and achieving consistency in transformation and both the terms are not
ends in themselves. He has further stated that quality is related to all aspects of the
students’ transformative process i.e. learning, teaching, assessment, institutional practices
and structures and even the prevailing climate and culture in the department or institution.
Like quality, TQM is a ‘hazy, ambiguous concept (Dean & Brown, 1994) and
‘notoriously imprecise term’ (Hill & Wilkinson, 1995). TQM is a management
philosophy that encompasses the whole organization. Despite the fact that much have
been written about TQM, there is no consensus on a single definition of TQM (Reid &
Sanders, 2000).
Quality Management, referred to by some authors as quality assurance,
encompasses all activities and functions concerned with the attainment of quality (Hill,
1983). TQM is a holistic approach striving for achieving quality in terms of all functions
of the enterprise through interaction among all the components of the organization as
well as the components themselves (Hafeez et al., 2006). But this empirical study focuses
on the core activities of teaching and learning of the educational organizations only.

5
TQM implementation in education has been useful both on administrative as well
as academic side. Wild (1995) has reported that the implementation of TQM at the
institution has resulted in debugged administration, motivated staff to take responsibility
for innovation, sharing of ideas regarding teaching, mutual problem solving approach,
customer focused course contents, increased students enrollment and marked overall
performance improvement.
According to Evans and Lindsay (2005) TQM is based on three fundamental principles:
a. focus on customers and stakeholders
b. participation and teamwork by everyone in the organization
c. a process focus supported by continuous improvement and learning
Van den Berghe (1997) has maintained that a TQM organization has some core principles
like management leadership and commitment, customer focus, continuous improvement,
process orientation, prevention instead of inspection approach to quality, teamwork,
quality everyone's job, systematic problem-solving, focus on facts and any organization
which has the above characteristic can easily embrace TQM.
TQM principles and concepts are implemented with the help of various business
excellence models and Frameworks like EFQM, MBNQA, Deming Prize, ISO 9000 etc.
These models and frameworks are based on quality gurus’ philosophies and represent
‘management best practices’. Effective TQM principles are recognized with quality
awards and certifications which in turn are based on these business excellence models
and frameworks. The two frameworks that have had the most impact on quality
management practices worldwide are the U.S. Malcolm Baldrige National Quality Award
and ISO 9000 Standards (Evans & Lindsay, 2005).
The selection of a suitable business excellence model or framework for the
implementation of TQM principles depends upon the type, structure, size and the
maturity of the quality culture of the organization in which models or framework is going
to be implemented. In this empirical study ISO 9001 Quality Management system
standards was chosen as tool for the implementation of TQM principles.
According to Van den Berghe (1997), in ISO 9000 environment, the fundamental
concepts and principles of TQM are implemented by:
a. Formulating a clear vision and mission statements

6
b. Establishing a quality manual
c. Systematic training of staff throughout the organization
d. Decision making is delegated to the lowest possible level
e. Seeking continuous customer’s feedback
Van den Berghe (1997) has asserted that these measures when implemented
successfully results in:
a. Better and consistent quality products and services
b. Reduction in defects, waste, problems, complaints and delays
c. Regular and timely innovations in products and services
d. Cost effective and efficient processes
e. Highly motivated, qualified and self-confident workforce
There are many examples where Total Quality Management and ISO 9000
standards have been successfully implemented in educational institutions both in the
developed world e.g. US, UK and Australia and developing countries like Malaysia,
Turkey, Thailand. Evans and Lindsay (2005) have reported the University of Wisconsin-
Stout, Oregon State University and Purdue University where TQM has been
implemented; with the University of Wisconsin-Stout as being the first university to win
Baldrige Award in Education category in 1999. TQM has been successfully implemented
in other US universities like Boston, Columbia, Northern Arizona and Tennessee
(Michael, et al., 1997), Harvard University, Michigan State University and Missouri State
University. In UK ISO 9000 has been implemented in different educational institutions
from schools to universities (Moreland & Clark, 1998). University of Wolverhampton,
first university certified for the implementation of ISO 9000, Leads Metropolitan
University and University College Dublin are some of the examples where quality
assurance system has been implemented successfully. In Australia many universities like
Victoria University, Queensland University and Monash University are a few among the
many universities that have embraced quality assurance and management practices. Open
University Malaysia, University of Technology and many other universities in Malaysia
are actively involved in the implementation of ISO 9001 (Jung, 2004). Similarly
universities in Turkey (Gozacan Borahan & Ziarati, 2002), Thailand and Hong Kong
have been implementing quality assurance and management practices.

7
1.1 Significance of the study
The study is significant from theoretical as well as empirical perspectives and
contributes to the current knowledge. Many researchers like Karapatrovic (1998) and
Doherty (1995) have stressed for researching application of ISO 9000 and the integration
of ISO 9000 and TQM techniques in education. Cheng and Tam (1997) have also
stressed on adopting a model which emphasizes on different aspects of a HEIs to achieve
total quality in education. Similarly Ho (1994) has emphasized on developing a
contextualized TQM model based on other’s experiences and has recommend using ISO
9000 as a structural framework for TQM implementation.
At theoretical level, the study is an original attempt to develop a conceptual ISO
9001 based TQM implementation framework and its various dimensions. This end has
been achieved by drawing information from the literature review on the subject and
empirical data gathered from the survey of public sector universities.
From empirical point of view, the study is important because it is the first
empirical study in Pakistan, to the best of the researcher’s knowledge, which investigated
different aspects of quality management in higher education institutions representing the
whole country. Moreover, it provides guidelines for practitioners for adopting and
implementing TQM through ISO 9001:2008.
This study contributes to the body of empirical research (survey) on service
quality in education. Also, it contributes to scanty empirical evidence regarding the
implementation of TQM and its effects on education in Pakistan. Therefore, this study is
a contribution to academic work, which attempted to develop a conceptual framework
that helps to understand the role/effect of quality in the education sector in Pakistan.
The implications of the study may be summed up as follows:
a. The study contributes to the current knowledge, in view of scare research in the
field of education, especially the effects of TQM implementation on the quality of
education in Pakistan.
b. The study provides higher education institutions with a Total Quality
Management implementation framework for continuous improvement.
c. The study may be of interest to students and other stakeholders that will benefit
from the improvement in educational institutions.

8
d. The framework enables the higher education institutions in Pakistan to do self-
assessment and link the self-assessment results to SWOT analysis and Balanced
Scorecard.
e. National Educational policy maker may utilize the findings of the study for future
educational policies.
f. The study provides a summary of standardized excellence models and TQM
implementation frameworks and their fundamental concepts.
g. The study enables higher education institutions in Pakistan to benchmark
themselves against international quality models.
h. The study assists the Higher Education Commission of Pakistan in its endeavours
to develop a quality framework for higher education institutions in Pakistan.
i. The results of the study may be used by the consultants, policy makers,
administrators and registrars in national and international educational institutions
about ISO 9000 in education.
j. International Organization for Standardization (ISO) may also be served by the
results of this research study since they can apply the suggestions from this study
to their own current goal of assisting developing countries implement ISO 9000.
k. The funding bodies such as the World Bank and UNESCO, which provide
information to developing countries about new directions in educational
improvement, may use the results of this research study.
1.2 Statement of the problem
In view of the spiraling pressures from different stakeholders for quality
education and services; depleting resources and increasing competition for attracting
excellent students and high performance faculty and staff, higher education institutions
(HEIs) find themselves in the tight corner to adopt customer-focused and market driven
approach and improve their over all performance (Bevans-Gonzles & Nair, 2004) Besides
these local, some external factors emanating from globalization like cross-border
education and widening networks of international educational institutions, changing
mode of education like distance education and e-learning and diversity in students’
community have made HEIs international players to work in a competitive and turbulent

9
world of today (Yorke, 1999). In order to respond to such challenges, HEIs are resorting
to TQM (Ho & Wearn, 1995, Bolton, 1995) through adopting different excellence models
and standards like MBNQA, EFQM and ISO 9000 etc. ((Paunescu & Fok, 2005; Hides,
Davies & Jackson, 2004). The selection of a model depends upon the prevailing
conditions in the institutions. Many educational institutions have become successfully
ISO registered. (Paunescu & Fok, 2005; Clark & Moreland, 1997) ISO 9000
implementation gives sufficient assurance to the faculty, staff, students, parents and other
stakeholders that the requirements regarding quality education, training and research are
met continuously. Moreover, ISO 9000 gives an institution an international recognition
(Paunescu & Fok, 2005; Peter & Wills, 1998).
The above situation calls for that national HEIs have a well established internal
quality management system like ISO 9001 and continuously satisfy the customers’ need
through implementation of TQM. These measures enhance organization’s productivity
and competitiveness. First step in this regard is to conduct GAP analysis to gauge the gap
between the actual situation and requirements of ISO 9001.
With this purpose in view the study was conducted to investigate the level of the
implementation of quality management practices in public sector HEIs in Pakistan and
their preparedness for the implementation of ISO 9000:2008. The study also proposed
ISO 9000:2008 based Total Quality Management implementation framework.
1.3 Research questions
Based on the above discussion the following questions were identified which the
study answered successfully:
a. What are the current best practices and experiences of TQM implementation in
HEIs?
b. Do HEIs in Pakistan have effective quality assurance processes in place for the
promotion and enhancement of quality of education?
c. What are the problems faced by HEIs to improve quality of education?
d. What are the factors that contribute to the implementation of TQM?
e. How quality management practices are interrelated in HEIs?
f. How quality management practices impact customer focus and satisfaction in
HEIs?

10
g. How can TQM be implemented in HEIs?
Details are given in a Strategy Matrix in APPENDIX J.
1.4 Research objectives.
To achieve the central aim of the study and to answer the above key research
questions about TQM and ISO 9000 implementation in higher education, the objectives
of the research study were:
a. To study the application and implementation of TQM through best practices
analysis.
b. To highlight the application of ISO 9001:2008 Quality Management System in
higher education.
c. To survey the presence of effective quality assurance processes in Pakistani HEIs.
d. To survey the application and implementation of TQM in Pakistani HEIs.
e. To explore the problems faced by the institutions to improve the quality of
education.
f. To explore critical success factors for successful TQM implementation.
g. To explore correlation among different management practices in HEIs.
h. To find out the factors influencing customer focus and satisfaction in higher
education institutions
i. To propose a TQM implementation framework for continuous improvement of
higher education institutions in Pakistan
1.5 Research hypotheses
The following main null hypotheses were developed to answer the research
questions:
H01:
There is no significant correlation among different aspects of TQM in higher
education institutions.
H02:
Different aspects of TQM have no significant correlation with Customer Focus
and Satisfaction in higher education institutions.

11
H03:
There is no significant correlation among the five main sections of ISO 9001 i.e.
Documentation Management, Management Responsibility, Resource
Management, Product Realization and Monitoring, Analysis and Improvement
when implemented in higher education setting.
H04:
Different aspects of TQM have no significant impact on Customer Focus and
Satisfaction in higher education institutions.
H05:
There is no significant difference regarding Documentation Management in the
universities as perceived by the stakeholders.
H06:
There is no significant difference regarding Management Commitment in the
universities as perceived by the stakeholders.
H07:
There is no significant difference regarding Customer Focus and Satisfaction in
the universities as perceived by the stakeholders.
H08:
There is no significant difference regarding Internal Communication in the
universities as perceived by the stakeholders.
H09:
There is no significant difference regarding the Infrastructure in the universities
as perceived by the stakeholders.
H010:
There is no significant difference regarding the Work Environment in the
universities as perceived by the stakeholders.
H011:
There is no significant difference regarding Teaching Processes in the
universities as perceived by the stakeholders.

12
H012:
There is no significant difference regarding Assessment Processes in the
universities as perceived by the stakeholders
1.6 Research methodology
Quantitative research method was adopted for the study which generates precise
measurements and the data thus collected is statistically analysed and interpreted. In this
type of research method structured questionnaire with predetermined response
alternatives is used and a large number of respondents are involved.
1.6.1 Research instrument for data collection
Different instruments are used to collect data such as questionnaires, interviews,
observations, and study of archival records (Best & Kahn, 1999). This research study
used postal questionnaire as a research instrument as it is an appropriate tool to get
information for the approach. The mailed questionnaire is economical in efforts and
money and permits a wider geographic contact. It gives respondents a sense of privacy
and is more adequate in situations in which the respondents have to check information
and give more valid data (Miller, 1991).
The Questionnaire was developed as per the requirements of the five sections of
ISO 9001: 2008. The instrument development is discussed in length in chapter 3 of the
study.
1.6.2 Population and sample
Population is a collection of all the elements the researcher is studying and about
which they are trying to draw conclusions (Levin & Rubin, 2000; Best & Kahn, 1999)
and a sample is a collection of some, but not all, of the elements of the population under
study, used to describe the population (Levin & Rubin, 2000).
The population of this study included all the higher education institutions
(universities and degree awarding institutions (DAIs) running in the public sector in
Pakistan. So, all the administrative and academic heads, full time teachers and students
studying at Bachelor and Master level constituted the population of the study. The

13
framework of the sample consisted of 25 HEIs, with due representation from all the four
provinces and AJK, represented by 25 vice-chancellors, 25 registrars, 25 deans, 500
teachers and 1500 students.
1.7 Ethical considerations
The research study was focused on investigating quality assurance practices
through ISO 9000 standards at public universities in Pakistan and the participants
included administrators, teachers and students. The main ethical issues that had to be
considered in this study were confidentiality, anonymity, and privacy of the participants.
The names of the participants and the departments’ title they belong to were kept
confidential throughout the study. Also, all other relevant information details were
anonymous.
These measures were employed to protect the reputation of the educational
institutions and pre-empt any harm to the participants. The researcher had given a
commitment to the participants that the respondents’ identity and information provided
would be kept secret and used only for this research study.
1.8 Delimitations of the study
Although the problem needed thorough investigation, however, due to time and
financial constraints the study was delimited as:
a. Educational institutions have many aspects and activities to study but the study
focused on the core activities i.e. teaching, learning and research.
b. Only public sector universities and degree awarding institutions were investigated
due to time and financial constraints.
c. TQM is a holistic and organization-wide approach but, due to constraints, the core
activities of the educational institutions were focused in the study. In this respect
the clause 7.4 of ISO 9001:2008 regarding purchasing was not touched upon.
1.9 Theoretical framework of the study
A theoretical framework of the study is given in figure 1.1 on the next page.

14
Fig
ure
1.1
. A t
heo
reti
cal f
ram
ewor
k o
f th
e st
ud
y.

15
1.10 Structure of the thesis This thesis is divided into five chapters. Each chapter consists of an introduction
to chapter contents and a brief description to set the contents in the context and how it
relates to other parts of the research study.
Chapter 1 serves as a background to the research study introducing the research
problem and presenting research questions, objectives and hypotheses. The chapter
introduces significance of the study, research methodology and contribution of the
research study. The chapter also gives details of the ethical considerations, delimitation of
the study and the theoretical framework of the study. It serves as the thesis outline.
Chapter 2 consists of literature review. It is divided into three sections: Section –
I that is related to Education System of Pakistan, Section – II Total Quality Management
and Section – III ISO 9001:2008 Quality Management System.
The Section – I consists of information related to historical background of the
education system in Pakistan especially higher education, structure of higher education
institution in Pakistan and trends in higher education and the efforts to improve the
quality of higher education in Pakistan.
Section – II consists of an in-depth review of the fundamentals of TQM and
related concepts, their definitions, and TQM development and various excellence models
as tools of TQM implementation. The chapter also addresses some issues regarding
implementation of TQM in higher education.
Section – III is about ISO 9001 Quality Management System Standard. It also
discusses the minimum requirements for implementation of quality management system,
the relationship between ISO 9001 and TQM, and the application of ISO 9001 in
education. The chapter also includes review of some national and international research
studies regarding implementation of TQM in education.
Chapter 3 explains the research design and methodology used to achieve the
study’s objectives, and gives the justification and interpretations for choosing the
research design and methodology. It also provides details of the research instrument
development and the procedures of collecting data for the study.

16
Chapter 4 presents the analysis of data collected from the survey of public sector
higher education institutions in Pakistan using ISO 9001 quality Management system
requirements as research instruments.
Chapter 5 focuses on the key findings of the study and construction of the TQM
framework for higher education in Pakistan. It also gives recommendations and
limitations of the study and provides some suggestions for further research in the fields of
TQM in higher education.
1.11 Operational definitions of the terms
a. Framework
It is a basic conceptual structure and description of a process or system
providing guidelines and tools.
b. Quality
i. Fitness for use (Juran, 1974)
ii. Achieving stated academic objectives and standards
c. Quality Assurance
All systematic and planned actions employed to ensure that appropriate
academic standards are being attained, maintained and enhanced by the
academic program, institution or system
d. Quality Management
A systematic set of operating procedures which is organization-wide,
documented, implemented and maintained while ensuring the growth of
organizational activities in a consistent manner.
e. Stakeholders
Stakeholders include Vice-chancellors, Registrar, Deans, Teachers and
Students
f. Top Management
Top management consists of Vice-chancellor, Dean and Registrar
g. Total Quality Management
TQM is a management philosophy that puts systems and processes in place to
meets and exceeds customer expectation. It is a relentless quest for continuous

17
improvement through documentation and the use of tools in a problem solving
atmosphere that features team action and good leadership (Spanbauer, 1995).
1.12 Summary
This chapter outlined the structure of the research. It provided the background and
general introduction to the research and the significance of the research study at both
theoretical and empirical levels. Also it presented the research aim, questions,
hypotheses, objectives and research methodology.
A theoretical framework for the study was presented in the chapter. The chapter
also focused on research tools and data collection from sampled higher education
institutions. It also included details about the questionnaire, ethical considerations and
finally the whole structure of the research study.
The next chapter deals with the educational system and highlights the current
situation of higher education in Pakistan. It also focuses on issue related to TQM and ISO
9000 in general and in higher education in particular.

18
CHAPTER 2
LITERATURE REVIEW
2. Introduction
The previous chapter gave background information about the research problem,
significance of the research and the research methodology. This chapter covers the first,
second, sixth and to some extent fifth objective of the study and gives an overview of the
education system of Pakistan, Total Quality Management and the related concepts and
critical success factors for TQM implementation. Also the chapter gives a detailed
description of ISO 9000 as a tool for implementing TQM in an educational setting.
The chapter is divided into three sections. First section deals with education
system of Pakistan. The second section deals with the concept of quality, quality
management system, TQM, TQM implementation tools and various issues regarding its
implementation in higher education and third section deals with ISO 9000 as a tool of
TQM and its implementation in higher education.

19
SECTION – I
EDUCATION SYSTEM OF PAKISTAN
2.1 Definition of higher education
Higher education is the highest level of education and split into undergraduate and
postgraduate. It refers to the academic programme offered to the students who qualify
prerequisite academic programmes at higher secondary level and generally leads to the
award of a first university degree or equivalent to students at successful completion of the
academic programme (OECD, 1997). Hosen & Nerille (1985) have elaborated higher
education as education offered at the level of post secondary education. Good (1973) has
includes all education above the level of secondary schools given in colleges,
universities’ graduate schools, professional schools, technical institutes, technical
colleges and normal schools in higher education category.
2.2 Education system of Pakistan
As per constitution education in Pakistan is a provincial subject but operationally
divided between the federal government and the provincial government. The federal
government frames education policies and plane in collaboration with the provincial
governments, develops curricula and standards (Shah, 2009). The provincial government
is responsible for developing and promoting education in the respective province. It
develops and executes its own plans in light of national education policies, available
resources and domestic environment (Saeed, 2007).
2.2.1 Administrative set-up of education
Constitutionally the education system of Pakistan is split into three tires of
administration i.e. federal, provincial and district, with defined responsibilities (Shah,
2009).
At federal level Ministry of Education, headed by incumbent Education Minister,
oversees the educational matters. There is also an education secretary who assists the
Education Minister. At provincial level respective Education Minister is the chief

20
executive. The provincial Education Departments work in collaboration with Federal
Ministry of Education in implementing national education policies. Education
Department in each province also oversees the management of elementary, secondary,
technical and higher education in the respective province (Ministry of Education, 2008).
Education system at provincial level has branched out into district level administration
and districts are divided into tehsil level administration (Shah, 2009).
The universities and degree awarding institution are autonomous but are chartered
by their respective provincial governments and the Higher Education Commission of
Pakistan (Saeed, 2007).
2.2.2 Educational structure
Pakistan has a centralized system of education and there is statutory requirement
for all schools and colleges to follow a national curriculum. Academically the education
system is three-tier i.e. elementary, secondary and tertiary or higher education (Shami &
Hussain, 2005; Saeed, 2007; Shah, 2009).
2.2.2.1 Elementary education
Elementary education is divided into primary (Grades I-V) and elementary/middle
(Grades VI-VIII) and is provided in primary and elementary/middle schools. Primary
level is extended over five year (Age: 5+ to 10+) and middle level is of 3-year’s duration
(Shami and Hussain, 2005; Saeed, 2007; Shah, 2009) as shown in the table 2.1
2.2.2.2 Secondary education
The secondary education consists of two stages: the secondary and the higher
secondary. The secondary education (Grades: IX-X) is of two years duration and
imparted in secondary schools. It covers 13+ to 15+ years cohort of children. The higher
secondary education (Grades: XI-XII) is comprised of two years duration and offered at
both intermediate colleges and higher secondary schools. Most of these schools have
middle classes as well. In all the provinces almost the same types of schools and colleges
exist to cater secondary classes. Total duration for secondary education is four years
(Shah, 2009) as shown in the table 2.1

21
2.2.2.3 Tertiary education
Tertiary or higher education in Pakistan starts after the completion of higher
secondary education (grade 12) and correspond to 16+ to 22+ years age cohort of young
people. The universities, colleges and other such institutions impart higher and
professional education (Shami & Hussain, 2006; Saeed, 2007; Shah, 2009). The first
degree under the traditional or conventional stream (B.A. and B.Sc.) is of two years, but
under the new stream (Honour Bachelor Programme) is of four years. The degree
programmes in medicine and pharmacy are of five years; the duration of first degree in
agriculture and engineering is either four or five years in different universities. Master
degree (M.A/M.Sc) is of two years as shown in the table 2.1. The duration of PhD is at
least three years; and mostly routed through M.Phil (two years) in the relevant discipline.
(Shami & Hussain, 2005; Saeed, 2007)
Table 2.1 Education System of Pakistan with Level, Class, Duration and Entry Age Level/Stage Class Duration Age on Entry
Elementary
Primary I-V 5 Years 5 Years
Middle VI-VIII 3 Years 10 Years
Secondary
Secondary IX-X 2 Years 13 Years
Higher Secondary XI-XII 2 Years 15 Years
Tertiary
Undergraduate XIII-XIV 2 Years 17 Years
Postgraduate XV-XVI 2 Years 19 Years
Complete structure of education systems of Pakistan along with progression
routes that leads to various certificates, diploma and degrees in different fields are given
in figure 2.1.

22
Fig
ure
2.1
. Ed
uca
tion
sys
tem
of
Pak
ista
n.
(B
osto
n G
roup
, n.d
.)

23
2.2.3 Curriculum development and examination
Curriculum development for schools was a centralized and cumbersome process.
Curriculum development from grades I-XII falls within the purview of the Curriculum
Wing at Federal Ministry of Education. For the purpose there are provincial Curriculum
Bureau or Curriculum Research and Development Centre (CRDC) which gives inputs
and assists Federal Ministry of Education in Curriculum Development. National
Curriculum Review Committee at Islamabad finalizes the draft after thorough
consultation with all the regions of the country for expert opinion. As a result the
curriculum of each subject is uniform throughout the country; however, textbooks for
similar subject may be different across the provincial text book boards (PTB) (Saeed,
2007). However, as a result of the 18th Amendment passed by the National Assembly,
curriculum development has been decentralized and concerned provincial Ministry of
Education is responsible for the curriculum development.
There are Urdu medium and English medium schools at elementary level with
majority of Urdu medium school in public sector. At primary level promotion to next
class is made on the basis of the results of internal examination conducted by the
respective school but at middle level there is a terminal exanimation conducted by
provincial Education Department (Shami & Hussain, 2005).
At secondary level also Urdu and English medium schools co-exist. At this stage
the students split in three streams of Science, Humanities and Technical on the basis of
the three elective subjects they opt for to study in addition to compulsory subjects such as
Urdu, English, Pakistan Studies, Islamic Studies and Mathematics. Boards of
Intermediate and Secondary Education throughout the country conduct examination at the
end 10th class for awarding Secondary School Certificate (SSC) for qualifying the
examination (Shami & Hussain, 2005).
The academic programme at higher secondary level is extended over two years
and leads to a graduate programme at colleges, universities or DAIs. Most of the science
subjects are taught in English at this level. Boards of Intermediate and Secondary
Education conduct examination at the completion of 11th and 12th class and on the basis
of combined results of both the examinations the students are awarded higher secondary

24
school certificate (Shami & Hussain, 2005). Earlier there was a single terminal
examination at the end of grade 12 for awarding higher secondary school certificate.
At higher education level each department at the university or college develops a
curriculum for the concerned discipline. The process starts with faculty developing a
broader framework of the intended curriculum including courses tiles and contents after a
thorough internal discussion among faculty members. Then a board of studies comprising
faculty members, external subject experts and representatives of affiliated institutes
discusses it in length and finalizes it by suggesting omissions, additions or alterations.
After that at operation level each teacher plans lessons for teaching the course contents.
However HEC has developed guidelines for each academic programme for maintaining
minimum standards in terms of minimum credit hours, nature and weightage of core and
other courses, and mode of assessment (Saeed, 2007). The medium of instruction at
higher education level is English with a few exceptions. The university conducts
examinations for awarding Bachelors and Master degrees.
2.2.4 Overview of higher education in Pakistan
Pakistan inherited a very weak base of higher education at the inception (Isani &
Virk, 2005). When India was subdivided, only two of the then existing 21 universities
were on the Pakistan side of the border – one in the West wing at Lahore, University of
the Punjab – established in 1882, and one in the East wing in Dhaka (Hayes, 1987).
Sindh University received its charter in 1947 and it was in the process of organization
when Pakistan came into being in that year (Isani & Virk, 2005).
Higher education system of Pakistan is comprised of universities/Degree
Awarding Institutions (DAIs) and affiliated colleges. These higher education institutions
are under the umbrella of Higher Education Commission (HEC). The Higher Education
Commission is an apex and autonomous body that allocates federal government funds to
the universities and DAIs and accredit their degree programme. The affiliated colleges
are bound to adopt the curriculum of the HEC funded universities/DAIs they have
affiliation; however, they are funded and controlled by the provincial governments. HEC
also funds the private sector universities to some extent for research and infrastructure
development and monitor them for quality and maintaining standards.

25
The Pakistan higher education sector is dominated by public universities and
DAIs; however, a phenomenal surge in the number of private higher education
institutions has taken place in the recent years. As a result of the endeavours by the HEC,
the number of universities and DAIs has risen to 132 which consist of 73 public and 59
private sector universities and DAIs (HEC, 2009) as is shown in the table 2.2 & 2.3. The
universities and DAIs fall into broad groups of general and professional universities and
DAIs. As far as academic programmes are concerned, public sector HEIs offers a variety
of academic programmes while private sector HEIs focus only on vocational and
professional programmes and courses like business, IT and Medicine etc. keeping in
view the market’s demand (Isani & Virk, 2005).
The enrollment ration in higher education in Pakistan is not very encouraging as
it only attracts 3% of the 17+ to 23+ years age cohort (Isani & Virk, 2005).
Table 2.2 Universities/DAIs in Pakistan
Total Universities
/ DAIs in the Period
Public Universities
/DAIs
Private Universities
/DAIs
No. of New Universities/ DAIs Established in the
Period
S. No Period Public Private Total
1 1947 2 2 0 0 0 0
2 1948-1952 4 4 0 2 0 2
3 1953-1959 5 5 0 1 0 1
4 1960-1966 10 10 0 4 0 4
5 1967-1973 11 11 0 1 0 1
6 1974-1980 21 21 0 10 0 10
7 1981-1987 26 24 2 3 2 5
8 1988-1994 35 29 6 5 4 9
9 1995-2001 68 41 27 12 21 33
10 2002-2008 124 67 57 26 30 56
11 2008-2010 132 73 59 - - 8
(Source: www.hec.gov.pk)

26
Table 2.3 Region-Wise Distribution of Universities/DAIs
Region Universities Public Private
AJK 4 2 2
Balochistan 8 6 2
Federal Area 16 13 3
Gilgit-Baltistan 1 1 -
NWFP 24 15 9
Punjab 41 22 19
Sindh 39 14 25
Total 133 73 60
(Source: www.hec.gov.pk)
2.2.4.1 Structure of a Pakistani university
Universities in Pakistan are established through Acts of the National Assembly or
Provincial Assemblies in accordance with the “Model Act” which provides the common
structure for university governance and management (Isani & Virk, 2005).
Typically a Pakistani university is headed by a chancellor. In federal area the
President is the chancellor and in provinces the respective governors act as the chancellor
of the universities. The chancellor is assisted by a pro-chancellor. In federal area, the
federal minister for education is the pro-chancellor while in the provinces the respective
provincial education ministers are the pro-chancellors (Isani & Virk, 2005).
The vice-chancellor is the chief executive officer and academic leader of the
university. The vice-chancellor is assisted by pro-vice-chancellor who is chosen from the
senior professors of the university and appointed by the chancellor to assist the vice-
chancellor. Other administrative heads are the registrar, the treasurer, the controller of
examinations, the resident auditor and the librarian. At the department level there are
head of the departments and director of institute who work under the respective dean.
University teaching staff is divided into the cadres of professor, associate
professor, assistant professor and lecturer, and are entitled to national pay scales from
grades 18 to 22, 18 being the entry point (Isani & Virk, 2005).
27
The authorities of the universities are generally the Senate, the Syndicate, the
Academic Council, the Board of Faculties and Studies, the Selection Boards, the
Advanced Studies and Research Board, the Finance and Planning Committee, the
affiliation and discipline committee.
Senate, the apex authority of the university, is a large body of university officers,
professors, members of the syndicate, Deans, Principals of colleges, eminent persons,
elected junior staff and representative of students in some cases. It is responsible for the
academic work of the university, appoints members of the syndicate and other authorities
and considers the annual statement of accounts and budgets (Isani & Virk, 2005).
The Syndicate, consisting of 20-25 persons chaired by the Vice-chancellor, is the
chief executive body of the university and comprised of both representatives of
academics (for example deans, university professors, lecturers, the principles and
university student unions) and people from outside the university such as the chief justice
of the province, the provincial educational secretary, eminent educationists and elected
representatives of the national or provincial assemblies. Academics however, dominate
the composition and have been seen to sway decisions in their favour through their
pressure groups and academic staff associations (Isani & Virk, 2005).
The academic council is the academic body of the university and is responsible
for establishing proper standards of instructions, research and examination and for
regulating and promoting the academic life of the university and the colleges. The actual
purpose of the university is carried out by the faculties, Boards of Studies, Boards of
Advanced studies and Research, Selection Boards, Finance and Planning and Discipline
Committee and the affiliation Committee. Syndicate and Finance and Planning
Committee play a vital role (Isani & Virk, 2005).
2.2.4.2 Problems and issues in higher education
Higher education in Pakistan is plagued with multiple maladies due to which
higher education institutions have not been able to achieve the main purpose of higher
education which is to produce people with moral and intellectual excellence and
academic ability that can develop logical thinking and contribute effectively towards the

28
industrial, economic, technological and social development of the country (Isani and
Virk, 2005).
World Bank Report (1992) (cited in Isani & Virk, 2005) has identified a flawed
institutional frame-work, inefficiency and ineffectiveness, problematic nature of design
and delivery of service, irrelevance and wastage, under funding and low productivity in
research as major issues of higher education in Pakistan.
Isani and Virk (2005) have observed that rapid increase in educational
institutions, limited funding and political inference in the form student unrest from time
to time have damaged the educational process, despite the government’s efforts to
improve the situation. Moreover, linkage between universities and industries has not been
taken place. The functioning of the universities is completely devoid of accountability.
Permanent tenure appointment of teachers and senior administrative staff extending over
and entire working life diminish incentives for better performance thus reducing the
capacity of universities and colleges to respond to social needs. They divide the problems
of higher education in Pakistan into two categories as:
I- Structural Issues:
a. bifurcation of higher secondary education from degree classes
b. short duration of Bachelor’s degree course
c. affiliation issues of feeding colleges
d. trichotomy of the system regarding governance and accountability
II- Functional and instructional problems:
a. lack of governance and accountability
b. limited access
c. tilt towards arts education and wastage
d. the problem of quality
e. faculty problems
f. outdated curricula
g. inadequate research
h. inadequate physical facilities and student support services
i. Under-funding

29
Hayes (1987) has stated that in Pakistan, programmes and enrolments have been
poorly conceived in their relationship to the labor market and future manpower
requirements. The largest enrolments have been in the fields where employment
opportunities in an underdeveloped economy are relatively scarce. Moreover, Pakistani
educational institutions lack in trained teachers, and handful teaching and physical
resources.
Some of the problems discussed in Government Five Years Plans with regard to
higher education as pointed by The Boston Group (n.d.) are:
a. insufficient lab and library facilities
b. lack of updated syllabi and textbooks
c. poor quality of research and faculty
d. lack of the student’s interest in technical subjects
The Boston Group (n.d.) has also reported some structural flaws regarding the
governance and internal management of the public universities which are:
a. lack of accountability and transparency
b. disconnect between role, responsibility and authority
c. absence of proper financial management
d. insufficient incentives for research
They believe that these flaws have led to the following problems:
a. Inability to attract and retain high quality faculty in sufficient number
b. Inadequate financial support form the government
c. Mismanagement of available funds within universities
d. Lack of research and development of intellectual property
Perusal of the available literature on education in Pakistan reveals that main problems
which the higher education facing are:
a. Lack of accountability and transparency
b. Poor quality in education
c. Poor management and Governance
d. Scarce financial resources
e. Waste of resources
f. Low standard and window-dressing in education

30
g. No documented data is available
h. No proper development and identification of processes and procedures
The government is well aware of the importance of quality higher education for
developing a quality workforce and knowledge based society and has urged the public
sector university in the Education Policy 1998-2010 to adopt ISO 9001 quality
management system to stream line the internal functioning of the universities and ensure
quality education. Similarly in the New Education Policy 2009, need for strengthening
internal quality assurance processes of higher education institutions to the level of
international standards of quality assurance in higher education has been emphasized and
the higher education institutions have been pushed for prioritizing the assurance of
quality of services and quality of outcomes in these intuitions. Besides, the government of
Pakistan has taken a number of effective measures to tackle these problems and improve
higher education standards in the country. Some of the measures are discussed in the next
section.
2.2.4.3 Quality assurance and enhancement practices in higher education in Pakistan
Higher education, after decades of neglect and under-investment, finally grabbed
the attention of the Government of Pakistan with the inception of Higher Education
Commission in 2002 replacing somnolent and ineffective University Grant Commission.
HEC has initiated a process of reform and investment of an unprecedented scale and pace
which has resuscitated the higher education institutions. New measures have been
introduced and existing ones improved for quality assurance and enhancement purposes
in higher education. Higher Education Commission (HEC) quality assurance and
enhancement set-up in higher education in Pakistan is given in figure 2.2.
Following modes of quality assurance and enhancement are in vogue in higher
education sector in Pakistan.
a. Quality Assurance Agency (QAA) and Quality Enhancement Cells (QECs)
Quality Assurance Agency (QAA) was established at HEC headquarters to
oversee the modus operandi of academic programmes at the universities and assure
quality to the stakeholders. Similarly QECs were established phase-wise in public as well

31
as in private universities and the target is ‘a QEC in every HEI’. In first phase, QAA set
up QECs in 10 universities in 2007. In the second phase QEC were established in further
20 universities in 2008. This phase was followed by setting up QEC in 15 public and 15
private universities in 2009-2010. In the latest phase QECs were established in 24 public
sector universities 2010-2011. As a whole there are 69 QECs in public and 15 in private
sector universities.
The purpose of these QECs is to be a focal point for streamline teaching learning
activities, performing self-assessment in these universities and also liaising with QAA
and HEC. QAA with the help of QECs is striving to implement HEC quality assurance
framework as given in figure 2.3 below.
The quality assurance framework of HEC consists of three stages. The first stage
was of developing standards and criteria for quality assurance and accreditation and to
publish guidelines manuals for the purpose. In the second stage of the framework,
Internal Quality Assurance System (IQA) was set up at HEIs. For the purpose self-
assessment manuals and guidelines were developed. The third stage was of establishing
External Quality Assurance system (EQA). At this stage standards and guidelines
manual for accreditation at programme as well as institution level were developed. HEC
with the help of QAA and QECs has successfully completed the first two stages and is
now in the third stage. Institutions level quality assurance has already started and visits
have been made by audit teams to various HEIs. Similarly accreditation Councils for
various disciplines have been set up and some are still in the process.
b. Accreditation
Accreditation is the oldest and the most prevalent approach to quality
improvement in academia around the world (Lenn, 2003). It is a process of evaluating
higher education institutions and professional institutions for regulating and quality
enhancement purposes. It requires an institution to show to external reviewers that it is
fulfilling the standards established by the accrediting body for running an academic
programme and awarding degrees (Lawrence & Dangerfield, 2001).
There are two types of accreditation: institution or general accreditation and
programme or professional accreditation. In general accreditation the institution gets

32
accredited for meeting general educational quality standards whereas in programme or
professional accreditation specific disciplines or colleges within the university like
education, pharmacy, architecture, business, engineering etc. are accredited (Lawrence &
Dangerfield, 2001).
Accreditation basically checks that the institutions/academic programmes have
educational objectives concur with national education policy and needs; have sufficient
financial, human and physical resources to achieve these objectives, have demonstrated to
achieve these objectives and are able to do so in future as well. Based on these factors,
accreditation bodies have developed criteria and standards which the candidate institution
supposed to meet or exceed. A committee or team constituted by the accreditation bodies
visit the candidate institution over a period of time to vet the institution or programme, as
may be the case, qualitatively and quantitatively against the accreditation bodies’ developed
criteria or standards. Possible outcomes of the accreditation processes may be granting
accreditation, deferring accreditation for sometime to give the institution time to make up for
the deficiencies pointed out by the accreditation team or no accreditation. At successful
accreditation the institutions are allowed to operate and they are eligible for funding and
conferring degrees which are accepted nationally (PEC, 2007; Lenn, 2003).
Initially there were six accreditation councils and further four were established by
HEC. Currently following accreditation councils are up and running vibrantly. (HEC,
2011)
Existing Accreditation Councils/Professional Bodies:
a. Pakistan Engineering Council (PEC)
b. Pakistan Bar Council (PBC)
c. Pakistan Medical and Dental Council (PMDC)
d. Pakistan Council for Architects and Town Planners
e. Pakistan Pharmacy Council
f. Pakistan Medical and Veterinary Council
g. Pakistan Nursing Council
h. National Council of Homeopathy (NCH)
i. National Council for Tibb (NCT)
Accreditation Councils Established by HEC
a. National Computing Education Accreditation Council (NCEAC)

33
b. National Agricultural Education Accreditation Council (NAEAC)
c. National Accreditation Council for Teacher Education (NACTE)
d. Pakistan Business Education accreditation Council (PBEAC)
c. Ranking of the HEIs
Ranking, also called league table and report Card (RC), includes vetting the
relative performance of academic programme or higher education institutions against a
set of objective criteria (research output by the institution, number of qualified faculty,
number of students, student-faculty ratio etc.) and perceptions from alumni, professors
and employers. The purpose is to help students make informed decisions regarding their
educational future by providing comparable information on the quality of higher
education institutions (Cremonini, Westerheijden & Enders, 2008).
Though controversial for being inputs oriented and methodologies adopted for
ranking, ranking systems and leaguer tables of universities exists around the world and
still capturing further interest and attention of the people for quality assurance and
improvement purposes. Internationally both institutions and programme ranking is done
by concerned quality assurance agencies as well as the press like U.S. News & World
Report and the Times Higher Education Supplement The Good Universities Guide
(Australia); The Maclean’s Guide to Canadian Universities; The Times Good University
Guide (UK); The Guardian University Guide (UK); and US News & World Report,
America’s Best Colleges (Yorke, 2009, Cremonini et al., 2008, Merisotis & Sadlak,
2005; Dill & Soo, 2004).
In Pakistan first ranking of the public universities was done type-wise in 2005 in
order to help students and their parents make a correct choice of the institutions for
higher studies and also provide HEIs an opportunity to compare themselves against the
peers. The methodology and model for ranking was developed by the HEC Quality
Assurance Committee (QAC). The inputs for the ranking include information on:
Facilities: books and journals and laboratories instruments, computer and internet
access, infrastructure such as laboratories and classrooms (weightage
assigned = 15%)
Finances: recurrent and developmental budget (weightage assigned = 15%)

34
Research output: publication in national and international journals by the
faculty, research projects, research seminars, conferences and
symposia of national and international level held at the university.
(weightage assigned = 26%)
Students: number of student at graduate and postgraduate level, M.Phil and PhD
students, number of students enrolled and passed out (weightage
assigned = 17%).
Faculty: number of fulltime and part time faculty, PhD and non-PhD faculty
(weightage assigned = 27%)
Similarly private universities and institutes were segmented into W, X, Y and Z
categories as per quality criteria set by Cabinet for 2007. Category (W) consisted of those
universities and institutes that met the major requirements of the criteria of eligibility for
running degree awarding programmes and having sufficient resources for that. Category
(X) included the universities and institutes with minor deficiencies and they were asked
to make up for those deficiencies by 2007.Universities and institutes not meeting the
requirements were grouped in Category (Y) and universities and institutions that were
seriously deficient were put together in Category (Z). The universities and institutes of
the last two categories were given specific time to make up for deficiencies and those
seriously deficient were closed down.
Despite the above measures, HEC has launched various programmes under
various heads to improve higher education standard in the country. Some of the steps
taken by HEC are (HEC, 2009):
a. Faculty and human resource development through indigenous and foreign
scholarship, post doc. Fellowship and in-service teachers training programmes
b. Performance based employment for faculty through Tenure Track System with
handsome salary packages.
c. Improving access and increased participation by opening up new HEIs in public
as well as private sector
d. Promoting excellence in learning and research by establishing digital library,
research repository, research laboratories across the country and sponsoring
research activities like seminars, conferences and symposia etc.

35
e. improving and strengthening university-industry linkages
f. Establishing vice-chancellor search committee developing criteria for faculty
appointment and promotion
g. Updating curricula and establishing minimum criteria for PhD and M.Phil
students
As a result of these measures there has been 168.5% increase in students’
enrollment and a tremendous surge in research publications (HEC, 2009).
Despite these measures, as per the researcher’s observation – being a faculty
member, there is a lack of motivation and a resistance to change on the ground. Total
focus of the self-assessment activities is on faculty and teaching learning processes with
almost ignoring the establishment and other support services. There is common feeling
among the faculty that something exotic is being imposed on them and policing them to
follow. In such circumstance there is a need for more training, awareness and capacity
building on quality improvement related matters and implement a management system
based on TQM principles that encompasses all aspects of the institution by involving all
strata of the institution so that the faculty may not feel single out. Such approach will
usher in quality culture where everything would be streamlined and well established.
According to Moosa (2009) maturity of quality culture can be gauged from the fact that
routine activities are performed to customer satisfaction without being reminded or asked
for.

36
Figure 2.2. Quality assurance set-up of HEC (Source: www.hec.gov.pk)
Institutional Level
Stage III
Stage I
Program Level
Stage II
IQA
EQA
Figure 2.3. Quality assurance framework of HEC (Source: www.hec.gov.pk)

37
SECTION – II
TOTAL QUALITY MANAGEMENT
The section deals with the evolution of TQM and discusses TQM related
concepts. Firstly it highlights the history of quality and total quality management and
concludes the definition for both. Secondly, it focuses on quality in higher education and
explains its needs, definition and characteristics. Thirdly, difference between students and
customers, educational product and finally it discusses the models of excellence criteria.
Total quality management is a management concept and philosophy. It is an
integrated organizational effort designed to improve quality performance at all levels of
the organization. It is a customer driven and holistic approach focusing on building
quality into the processes of the product realization as opposed to simply inspecting for
poor quality after production.
TQM is all about the quest for ‘quality’ in every aspect of the organization but the
quality in itself is notorious for being vague and ambiguous. Similarly TQM is the most
confusing concept despite the fact that much have been written about it. The definition of
TQM varies from author to author as the meaning ‘quality’ changes from person to
person. So before exploring more about TQM, let’s discuss about ‘Quality’ first.
2.3 The Concept of quality
Etymologically the world ‘quality’ originates from the Latin word ‘qualis’
meaning ‘of what kind’1. The concept of quality has been used in this sense since the
dawn of civilization. Even for the pre-historic people the concept of quality was present
and they had to learn which food can be eaten and which cannot and which hunting tools
would best serve their purpose. The longevity of the hunter’s survival was the measure of
quality control of the tools as better the tools, the better their chances were of survival
(Samith, 1993; Lewis & Smith, 1994; Maguad, 2006). In other words the concept of
quality was ‘effectiveness’. Similarly the history shows that the wealthy people and
1 Webster’s New World College Dictionary, 3rd Edition

38
leaders differentiated themselves by getting high quality products and services. For rich
people ‘quality’ meant perfection or excellence.
This shows that quality is dynamic in nature and its meaning changes from era to
era and form person to person. The evolving nature of the quality makes it difficult to
define it in clear terms. The difficulty in defining quality exists regardless of product, and
this is true for both manufacturing and service organizations.
The scanning of the literature reveals that there is no agreed definition of quality.
Some people view quality as "performance to standards." Others view it as "meeting the
customer's needs" or "satisfying the customer." Let's look at some of the more common
definitions of quality.
2.3.1 Defining quality
Defining quality is not an easy task because different people have different ideas
about the high quality. Majority of the consumers find it difficult to define quality in
precise terms, but they know it when they see it. In other words quality lies in the eyes of
the beholder (Goetsch & Davis, 2000).
The definition of quality depends upon the role of the people defining it. There
are as many definitions as there are people writing about quality. Quality depends upon
the individual’s perception of excellence. According to Garvin (1988) quality is easy to
visualize but difficult to define. Even there is a lot of variation in the definitions rendered
by some quality pioneers and gurus. Shewhart (1931) has defined quality as a thing said
to have the positive attribute of conformance to specified standards. Similarly quality has
been defined as value for money (Feigenbaum, 1956, 1951), fitness for use (Juran, 1974),
conformance to requirements (Crosby, 1979), and delighting the customer (Deming,
1986) and 'the routine optimization of product and process prior to manufacture'
(Taguchi, 1986). According to the International Organization for Standardization (ISO
9000) quality is the totality of features and characteristics of a product that bear on its
ability to satisfy stated or implied needs (Ho, 1994). The American National Standards
Institute (ANSI) and the American Society for quality define quality as the totality of the
features and characteristics of a product or service that bear on its ability to satisfy given
needs.”

39
Juran’s definition of quality as 'fitness of purpose' is considered to be one of the
most concise definitions of quality in the literature. Fitness for use focuses on how well
the product performs its intended function or use.
Sometime quality is judged totally subjectively and based on some psychological
criteria like appearance, atmosphere of the environment or belong to some brand or
country. For example, a hospital with average health care services but a very friendly
staff may leave the impression of high quality. Similarly, we commonly associate certain
products like Rolex watches and Mercedes-Benz automobiles with excellence because of
their reputation. For some people quality is manifested in the support services of the
product like after sale service and other service associated with the product or service.
For example, the quality of a university is judged not only by the quality of academic
programmes and the faculty and staff it has but the quality of other services it offers like
timely, efficiently and accurately completing the paperwork also matters (Reid &
Sanders, 2002).
According the Reeves and Bender (1994) the above contradictory and
complimentary elements of definitions produce varying results across a business
organization. There is neither a universally acknowledged definition for quality nor one
that would fit every eventuality. However, they have been maintained that quality can be
measure exactly when it is taken as conformance to specifications.
Goetsch and Davis (2000) argue that defining quality as meeting and exceeding
customer’s satisfaction is though a critical aspect of quality but it is not the only aspect.
They accept there is no universal definition of the quality and point out that some
commonalties do exists among the existing definitions of quality in the literature like
quality involves meeting or exceeding customer expectations, quality applies to products,
services, people, processes and environment and quality is an ever changing state. With
these common elements in view, they define quality that “Quality is a dynamic state
associated with products, services, people, processes and environment that meets or
exceeds expectations” (Goetsch & Davis, 2000, p. 47).
This shows that quality is a multi dimensional and complex concept. No single
clear definition of quality in precise terms is possible. In order to explain and achieve

40
quality, certain dimensions have been mentioned for both manufacturing and service
quality.
2.3.2. Dimensions of quality
As quality is a relative term and difficult to measure, some authors have come up
with certain dimensions of quality which makes it easy to determine quality of a product
or service. These dimensions are actually translated overt and covert expectations of the
customers.
Garvin (1987) has defined product quality in terms of eight dimensions of a
product such as performance, features, reliability, conformance, durability: serviceability:
aesthetics and perceived quality. Similarly five dimensions have been mentioned of the
service quality which are reliability, responsiveness, assurance, empathy and tangible.
According to Reid and Sanders (2002) four dimensions of quality i.e. quality of product
or service design, quality of conformance to the design, ease of use, post-sale service are
essential to ensure total customer satisfaction.
This shows that quality involves much planning, from the design phase all the
way to providing customer support long after the sale.
2.4 Approaches to quality management
Quality is by no means a new concept. The quest for quality has been there
throughout the human history however, approaches to quality vary from era to era
(Maguad, 2006).The quest of quality starting with single person in the ancient times and
has now reached organization wide called total quality management after passing the
through the stages of quality control and quality assurance.
2.4.1 Craftsman, guilds and the quality
During the Middle Age in Europe, the skilled craftsperson served both as
manufacturers and inspectors. Craft guilds2, consisting of masters, journeymen and
apprentices emerged to ensure that craftspeople were adequately trained (Evans &
Lindsay, 2005). There were no formal arrangements for quality assurance. The craftsman
2 In Middle Ages guilds were craft and trade organizations or unions (Maguad, 2006).

41
performed all the tasks of a production cycle. According to Juran (1995) as cited by
Maguad (2006) the craftsman was his own customer over and over again. He himself
ensured quality of product during the manufacturing process and the quality was built
into the final product (Evans & Lindsay, 2005, Maguad, 2006).
During the middle of the eighteen century, a French gunsmith developed a system
for manufacturing muskets to a standard pattern using interchangeable parts. In 1798 the
idea was brought to America. The use of interchangeable parts needed careful control of
quality as the parts must be produced according to a carefully designed standard to fit
together. For the purpose special machine tools were designed and workers were trained
to make parts according to a fixed design. The parts were then measured and compared to
a model. There were many problems due to variations in production processes. However
the concept of interchangeable parts eventually led to the Industrial Revolution in 1770s
(Evans & Lindsay, 2005).
2.4.2 Inspection based quality control
In the nineteenth century during the Frederick W. Taylor’s Scientific
Management era, quality management meant inspecting products to ensure that they met
specifications. The notion of quality as conformance to specification was prevalent. The
Taylor’s philosophy forced segmentation in planning function and execution function
which led the quality control fell into the hand of the inspectors and separate quality
departments were opened. The finished products were inspected for quality and defective
items were scraped (Evans & Lindsay, 2005).
2.4.3 Process based quality control
The beginning of the 20th century marked the inclusion of “processes” in quality
practices. During this era the use of statistical methods and systems to control quality led
to a greater process control and fewer incidence of non-conformance. The statistical
quality control was a development on inspection to focus on identifying and eliminating
the problems that cause defects. Shewhart and his colleagues at Bell Telephone
Laboratories developed control charts and sampling techniques which proved a popular

42
means of identifying quality problems in production processes and ensuring consistency
of output.
Shewhart and his colleagues including Harold Dodg, George Edwards and W.
Edwards Deming etc were assigned with developing new theories and methods of
inspection for improving and maintaining quality. Shewhart put quality control on the
scientific map by recognizing that variability was a fact of industrial life and that it could
be understood using principles of probability and statistics. He observed that no two parts
would normally be manufactured to the same specification, as in most cases, raw
materials, operator skills and equipment would all vary to some extent over time. He then
introduced the idea of statistical process control, whereby control charts were made use
of in the production process at shop-floor level in examining whether production values
fell within acceptable limits or ranges. Through this analysis, the concept of variability
became important.
2.4.4 Quality assurance
The quality assurance stage marked a shift in the approach to managing quality
from detection to prevention. During World War II, the American military department
began using statistical sampling methods and procedures, and imposing strict standards
on suppliers. Free training courses in the statistical method developed with in the Bell
system were offered to the suppliers. As a result quality specialists emerged and
statistical quality control practiced throughout manufacturing industries (Evans &
Lindsay, 2005).
During this time military standard MIL – STD were developed and professional
societies like American Society for Quality were founded to develop, promote and apply
quality concepts. The most significant contribution of the quality control system was that
it provided sampling inspection, rather that 100% inspection which was costly and time-
consuming. However, the job being done was still basically the same inspection job
(Gravin, 1988, Evans & Lindsay, 2005).
During this period, the production system has become more sophisticated. The
key elements considered important for quality control were quantifying the costs of
quality, total quality control, reliability engineering, and zero defects. Advanced quality

43
planning, improving design of the product, process and services, thus improving control
over the process and involving and motivating people, were taken on board, in this way
quality had a broader implication for management than during the quality control stage
(Gravin, 1988).
Quality assurance is widely known as a prevention-based system which improves
product quality by placing emphasis on product and process design. The approach
stressed detection of error at source. Emphasis was on the entire production chain from
design to market, and the contribution of all functional departments. Quality planning and
improvement certainly begin when top management include prevention, as opposed to
detection, in organizational policy and objectives, and start to integrate the improvement
efforts of various department (Gravin, 1988).
2.4.5 Total quality management
In the Post-World War II there was an expansion in the concept of quality control.
In the pre-war era the focus of quality control was on the control of variations and quality
became a technical discipline. During the mass production, products quality degenerated
as the focus was on production rather than on quality. The top management delegated the
responsibility of quality to the quality managers. They were little interested in quality
improvement or the prevention of defects and errors, relying instead on mass inspection.
It was realized that the detection-type system was not sufficient to eliminate the root
cause of the quality problem and a broad and organizational approach is needed to
prevent problem happening at the first place.
Quality experts like Sarasohn, Deming, Juran, Feigenbaum, Ishikawa and others
expended and transformed the concept of quality from a mere technical system to a
broader body of knowledge known as total quality with management implications in
production (Maguad, 2006). Feigenbaum (1951) (as cited in Hafeez et al., 2006)
introduced the concept of total quality control and took a total system approach to
quality. His quality principles emphasize prevention-based system by placing the focus
on product, service and process design and by streamlining the source activities.
After the Second World War Japan, in a bid to improve the quality of the exports
goods to improve its economy, established Union of Japanese Scientists and Engineers

44
(JUSE) and turned to the West for assistance. As a result many experts W.S. Magill and
Homer Sarasohn, W. Edwards Deming Joseph M. Juran and Armand Feigenbaum visited
Japan to aid them in the transformation of its electronics and telecommunications
industries. Deming lectured on the statistical quality control and quality management
with focus on the top management rather than the quality specialists alone. The result was
that with the support of top managers the Japanese integrated quality throughout their
organizations and developed a culture of continuous improvement. Due to total quality
management approach to quality Japanese rose to industrial pre-eminence (Evans &
Lindsay, 2005; Maguad, 2006). Seeing the success of the Japanese, the American
recognized quality excellence as a key to worldwide competitiveness and was heavily
promoted through out the industry. Majority of the companies focused not only on
improving internal operations but also on satisfying external customers (Evans &
Lindsay, 2005). This enthusiasm about the quality excellence resulted in national quality
awards and quality certification. The ISO 9000 series of quality-management standards,
for example, were published in 1987. The Baldrige National Quality Program and
Malcolm Baldrige National Quality Award were established by the U.S. Congress the
same year (Reid & Sanders, 2002).
New concept of quality was total quality management which was proactive,
designed to build quality into the product and process design as against the old concept
which was reactive, designed to correct quality problems after they have occurred (Reid
& Sanders, 2002).
The quality, initially dependent on single person, now encompassed the whole of
the organization. Moreover, quality moved beyond manufacturing into service,
healthcare, education and government sectors. Next section discusses the philosophy of
TQM in more detail.
2.5 The philosophy of TQM
Total quality management (TQM), also called Continuous Improvement (CI),
Continuous Quality Improvement (CQI) and Total Quality (TQ) in the literature
(Spanbauer,1995), is a philosophy focused on improving a product quality by weeding
out the root cause of the defects and fine tuning every aspect of the organization where

45
quality in the assigned task is the responsibility of everyone. It is a continuous struggle
for excellence through continuous improvement. Customer is at the center of all TQM
endeavours (Reid & Sanders, 2002).
2.5.1 Basic definitions of total quality management
Just as there are different definitions of quality, there are different conceptual and
operational definitions of total quality (Goetsch & Davis., 2000). This section discusses
various definitions rendered by different authors of repute.
Oakland (1989) has defined TQM as an approach of organizing the whole
organization to improve its effective and business flexibility by involving and organizing
each and every unit of the organization i.e. every department, activity and person at every
level.
Reid and Sanders (2002) have differentiated TQM from the old approach to
quality. They have maintained that TQM in preemptive in nature and focuses on
identifying the root causes of the problem and eradicating them while the old approach to
quality was reactive and inspected the finished product for non-conformity when it had
already occurred. Like Oakland they have maintained that TQM is organization-wide and
quality is required in every aspect of organization and customer driven. They are of the
view that TQM encompasses improvement and involvement not only in the technical
aspects of the organization but also the human aspect like customers, employees and
suppliers.
Goetsch and Davis (2000) have emphasized the continual improvement aspect of
TQM and defined it as an approach to enhance the competitiveness of the organization
through continual improvement in the quality of every aspect of the organization;
whether product, services, people, processes or the prevailing environment.
Spanbauer (1995) has looked at TQM as a management philosophy focused on
meeting and exceeding customer expectations through installing a system of documented
processes under a committed leadership and featuring teamwork; and continuously
improving them by using problem solving tools.
This reveals that there are as many definitions as the writers. None of
aforementioned definitions have stated in clear terms what total quality is and how it can

46
be successfully implemented. However, there are some common elements in the existed
definitions of total quality in the literature on the basis of which some authors have drawn
principles or elements of TQM i.e. top management commitment, customer focus,
continuous improvement and team-work etc. that help implement TQM.
Moreover, among the above definitions, Spanbauer’s (1995) seems to be a solid
and definite one. Keeping in view the nature and purpose of the study, Spanbauer’s
definition of TQM was adopted as the operational definition of the study and against
which the proposed model was benchmarked.
As per Spanbauer’s definition, TQM is expected to bring in continuous
improvement in the quality of products and services of the institution and in the long term
would contribute to the institutional growth, people development, nurture a culture
featuring committed leadership, system thinking, process approach and employee
empowerment in order to satisfy present and future customers’ needs.
2.5.2 Quality in education
Quality in higher education has been a topic for discussion since long. In the past
stress was on inputs and national and international standards however, with time the
focus shifted to processes management and outputs assessment. The latest approach is
more customer focused and market oriented and the products are measured on the basis
of how well they satisfy the employers and other customers (UNESCO, 1996).
Educational institutions are service organizations but compared to the quality of
other service organizations like banks, hotels and health care services, the definition of
quality in education is difficult and controversial. Some authors look at quality in
education as value addition through teaching and research while others include the
quality of support services and customer satisfaction. Korukonda, (1992) has looked at
quality as a qualitative change in the student.
There is no precise or universal definition of quality. Similarly academic quality
is judged by a variety of parameters. It is seen as a mentally stimulating environment and
learning conditions supported by excellent teaching materials and teachers who stimulate
the students’ involvement and interest and assist them in achieving new points of
understanding whether those be cognitive, affective or psychomotor. While it is easy for

47
an experienced educator to immediately judge high-quality teaching but he is at a loss if
asked to define it precisely. In general, the quality of education is often measured by the
teaching conditions (inputs), and much more rarely by the learning (outcome) (UNESCO,
1989). The faculty, the infrastructure and support provided to the faculty and the students
for teaching and research and the efficiency of operation of university academic programs
define the conditions conducive to quality education (Government of Pakistan, 2007).
Discussion on the quality definition in the previous and the present section reveals
that it is difficult to define quality precisely or choose any single definition as it does not
cover the concept of quality completely. However, Juran’s definition of quality as
“Fitness for the Purpose/Use” seems to be the most comprehensive and majority of the
authors seems agree on the “fitness for purpose” definition of quality (Lenn, 2003) and
the same is adopted as an operational definition of ‘quality’ for the study. The phrase
‘Fitness for the Purpose/Use’ means how well the product performs its intended function
or use (Reid & Sanders, 2000). This definition in higher education implies that a course
of study in a higher education institution is of satisfactory quality when it conforms to the
particular standards or levels of achievement for the purpose it was designed (UNESCO,
1996).
In the education context, the educational products, controversies aside, are the
academic programme and support services and the student depending upon the type of
the customer (Karapatrovic, 1998b; Kanji & Tambi, 1999). If students are considered as
primary customer then the academic programme and support services is the product but if
the employers and other stakeholders are considered as customers, then students is the
product. In this respect the quality of the academic programme and support services
would be its fitness for purpose which is transformation and satisfaction of the students.
Similarly the quality of the other product i.e. the student would be how well it satisfies
the employee and other stakeholders. So here quality of an academic programme would
be that enhance students’ satisfaction and brings desirable transformation in the students
to the satisfaction of other stakeholders of the educational process.
As quality is customer driven (Reid & Sanders, 2000) it is essential to identify the
customer of the educational product. Next section contains discussion about the customer
and the product of the educational process.

48
2.5.2.1 Product and customer in education
In contrast to industry, the product in services is intangible and hence not well
defined. The matter is further exacerbated when it comes to education sector because in
education defining the product is comparatively more difficult to identify than other
service organizations like banks, restaurants, airlines and health care units etc., the reason
being variety of customers and stakeholders are involved (Galloway, 1998).
There is a difference of opinion regarding ‘what is the product of educational
process’ and ‘who is the real customer in the educational process’. The deferent kinds of
products of the educational process identified in the literature are the students’ knowledge
and skills and the students themselves and the academic programme.
Karapatrovic (1998b) has maintained that the product of the educational process
can be the students, the knowledge, experience and skills and overall competence the
student gains in the course of his/her studies. After graduation, the students’ knowledge is
used by the employer or the students for his/her own purposes. Other possible products
could be the research output of the students and faculty and the academic programme. In
the MBNQA Education Criteria (2011-2012) the term “customer” has been used for the
students and the stakeholders while educational programs or services have been referred
to as “products” of the educational organization.
In given circumstances, it seems plausible that by identifying the customer we can
determine the product of the educational process. Like product, the customer of the
educational institutions is a debatable issue. In the literature there are as many customers
as the stakeholders. (Eagle & Brennan, 2007) Majority of the authors believe students as
the customer. On the other hand there are some authors like Galloway (1998) who are not
ready to accept the notion of students as the customer. They argue that it is the parents
who pay the fees for the students’ education, so only they and not the students are the
customers. This argument is again debatable as there are students, especially in the West,
who support their studies wholly or partially and they do not like either there progress
reports to be sent to their parents. Similar conflict arises in case of companies that send
their employees for training and education and sponsor them while they are away from

49
their job. Government also invests in the education system of the country and indirectly
in the students’ education.
Customer is at the center of every business but in education the status of the
customer is somewhat different. The traditional metaphor of ‘customer is the king’ may
not be applicable to education customers as education has so many ‘Kings’ with varying
interests which makes it extremely difficult to please one and ignoring the others
completely (Eagle & Brennan, 2007). It is not difficult to imagine what ‘ delight the
students’ would mean but Spanbaur (1995) has contended that students cannot be
awarded take-away degrees or absolve them of doing assignments, test and examination.
In other words the students have some responsibilities. Some authors have preferred the
word ‘client’ instead of customer for the students as they consider the word ‘customer’ as
inappropriate in an academic environment. Eagle and Brennan (2007) have preferred to
consider students as professional customer or client with clarification that students are
different in some respects as compared to the customer in a corporate environment.
The student’s role in the educational process is multi-faceted which makes them a
unique customer. Education is a transformation process where values addition takes place
to the student’s knowledge and skills. Students, unlike normal customer, are very much a
part of this transformation process where values addition takes place to their knowledge
and skills and at the same time he is a customer too. Normally a customer is not a part of
the service process (Evans & Lindsay, 2005). Secondly a customer, who can pay, avail
the services or the product but in case of the student, despite their ability to pay the fee,
they are only admitted when they qualify. Admission is open to all but qualified ones are
admitted. Thirdly the student does not pay for their education. Other stakeholders like
parents and government pay partially or wholly for their education (Sirvanci, 1996;
Galloway, 1998). Lastly students are continuously examined for their leaning but in case
of normal customer it is unthinkable to examine them whether they deserve the product
or services they purchase (Sirvanci, 1996). Some authors see the metaphor ‘customer’
misfit for the students as the word sound too commercial in tone and recommend ‘client’
instead. The scanning of the literature shows a number of customers like students,
parents, employers, society and government. Kanji and Tambi (1999) have divided them
into internal and external customers and then again divide the two categories in to

50
primary and secondary customers as shown in the figure 2.4. Student, as educational
partner are secondary internal customer while employees are primary internal customer.
At the same time students are external primary customer and employers, parents,
government and society as secondary external customer.
Figure 2.4. Customers of higher education. (Kanji & Tambi, 1999) It can be concluded that student is both a customer and a product depending upon their
role in the educational process. Student starts as a primary external customer, plays a dual
role of secondary internal customer and a product in process and ends up as a product. In
short academic programme and support services are the product when the students are
considered as the customers and student is the product when employers, parents,
government and society at large are considered as customers.
2.5.3 Quality assurance in education
Quality Assurance includes “all systematic and planned actions which are
necessary to provide sufficient confidence that a product or service will satisfy given
requirements for quality. Quality assurance is a part of quality management focused on
providing confidence that quality requirements will be fulfilled” (ISO 9000: 2005). In

51
academic setting quality assurance refers to all the arrangements (methods and activities)
for ensuring quality and standards.
quality assurance (QA) in higher education is a systematic process of assessing and verifying inputs, outputs, and outcomes against standardized benchmarks of quality to maintain and enhance quality, ensure greater accountability and facilitate harmonization of standards across academic programs, institutions, and systems. (UNESCO, 2008, p. 2) Quality assurance is currently practiced in a number of ways from self-
assessment, internal review to more comprehensive measures like accreditation, external
audit and independent peer review. Assessment, audit and accreditation are the most
frequently used methods for quality assurance in educational institutions (UNESCO,
2008; Lenn, 2003). Assessment focuses on outputs and quantitative rather than
qualitative measurement. It measure the current level of attainment with regard to set
target which results in a grade or descriptive like excellent, good, satisfactory or
unsatisfactory (Lenn, 2003). An external quality audit is qualitative approach and
measures that to what extent the institution is achieving its objectives. It measures to
what extent the institutions is achieving what it claims (explicitly or implicitly) to achieve
or produce. It asks, “How well are you doing what you say you are doing?” (Lenn, 2003)
Accreditation is a broad term and includes quality assessment as well as quality
improvement addressing both inputs and outcomes. It evaluates whether the institution
qualifies for a certain status or not and the question it poses is “Are you good enough to
be approved (to confer degrees)?” Accreditation is the overwhelming choice of the
governments around the world for quality assurance at educational institutions for which
they have established accreditation councils and other accreditation bodies. Higher
education institution gets accredited when there are ample proofs that the institution has
clear and apt academic objectives, possesses sufficient human and financial resources to
achieve the objectives, has demonstrated the achievement of objectives and will be able
to do so in future (Lenn, 2003). Other methods like ranking of the institutions on the
basis of performance indicators and implementation of ISO 9000 and other excellence
models are also in vogue for quality assurance and quality improvement purposes.
Accreditation and audit are external quality assurance measures while assessment
and ISO 9000 are institution based. Both internal quality assurance system which

52
represents bottom-up approach and external quality assurance systems i.e. top-to-bottom
approach are complementary and essential for quality assurance (Bathool & Qureshi,
2007). Assessment focuses on input and outcome but quality is best ensured when
educational inputs and processes are controlled as in ISO 9000. Therefore, ISO 9000 is a
frequently adopted method for quality assurance.
2.6 Models and frameworks of TQM implementation
In pursuit of quality, the philosophies of quality gurus like Deming, Juran,
Crosby, and others have been translated into standardized “Quality Models” or “Best
Practices” which provides much guidance and wisdom to the managers around the world
(Evans & Lindsay, 2005). There is abundance of TQM Models but paucity of clear
guideline as what to do and what is required in order to successfully implement TQM.
The universities yearning for TQM implementation are confused as where to begin, what
level to start at, how long it will take and who will be involved in the process. Different
universities around the globe have implemented TQM in different ways (Motwani &
Kumar, 1997). Majority of the TQM implementation models and frameworks found in
the literature have been developed for manufacturing or business organizations while
there are a few frameworks that have been specifically developed for education.
However, insight of both kinds of the models may be helpful for implementation TQM in
HEIs. These models and frameworks are of two types i.e. standardized international
models developed by organizations such as MBNQA, EFQM, AUQA, Deming Prize and
ISO 9000 Standards etc. while in literature there are some frameworks and models
proposed by individual authors. In the following lines details of some of the models and
frameworks are given.
2.6.1 Standardized Models
Following are some of important international models which are being
implemented in all type and size of organizations.
2.6.1.1 The Malcolm Baldrige National Quality Award (MBNQA: 2011-2012)
The Malcolm Baldrige National Quality Award was established by National Institute
of Standards and Technology (NIST) under the US Department of Commerce in 1987, when

53
Congress passed the Malcolm Baldrige National Quality Improvement Act during the President
Regan’s government to pull up and boost the nose-diving American productivity. The award was
named after President Reagan’s Secretary of Commerce and proponent of the award,
Malcolm Baldrige who died in and accident shortly before the Senate acted on the
legislation.
Established with a purpose to reward and stimulate quality initiatives, the award is given
annually to organizations that demonstrate high quality standards according to the requirements
of the award. Initially the award was give to the US companies for their outstanding
performance in three categories i.e. manufacturing, service and small business. Education and
Health Care were incorporated in the award programme in 1999. In USA many
accreditation bodies allow Baldrige assessment as alternative means of preparing for
accreditation. University of Wisconsin-Stout was the first university to get the Baldrige
Award for excellence in education in 2001. In 2008 Iredell-Statesville Schools got this
award (NIST, 2010).
The Malcolm Baldrige National Quality Award is considered to be one of the
most powerful catalysts of total quality. The Award Criteria for Performance Excellence
(table 2.4) provides a framework for integrating total quality principles and practices in
any organization.
The Education Criteria are based on a set of inter-related core values and concepts
including (1) visionary leadership (2) student-centered excellence (3) organizational and
personal learning (4) valuing workforce members and partners (5) agility (6) focus on the
future (7) managing for innovation (8) management by fact (9) societal responsibility
(10) focus on results and creating value and (11) systems perspective.
The criteria consist of a hierarchical set of seven categories which form an
integrated management system as shown in the Figure 2.5. Each category consists of
several items (numbered 1.1, 1.2, 2.1, etc.) that focus on minor requirements on which
business should focus. Each item, in turn, consists of a small number of areas to address
(e.g. 6.1.1, 6.1.2) that seek specific information on approach used to ensure and improve
competitive performance. The items and areas to address are evolving and updated every
two years to ensure relevance. The seven categories are as follows:

54
a. Leadership
This category addresses the top management commitment and how an
organization’s senior leaders set and communicate the organization’s vision, values, and
performance expectations as well as focus on customers and other stakeholders,
empowerment, innovation and learning. The communication is two-way and all around
the organization. It also examines an organization’s governance and how the organization
addresses its legal, ethical, and societal and community responsibilities especially how
the senior leaders and faculty and staff encourage and practice good citizenship. The
senior leaders should be role models and practice literally what they preach.
b. Strategic Planning
This category covers the overall planning and emphasizes that strategic issues like
learning-centered education, long-term organizational sustainability and competitive
environment should be the focus of the strategic planning. The category addresses how
the organization develops strategic planning, what are the key process steps in strategic
planning, what are the key strategic objectives and the short-term and long-term action
plans for timely attainment of these objectives? The category also examines how the
strategic planning done is implemented as planned and how key performance indicators
are established to measure the effectiveness of action plans and progress.
c. Customer and Market Focus
This category focuses on how an organization captures the voice of the customers
i.e. the students and other stakeholders by listening and determining their requirements,
expectations and preferences and adopt market driven approaches to meet and exceed
their needs and expectations and ensure their loyalty. The category stress building
relationship with the students and other stakeholders and examines how educational
programmes and services support students and the stakeholders and the data regarding the
customers’ needs, expectation and dissatisfaction are handled.
d. Measurement, Analysis and Knowledge Management
This category stresses measurement and analysis to assess the organization’s
progress towards achievement of strategic objectives, action plans and overall

55
organization’s key performance results to improve its performance. The category
addresses how an organization selects, gathers analyzes, manages, and improves its data,
information, and knowledge assets. It also examines how the organization ensures the
quality and availability of needed data, information, software, and hardware for the
workforce, students and stakeholders, suppliers, partners, and collaborators.
e. Workforce Focus (faculty and staff)
This category stresses learning, development and motivation of employees and
utilization of their full potential in line with organization’s mission, strategy, objectives
and action plans. The category examines the organization’s ability to evaluate workforce
capability and capacity needs including skills, competencies, and staffing levels and build
a climate conducive to high performance and workforce and organizational growth
through continuous improvement of programmes, employee training and teamwork.
Involvement of the workforce is critical element of quality.
f. Operation Focus
In order to achieve the organizational success and sustainability and create value
for students and other key stakeholders, the category stresses for process management
and integration of the processes into a work system. For the purpose the category
examines how the organization designs, manages, and improves learning-centered
processes for educational programs and students’ services. The category also addresses
the organization’s support processes and operational planning with respect to financial
management and readiness for emergencies.
g. Business Results
The category requires real-time information on organization’s actual performance
in all the key area. The category examines the organization’s performance and
improvement in student learning and process outcomes, customer-focused outcomes,
workforce-focused outcomes, leadership and governance outcomes, and budgetary,
financial, and market outcomes and social responsibility. The category also examines the

56
organization’s performance relative to those of competitors and other organizations with
similar programs and services.
The benefits of using the criteria for self-assessment include accelerating
improvement efforts, energizing employees, and learning from feedback particularly if
external examiners are involved.
Figure 2.5. Baldrige education performance excellence framework 2011-2012 (www.nist.gov, 2011)

57
Table 2.4 Baldrige Criteria (2011-2012) for Performance Excellence - Items Listing and Points Scoring
Points
Categories and Items Total
1. Leadership 120
1.1 Senior Leadership 70
1.1.1 Vision, Values and Mission
1.1.2 Communication and Organizational Performance
1.2 Governance and Societal Responsibilities 50
1.2.1 Organizational Governance
1.2.2 Legal and Ethical Behaviour
1.2.3 Societal Responsibilities and Support of Key Communities
2. Strategic Planning 85
2.1 Strategy Development 40
2.1.1 Strategy Development Process
2.1.2 Strategic Objectives
2.2 Strategy Implementation 45
2.2.1 Action Plan Development and Deployment
2.2.2 Performance Projection
3. Customer Focus (Students, Stakeholders and Market Focus) 85
3.1 Voice of the Customer 45
3.1.1 Student and Stakeholder Listening
3.1.2 Determination of Student and Stakeholder Satisfaction and
Engagement
3.2 Customer Engagement 40
3.2.1 Educational Programs and Services, and Student and Stakeholder
Support
3.2.2 Building Student and Stakeholder Relationships
4. Measurement, Analysis, and Knowledge Management 90
4.1 Measurement, Analysis, and Improvement of Organizational
Performance
45
4.1.1 Performance Measurement
4.1.2 Performance Analysis and Review
4.1.3 Performance Improvement
4.2 Management of Information, Knowledge, and Information Technology
45

58
Points
Categories and Items Total
4.2.1 Data, Information, and Knowledge Management
4.2.2 Management of Information Resources and Technology
5. Workforce Focus (Faculty and Staff Focus) 85
5.1 Workforce Environment 45
5.1.1 Workforce Capability and Capacity
5.1.2 Workforce Climate
5.2 Workforce Engagement 40
5.2.1 Workforce Performance
5.2.2 Assessment of Workforce Engagement
5.2.2 Workforce and Leader Development
6. Operations Focus 85
6.1 Work Systems 45
6.1.1 Work Systems Design
6.1.2 Work System Management
6.1.3 Emergency Readiness
6.2 Work Processes 40
6.2.1 Work Process Design
6.2.2 Work Process Management
7. Results 450
7.1 Student Learning and Process Outcomes 120
7.1.1 Students Focused and Process Results
7.1.2 Operational Process Effectiveness Results
7.1.3 Strategy Implementation Results
7.2 Customer-Focused Outcomes
7.2.1 Student- and Stakeholder-Focused Results
90
7.3 Workforce-Focused Outcomes
7.3.1 Workforce Results 80
7.4 Leadership and Governance Outcomes 80
7.4.1 Leadership, Governance and Societal Responsibility Results
7.5 Budgetary, Financial, and Market Outcomes
7.5.1 Budgetary, Financial, and Market Results
80
TOTAL POINTS 1,000
Source: (www.nist.gov, 2011)

59
2.6.1.2 Prime Minister Quality Award and Business Excellence Model of Pakistan
National Productivity Organization (NPO) has recently launched Prime Minister
Quality Award (PMQA). The intent is to encourage manufacturing and service
organizations to fine tune their management systems and improve their capabilities to
enhance productivity and competitiveness and achieve business excellence. Currently
NPO is holding awareness sessions regarding PMQA at different venues throughout the
country. First PMQA award ceremony is expected to be held in December 2011.
The Prime Minister of Islamic Republic of Pakistan is the patron in chief of the
award. It is awarded on the basis of best of the best. The award provides a platform for
creating awareness regarding the impact of quality and productivity on competitiveness,
sharing information regarding adopted strategies and their outcomes and acknowledging
the good practices of high achievers in the country.
The PMQA and business excellence model is an adapted version of MBNQA
criteria for business excellence (2009-2010) as shown in section 2.6.1.1 figure 2.5. Both
the awards have the same criteria and consist of same number of categories. The PMQA
criteria are focused on continual improvement encompassing total system performance
management. The model is a generic and non-prescriptive framework. It is an excellent
self-assessment tool for improving performance. Implementation of the framework
results in improved communication, productivity, effectiveness and achieving strategic
goals.
PMQA is annually presented to the best organization. Under the award, there are
four levels of recognition. First level of recognition is Commitment of Business
Excellence through Quality Management and consists of organizations scoring 301-400
out of total 1000. Second level is Achievement in Business Excellence through Quality
Management and includes organizations scoring 401-500. Third level is Pakistan
Business Excellence Prize Winner and consists of organizations scoring 501-600. Fourth
and top level consists of the organizations scoring 601-1000 and among this group the
best organization is awarded PMQA.
Like MBNQA, the PMQA framework consists of seven criteria i.e. Leadership,
Strategic Planning, Customer Focus, Measurement, Analysis and Knowledge
management; Workforce, Process Management, and Results, however, it has been

60
adapted according to local needs and environment. In the PMQA criteria there is more
focus on categories like Strategic Planning, Customer Focus, Workforce Focus, Process
management and higher scores have been assigned to these categories than MBNQA
criteria as shown in the table 2.5. These categories are enablers i.e. what the organization
does. Results have been assigned less score in PMQA criteria. This is with a view that
Results will automatically improve if what the organization is supposed to do is improved
and strengthened.

61
Table 2.5 Points Scoring Comparison of MBNQA (2009-2010) and PMQA Criteria
Category Criteria MBNQA PMQA
1 Leadership 120 120
1.1 Senior Leadership 70
70
1.2 Governance and Societal Responsibilities 50 50
2 Strategic Planning 85 90*
2.1 Strategy Development 40
45
2.2 Strategy Deployment 45 45
3 Customer Focus 85 110*
3.1 Customer Engagement 40
50
3.2 Voice of the Customer 45 60
4 Measurement, Analysis, and Knowledge Management 90 90
4.1 Measurement, Analysis, and Improvement of
Organizational Performance 45
50
4.2 Management of Information, Knowledge, and
Information Technology 45 40
5 Workforce Focus 85 110*
5.1 Workforce Engagement 45
50
5.2 Workforce Environment 40 60
6 Process Management 85 100*
6.1 Work Systems 35
50
6.2 Work Processes 50 50
7 Results 450 380*
7.1 Product Outcomes 100
65
7.2 Customer-Focused Outcomes 70 65
7.3 Financial and Market Outcomes 70 70
7.4 Workforce-Focused Outcomes 70 60
7.5 Process Effectiveness Outcomes 70 60
7.6 Leadership Outcomes 70 60
Total Points 1000 1000
Note. *Score different from that assigned in MBNQA criteria (2009-2010) (Source: www.npo.gov.pk)

62
2.6.1.3 European Foundation for Quality Management (EFQM) Business Excellence
Model
EFQM Excellence Model is a non-prescriptive framework based on the concept
that excellent results with respect to performance, customers, people and society are
achieved through committed leadership driving policy and strategy, people, partnerships
resources and processes (Osseo-Asare et al., 2005). It consists of nine criteria represented
by nine boxes in the framework as shown in figure 2.6. The framework can be broadly
divided into Enablers and Results and each carrying 50% weightage of the total scoring
scheme. The criteria under Enablers are further divided into 24 sub-criteria. Similarly the
criteria under Results are divided into further 8 sub-criteria. The Enablers encompass
what the university does and the Results encompass what the university achieves
(Sheffield Hallam University, 2003).
The Model was designed and developed by European Foundation for Quality
Management (EFQM), a non-profit organization established in 1988 by 14 leading
European companies. For the first time EFQM launched the Model in 1991 which was
revised and improved in 1999 and 2003 as EFQM Business Excellence Model. It is an
excellent tool to implement TQM and achieve quality and customer satisfaction (Calvo-
Mora et al., 2006, 2005; Evans & Lindsay, 2005).
Figure 2.6. EFQM business excellence model (EFQM; Evans & Lindsay, 2005)

63
EFQM Excellence Model is based on the following principles.
a. Customer Focus
b. Results Orientation
c. Leadership and Constancy of Purpose
d. Processes and Facts based Management
e. Development and Involvement of People
f. Continuous Learning, Innovation and Improvement
g. Partnership Development
h. Corporate Social Responsibility
The details of the nine criteria along with assigned scoring percentage according
to the Sheffield Hallam University (2003) adapted version of EFQM for higher education
are given as:
a. Leadership (10 %)
According to the criterion the university’s top management and leadership should
develop the university’s vision, mission and values for its long term success and be a role
model in words and deeds for the attainment of these. The top management is also
required to be personally involved in developing the university’s management system and
provide resources for its implementation and continuous improvement. Top management
inspires and motivates not only internal people through support and recognition but is
also involved with customers, partners and representatives of the society.
b. Policy and Strategy (8%)
This criterion requires the university’s top management to devise such a policy
and strategy for the attainment of its mission and vision that is focused on the education
sector and stakeholders’ present and future needs and based on factual information
gathered through the measurement of the performance, researches and creative activities.
Policy and strategy based on clear cut plans and targets are developed, communicated
through out the organization and implemented through generating a set of processes.
Policy and strategy are constantly reviewed and updated.

64
c. People (9 %)
According to the requirements of the criterion the university should manage and
develop its employees by identifying and continuously developing their potentials and
creating such an environment, through empowerment and engaging the employees in
dialogue, where they feel rewarded, recognized and taken care of. In this way the full
potentials of the employees should be utilized for the benefit of the organization.
d. Partnerships and resources (9 %)
The criterion requires the university to manage both external partnerships and
internal resources including finances, buildings, equipments, material, information,
knowledge and available technology to support policy and strategy and smooth running
of the processes. Present and future needs of the university, the community and the
environment should be addressed properly when planning and managing resources and
partnerships.
e. Processes (14 %)
As per the criterion the university should design and mange the processes to
satisfy the students, the staff and other stakeholders’ present and future needs. The
processes should be innovated and improved continuously. The university should design
and develop courses, professional service and internal services according to customers’
needs and expectations to manage customer relationship and their satisfaction.
f. Customer results (20 %)
This criterion examines how the university measures the students and other
customers’ perception regarding the university and monitors other performance
indicators like improvement in courses and other services offered to the customers to
achieve planned performance and excellent results.
g. People Results (9%)
According to this criterion the university should measure people’s perceptions
and other performance indicators to achieve excellence. In this regard the university

65
should measure staff and personnel’s perceptions regarding university to improve the
services being offered to the staff. Similarly the university should monitor, understand
and predict the staff’s performance to improve the performance of the university and
foresee the staff’s future needs to satisfy them.
h. Society results (6%)
According to the criterion the university should measure society’s perceptions
regarding the university and also measure the university’s performance indicators to
achieve outstanding results with regard to the society. The university should measure the
local community’s perceptions and its own performance regarding the services it
provides to the people so that the prevailing situation can be improved and future trends
predicted.
i. Key performance results (15%)
As per the criterion the university should measure performance outcomes to
achieve excellent results regarding the key elements of its policy and strategy. The
university should also monitor and understand its performance indicators to perform as
planned and further improve key performance outcomes.
2.6.1.4 International Organization for Standardization (ISO 9000)
The ISO 9000 standards are a set of written guidelines and international standards
of quality management system that have been developed and published by the
International Standards Organisation (ISO). Implementation of ISO 9000 helps
organisations to meet their customers' needs consistently. ISO 9000 is generic in nature
and applicable to any organization irrespective of its type and size. It provides just a
framework to ensure that nothing important is missed out and that every one is clear
about who is responsible for doing what, when, how, why and where ( ISO).
ISO 9000 quality management system is based on the following eight principles
(ISO; Hoyle, 2003):
1. Customer Focus
2. Leadership

66
3. Involvement Of People
4. Process Approach
5. System Approach To Management
6. Continual Improvement
7. Factual Approach To Decision Making
8. Mutually Beneficial Supplier Relationships
An ISO 9001 standard consists of the following eight sections (ISO; Hoyle,
2003). The first three provide general information about the standard while the last five
deals with how to implement it.
1. Scope
2. Normative Reference
3. Terms And Definitions
4. Quality Management System
5. Management Responsibility
6. Resource Management
7. Product Realization
8. Measurement, Analysis And Improvement
The implementation of ISO 9001 quality management is based on four pillars:
Say What You Do ….. (Document What You Do),
Do What You Say ….. (Do What You Document),
Prove It ……………... (Monitor and Measure)
Improve It …………... (Take Corrective and Preventive Actions).
While implementing ISO 9001 the organization is required to document its key
processes and then follow as documented. During the execution these processes are
monitored. At the completion after analyzing the data the processes may be changed for
improvement to prevent future variations. The purpose of continuous improve is achieved
through the Deming’s cycle of PDCA i.e. Plan (P), Do (D), Check (C) and Act (A) cycle.
For registration and certification the organization is required to document all the
key procedures in its quality manual as per requirements of ISO 9001 quality
management standards. Once the management system is implemented and established, a
certified body carries out an independent assessment and audit of the management system

67
to check that the requirements of ISO 9001 are met and the documented procedures are
working in practice. On successful audit, the origination is certified for ISO 9001 quality
management system which is valid for three year and at the expiry of the duration the
organization is required to apply for recertification.
All the above mentioned models are of international repute only telling what
TQM is and what its requirements are and do not tell us how to implement TQM. They
are generic in nature. Only ISO 9000 Standards give comprehensive implementation
guidelines in the form of requirements. ISO 9000 has been adopted for the proposed
TQM model of the study
2.6.2 Individuals’ Framework for TQM Implementation
Following are important frameworks for TQM implementation presented by
renowned authors.
2.6.2.1. Moosa’s Seven-stage TQM Implementation Mode
Moosa (2009) has encapsulated his insight of TQM and related concepts plus his
vast experience as a consultant into a ‘Seven Stages of TQM Implementation’ model. The
model is generic in nature and consists of the following seven stages (1) Envisioning (2)
Strategizing (3) Developing (4) Implementing (5) Improving (6) Sustaining (7)
Abandoning.
a. Envisioning
This is the first stage in Moosa’s proposed models for TQM implementation. This
stage is mainly focused on initial training and creating awareness. The top management
undergoes certain training and attends conference and workshops on TQM to create
interest and awareness which result in high quality oriented vision. This vision is further
supported by in-depth training sessions for top management. Visits to TQM organizations
are helpful to strengthen management’s belief, interest and confidence in TQM

68
b. Strategizing
This is a decision-making stage and the organization shows resolution for TQM
implementation and starts planning of initiating the projecting of implementing TQM by
identifying and allocating resources for the project and spells out organization policy on
quality and TQM. Necessary modifications in structure are identified to suit TQM
implementation and accordingly reshuffling in responsibilities and authorities. Also
which type of TQM implementation suits best the organization structure is decided after
careful consideration.
c. Developing
It is a developmental stage of creating blue-print of the project, assigning roles
and sketch out the procedures and processes of implementation. Benchmarking is helpful
at this stage and the services of a consultant may be acquired to finalise the nitty-gritty of
the project.
d. Implementing
This is the action stage when the project is practically implemented on trial basis.
At this stage success or failure may not be real. With a little bit tuning failure may be
converted into success and with complacency success may be changed into failure.
However, the problems that may arise at this stage include incomplete roles, inadequate
resources, employees’ resistance and lack of consistent and collective approach to TQM
by the top management.
e. Improving
This is a review stage. After initial success or failure, the TQM policies,
processes and procedures are reviewed. If they are not achieving the desired results, they
are revised and improved. In case first implementation result is satisfactory and the
processes and procedures are achieving the desired results, then they need to be continued
and repeated for several time. At this the scope to TQM implementation may be widened
to strengthen the programme. However, one should be aware of the demoralizing effect
of the failure of initial TQM implementation efforts.

69
f. Sustaining
This is the stage to resolve to continue with TQM programme on regular basis
with same strength, interest, commitment and focus after overcoming the problems that
surfaced during the initial stages. Continued support to TQM programme is very
important as at this stage organization’s culture change take place as a result of change in
organization’s procedures and processes due to kaizen and continuous improvement.
Sustainability is a must at this stage to prevent employees’ reverting to old methods.
g. Abandoning
In majority cases, this stage is the side-effect of the failure in trial phase.
However, this not the only reason for reaching this last stage, abandoning may take place
anywhere and anytime time due to many reasons which may be technical or social
problems and in majority cases the reasons are social factors.
2.6.2.2 Venkatraman’s Framework for TQM Implementation in Higher Education
Programme.
Venkatraman (2007) has proposed a TQM implementation framework which is
based on Deming’s Cycle of PDCA and consists of six core quality elements. He has
argued that previous TQM implementation attempts failed because teachers’ performance
was focused in them. He has maintained that TQM can be successful in HEIs if the core
processes of teaching and learning are focused. In his framework he has targeted the
teaching learning processes and has contended that the seven-step course evaluation
process flow would enable teachers to achieve continuous improvement in their course
delivery and the students learning processes.
The six key quality factors of Vankatraman’s TQM implementation are:
a. Leadership
This element examines leadership and quality culture in HEIs. The senior
management is expected to create customer focused approach, clear goals, high
expectations and leadership system that promotes performance excellence. How top
management develops policies that impact staff, students and public responsibilities,

70
industry linkages, relationship with parents and the community. The element also sees to
it how the senior management involves the internal and external stakeholders in decision
making by developing a comprehensive feedback mechanism and setting strategic
directions and goals that lead to the students’ satisfaction in particular and other
stakeholder in general.
b. Educational Management
This factor sees how educational processes and business operation are innovatively
designed, effectively managed and continuously improved. It expects learner-focused
education design, education delivery, services and business operations that enhance and
improve students learning and performance.
c. Human Resource Management
The element examines employees’ participation and their development to achieve
organizational objectives. It focuses on manpower development i.e. staff recruitment,
training and career development, staff performance and recognition and quality work
environment to achieve organizational goals and performance excellence.
d. Information Management
The element examines effective management i.e. collecting, analyzing and using of
the data and information for quick and effective response to the changing situation. It
ensures reliable and easily accessible information and data for operational tasks.
e. Customer Focus and Satisfaction
This element examines how customers and other stakeholders’ needs and
expectations are determined and performance measuring targets are set and achieved to
ensure customer satisfaction.
f. Partnership development and management
This element examines how effective partnership is developed and managed with
both internal and external stakeholders through effective leadership, good education

71
management, efficient human resource management and innovative information
management
All the six elements are directly involved with Quality Circles (QCs) which may be
called in some HEIs as Quality Assurance Department, Educational Quality Department
or TQM Department. The QCs are group of people responsible for enhancing educational
quality.
In order to continuously improve teaching learning processes, Venkatraman has
suggested the following seven steps for academic programme evaluation:
Step 1: Select the course to be evaluated
Step 2: Prepare the terms of reference for course evaluation
Step 3: Conduct the course evaluation
Step 4: Prepare an evaluation report of the findings
Step 5: Prepare an action plan with improvement measures
Step 6: Implement the action plan for continuous improvements
Step 7: Monitor the action plan for continuous improvements
2.6.2.3 Sakthivel & Raju’ TQM 9-C Education Excellence (EDEX) Model
Sakthivel & Raju (2006b) have developed TQM 9-C EDEX Model based on 9
constructs (C1, C2, C3, C4, C5, C6, C7, C8 and C9) and four process elopements. The
model presumes that higher the commitment of top management and leadership, the
higher will be the implementation of the educational service quality which will lead to
greater customer value and greater customer satisfaction.
Details of the four process elements with underpinning constructs are given
below:
a. The Impetus
Commitment of Top Management and Leadership (C1) provides the impetus for
the effective implementation of TQM in HEIs.

72
b. The Implementation System
The six constructs i.e. Customer Focus (C2) approach, effective Course Delivery
(C3) and Communication (C4), Campus Facilities (C5), Continuous Assessment and
Improvement (C6) and Congenial Learning Environment (C7) determines the service
quality being offered at engineering education institutions and leads to successful
implementation of TQM
c. The Measure of Progress
Customer Value (C8) measures the progress of the implementation system.
d. The Result
Customer Satisfaction (C9) is the output of the implementation system in HEIs.
2.6.2.4. Besterfield’s Framework for TQM Implementation
Besterfield et al. (2008) have proposed a TQM implementation process starting
with thorough awareness and education of the top management to ensure their strong
commitment for implementation of TQM.
The next step is establishing Quality Council (QC) for developing core values, a
vision statement, a mission statement and a quality policy statement with inputs from all
the stakeholders including middle managers, supervisors and even union leaders to ensure
their involvement and feelings of ownership. In light of the customers and stakeholders’
feedback, QC identifies quality improvement projects, establishes project teams and
monitors their progress.
Communication is very important throughout the TQM implementation process to
create awareness, interest, desire and action. At this stage the top management
communicates TQM to the length and breadth of the organization.
Then team and work groups are formed for the quality projects identified by the
QC and they are trained for their tasks and in problem solving tools.
The authors are of the view that TQM implementation is a time consuming
processes and depends upon the size and type of the organizations. Emphasizing the
project team approach, they have also given a 14-Step Quality Management System (ISO
9000) implementation process as given in the following lines:

73
1. Top Management Commitment
The top management shows commitment to the implementation of quality
management system (QMS) by willingness to allocate time and resources for the
implementation of QMS.
2. Appointing Management Representative (MR)
Top management appoints a MR from top management group who is entrusted
with responsibility for implementing, documenting and maintaining QMS and
serves as a focal person for all involved in the implementation process of QMS.
3. Awareness
Top management creates awareness through training sessions regarding QMS
implementation, how it will affect the operations and its potential benefits to
motivate employees to welcome QMS implementation.
4. Formation of Implementation Team
A representative team consisted of members from all levels and areas are
established to identify QMS processes, their sequence and interaction.
5. Training
Training is imparted to the implementation and audit team leaders and supervisors
who in turn train their team mates.
6. Time Schedule
Timeline is set for the implementation and registration of the QMS which depends
upon the type, size and maturity of quality culture in that origination. The
implementation process is divided in manageable sub units which are celebrated
when each unit is completed.
7. Select Element Owners
The implementation team assigns ownership of each system element to a member
who selects team to assist him in the process of implementation.
8. Review the Present System
Existing QMS of the organization is reviewed for gap-analysis. Quality manual,
procedures, work instructions and forms in use are checked to see what is
available and what is required to implement ISO 9000 QMS. The review is
preformed by element owners or external consultant.

74
9. Write the Documents
Quality policy, procedure manuals and work instructions are written in this step.
Over documentation is avoided by documenting only those processes which affect
the quality of the product.
10. Install the New System
The new system is implemented stepwise by integrating the policies and
procedures and work instructions into the daily operations of the organization and
what is being done is recorded.
11. Internal Audit
Internal audit of the quality system is conducted to check the system is working
effectively. Minor changes are made that surface during the audit.
12. Management Review
Management review is performed to check whether the implemented QMS is
achieving the stated quality goals and if required the system is revised.
13. Pre-assessment
Pre-assessment of the QMS is done before going for formal registration.
However, this step is optional and may be skipped if the previous steps are
satisfactory.
14. Registration
This step involves selecting a registrar, submitting an application and conducting
of the audit of the system by the registrar.
2.6.2.5 Motwani and Kumar’s Five-step TQM Implementation Model
Motwani and Kumar (1997) have suggested HEIs specific Five-step
implementation model which comprised the following five phases.
Phase – I: The first is a decision making phase. The top management takes a
decision to implement TQM and determines its scope i.e. whether to be in administration,
a single discipline or many discipline. The top management demonstrates commitment to
TQM by gaining knowledge and insight into different concepts related to TQM
Phase – 2: It is a preparation phase. First of all, the top management conducts
internal assessment to understand the current position of the institution and compare it

75
with TQM requirements. After that, key personnel is educated and trained regarding
TQM implementation, document vision and quality objectives and design a new system.
The top management spearheads TQM efforts and creates a vision and system of values
which is conducive for TQM germination.
Phase – 3: In the third phase the top management starts implementing the system.
For the purpose the processes are identified and redesigned in light of the customers’
feedback and benchmarking and employees are trained for their jobs. At the same time
responsibilities are entrusted by setting up quality council to oversee the TQM processes
and forming quality improvement teams. Also, procedures and indicators for valid
measuring of achievement of the objectives are developed at this stage.
Phase – 4: In this phase the TQM system is expanded and integrated with
institution’s existing system i.e. making TQM system a permanent feature of the
institution. At this stage there is continuous education and training, new teams,
committees and department are formed as the need arise from time to time and quality
improvement efforts are recognized and rewarded.
Phase – 5: In the last phase of the framework evaluation takes place to assess whether
the programme is successful and achieving its goals. In case of any deficiency, the
programme is redesigned.
2.6.2.6 Van den Berghe’s Framework for ISO 9000 Implementation
Van den Berghe (1997), while interpreting and investigating the suitability of ISO
9000 Standards to Vocational Education and Training in European perspective, has
suggested the following stages from the decision of the implementation of the quality
management system to certification:
a. Initial investigations of relevancy and cost-benefit analysis certification
b. Top management’s decision and selection of an appropriate consultant if
required
c. Investigating and establishing type of customers, outputs, processes,
documents available
d. Training for awareness on standards and skills development for writing
procedures and project planning

76
e. Developing documents regarding procedures, quality manuals, instructions,
forms, etc.
f. Training on document control and internal audits.
g. Revising quality documentation
h. Operating the quality system (including document control, internal audits,
corrective measures, management reviews, etc.)
i. External audit and, if successful, certification
j. Maintenance of the quality system with 3-5 external audits over a period of
3 years
2.6.2.7 McKinsey’s Four Levels of TQM
In order to identify critical success factor of quality management, McKinsey
(1994) studied the implementation of quality management in different companies from
Europe and Japan and divided the level of TQM implementation in theses organizations
into four levels. These levels represent management approaches adopted by the
corresponding companies ranging from low to high with level IV representing the highest
and world class organizations.
Level I (Inspection): Companies falling in this category are at the quality control
stage and depend on the final inspection and testing of the finished product for the quality
management. Inspection department is entrusted with quality control of the product at the
end of the process. Such companies follow reactive approach and spring to action when
the non-conformity has been occurred.
Level II (Assurance): These companies pursue conformance to specification and
process approach considering processes control vital of product quality as product is the
result of the processes. They use statistical process control tool to ensure the quality of
the product.
Level III (Prevention): Such companies believe in nipping the evil in the bud
and pursue zero defect approach while designing a product. They use preventive tools
like design review and Failure Mode and Effect Analysis (FMEA) techniques when
design a product. Cross-functional teams and problem solving tools are used for the
purpose.
77
Level IV (Perfection): This category companies continuously improve the
quality management on way to perfection (total customer satisfaction). They are
characterized by cross-functional teams, less hierarchical and greater delegation of
authority for decision making. A chain of customer-supplier is stretched throughout the
company. They focus on customers’ wishes and expectations both expressed and implied
ones and incorporate them into the very design of the product by using Quality Function
Deployment (QFD) tool. They have mutual beneficial partnership with the supplier and
blend the wishes of both the end user and original equipment manufacturer (OEM) into
processes, services and products.
The study indemnified 15 factors for successful implementation of TQM and high
quality performance which are:
Visions/goals
1. Top management involvement
2. Quality goals in the business system
3. QA as consultant
4. Flat hierarchies
5. Prevention focus
Core process production and design
6. Operator self-inspection
7. Partnership with sub-suppliers
8. Use of preventive QA tools
9. R&D influence on OEM
10. Link to customer
Energizing
11. Decision competence on shop floor
12. Problem-solving empowerment
13. Quality goals deployment to shop floor
14. Job enrichment (teams, job rotation)
15. Worker job satisfaction
Majority of the models and frameworks discussed above emphasize on ‘what to
do’ or ‘what should be done’ with a little or no information on ‘how to do’ when

78
implementing TQM. These deficiencies have been made up in the proposed framework
by providing sufficient information for phase-wise implementation of TQM. The
implementation of ISO 9000 management system provides sufficient structure for
building a house of total quality management. Moreover, the HEI, by adopting this
framework, can measure its performance step by step en route TQM. Similarly when the
system is well established, the propose organization structure can be easily integrated
with the institution structure. The proposed framework has also contextual implications
and most suited to HEIs where quality culture is immature and just realized the need for
embarking on journey to excellence.
2.7 Critical Success Factors for TQM Implementation
Critical Success Factors (CSFs) are the limited numbers of areas of immense
importance ‘where things must go right’ for successful implementation of TQM and to
ensure successful competitive performance for an individual department or an
organization and achieve its mission (Kanji & Tambi, 1999; Oakland, 2000; Digman,
1990 & Rockart, 1979 (cited in Fryer, Antony & Douglas, 2007). However, there is no
generic set of CSFs as they vary from organization to organization and manager to
manager as it depends on where the organization is and where it wants to be. Moreover,
CSFs are not objectives but actions and processes that the managers can control to
achieve the organization’s goals (Brotherton & Shaw, 1996 (cited in Fryer et al., 2007)).
Bayraktar, Tatoglu & Zaim, (2008) have developed an instrument for measuring
TQM in HEIs in Turkey. The instrument consists of eleven (11) critical areas of TQM
which are leadership, vision, measurement and evaluation, process control and
improvement, program design, quality system improvement, employee involvement,
recognition and reward, education and training, student focus and other stakeholders
focus. Fryer et al., (2007) have searched 29 papers on CSFs from various databases and
compiled a list of 30 CSFs of which the key CSFs are (1) management commitment (2)
customer management (3) supplier management (4) quality data, measurement and
reporting (5) teamwork (6) communication (7) process management (8) ongoing
evaluation, monitoring and assessment (9) training and learning (10) employee
empowerment (11) having aims and objectives that are communicated to the workforce

79
and used to prioritize individual’s actions – a corporate quality culture (12) product
design (13) organizational structure. They have argued that the management commitment
was universal while customer management, process management and employee
empowerment were key factors in 75% of the papers they reviewed. Evens and Lindsay
(2005) have given three very comprehensive principles of the TQM which are focus on
customer and stakeholders, participation and teamwork by everyone and processes focus
supported by continuous improvement and learning. Thiagaragan, Zairi and Dale (2001)
have divided the CSFs for successful implementation of TQM 'soft' factors/aspects of
management like leadership, employee empowerment and culture and ‘hard’
factors/aspects like systems improvement tools and techniques. Van den Berghe (1997)
have divided TQM constructs into two categories: underlying concepts like customer
focus, continuous improvement, quality assurance of internal processes, process
orientation and prevention rather then inspection and another group consists of
operational concepts which are management commitment, teamwork, quality is everyone
job, focus on fact and systematic problem solving. Owlia and Aspinwell (1997) have
studied HEIs in UK and USA regarding TQM implementation and found that TQM was
more prevalent in US HEIs than UK. They have compiled a list of the following success
factors (1) Training for quality (2) Employee involvement and team working (3)
Customer focus and satisfaction (4) Management commitment (5) Organization for
quality (6) Process management (7) Strategic Planning (8) Design management (9)
Information and analysis (10) Supplier quality management. Youssef and Zairi (1995a)
have divided the CSFs in three categorizes i.e. (1) Leadership elements: i.e.
mission/vision statement; quality policy; direction; goals; communication processes;
measurement; quality decisions; strategic planning and deployment; customer/market
focus. (2) Hard elements: tools and techniques; measurement; systems; procedures;
specifications; standards. (3) Soft elements: problem-solving approach; teamwork;
innovation/creativity; continuous improvement philosophy; empowerment; incentives;
process-based approach. Similarly Youssef and Zairi (1995b) identified 22 generic
critical factors by surveying different types of organizations throughout the world; of
which the top ten ranked are (1) Management commitment (2) Clear mission statement
(3) Customer satisfaction (4) Goal clarity (5) Goal setting (6) Cultural change (7)

80
Education (8) Top management steering committee (9) Strategic quality plan (10)
Participative management They concluded that not all of the 22 factors were relevant to
all the organizations. However, a few factors, e.g. top management commitment, clear
mission statement and a clear commitment towards customer satisfaction were critical
across all organizations. They emphasized strategic planning process with clearly
identified goals and targets and Continuous learning. They maintained that TQM is not
about tools, techniques and doing the bare minimum but a radical change of the culture is
required and that Quality management is a long-term process. Dahlgaard, Kristensen and
Kanji (1995) consider management's commitment and leadership, focus on the customer
and the employee; focus on facts; continuous improvements; everybody's participation as
the corner stone of TQM in education. Flynn, Schroder and Sakakibara (1994) developed
instrument with seven quality constructs i.e. top management commitment, quality
information, process management, product design, workforce management, supplier
involvement and customer involvement. Saraph, Benson and Schroeder (1989) have
identified eight critical factors for performance measuring instrument regarding TQM
implementation in an organization which are role of divisional top management and
quality policy, quality department’ role, training, product and service design, supplier
quality management, process management, quality data and reporting and employee
relations.
All international business excellence models and standards which are actually
based on the teachings of quality gurus, encompass afore mentioned CSFs with a slight
variation in degree of emphasis (Sirvanci, 2004). ISO 9001 quality management systems
covers these CSFs under its last five sections (Section IV to Section VIII) i.e.
Documentation Management, Management Responsibly, Resource Management, Product
Realization and Measurement, Analysis and Improvement.
a. Leadership and Management Commitment
All literature review on TQM implementation boils down to the fact that TQM
efforts cannot succeed without top management commitment and leadership. Top
management support to quality management initiatives, in words and deeds, is vital and a
driving force for its implementation (Besterfield, Besterfield-Michna & Besterfield-
81
Sacre, 2008; Motwani, 2001). Motwani (2001) has maintained that top management can
support TQM implementation by allocating budgets and resources, control through
visibility, monitoring progress and planning for change. Top management through
leadership, commitment and knowledge of TQM can unleash quality cultural change
which is strengthened through customer focus, factual decision-making, process focus,
continuous improvement and commitment of everybody (Sirvanci, 2004). Michael et al.
(1997) have argued that the leadership should not force TQM on the employees but sold
it to them by making it attractive and indispensable through good communication,
sufficient training, benchmarking and lessons learned from TQM philosophies and
implementation efforts. Top management should not only establish the organization’s
vision, mission, quality policy and quality objectives but also provide human and
financial resources on continuous basis to achieve quality milestones. The leader and top
management must be well versed in quality related concepts, implementation stages, time
and resources needed. He must have clear vision of the future and the difficulties that
may arise en ‘rout to TQM implementation. Almost all the authors (Owlia and Aspinwall,
1997; Tang and Zairi, 1998; Kanji et al. 1999 etc.) who wrote on TQM and international
quality awards and standards like EFQM, MBNQA and ISO 9000 have emphasized
leadership role of top management in creating goals, values and systems for continuous
improvement of the organization’s performance.
Top management of HEIs should be aware of the needs of TQM: understand the
importance of employee involvement; and concentrate on long-term stable performance
measures while actively showing their support to TQM practices through their actions
(Bayraktar, et al., 2008). The top management’s (vice-chancellor, registrar, dean and
head of the department etc.) performance check-list may include:
a. commitment to the development, implementation and continual
improvement of the quality management system by adopting customer
focused approach
b. developing vision, mission, quality policy and quality objectives
c. delegating responsibility and authority with proper checks and balances
d. conducting management review
e. setting channels for communicating quality management system plan

82
f. reviewing quality plan and follow-ups through out the organization
g. appointing management representative to oversee the quality management
system
h. providing the sufficient resources for quality management system to achieve
the desired quality objectives
i. ensuring the educational processes comply with legal and regulatory
requirements of the certification and accreditation
j. making arrangements for monitoring and measurement of the processes and
performance of the organization for achieving established policies,
objectives and improvement of quality management system
(ISO 9001, IWA, 2003, Hoyle, 2003)
Gregory (1996) has suggested four dimensions of institutional leadership for
change management in HEIs. First, a true leader is symbolic and role model who wins the
commitment of employees to organizational goals, procure resources and present
corporate image to the external world. Secondly a true leader is politic and tactful for the
institution in gaining support, using resources and resolving conflicts to achieve its
objectives. Thirdly, the leader had good managerial skills of controlling, representing,
staffing, structuring, setting goals and communicating besides handling budgets, costs,
information flow, employee relations, external funding and relations with validating and
awarding bodies and finally a leader of HEIs is a leading academic who can leads other in
an academic style.
b. Customer Focus and Satisfaction
There is common consensus in the literature that the most important feature and
the ultimate purpose of TQM is the organization's focus on its customers and their
satisfaction as they are the ultimate judge of the quality. Quality means satisfying or
exceeding customer expectations (Evans & Lindsay, 2005). A perfectly produced product
has little value if it is not what the customer wants. In other words quality is customer
driven. In order to stay in business and compete, the organizations need to continually
gather information by means of focus groups, market surveys, and customer interviews in
order to stay in tune with what customers want (Reid & Sanders, 2000). The importance

83
of the customer focus and satisfaction is also reflected in the weight assigned to it by
different quality award criteria (Sirvanci, 2004).
Customers are found not only outside the organization but also inside.
Accordingly they may be internal as well as external (Kanji & Tambi, 1999). In an
organization every employee has a direct customer called internal customer who is as
important to please as the external. Normally organizations focus on the end user or
consumer of the product which is no doubt important but equally essential is to satisfy the
internal customers as the product passes through the hands of these internal customers
before reaching the external customers and the consumers (Evans & Lindsay, 2005; Ho,
1995; Reid & Sanders, 2002). These internal customers form a chain of customer and
supplier which is extended to the external customer (Evans & Lindsay, 2005; Ho, 1995;
Oakland, 1993). So the products and processes need to be continuously improved to
satisfy both the internal and external customers.
TQM organizations are customer focused. For the purpose, the top management
should identify customer requirements and meet these requirements to enhance
customers’ satisfaction. The management should introduce processes for monitoring and
measuring customer satisfaction (Hoyle, 2003). With a whiff of controversy, students are
regarded as the main customers of the teaching learning process (Sirvanci, 2004; Kanji &
Tambi, 1999). So gathering and vetting of students’ complaints, careful consideration of
students’ course evaluation, support to students’ curricular and co-curricular activities
and alumni follow-up studies are the key concerns of the successful implementation of
students focused TQM programme. Besides students, there are other customers of the
HEIs like HEIs employees, faculty, parents, employees etc and their feedback is also vital
for the success of the institution (Bayraktar, et al., 2008; Sirvanci, 2004; Motwani, 2001).
The customer should be closely involved in the product design, development
process and their input should be at every stage (Flynn et al., 1994). Top management
should make arrangement for getting feedback from both external and internal customers
regarding the academic programme, courses and services provided by the educational
institution and utilize the feedback for improvement. Similarly there should be
procedures to provide support services like accommodation for students, assistance for

84
students with disabilities and counseling services and getting feedback on them (IWA 2,
2003).
In education the customers' needs and expectations should be defined and
documented as curriculum requirements in the form of well-defined learning outcomes
and specified performance indicators, instructional designs. The top management should
ensure that these requirements are aligned with the organization’s objectives. They
should be reviewed at the proposal stage and after certain period of time to ensure that all
the requirements are met. Students should be provided services such as healthcare
availability, counseling, personal safety, accommodation, food services, etc (IWA 2,
2007; IWA 2, 2003).
c. Education and training
Training involves acquiring specific skills or knowledge. The employees
undergoing the training are expected to perform those specific activities and jobs for
which they are trained. On the other hand education is more general term pertaining to
impart general knowledge that is applicable in different contexts and situations.
For effective operation of the quality management system, it is extremely
important that the personnel performing work affecting product quality should be
competent enough on the basis of appropriate education, training, skills and experience.
For the purpose the organization should first identify the qualifications and competence
needed for performing certain task that affect the quality of the product, impart the
required training, evaluate the training imparted and maintain record of the training. The
personnel should be aware of the relevance and importance of their activities and how
they contribute to the achievements of the quality objectives (Hoyle, 2003).
Training is a must while implementing TQM in HEIs (Bayraktar, et al., 2008).
All staff should be appropriately qualified for the tasks they are entrusted with. For the
purpose training needs of academic and nonacademic staff and those directly involved in
the implementation of TQM should be identified separately. Those involved in the
implementation of TQM should be trained in the use of tools and methods for the
implementation of TQM and educated in general concepts of quality and TQM to ensure
their commitment and perform their job to satisfaction.

85
Similarly the competence of teaching and supporting personnel should be
maintained and improved by imparting suitable training to ensure qualified instructional
personnel for meeting the students’ academic requirements and enhance customer
satisfaction. To determine the competences needed for teaching and support staff, the
organization should compare the curricula requirements with the existing personnel
competencies. Then determined the need for training to make up for the deficiency by
analyzing the data and evaluate the effect of the training after it has been imparted. The
organization should maintain record of all the staff competence acquired as internal or
external professional trainings, workshops, seminars and conferences attended. The
record should also show a periodic review of training needs and their outcome. Top
management should provide teaching and supporting staff with information on how their
competence, awareness, and training are aligned with their responsibilities, authorities,
and academic-administrative activities (IWA 2, 2003).
d. People Involvement and Teamwork
TQM sees quality as an organizational effort and places great emphasis on
teamwork because in any organization the person who best understands his or her job ad
how to improve both the product and the process is the one performing it (Evans &
Lindsay, 2005). Another thing that contributes to the effectiveness of teamwork is that
"two heads are better than one" (Reid & Sanders, 2000).
TQM is an organization-wide approach and cannot flourish without quality
culture where quality is everybody’s job. Through active participation, the employees’
resistance to TQM implementation may be overcome. They may be involved in the TQM
implementation efforts by eliciting and accepting their suggestions on how to improve the
system, facilitating collaboration among employees, encouraging employees participation
in TQM studies and formation of cross-functional teams (Bayraktar, et al., 2008).
There are different types of teams like quality circles, problem - solving teams,
management (cross-functional) teams, work teams, virtual(computer) teams which vary
on the basis of their function, structure and degree of formality. They solve quality
problems using techniques such as brainstorming, discussion, and quality control tools
(Reid & Sanders, 2000). Quality circle is the most common type to team. It is a team of

86
eight to ten members from volunteer production employees and their supervisors. They
meet weekly during work hours in a place designated for this purpose and work together
to solve quality problems. Decisions are taken on the basis of group consensus (Reid &
Sanders, 2000). Japanese frequently used quality circles to tackle the problems. The
teamwork may also take the form of a self managed team which combine teamwork and
empowerment and ensure employee involvement (Evans & Lindsay, 2005).
A TQM organization is flat in its organizational structure and there is horizontal
coordination and teamwork. This teamwork spirit is not only at work within the
organization but also outside the organization with suppliers, customers and unions
benefiting from each other strength (Evans & Lindsay, 2005). Teamwork improves
performance as it smashes the barriers to effective communication and collaboration
among people and departments and makes people take more responsibility for the success
of the overall operation.
e. Documentation Management
Consistency in efforts is crucial for the successful implementation of TQM. ISO
9001 based Quality Management System may guarantee consistency in quality related
efforts with clearly stated and documented processes. Such a system makes it easy to
trace out the error in the processes if any and provides a solid foundation to embark on
TQM implementation journey (Bayraktar, et al., 2008; Gozacan-Borahan & Ziarati,
2002). A documented quality management system makes employees understand exactly
what they are supposed to do in their work areas.
A quality management system is a coherent set of standards, procedures,
activities, feedback mechanisms and management actions which together ensure the
quality of the products and services delivered and encompasses all those activities and
processes in an organization which affect quality in one way or another.(Van den Berghe,
1997, OECD, 1997). The quality management system in an educational organization
should be viewed in term of curriculum; a system of learning processes, the
organizational structure, responsibilities, processes, and resources (IWA 2, 2003).
ISO 9001 QMS has general requirements and documentation requirements. The general
requirements of QMS are to establish, document, implement, maintain, and improve the

87
QMS by adopting a process approach (Hoyle, 2003). HEIs should identify processes
regarding academic programme design, development and delivery and also determine
how these processes interact and operate by providing criteria and methods of interaction
and information for operation of the processes. Human and physical resources required
for achieving results should be ensured. These processes should be monitored and
measured for achieving the desired results. The data gathered form the monitoring and
measurement of these processes is a must to be analyzed for corrective and preventive
actions and continual improvement of these processes (IWA 2, 2003).
The documentation requirements of ISO 9001 quality management system
include a documented quality policy, mission statement, quality objectives, a quality
manual, quality system procedures, work instructions, control of documents and control
of records (Hoyle, 2003).
The quality manual is the blue-print of the quality management system and
documents the scope of the quality management system including details and justification
for any exclusion, references to documented procedures for educational and support
processes and applicable documents and criteria upon which the quality management
system is based. Reference to different aspects such as terms and definitions required by
the organization, regulatory and organizational policies, applicable laws and regulations,
the competencies of the teaching staff, accreditation and certification programmes, study
plans and curricula competence programmes, awareness, education, training and
updating; and support services may be included in the quality manual of an educational
organization (IWA 2, 2003).
Quality manual is supported by a document called procedures manual. It contains
written procedures outlined in flowchart form. A written procedure describes the scope
and purpose of an activity i.e. what is to be done and by whom; when; where and how,
what materials, equipment and documents to be used and how the activity be controlled
and recorded. Similarly detailed documented work instructions are also given to the
employees to guide them perform specific work.
The scope of the quality management system includes all functions and activities
which can affect the quality of educational product and whether the QMS extended to the

88
single course/programme, part or the whole institution for which the registration is
sought.
Control of documents means that there should be a documented procedure for
continually updating QMS related documents and they are easily accessible. The
procedure also specify how internal and external documents be controlled and prevents
obsolete documents from reuse. Internal documents include documents regarding
instruction, instruction resources like textbooks, information on course registration,
lesson plans and research reports etc. and support services. External documents include
legislation, rules and regulations, government circulars, accreditation regulations and
student’s legal documents (IWA 2, 2007; Hoyle, 2003; IWA 2, 2003).
Control of records means there should be a documented procedure for
establishing, maintaining and control of records and also period of retention of all the
activities related to QMS (Hoyle, 2003). The HEI should maintain record of the academic
programme design; staff training, qualification and performance; students’ progress, tests
assessments, certificates and degrees; important meetings minutes, memo, contractual
and procurement records and complaints and action taken etc.
f. Infrastructure
Viable infrastructure is vital for effective implementation of a quality
management system. The organization should provide sufficient resources for managing,
performing and verifying activities affecting quality to enhance customer satisfaction by
meeting customer requirements (Hoyle, 2003). For the purpose the educational
organization should:
a. establish information inputs for detecting the needs for resources
b. perform resource planning at a short, medium and long term
c. carry out the follow-up of verification and assessment tasks
d. provide the resources to communicate effectively to the instruction staff, the
administrative staff, employees and customers
HEIs should first identify the infrastructure and equipments and then define
responsibilities and authorities for procurement and maintenance (IWA 2, 2007; IWA 2,
2003). Infrastructure includes:

89
a. Buildings and Working Spaces: For example classrooms, laboratories, workshops,
libraries, green areas
b. Associated Services/Utilities: such as water, electricity and its installations, gases
and fuels including those needed for instrumental usage, health services
c. Equipment for the teaching-learning process (hardware & Software): this includes
accessories, supplies and consumables, hardware
d. Support Services: such as transport, bookstore, school items, cafeterias,
refectories and crèches, as necessary
g. Internal Communication
Communication is the life-blood for organization’s development. It is the
responsibility of the top management to maintain conduits for organization wide
communication and sharing information related to the effectiveness of the quality
management system. There should be communication from top to bottom and bottom up
and also among different departments/work areas. For effective communication it must
be established as what to be communicated, to whom, who is responsible, by what means,
how often and how the information to be saved (Holy, 2003).
Effective communication enhances employees’ participation it help them share
ideas, clarify thinking and create a common understanding. The organization should
communicate its vision and mission, strategies, policies and plans to its employees and
the employees should have access necessary for performing their jobs. Similarly the
employees should be updated about the daily changes that take place in the organization
(Holy, 2003).
The top management in the educational organization should establish appropriate
communication processes and channels including intranet, memos, newsletters, posters,
videos, broadcasting, internal meetings, emails, phones etc. for communicating the
vision, mission, objectives, quality management system plan, plan reviewing and follow-
ups to students, faculty and all other employees (Holy, 2003). Students should also be
provided with accurate programmes and courses information. They should also be
informed of their rights and responsibilities and various services offered by the

90
organization through orientation sessions and other means. They should be provided in-
time information on acceptance or rejection of their application and what choices are
available to them.
The top management should also publish institution’s bulletins for
communicating the relevant quality-related matters as performance quality objectives,
giving feedback to students. The top management should also put across the importance
of meeting the students/customer requirements as well as the legal and regulatory
requirements for the educational service provided. Details of all physical resources and
information for performing duties should be provided to the employees also (IWA 2,
2003).
h. Work Environment
Successful implementation of TQM needs an environment where organization-
wide goals are shared by everyone and the processes are focused on customers. Satisfied
employees chip in their best for TQM implementation efforts but their satisfaction is not
static and alters under the influence of their personal characteristics and immediate
working environment (Lam, 1995). Different factors affect employees’ satisfaction such
as working environment, relationships with supervisors and colleagues, promotion
opportunities, pay, equality, job characteristics, compensation and reward systems, and
job security (Lam, 1995). The organization should identify and manage the factors
needed to achieve conformity to product requirements. The work environment includes
noise, ventilation, health & safety, workspace, cleanliness, temperature and humidity etc.
(Hoyle, 2003). The firm needs to continuously improve working conditions
It is the management’s responsibility to provide both social and working
environment conducive for producing quality products. Deming (1986) has suggested
climate free of fault finding, leg pulling, blame or fear. Neat and clean environment based
on proper reward and recognition, team approach, friendly and cordial relationship
motivates employees and enhances their satisfaction.
Conducive teaching and learning environment and better quality services to the
students help realize quality objectives and enhance their satisfaction. In HEIs the
environment support learning and meet the requirements of the customers and the

91
product. The physical facilities like classrooms, offices, laboratories, hostels, and
common spaces should be safe and free of health hazards and physical distractions.
Similarly supporting services should reinforce learning and not interfere with the learning
process. Similarly there should be proper reward and recognition system based on merit,
team approach and equality (IWA 2, 2003).
i. Programme Design
A quality product requires proper planning and arrangements by determining
quality objectives and requirements for the product, establishing the processes needed
according to the quality and requirements of the product, providing resources needed,
meeting documentation requirements and monitoring and measuring of the processes and
other verification, validation and testing activities specific to the product. These
processes should be consistent with the other processes of the quality management
system. Record should be maintained to verify that the product meets the requirement
(Hoyle, 2003).
Students are the primary customers of the educational institutions product i.e.
academic programme, courses and services. So the academic programme, course and
supporting services should meet the stated standards and outcome, be current and
relevant, prepare and train the students according to the requirements of their opted career
and the supporting services meet or exceed the students’ expectations. Educational
organizations should plan different processes regarding instructional design,
development, delivery, evaluation and support services activities, resource allocation,
evaluation criteria, and improvement procedures to achieve the desired results. The major
instructional processes that need to be controlled are needs assessment, instructional
design, development and delivery and outcome measurement. The students expect the
educational organization to provide academic programme that is relevant, current and
according to the standards which may enable them to shoulder professional
responsibilities. Similarly the administrative and support services should meet or exceed
the normal standards for the services (IWA 2, 2003). Customers of the educational
organization also include parents, employer and the society at large (Kanji & Tambi,
1999). So the product should meet academic and professional requirements and the

92
society’s expectations (Bayraktar, et al., 2008; IWA 2, 2007; IWA 2, 2003).
SERVQUAL, Kano Model and Quality Function Deployment (QFD) etc. may be used as
tools to capture the customers’ explicit and implicit needs and ensure their satisfaction
when designing academic programme.
Similarly the educational organization should review the product design i.e.
curricula and syllabi of an established programme when restarting it in new academic
session in the light of formal and informal feedback provided by students,
recommendations from business and industry and a desire to keep programs current and
relevant. Students’ feedback may be elicited through questionnaires, surveys, interview
and meetings with students’ representatives on programmes, and other services offered
by the organization and use the gathered data for programme planning and reviewing
(Bayraktar, et al., 2008; IWA 2, 2003). Changes made in the curriculum should be
identified, documented, authorized and communicated. Also, when making changes to
any subject, its effects on the entire curriculum should be evaluated and records
maintained (IWA 2, 2003).
The academic programme should clearly mention entry criteria and prerequisites
to provide education and training at appropriate level and space and to cater to the
individual student needs. For the purpose the prospective students’ aptitude, knowledge,
skills and ability should be assessed and matched with set criteria and pre-requisites.
Knowledge of students learning capacity and needs are very helpful in developing
appropriate structure and content of the programme and improve the service provided to
the students.
There should be processes for advertising programme information and institution
marketing material, students’ recruitment, hiring of the personnel and providing training
to them. There should be well established processes for (IWA 2, 2003):
a. Students’ registration, exit and graduation
b. Provision of Student Support Services
c. Design and Development of Programs and Curriculum
d. Delivery of Programs
e. Procurement and Purchasing of Equipments for teaching and learning
f. Teaching-learning support services

93
g. Maintenance and Security services
j. Monitoring and Measurement of Processes
Measurement of processes is vital for TQM implementation because “what gets
measured is what gets improved”. Continuous measurement and evaluation unleash
continuous improvement. Measurement helps evaluate processes performance against the
set standards/performance and thus help identify the areas of improvement (Bayraktar,
2006).
Educational institutions are considered as service organizations which have
specific academic as well administrative processes. These processes need continuous
improvement and maintenance i.e. these should be measured, evaluated and controlled
through comprehensive statistical data collection (Bayraktar, et al., 2008; Bayraktar,
2006; Sahney et al., 2004).
ISO 9001 standards require that the educational organization should measure and
monitor the processes used to manage and deliver the educational product at planned
intervals. Organization should establish a process for gathering data from different
sources and using different statistical tools and techniques to analyze the data
continuously to improve the effectiveness of the teaching/learning processes, the product
meet customers’ requirements and enhance or exceed customers’ satisfaction. The
different aspects of the educational process on which the data is required include students
and employers’ satisfaction regarding the academic programme and support service,
teaching methods, organizational-administrative effectiveness, teaching staff, support
staff and students’ performance, failures, expenses, dropouts etc. For the purpose the
organization should provide required information to students regarding the academic
programme/courses, what is expect of them and the outcome of the programme in the
start. Then the organization should seek feedback from the students and other
stakeholders regarding the academic programme, teaching methods, administrative,
teaching and support staff, support services, assessment and evaluation process or any
other aspect of the organization operation (IWA 2, 2003).

94
k. Monitoring and Measurement of Product (Product Management)
Two main products of an educational organization are academic programme and the
students. The academic programme is a set of services, knowledge and learning
experiences designed to bring about desirable changes in the students. So the academic
programme processes should be monitored and measured to check it effectiveness. For
the purpose the educational organization should seek students satisfaction and measure
the changes through different types of assessments, tests and examination that the
curriculum has brought in the students in order to ascertain that the planned results have
been achieved or not. Records of this evaluation process should be maintained show that
to what extent the planned objectives results have been achieved. Data on different
aspects of the educational programme may be obtained form different sources and after
proper analysis and systematic investigation improvement and corrective actions may be
taken in the light of the analysis (Hoyle, 2003; IWA 2, 2003).
In case of deficiencies i.e. academic programme failed to bring the expected
changes in the students or students dissatisfaction with any aspects of the academic
programme or the students was not able to come up to the established standards or
demonstrate the required skills proper remedial actions need to be taken. The deficient
students may be reassessed after remedial classes, transfer to another course or passed out
with lower certificate. In case of severe deficiency the students may be discharged with
no reward. Similarly a deficient programme may be redesigned, the students may the
provided with the missing information or close down if serious anomalies. Other aspects
of ht educational programme if lacking in achieving the desired results may be treated
according to the severity of the deficiency (IWA 2, 2003).
l. Responsibility and Authority
Assigning responsibility and authority make TQM implementation successful
because common task is seldom owned. Authority means the legitimate power given to a
person, to use resources and exercise discipline to reach to an objective. Similarly
responsibility means the duties, assignments, and accountability for results associated
with a function or position (Hoyle, 2003).

95
The educational organization top management should clearly define in the quality
manual or procedural manual the responsibilities and authorities of all the staff who
manage, perform and verify work affecting quality through organizational charts and job
descriptions and communicate them throughout the organization (IWA 2, 2007, Hoyle,
2003, IWA 2, 2003). The description of the responsibility and authority should be clear,
complete and consistent across the organization (Van den Berghe, 1997). It is the
responsibility of the top management in the educational organization to appoint a person
(s) from the management as management representative (MR) who has the
responsibilities to oversee that the processes of the quality management system are
established, implemented and maintained; to report to the top management on the
performance and need for improvement of the QMS and to create awareness regarding
customer requirements throughout the organization. The management representative must
have some characteristics. They should be knowledgeable and experienced who can
provide guidance and advice regarding the processes needed for the implementation of
quality management system (Holy, 2003, IWA 2, 2003).
According to Van den Berghe (1997) management representative may be called
‘Quality Manager’ or ‘Quality Coordinator’. Their responsibility and authority must be
fully documented. If the organization is large enough, it may be useful to appoint a
deputy quality manager, and to create a ‘quality management unit’ headed by the quality
manager. In very small organizations, the quality manager is often the director/head of
the institution.
m. Teaching Processes
Process management is essential for successful TQM implementation. Teaching
processes need to be controlled and managed as they are the core processes directly
involved in the product formation. The academic programme design must include the
course outlines with skills and knowledge to be acquired by the students, their
performance assessment criteria, appropriate instruction strategies and delivery plan,
Instruction material and reliable delivery media (IWA 2, 2003).
In order to ensure compliance with the planned programme, teaching activities
should also be monitored. The top management in consultation with the faculty should

96
identify overall topic and subject matters to be taught, methods of instruction and
establish measures to ensure achieving the learning objectives (IWA 2, 2003). Similarly
records of actual instruction provided should be maintained which may include student
course records, the course syllabus, the learner group schedule, textbook and edition, list
of instructors' names, instruction materials and relevant pre-requisite knowledge or
experience (Hoyle, 2003; IWA 2, 2003).
n. Assessment Processes
Testing and inspection are important aspects of quality control. There should be
some assessment, test and examination to evaluate the performance students or
programme. Modes of assessment and evaluation depend upon the nature and type of the
programme. The tests, quizzes and assignments should be validated through moderation
and internal verification for their reliability and utility. Similarly equipments used in
laboratories and workshops should be calibrated to national standard (IWA 2, 2003).
There should be formative as well as summative assessment. Formative assessment
should be carried out during the instructions to ensure conformity with the instruction
plan. There should be students’ performance profiles.
2.8 Tools and techniques of TQM
TQM tools and techniques can be categorized into three groups: tools for data
collection and interpretation, tools for planning and tools for continuous improvement.
a. Data Collection Tools
Quality improvement initiatives heavily depend on data collection, analysis and
interpretation to measure progress, make decision and understand customer needs and
expectations. For the purpose data is collected from various sources through different
tools to capture the voice of the customers and measure organization’s performance.
Following are the sources and tools of gathering data for quality improvement purposes.

97
i. Customer records
Follow-up data and feedback from alumnae and customer’s history is an important
source of information for the improvement of academic programmes and support service
in an educational organization.
ii. Customer complaints
Customer complaints are a source of continuous improvement. Organizations use
different sources and tools like complaint desk, toll-free telephone numbers, online and
customer comment card to capture customers’ complaints and comments.
iii. Survey data
Quality conscious organizations often conduct surveys: mails survey, telephone
survey, interviews and focus group regarding existing products and services or before
launching new products or initiating services to meet and exceed customer needs and
expectations.
iv. Benchmarking
Benchmarking is the process of continually comparing academic programmes,
services and processes with other institutions’ that are deemed to be best in class to
determine the standards of performance and how to achieve them and enhance customer
satisfaction.
b. Planning Tools
Customer data play a vital role for determining the quality of the product. Different
tools are used to collect data to embed quality in the very design of the product which
include Quality Function Deployment and Management Tools.
i. Quality function deployment
Quality Function Deployment (QFD) or The House of Quality is a tool that relates
or connects product and service design directly to customer wants and needs. It is a
matrix that links customer’s wants and needs to a sect of product or service design
metrics that organization then measures and control. Thus through QFD the organization
can capture the customers’ explicit and implicit needs and translate them into actions and
designs (AIOU, 2004; Besterfield, 2008).

98
c. Management Tools
It is a set of management and planning tools that assists academic managers to
control and structure the unstructured problems, to plan strategically and to manage large
and complicated projects. The set consists of the following tools:
i. Nominal group technique
It is a team based approach which provides useful input for effective decision
making. It is applied to evaluate alternatives and select among them. For example there
are many problems and a team wants to decide which problem to work on. For the
purpose the team members are asked to write the problem on the card they would like to
work on. The cards are then collected and all the problems are listed on a chart. The team
members are asked to rank the problem from least to most important with the help of
numerical values with 1 as the least important. Numbers for each problem are summed up
and averaged and the problem with highest score is considered to be the most important.
The technique is similar to Delphi technique except that the participants meet face-to-face
(AIOU, 2004; Besterfield, 2008).
ii. Affinity diagram
It is a modified version of brainstorming method used for generating and
organizing the ideas logically. To develop an affinity diagram a problem or issue is
posted which is visible to all. The team members then, write the ideas on cards and post
them below the problems. Thus seeing the ideas helps the members generate further
ideas. After sometime when the ideas generation pace slows down, the team sorts the
ideas into groups based on common patterns or themes. Lastly titles are created for the
groups that describe them. Affinity diagram results in team creativity, break down
barriers, facilitate breakthroughs and stimulate ownership of process (AIOU, 2004;
Besterfield, 2008).
iii. The interrelationship digraph
The tool is used to ascertain cause and affect relationship between pairs of
elements. The team starts with related ideas and determines if one causes the other. If
idea 2 causes idea 6, then an arrow is drawn from 2 to 6. If idea 6 causes idea 2, an arrow
is drawn from 6 to 2. If no cause is ascertained then no arrow is drawn. When done, the
ideas from many arrows emanate cause things to happen, while those receiving arrows

99
result from other things. The items with mostly arrows going in are long range targets and
the items that have mostly arrows going out are initial action items. The tool is mostly
used for problem analysis and consensus development (AIOU, 2004; Besterfield, 2008).
iv. A tree diagram
It helps to explore all the options to solve a problem or complete any task. The
diagram when fully developed looks like a tree. The trunk of the tree represents the
problem or the task. Branches are the major options for tackling the problem or to
complete the job. Twigs are the elements of the options. Leaves are the means of
accomplishing the options (AIOU, 2004; Besterfield, 2008).
v. Process decision programme chart (PDPC)
The tool is used to smoothly run a programme and successfully achieve its
objective by identifying possible hitches and suggesting countermeasures. For example
an activity i.e. a conference is being planned. So the team first suggests the objective
which in this case is holding a successful conference. After this other activities like
registration, presentation and facilities are to take place. If only presentation activity is
taken for illustration, then the team is to brainstorm to determine what could be the
possible hindrances. At this stage the activities are called second level or ‘what-if’
activities level. After this all the countermeasures are evaluated and select the best ones
by putting O and X beneath those rejected.
d. Continuous improvement Tools
The tools often used for continuous improvement include seven quality control tools
and Deming’s cycle of PDCA.
i. Check Sheet
The check sheet is typically a blank form designed for quick, easy and efficient
information gathering which may be qualitative or qualitative. The information is
recorded by putting marks or checks in different regions in which the form is divided.
The check sheet is also called a tally sheet when used for collecting quantitative
information. The data recorded are interpreted and understood by counting the number of
marks in different regions (AIOU, 2004; Besterfield, 2008).

100
ii. Histogram
It is a simple statistical tool used for arranging data in vertical bars charts to see
the pattern visually. This tabulation of data is called frequency distribution which can
assume different shapes. A bell-shaped curve or Normal Curve shows that most of the
data are centered on an average value. The phenomenon is called normal distribution of
the data. If there is skewness or hump on either low or high limit of the range rather than
in the middle, it means that data are not centered around average value (AIOU, 2004;
Besterfield, 2008).
iii. Pareto chart
It is a measurement tool to identify the most important problems through
different measuring scales (e.g. cost, frequency etc.) represented by bar graph that ranks
causes of process variation by the degree of impact on quality. It is also called 80/20 rule
i.e. most of the problem (80%) are caused by small number of factors (20%). This
technique helps managers to focus on the important quality drivers (AIOU, 2004;
Besterfield, 2008).
iv. Cause and effect diagram
Cause and effect diagram, also called ‘fishbone’ or ‘Ishikawa’ diagram, consists
of long horizontal arrow with a description of the problem. Causes of the problems are
represented by radial lines. Additional causes of the causes are depicted as additional
radial lines, and so forth. It is used for brainstorming to list all the possible problems
related to the problem (AIOU, 2004; Besterfield, 2008).
v. Scatter Diagram
It is a graphic representation of correlation between variables. The horizontal
axis contains values of one variable while the vertical axis displays another variable
values. The possible relationship between the two variables may be positive correlation
possible positive correlation, negative correlation or possible negative correlation (AIOU,
2004; Besterfield, 2008).
vi. Control Chart
It is a tool used for controlling a process by measuring variability of the
process. The chart consists of a central line representing the average value and a line
above and below the central line representing upper and lower control limits. It is of two

101
types: X-Bar (x) showing averages of the measurements and R-Bar (r) showing ranges of
the measurements. A process is under control if recorded readings are within the upper
and lower control limits on the chart (AIOU, 2004; Besterfield, 2008).
vii. Flowchart
It is a picture or map of a process and shows the steps in sequence for the
completion of the operation. When drawn with well-developed symbols and tools, a
flowchart can show key relationships, decision points, resources and responsibilities of
members and play a powerful role in understanding, communication and diagnosis of
problems (AIOU, 2004; Besterfield, 2008).
viii. Deming’s Cycle (PDCA)
It is a quality tool for continuous improvement and applicable to every aspect
of an organization. It was first introduced by Dr. Shewhart, a prominent statistician
working at The Bell Laboratories, USA, and known as P-D-S-A but later on generally
attributed to Deming as P-D-C-A. The acronyms stand for Plan, Do, Check/Study.
Diagrams and pictorial representation of the above mentioned TQM tools and
techniques are given in APPENDIX M.
2.9 Challenges to TQM implementation in public sector service organizations
Awareness regarding quality management and quality assurance spread in public
sector service organizations much later than private sector and manufacturing
organizations and following the suit the public sector service organizations adopted tools
for quality management and quality assurance that were basically developed by
manufacturing and private sector. It was discovered that these tools need to be
customized keeping in view the peculiarities of public sector service organizations.
It is not easy to define clearly quality, customer and product of educational
institutions. The nature of the product of educational institutions is different from that of
the manufacturing organizations which in turn affect the definition of quality (Reid &
Sanders, 2000). Similarly in public sector organizations the top management lacks full
authority and control which adds to their woes when going of any quality improvement
initiatives. Some of the challenges faced by the public sector service organizations like
educational institutions are given below:

102
a. TQM implementation initiatives may suffer due to government and political
interference in public sector organizations. Change in government or in its
preferences often results in reshuffling of intuitions’ head or top management;
consequently preferences and commitment to quality improvement get affected.
Moreover, it takes time for the dust created by the change to settle down and
normalcy prevail (Fryer; Anton & Douglas, 2007).
b. Since government funds public sector institutions, it has financial control and also
sets targets for them (Fryer et al., 2007). The intuitions are not independent and
are required to spend the fund under the heads for which the funds are released. In
HEIs the CEO find it difficult to allocate a substantial amount of funds for quality
improvement initiatives. Moreover, they do not have ultimate authority in hiring
and firing of personnel. This lack of control over resources impedes the progress
and leads to disappointment when the expected results get delayed (Evans &
Lindsay, 2005; Sirvanci, 2004).
c. Change management for quality improvement requires paradigm shift in the
mindset of the whole organization. TQM need change in attitude and culture
which comes through systematic and strategic training and education. In other
words TQM implementation is expensive regarding money, time and efforts.
People who are impatient to see the results get disillusioned with TQM and
abandon it (Venkatraman, 2007).
d. According to Deming committed leadership and constancy of purpose is a must
for any quality intervention. In educational institutions the top management does
not feel the need for change because the decay of educational standards and
quality is too slow to be felt. Consequently they continue with status quo and lack
commitment for change management (Motwani & Kumar, 1997).
e. TQM philosophy is customer driven and based on people involvement and
teamwork but in educational institutions among departments as well as the
faculties there is a struggle for resources and excellence which leads to a culture
of individuality. Moreover, the faculties consider themselves as experts and want
academic freedom with full control over what are to be taught, when and how
(Venkatraman, 2007; Sirvanci, 2004). With implementation of TQM the faculties,

103
being experts in their areas, see a threat to their individual autonomy and feel
coerced when asked to involve customer and work in teams. This fear of the
faculty, as per Deming, need to be driven out (Motwani & Kumar, 1997).
f. Service organizations especially educational institutions find it difficulty to
identify its customers clearly (Fryer et al., 2007) as the customer is often present
and participate in processes of service production (Evans & Lindsay, 2005). In
education the students play a multiple role being a recipient of the service, as raw
material in process of transformation and involved in the process of learning at
the same time (Venkatraman, 2007; Sirvanci, 2004).
g. Services like education have divergent customers and stakeholders which makes it
difficulty to delight a single one (Fryer et al., 2007; Venkatraman, 2007).
h. Human interaction plays a pivotal role in service quality. Many service
organizations like education institutions and banks etc. have to deal with a large
number of customers which maximizes the chances of error which makes it
difficult to achieve reliability (Evans & Lindsay, 2005).
i. Heterogeneity factor is involved in service quality. Contrary to manufacturing
organizations, service organizations customers’ needs are difficult to identify and
meet as they vary from individual to individual. It depends upon interaction
between two individuals; the service provider and the customer. Therefore, the
service quality is highly customized but in manufacturing quality is uniformly
specified so comparatively easy to achieve (Venkatraman, 2007; Evans &
Lindsay, 2005).
j. Service quality is intangible and invisible which makes it difficult to define or
measure precisely. On the other hand the products of the manufacturing
organizations are tangible and visible (Venkatraman, 2007; Evans & Lindsay,
2005).
k. There is little chance for repairing the damage except apology as result of poor
service quality as service cannot be replaced or recalled but a manufacturing
product can be easily recalled and replaced (Venkatraman, 2007; Evans &
Lindsay, 2005).

104
l. The service is produced and consumed at the same time. It cannot be stored,
inventoried and inspected prior to its release to the customers. But manufactured
goods are produced, delivered and then consumed and can be inspected for non-
conformity before going into the hands of customers (Venkatraman, 2007; Evans
& Lindsay, 2005).

105
SECTION3 – III
INTERNATIONAL ORGANIZATION OF STANDARDIZATION
STANDARDS (ISO)
The word ISO has originated from the Greek “isos”, meaning equal. The
International Organization for Standardization (ISO) is a non-governmental organization
with members from international institutes of 163 countries, one member per country,
coordinated by a central office in Geneva, Switzerland. Countries are usually represented
by their respective national standards organizations (ISO, n.d.).
ISO members are divided into three categories i.e. member bodies, correspondent
members and subscriber members. A full member body described by ISO is the national
“most representative of standardization in its country. Theses member bodies are entitled
to participate and exercise full voting rights on any technical committee and policy
committee of ISO. Only one organization form each country is accepted as a full
member. A correspondent member is an organization in a country which does not have a
fully developed national standards activity. They are not entitled to take an active part in
the technical and policy development work but they are kept fully informed about the
work of interest to them. Subscriber members’ status is for countries with meager
economies and at reduced membership fees, however they are allowed to maintain
contact with international standardization. The national representative bodies of USA and
UK are American National Standards Institute (ANSI) and British Standard Institute
(BSI) respectively while Pakistan is represented by Pakistan Standards and Quality
control Authority (PSQCA) founded in 1996. Pakistan is a full member of ISO (ISO,
n.d.).
ISO is managed by Secretary-General based at central Secretariat in Geneva
Switzerland. The Secretary-General along with a staff provides administrative and
technical support to the ISO members, coordinate standard’s development programme
and publish the output. The Secretary-General reports to the ISO Council which consists
of members drawn from the member countries and its membership is rotated for equal
3. The bulk of the information in this section are based on www.iso.org and www.bsi.org

106
representation. The ISO Council meets twice a year. The council develops proposals
which are put to the members in an annual General Assembly meeting (ISO, n.d.).
ISO develops standards related to products, management systems etc. which are
internationally recognized and useful for industries and business organizations of all sizes
and types (ISO). One such very important management standards developed by Technical
Committee 176 (ISO TC/176) of this organization is ISO 9000 (ISO, n.d.).
2.10 Introduction to ISO 9000 (Quality Management Standards)
“ISO 9000” is a combination of “ISO” and “9000”. “ISO” stands for International
Organization Standardization and “9000” is the series allocated for Quality System
Standards. So “ISO 9000” is a family of standards describing the requirements for
establishing and maintaining a quality management system in an organization (ISO, n.d.).
A quality management system is a set of activities to ensure that processes create
products with maximum quality at minimum cost of quality. In other word it is a set of
interconnected processes that enable organization to achieve its objectives. The activities
include Quality Assurance, Quality Control, and Quality Improvement (Hoyle, 2001).
ISO 9000 enable the organizations to identify measure, control and improve the
various core business processes that will ultimately lead to improved business
performance and ensure the product or services consistently meet customers’
requirements.
The family consists of 16 standards of which 4 are core standards and 12 are
supporting standards. The four core standards are given below (ISO, n.d.):
a. ISO 9000: 2005 – Fundamentals and Vocabulary: it describes the fundamentals
and specifies vocabulary of a quality management system.
b. ISO 9001: 2008 – Quality Management Systems Requirements: consists of
requirements of a quality management system. ISO 9001:2008 is used for
contractual and certification purposes.
c. ISO 9004: 2009 – Managing for the Sustained Success of an Organization – A
Quality Management Approach
ISO 9004 provides guidelines for achieving sustained success through the
continuous improvement of the organization’s overall performance, efficiency
107
and effectiveness based on process approach. ISO 9001:2008 ensures quality
management of product and services and enhancing customer satisfaction while
ISO 9004:2009 provides broader perspectives or quality management, particularly
performance improvement. The purpose is to continuously improve the overall
performance of the organization and enhance customer satisfaction and other
interested parties (ISO, n.d.).
ISO 9004:2009 may be used along with ISO 9001:2008 as well as independently.
However it may not be used for third-party certification, regulatory or contractual
purposes or as a guide to the implementation of ISO 9001:2008 (ISO, n.d.).
d. ISO 19011 – Guidelines for Quality and/or Environmental Management Systems
Auditing: This standard is used as a supporting tool and provides guidance on
auditing quality and environmental management systems.
ISO 9000 is generic in nature and applicable to any organization irrespective of
size and type. It describes the requirements an organization quality management system
must meet but does not prescribe or dictates how they should be met by the organization
which leaves great scope and flexibility for implementation in different business sectors
and business and national culture (Hoyle, 2003, ISO, n.d.).
ISO 9001 is used for certification by a third party i.e. an independent auditing
agency. The independent auditing agency audits the organization against the
requirements of the standard (ISO 9001) and on the successful compliance issues a
certificate which is valid for three years. The audit consists of initial certification audit
followed by yearly or half-yearly surveillance audits (Hoyle, 2003, ISO, n.d.).
ISO 9001 certificate is not a badge of good quality product as ISO certification
standards (ISO 9001) are not product oriented standards. They are more concerned about
management and processes and do not contain requirements for any specific product.
They certify the processes and the system of an organization and not the product or the
service itself.

108
2.10.1 Origin of ISO 9000 standards
Quality standards is not a new concept. It has existed in different ancient western
and eastern civilizations in the forms of different standardizing stones and wooden
gouges for measurement. Standards for quality of gold and silver in UK in 14th century
and for textile industry in Europe during industrial revolution were established. Similarly
in 19th century during the era of Fredrick Winslow Taylor’ scientific management work
standards existed (Hoyle, 2001).
In 20th century, concern for quality intensified. As a result many national and
international quality associations and quality standards came to existence. In 1926 the
establishment of the International Federation of National Standardizing Associations
(ISA) for mechanical engineering is considered to be the first step towards international
quality standards. However it was scraped during the Second World War (Loya & Boli,
1999). During the World War II the use of the statistical sampling and imposition of strict
standards on supplier led to the development of US military standard, MIL-STD (Evans
& Lindsay, 2005).
In 1968 North Atlantic Treaty Organization (NATO) developed a series of Allied
Quality Assurance Publications (AQAP) Standards (Maguad, 2006).
In 1979, the British Standard Institution (BSI) released the first series of BS 5750.
They were meant for assurance quality in manufacturing and the certified organization
could display a mark of registration issued by the assessors.
During the war the quality efforts were focused in military procurements and hard
wares units but after the war the scope of quality efforts was extended to private sectors
in some countries like England and Japan. In England the private sector was encouraged
to implement the BS 5750 standard. However, in USA, during the era of mass production
after the war, quality could not capture the due attention and the use of standards was
limited to the defense sectors (Stimson, 1998). In the 1980’s, there was a phenomenal
expansion in the use of BS 5750 and served as a basis for national quality systems in
many countries including USA. In the USA, this standard was developed and released as
the American National Standards (ANSI) ANSI 90 series of quality standards.
In 1946, delegates of national standardizing associations from 25 countries met in
London and decided to create a new international organization for standardization (ISO).

109
The main objective behind the creation of ISO was to facilitate the coordination and
unification of thousands conflicting industrial standards of the various nations and
promote international standards in business and industry. The new organization, ISO,
officially began operations on 23 February 1947, in Geneva, Switzerland (Goetsch &
Davis, 2002; BSI).
In 1987, the International Organization for Standardization (ISO) released its ISO
9000 family of Standards which was almost an exact copy BS 5750. The first set of ISO
9000: 1987 Standards were adopted by the European Community (now the European
Union) and BSI in the UK in 1980’s. The series of Standards is called BS EN ISO 9000.
Since 1987, the standards, as they were created for manufacturers and industry, have been
revised many times to make them user friendly and applicable to all type and size of
organizations. Details of the revisions are given in the section “Revision of ISO 9000”
2.10.2 Revision of ISO 9000
International standards are reviewed three years after publication and every five
years after the first review by all the ISO member bodies. After review, the standards are
confirmed, revised or withdrawn.
In 1987, ISO created a series of Quality Management System (QMS) standards
comprising ISO 9001:1987, ISO 9002: 1987 and ISO 9003: 1987. They were applicable
in different types of industries, based on the type of activity or process i.e. designing,
production or service industry (Hoyle, 2003; ISO, n.d.).
In 1994 the standards were revised and named as ISO 9000:1994. The ISO
9000:1994 series consisted of the following models:
ISO 9000-1: 1994 - Quality management and quality assurance standards – Part 1
Guidelines for selection and use
ISO 9001:1994 - Quality Systems – Model for quality assurance
applied to organizations involved in design and
development of product/services, production of
product/provision of services and delivery of
product/services.

110
ISO 9002:1994 - Quality Systems – Model for quality assurance
applied to organizations that do not
design/develop their products or services but are
only involved in production of products/provision
of services and delivery of product/services
ISO 9003:1994 = Quality Systems – Model for quality assurance
applied to organizations that do not
design/develop and produce their products or
services but are only involve in final inspection
and delivery of the finished product.
ISO 9004-1: 1994 = Quality management and quality system elements –Part 1:
Guidelines. (ISO, n.d., OECD, 1997, Van den Berghe, 1997)
In 2000, the ISO 9000 standards were revised for the second time. ISO
9001:1994, ISO 9002:1994 and ISO 9003:1994 were merged into ISO 9001: 2000
Standards. Moreover, 20 Clauses of ISO 9000:1994 were abandoned and integrated into 5
sections with additional requirements. New version of ISO: 2000 series of the standards
consists of the following models (ISO, n.d.):
ISO 9000:2000 - deals with fundamentals and vocabulary.
ISO 9001:2000 - consists of Requirements for quality management
system
ISO 9004:2000 - consists of Guidelines for Performance Improvement
For the third time, ISO 9000:2000 was revised in 2005 as ISO 9000:2005 and ISO
9001: 2000 was revised in 2008 as ISO 9001:2008. This time there is neither addition of
new requirements to existing requirements of ISO 9001:2000 nor change in the intent of
the ISO 9001:2000 standard. There are only changes in the vocabulary to introduce
clarification to the existing requirements of ISO 9001: 2000 and remove the confusion in
their implementation. Another reason for the development of the ISO 9001:2008 is to
improve the compatibility with ISO 14001:2004 (ISO, n.d.).
Similarly ISO 19011 standards have replaced ISO 10011 part 1, 2, and 3, used for
quality management system auditing and environmental management system (EMS)
auditing standards in the ISO 14000 family, namely ISO 14010, ISO 14011, and ISO

111
14012. In November, 2009, ISO 9004:2000 was edited as ISO 9004:2009 “Managing for
the Sustained Success of an Organization – A Quality Management Approach”.
Substantial changes have been made to the structure and contents of ISO 9004: 2000 to
make it more consistent with quality management standards like ISO 9001 and also to
support organization of any type, size or activity to achieve sustained success through
quality management approach (ISO, n.d.).
2.10.3 Structure of ISO 9001
ISO 9001 consists of the following eight sections/dimensions
Section 1 – Scope
According to the scope of the standards the organization is required to demonstrate
its ability to consistently provide product that is according the customer requirements and
fulfil all applicable regulatory requirements. As ISO 9001 is applicable to all types and
size of organisations, an organization can claim that certain clause or clauses of section 7
is not applicable to it. According to the standard this is permissible only when such
exclusion does not affect the organization’s ability or responsibility to provide product
that meets customer and applicable regulatory requirements. Such exclusion is limited
only to section 7. The organization is also required to mention the exclusion in the scope
of its quality management system and also give reason for the exclusion.
Section 2 - Normative reference
Provides normative references—those that conform to ISO 9000’s related norms—
to constitute the terms of ISO 9001.
Section 3 - Terms and definitions
Defines the terms used in the standard and highlights the differences between the
2000 version and the 1994 version.
Section 4 - Quality management system
The section describes the general and the documentation requirements of the
quality management system. According to the general requirements the educational
organization is required to establish, document, implement, maintain and continually

112
improve the effectiveness of the quality management system. The documentation
requirements of the standards mean that there should be a documented quality policy and
quality objectives. A quality manual that document the whole quality management
system and its procedures. It also requires that there should be documented procedures
for the control of the document and control of records.
To sum up the section includes all activities from quality manual documentation
and control of documents and records to determining the sequence and interaction of the
processes to implementing actions to achieve planned results.
Section 5 - Management responsibility
The standard requires that the top management shall demonstrate its commitment
to the development of the quality management system and continually improve its
effectiveness by ensuring that the customers’ requirements are determine and met,
establishing quality policy and quality objectives, determining and communicating
responsibility and appointing management representative and establishing effective
internal communication processes. Moreover, the top management is required to ensure
sufficient supply of resources and conduct management review as planned.
In short the educational organization’s top management must be dedicated to its
processes, products and services.
Section 6 - Resource management
This contains requirements regarding providing resources for the implementation,
maintenance and continual improvement of the quality management system and to
enhance the customer satisfaction by meeting their requirements. The educational
organization is required to provide competent and trained personnel. The organization
shall determine, provide and maintain the infrastructure and provide work environment
that is appropriate for achieving the desired product.
In short this section provides the criteria required to work competently and in a
safe environment to achieve the educational organization’s objectives.

113
Section 7 - Product realization
The standard requires the educational organization to plan processes for the
production of product according to quality objectives for the product, establish, document
and provide resources for these processes and keep records of it.
The educational organization shall determine the stated and implied requirements
of the customer, regulatory and other requirements which the organization may deem it
necessary for the product. The educational organization shall review these requirements
and after confirming that the educational organization has the ability to produce a product
according to the requirements, the organization shall communicate the information to the
customer. After confirming form the customer the organization shall plan, review, verify
and validate the design and development of the product. The educational organization
shall record the changes made in the process. The organization shall purchase the raw
material and other stuff for the product according to the purchase requirements after due
inspection and verification. The organization shall carry out the production of the product
and services according to the specified requirements and production process shall be duly
validated. The product shall be traceable and identifiable throughout the production
process. The production process shall be duly monitored and measured and the measuring
devices shall be calibrated. There shall be proper arrangements for storage and
preservation of the product. In higher education setting this requirement addresses
curriculum design and development, academic programme development and delivery and
control of monitoring and measuring devices.
In short this section covers all the steps in the product development from the
initial design phase to the final delivery phase.
Section 8 - Measurement, analysis and improvement
The standard requires the educational organization to plan and implement the
monitoring, measurement, analysis and improvement processes to ensure the conformity
of the product to the requirements and for the continual improvement of the Quality
Management System (QMS). For the purpose the educational organization shall apply
suitable method to monitor and measure the customer satisfaction, the processes, the
product and carry out internal audit at planned intervals. The non-forming product shall

114
be identified and suitable measures shall be taken to prevent its accidental use and
delivery. The data gather as a result of monitoring and measurement shall be analyzed for
continual improvement and correction and prevention of non-conformity.
The first three sections provide general information about the standard, and the
last five sections constitute the main body of the standards. These sections focus on how
to implement it. To achieve certification, the educational organization have to
demonstrate how each of these sections applies to it through the use of quality manuals,
procedures, quality plans, instructions, quality records and other support document.
2.10.4 ISO 9000 in education
The ISO 9000 standards were originally developed for manufacturing industry.
However, its application to other sectors grew, especially in early 1990s. Despite some
terminology and interpretation problems, majority of the quality experts agree that the
standards apply to all type and size of organizations and provide a reliable quality
assurance framework.
The standards were first introduced in continuing education and business and
professional training schools than the regular education. The reason is that these
organizations are market oriented than regular education institutions. Later one some
general educations institutes and universities embraced the standards and also got
certification but still the trend is at nascent stage. However, the graph of the number of
the institutions with ISO 9001 quality management system is going up day by day and
this trend is quite brisk in UK, Germany, the Netherlands and France.
2.9.5 Implementation of ISO 9001 quality management system
First step in the implementation of ISO 9001 quality management system is to
conduct GAP analysis to find the gap between the repuirements of quality management
system and the requirements which the organization is already meeting and accordingly
allocate resources. A well organized institution with committed leadership, robust
processes, qualified and motivated personnel, sound finances and fulfilling some of the
basic requirements can easily implement ISO 9001(Van den Berghe, 1997).

115
ISO 9001 is process based approach requiring documenting processes and their
interaction in quality manual and procedure manual but it does not mean that the
organization is supposed to document each and every process. Minimum requirements
are to document the six key processes regarding (1) Control of Documents (2) Control of
Records (3) Internal Audit (4) Control of nonconforming Product (5) Corrective Action
and (6) Preventive Action. However, other processes which affect the quality of the
product may also be documented.
ISO 9001 is a documented quality management system and there are five levels of
minimum documentation requirements:
Level I: Quality policy and quality objectives
Level II: Quality manual
Level III: Quality system procedures
Level IV: Documents needed by the organization to ensure the effective planning,
operation and control of its processes process procedures and plans
Level V: Records/Reports/Logs
Any organization fulfilling the minimum requirements can register for
certification.
2.11 TQM and ISO 9000
There is no perfect way of implementing TQM. Its implementation varies from
organization to organization. Different TQM tools and techniques are adopted to create
quality culture. Organizations implement standardized excellent models, standards, six-
sigma or some combination of all the three. Majority prefers ISO 9000 Standards for
Quality Management system to start with due to its prescribed requirements and process
orientation (Evans & Lindsay, 2005; Lundquist, 1997). However, there is a debate in
literature about whether ISO is complimentary, foundation or synonymous of TQM.
The scanning of the literature divulged that they are not one and the same and cannot be used
interchangeably.
TQM is a management philosophy based on quality concept that is broader,
dynamic and customer oriented and includes cultural, behavioural and organizational

116
conditions for producing quality products and services (Johannsen, 1996). While ISO
9000 standards stresses conformance to specifications and represent quality concepts that
are narrow, static and in-house oriented. They are used for quality assurance purposes in
a supplier customer relationship through third-party certification (Johannsen, 1996). ISO
9000 existed before TQM.
ISO 9000 implementation requires an organization to have a set of core SOPs in
place which results in a certificate for the organization. This means that there is an end to
ISO 9000 whereas TQM is a never ending journey to excellence.
TQM is a totally customer focused while ISO focuses only on processes and
conformance to requirements especially its old versions which were documentation oriented
and bureaucratic (Reid & Sandars, 2005; Lundquist, 1997).
As ISO 9000 is process oriented approach and does not address questions about the
product itself and whether it meets customer and market requirements. So it is possible to
have a substandard product despite the fact that the ISO 9000 system has been established
and certificate achieved (Lindsay, 2005; Kartha, 2004). On the other hand TQM is a holistic
approach and constantly questions the processes, the product and the customers. ISO 9000
merely requires documenting its actions and then act according to those documents (Reid &
Sandars, 2005). Magd and Curry (2003) have contended that ISO 9000 and TQM are
complementary and in fact ISO 9000 is a part TQM which has a much broader scope
than ISO 9000. They have advised to start with ISO 9000 on way to TQM as ISO 9000
brings consistency and stability in organization’s operations and set the stage for TQM
which focuses on overall organization’s performance by enhancing employees’
motivation and operational efficiency.
This shows that though the origin and nature of ISO 9000 and TQM are
different, the two concepts are compatible and complementary (Magd & Curry, 2003;
Karapatrovic, 1998; Johannsen, 1996; Doherty, 1995) and suggests that within TQM
framework, different national or international models and organizational assessment
schemes may be used. Such models and assessments schemes stimulate, organize and
facilitate the development of quality improvement activities and assist in acceptance of
quality globally (Johannsen, 1996).
ISO 9001 certification gives confidence to the faculty members, professionals,

117
students, their parents and other stakeholders that the requirements for quality
education, training and research are continuously met (Paunescu & Fok, 2005).
It may be concluded that ISO 9000 is a foundation and subset of TQM but there is
still a long way after ISO 9000 to TQM organization. (Reid & Sandars, 2005; Kartha,
2004; Goetsch & Davis, 2000) In other word to maintain ISO 9001 certification, the
institutions need continuous improvement (TQM) (Paunescu & Fok, 2005).
2.12 Why ISO 9000
Quality never comes by chance. It is always the result of the conscious efforts
(Foster, cited in BSI, 2008). The choice of a correct model en route to TQM is a real
dilemma. In majority of the reported cases, HEIs have preferred proven national and
international standards and business excellence models to benchmark their quality levels
and also earn a seal of approval from a third party as a business gimmick (Paunescu &
Fok, 2005).
Doherty (1995) has argued that the nature and the maturity of quality culture in
the organization determine the selection of standards and the quality model. According to
Hopkin, (2004) higher education systems around the globe can be categorized into
Mature Systems like those of Sweden, Denmark, United States, Australia and United
Kingdom, Evolving Systems as in India, South Africa, Trinidad and Malaysia and
Embryonic Systems as in Botswana, Guyana, Oman and Vietnam. Similarly individual
organizations are of three types such as mature organizations, developing organizations
and organizations starting on the journey of excellence. In the presents scenario the
higher education system and the higher education institutions in Pakistan, at best, fall in
the category of Evolving System and developing organizations which means that the
environment in not ripe and conducive. They are not quality wise mature. In such a
situation where there is a weak quality management system in organization or at the
early stage of installing one, ISO 9000 provides a sound foundation by creating discipline
and efficiency in operations (Evans & Lindsay, 2005).
According to Paunescu and Fok, (2005) about one-third of the eighty national
Romanian universities are striving for ISO 9001:2000 certification and one of them has
been awarded the certificate. Similarly in other countries, such as United Kingdom,

118
Germany or Australia, many universities have been operating for many years with ISO
9000 certified quality systems (Paunescu & Fok, 2005; Karapetrovik 2001 &
Karapetrovik et al. 1998b). MBNQA, EFQM and Balanced scorecard are suitable for
quality wise mature organization and where quality system is already in place (Lindsay,
2005; Kartha, 2004).
The use of TQM and ISO 9000 standards in education is a recent phenomenon
and potentially has many contributions (Bevans-Gonzles & Nair, 2004; Yorke, 1999; Lo
& Sculli, 1996; Clark & Moreland, 1997). A close look at ISO 9001 contents establishes
the face validity of the standards and, if properly implemented with true commitment,
would solve the problems as identified in section 2.2.4.2 “Problem and Issues in Higher
Education in Pakistan”. Moreover the documented experiences with ISO 9000 and
literature reviewed for the study conform the ISO 9000 potential for the task.
2.13 Case Studies of TQM and ISO 9000 Implementation
TQM has been implanted in many higher education institutions around the world.
In this section some of the case studies of TQM implementation in national and
international higher education institutions are discussed. Besides these case studies some
local research studies on issues related to quality in higher education are also presented.
The purpose is to highlight and learn from the previous experiences which will be helpful
in developing the framework and implementation of TQM as it is always better to learn
from other’s experiences rather than to reinvent the wheel. These studies may also fulfil
the benchmarking purpose too.
2.13.1 International studies
This section reviews the implementation of TQM and ISO 9000 in international
educational institutions.
1. The University of Wolverhampton
Many educational institutions have got registration for ISO 9000 but majority of
them have got certification for a part of the institution; however, the University of
Wolverhampton has the distinction to be the first university that got BS EN ISO 9000

119
(BS 5750 Part 2: 1987/ISO 9002 ) registration for its quality management system for the
whole university in 1994. Later on it also got Charter Mark Award the same year. The
university at the time of registration housed 23,000 students, 2,000 staff, four faculties,
ten schools, six major service departments and a number of smaller centres and units and
consisted of five campuses (Doherty, 1995).
As recounted by Doherty (1995), the university first tried to implement TQM
based on Crosby’s philosophy of driving out hassle, error prevention and getting things
right the first time in 1989. But it was realized that, given the peculiar nature of the
educational organization, its undefined processes and product oriented approach,
Crosby’s zero-defects model was neither totally applicable nor achievable. It was deemed
necessary to improve processes first to achieve quality.
In 1991-1992, the university decided to focus on a process oriented approach BS
5750 (BS EN ISO 9000). It was intended that ISO 9000 based quality management
system with clearly identified and documented procedures in Quality Manual and written
work instructions would not only improve and streamline the processes at the university
and provide a basis for TQM culture and continuous improvement but also improve the
university’s market position. Another thing that encouraged the university to opt for ISO
9000 first to reach TQM is its competitor FE College (Sandwell) registration to BS 5750
Part 2: 1987/ISO 9002. The college is the first in UK that achieved the registration.
In implementing TQM, the university opted for classical top-down approach. It
started with orientation sessions, debates and discussions on quality and related concept
during 1989-1990 to create awareness and develop consensus. This stage was followed
by developing QMS which proved to be a tedious and tough process. For the
development and documentation of the QMS, the university preferred to use its own
people and developed internal quality improvement teams (QIT) for writing procedures
and work instructions rather than totally depending upon the consultant. This approach
though proved time consuming, created a sense of ownership among the people. It took
the university three years to document and develop its QMS.
Some of the problems that surfaced during the implementation of ISO 9000 and
TQM include:
a. which one first; ISO 9000, TQM or both at tandem

120
b. which form i.e. ISO 9001 or ISO 9002
c. what is the product of the educational organizations
d. different types of customers
e. time consuming
f. an expensive exercise
The implementation of QMS led to the following:
a. clearer understanding of roles, responsibilities and authority
b. a sense of ownership for quality improvement initiatives
c. better communication and understanding of the university’s mission and
objectives
d. better understanding between academics and support staff
e. clearer demarcation of the students and the staff’s rights and responsibilities
f. continuous improvement of the module design, documentation and delivery.
g. market advantage
h. improved complaints procedures and suggestions scheme
i. increased training opportunities of all personnel
2. The Oregon State University
Oregon State University is one of the pioneer universities in the United States that
has implemented Total Quality Management around the university. While confronted
with downsizing, they decided to embark on five-year’s TQM implementation project in
1989 to improve its operations and services. With top management full commitment they
started with finance and administrative services by establishing quality improvement
teams. Later on the scope of TQM was extended to other areas of administration and also
brought academic aspects like curriculum development; teaching improvement and
research proposal development were brought into its folds in the next four years.
However, tangible effects of TQM were visible after three years of implementation. TQM
implementation at Oregon State University showed that teams were essential for the
implementation of TQM and according to Coate (1993) 85 process improvement teams
were working at the time of his reporting. TQM implementation strategy, impediments
and learning are given in the following lines.

121
a. TQM Implementation
Initially a three-stage TQM implementation strategy consisting of planning,
implementation and appraisal was chalked out in consultation with organizations which
had sufficient experience in TQM like Ford Motor Company, Xerox and Motorola. The
planning, implementation and appraisal stages consisted of the following steps (Coate,
1993 & ALNabhani, 2007).
i. Planning for TQM
This stage consisted of the following activities:
a. exploring TQM through visiting TQM organizations, inviting experts like
Deming, study literature on TQM and attending TQM classes
b. forming a pilot study team consisting of 10 managers and front-line
workers, a team leader, and a training officer/ facilitator. The formation of
the team served as a learning experience for the staff and a model for the
future teams
c. after the first pilot team experience, they began implementing TQM by
focusing top management on strategic planning i.e. defining the mission,
understanding customers, identifying the critical processes of the
president, developing the vision and identifying breakthrough items
d. developing a preliminary five-year plan based upon priority breakthrough
items and the Malcolm Baldrige National Quality Award criteria
e. developing a training programme, a quality manual and a recognition
system
f. establishing daily management system
g. establishing standing cross-functional teams
ii. Implementing TQM
This stage consisted of the following steps:
a. forming finance and administration daily management teams
b. improving TQM training
c. involving new administrative area

122
d. developing cross-functional management
e. recognizing the efforts of TQM teams and celebrating their
accomplishment
f. Implementing TQM strategic planning in academic unit
iii. Appraising TQM
TQM implementation results were apparent after three years in the form of
significant improvement in the processes effectiveness and efficiency; enhance customer
satisfaction, empowered and confident people, savings in terms of time, material and
money.
b. Barriers to TQM
TQM implementation at Oregon State University, though a success, was not
without hitches. There was confusion due the middle managers’ unfamiliarity with the
language and terminology as TQM came from corporate world not education. There was
skepticism besides attitude problem about any fundamental change process. Moreover, it
was time consuming too.
c. Learning from Oregon State University experience
Some of the findings from the implementation of TQM the university may be
summed up as follows.
i. top management commitment
ii. Just do it!
iii. teamwork
iv. you need a champion
v. breakthrough planning helps
vi. try service first

123
3. Aston University (UK)
Confronted with the challenges of the government’s policy to restructure the
higher education system and financial crunch of that time, Aston University decided to
adopt the Total Quality Management Philosophy and techniques to ensure continuous
improvement and progress towards realization of its mission to be a leading technological
university and to overcome the problem of reduction in the funding. The Aston
University adopted a ‘Quality-driven, demand-led’ which was focusing on (Clayton,
1993):
a. academic restructuring
b. corporate identity
c. physical restructuring
d. advanced academic support services and focus on customer care
e. ability to attract and retain high caliber staff and students
In order to offer academic programmes and learning experiences of highest
quality, the departments at the university were restructured and only those departments
were allowed to function which produced good graduates or had the potential to grow
strong and attract quality students. Campus development, academic support services and
customer service development programmes were initiated. To promote quality, staff
development programme regarding customer care for the academic support service staff
and for the senior academic and officers of the university training programmes in Total
Quality Management concepts and tools were launched. Similarly Quality Circles were
established, starting with the non-academic staff, to inculcate team approach to problem
solving which was quite effective (Clayton, 1993).
Total quality management was introduced step by step through ‘Kaizen’ i.e. a
continuous or incremental improvement as it involved formulation of the mission,
understanding of the processes and interlinking of the processes to achieve the mission.
This led to a gradual project-by-project improvement which was measured by a range of
performance indicators like A-level entry scores, attrition rates and classes of degree
(Clayton, 1993).
Later on a Quality Council comprising the University’s most senior academic and
non-academic mangers was established and an extensive education programme including

124
directed reading, workshops for senior managers, visit from TQM practitioners and an
open lecture series was started. During this training and education programme the staff
greatly benefited from the works of the quality gurus’ and the experience of the quality
management practitioners. Quality Function Deployment (QFD) was experimented for
course design and improvement in the Department of Vision Sciences which was found
to be a complex tool.
Aston University did not use a particular TQM model but instead only used the
TQM principles, tools and techniques whenever appropriate and possible. According to
Clayton (1993), because of Aston’s quality ‘drip-fed’ approach, it was difficult to provide
an objective assessment to its success or of its cost over the years. He believes that Aston
would only succeed if everyone had enough commitment to address external challenges.
The experience of TQM at Aston University shows that:
a. Top management commitment
b. Academic and physical restructuring was done for the implementation of
TQM.
c. Customer focused approach was adopted by improving academic support
services and customer care.
d. Quality Circles and team based approach was successful.
e. QFD proved a complex tool.
f. Kaizen approach was adopted.
g. Quality Council was established.
h. Quality awareness, training and development programmes for the official,
academic and non-teaching staff
4. University of Bradford Management Centre
Faced with intense competition, Bradford Management Centre, a leading business
school, at the University of Bradford, UK, decided to implement TQM in 1990s.
According to Oakland and Porter, (1995) as cited by ALNabhani (2007), A TQM model
for the implementation was developed to improve customer-supplier relationship and the
core processes. The implementation strategy revealed that TQM implementation required
considerable time and commitment to the culture of continuous improvement. It was also

125
essential that TQM initiatives be fully integrated with the Management Centre’s
philosophy and system. The application followed certain steps (Oakland and Porter,
1995):
a. Establishing Quality Council (QC): The quality council comprising the director of
the centre, two professors, two programme chairs, a lecturer, a secretary and a
computer officer (technician) was established. The council was entrusted with
updating the mission statement, identifying the critical success factors, providing
overall strategic direction on TQM for ECTQM, establishing plans for TQM
implementation, setting up process quality teams, reviewing progress and revising
development plans.
b. Involvement of teamwork for quality improvement: Involvement in quality
flowed down through the organization using a structured team method involving
Process Quality Teams (PQTs) and Quality Action Teams (QATs). PQTs were
responsible for breaking down and describing critical processes and prioritizing
and selecting processes for improvement. QATs were responsible for defining and
improving particular processes assigned by QATs. In addition, they were
responsible for identifying stakeholders, measuring and comparing results with
requirements and improving the process and documenting it.
c. Training: For the purpose of fostering the understanding of the process involved
in implementing TQM in the Centre, training for all staff was held in the form of
a workshop for the Executive Committee and the professoriate. Tools such as the
Myres-Briggs Type Indicators (MBTI) were used to help members to understand
themselves and their colleagues and to promote effective teamwork. The action
plan for implementation of TQM at the Management Centre was also reviewed.
Moreover, all staff had taken part in a one day workshop that was led by the
professor of TQM and facilitated by members of his department. The outcome of
these workshops was that all staff was encouraged to participate in the TQM
process at individual and team level. Further training on process improvement
methods was provided to the various teams on an ‘as-needed’ basis. It was
expected that academic staff should be familiar with techniques such as flow-
126
charting, brainstorming, cause-and-effect analysis, and the use of data
presentation methods.
TQM was successful because of the people’s willingness and the ability to work
together effectively. Nevertheless, many areas in teamwork, communication and
measurement were highlighted for improvement.
5. Griffith University
Griffith University of Australia was established within a period of rapid
expansion of higher education. Its aim was to respond vigorously to the imperatives of
external accountability while at the same time introducing quality development systems
throughout the university (Meade, 1995, cited in Tang & Zairi, 1998).
The key principles of Griffith University for quality management were expressed
in quality oriented processes and attitudes across the whole range of activities. The
quality management plan included (Tang & Zairi, 1998):
a. the vice-chancellor and senior executive responsibility for leadership of
the university’s quality plan
b. quality commitment to all university elements
c. continuous improvement everyone’s responsibility
d. deployment of resources to support quality management
e. quality management responsibility handed over at operational levels
f. encouragement of the diversification of quality management forms
g. development of staff
From the quality principles and mission statement, critical factors of strategic
importance were identified that included teaching and learning, research, community
service, institutional management, priority resource allocation, enhancing technical and
information support, and quality advancement procedures. These factors formed a
framework for further actions in the quality plan.
In implementing TQM, each faculty formed its own quality committee to provide
leadership and increase quality improvement at faculty level. Responsible officers (e.g.
Deans) were charged with ensuring that performance targets are achieved within the
specified time. As a part of staff development, brainstorming was used to identify

127
strengths and weaknesses. Griffith University learned that the commitment of the staff to
the quality initiatives and staff development, in addition to the stakeholders’ involvement
and empowerment were essential to the strengthening of a quality culture.
6. Red River Community College
Red River Community College (RRCC) of Canada decided to embrace the
concept of Total Quality Management to provide an operational philosophy, enhance
programme curricula and establish business opportunities in order to face the change that
resulted from moving from being a provincial government department to being a crown
corporation (Knowles, 1994). RRCC adapted W. Edward Deming’s philosophy to create
its own TQM approach which focused on (Knowles, 1994):
a. establishing a clear statement of organizational mission
b. active commitment of the chief executive officer
c. employee involvement in planning and implementation
d. defining and development of the processes to enhance good employee job
e. identifying of customers and their needs
f. entrusting responsibility and accountability to the lowest level in the
organization
g. a teamwork approach that involved the workers in solving problems
h. use of data and graphical tools in decision making
i. establishing permanent change through continuous improvement
The implementation of TQM at RRCC began with the establishment of 16-
member implementation team which acted as a steering committee for the entire
institution. An external consultant was used for the first two months as a facilitator and a
team builder to work through the initial stages of gaining common understanding. TQM
was used to solve common problems such as the difficulties associated with students
having multiple student numbers. Other TQM projects focused on market driven and
training centre processes, ergonomics in the work environment, production of
communication and promotional materials and a divisional approach to management
were used.

128
According to Knowles (1994) a full implementation of TQM resulted in a cultural
change for the entire organization. He has maintained that the introduction of TQM was
most difficult for management; particularly those at the more senior level.
2.12.2 National Studies
This section includes the research studies conducted at national level to highlight
problems faced by the national educational institutions to improve the quality and
standard of education.
(I) Iqbal (2004) has studied eight higher education institutions of higher education
to explore the problems faced by the intuitions and the efforts made to tackle these
problems. The study revealed that there was a limited access to higher education, quality
and standards were low in the areas of academics, administration, research and
equipments. The teachers needed training and professional development opportunities to
improve their skills and knowledge. The study also revealed financial mismanagement,
lack of good governance, lack of opportunities for the students’ character building, non-
existence of university-industry linkage, faulty examination system and unchecked
mushrooming of substandard private institutions.
(ii) Malik (2002) in his study has reported dissatisfaction on part of the majority
of the students, teachers and parents with teaching standard at higher education level due
to inadequate physical and research facilities, under funding, ill-equipped libraries and
laboratories.
(iii) Hameedullah (2005) has compared the public and private higher education
institutions in Pakistan with regard to the quality of staff, quality of student, and quality
of infrastructure of higher education in public and private institutions by taking the
sample of ten universities from public sector and the same number of intuitions from
private sector. The study showed that teachers in the private sector were confident and
competent as compared to the teachers in the public sector institutions. Similar in many
other aspects like quality of students, infrastructure and physical facilities including
playgrounds common rooms, cafeteria, hostels, dispensaries and transport facilities, the
private intuitions were better than the public institutions; however institutions from both
sectors have been reported weak in the area of quality management.

129
(iv) Khan (2008) has reported the implementation of TQM and ISO 9000 in
Engineering Education at National University of Science and Technology, Pakistan. ISO
9001 quality management system has been successfully implemented since 1998.
Similarly University of Engineering and Technology, Jamshoro Sindh, is another ISO
9000 certified higher education institution in Pakistan. A recent development in this
respect is the award of ISO 9001: 2008 certification to Balochistan University of
Information Technology Engineering & Management Sciences on 16th January, 2012 by
Moody International (Pvt.) Limited. However, not sufficient literature on the
implementation process, barriers and benefits of ISO 9000 in these institutions is
available.
These studies show that ISO 9000 and TQM are applicable in educational
organizations. However its implementation is not without problems. The national studies
have highlighted the sorry state of affairs prevalent in the education sector. These studies
with limited scope have depicted some aspects that need to be addressed to enhance the
quality of education. The problems surfaced during these studies were mismanagement,
lack of governance, inadequate resources, wastage of resources, no market driven
approach and no training opportunities. In order to make efficient and effective use of
resources and improve performance through proper checks and balances, a quality
management system needs to be implemented. The present study is designed with the
aimed to explore the present status of higher education regarding the implementation of
ISO 9000. The three cases of ISO 9000 implementation in higher educations institutions
in Pakistan are very encouraging signs in this respect.
2.14 Summary
The chapter was divided into three sections. The first section highlighted the
educational system of Pakistan by discussing the problems and issues faced by the higher
education system of Pakistan and the Government’s efforts to improve the higher
education. The second section discussed Total Quality Management in higher education
by tracing the evaluation of quality and TQM and explaining the different concepts
related to them. The third section provided history and development of ISO 9000, its

130
principles, its application in education and problems and benefits of the implementation
of ISO 9000 in education.
The next chapter covers the research methodology and discusses different
concepts related to research. It provides a background to the chosen research
methodology, development of the research instrument and the process of gathering data
for this research study.

131
CHAPTER 3
RESEARCH DESIGN AND METHODOLOGY
3. Introduction
The previous chapter presented an outline of education system in Pakistan with special
reference to higher education. It also discussed TQM and ISO 9000 in general and
educational perspectives. This chapter discusses research design and methodology
adopted for conducting the research study. It also explains development of research
instrument, its pilot testing and details regarding the validity and reliability of the
instrument. The chapter also gives details regarding population, sample selection and
procedures adopted for data collection. Finally, it explains how the analysis and
discussion of results were handled.
3.1 Research design.
Research design is a logical sequence that links the research questions to
empirical data to answer them. It is an action plan or blueprint for an empirical research
study and includes the main ideas of the study like research method, sample and tools
and procedures adopted for collecting and analyzing information or data (Churchill,
1995; Frankfort-Nachmias & Nachmias, 1996, Gay, 1996). Research design ensures that
study is relevant to problem under investigation and use appropriate tools and
economical procedures. Selection of a right research design depends upon the following
criteria (a) research study objectives. (b) type of information needed (c) nature of the
subjects (d) manipulation of independent variables (e) degree of researcher’s control over
the case under study (f) efforts, time and money (d) focus on contemporary or historical
phenomena. Research design in social sciences can be divided into two major groups i.e.
experimental and non-experimental, both of which can be further divided into a number
of categories. Keeping in view the wide spread of population, lack of control on variables

132
and required information based on respondents’ perceptions regarding current
phenomena, a non-experimental descriptive research design was chosen for the study.
3.1.1 Research methodology
Research methodology or methodological design refers to research tradition. It is
the philosophical justification of the method selection to be followed in the research and
method is the practical tools used for data collection, analysis and interpretation.
Research methodologies can be divided into two main types: positivistic and
phenomenological. Positivistic methodology is objective in nature and focuses on
examining phenomena to provide measured results. It aims to collect and analyze the
required data by using statistical techniques. In contrast phenomenological approach is
more subjective in nature and incorporates examining and discussing perceptions to reach
an understanding of social and human aspects. It stresses the socially constructed nature
of reality and seeks answers to questions that stress how social experience is created and
given meaning (Denzin & Lincoln, 1994). In this approach the data, chiefly non-numeric,
is collected, analyzed and interpreted by what people say and do. Both methodologies use
different tools and techniques, for collecting data to answer research questions, which are
broadly divided into two: quantitative and qualitative methods. Both methods have
strengths and weaknesses. The qualitative method allows a researcher to study the
research problem in depth and detail. Investigating a phenomenon in the field without
predetermined categories adds to the depth, openness, and richness of qualitative research
(Best & Kahn, 1999). The quantitative method, in contrast, adopts standardized
instruments with predetermined response categories which are numbered and the data
thus gathered is usually numeric. In a quantitative method a set of a small number of
structured questions are administered to a large number of respondents (Cresswell, 2003)
and the data thus collected can be statistically compared and contrasted. Moreover the
findings are clear and exact which have broad generalizability. Qualitative method, on the
other hand, gathers detailed information from a small number of respondents or cases.
The data elicited are rich and help in thorough understanding of the problem but lack in
breadth due to which the findings have low generalizability (Aaker et a1., 1995).

133
Different research methodologies are in vogue in social sciences to conduct
research like experiments, case studies, surveys, histories and the analysis of archival
information. There are many factors that affect the selection of a right research
methodology like the researcher’s epistemological standpoint, type of research questions
and focus on contemporary or historical phenomena; however, the most important are the
nature of the research questions of the study (Yin, 1994). Based on the five research
questions asked in the study and subsequent research objectives, research methodologies
of literature review and a questionnaire survey were adopted in the research study. The
rationale for adopting these mythologies is given in the following subsections.
i. Literature review
The first question “What are the current best practices and experiences of TQM
implementation in HEIs?”, fourth question: “What are the factors that contribute to the
implementation of TQM?” and seventh question “How can TQM be implemented in
HEIs?” are descriptive in nature. Descriptive study deals with existing phenomenon or
population and includes collecting data to test hypotheses or answer questions about the
current status of the subject of the study (Gay, 1996; Hussey & Hussey, 1997). It seeks to
determine the answers to 'who, what, when, where, and how' questions, and it is based on
some previous understanding of the nature of the research problem (Zikmund, 1997). The
literature review on different aspects of TQM proved useful in understanding the
concepts related to TQM, exploring critical success factors for TQM implementation,
TQM application in higher education and current trends in research and implementation
of TQM. Study of different excellence models, TQM implementation frameworks and
case studies proved very useful in developing the conceptual model for TQM
implementation in Pakistan. So the first question “What are the current best practices and
experiences of TQM implementation in higher education institutions?” fourth question:
“What are the factors that contribute to the implementation of TQM?” and seventh
question “How can TQM be successfully implemented in HEIs in Pakistan?” were
answered. Similarly the literature review on different aspects of ISO 9001 such as the
pros and cons of ISO 9001 QMS implementation in educational institutions, its suitability
in a Pakistani context and ISO 9001 and TQM compatibility helped a lot to comprehend
134
ISO 9001, how it can be implemented and also contributed to the development of TQM
framework. Moreover the literature review helped to understand the current status and the
structure of higher education and explore quality enhancement measures being taken in
education sector in Pakistan.
ii. Questionnaire survey
The second question “Do HEIs in Pakistan have effective quality assurance
processes (ISO 9001:2008) in place for the promotion and enhancement of quality of
education?” examines the existence of quality assurance processes in light of the
respondents’ perceptions. Similarly addressing the fifth question “How quality
management practices are interrelated in HEIs?” and the sixth question “How quality
management practices impact customer focus and satisfaction in HEIs?” involved
hypothesis testing. In fact, to answer such questions is to verify a theory. In general,
research is conducted either to develop a new theory or verify an existing one.
Accordingly there are two types of research approaches: research-then-theory and theory-
then-research (Frankfort-Nachmias & Nachmias, 1996). In research-then-theory approach
research is conducted to develop a theory. On the other hand theory-then-research, also
called a hypothesis-testing research, starts with a theory from which hypotheses about the
nature of the world are derived and then data are gathered that confirm or reject the
hypotheses (Frankfort-Nachmias & Nachmias, 1996; Hussey & Hussey, 1997). To
answer these questions, questionnaire survey was the most appropriate approach. For the
purpose hypotheses were developed and then data regarding the respondents’ perceptions
were collected through a questionnaire to verify these hypotheses. While answering such
questions, survey questionnaire is the most preferred option of the researchers in social
science due to some distinguished features the approach has. Compared to other methods,
survey questionnaire is economical as mail questionnaire allows the collection of a large
quantity of data from a much larger sample sizes (Aaker et al., 1995; Gay, 1996 &
Sekaran, 2003). Other advantages of the survey research are its ability of generalization,
versatility, standardization, ease of administration, and suitability for statistical analysis
(McClintock et aI., 1979; Hammersley, 1987). However questionnaire survey has some
limitations too. It has low response rate. But despite this flaw, survey research has been

135
an overwhelming choice of researchers in social science (Aaker et al., 1995). Similarly
the third question “What are the problems faced by institutions to improve the quality of
education?” was answered by collecting data through questionnaire and using descriptive
statistics.
3.1.2 Research instrument
Different methods such as questionnaire, interview, observation etc. are used to elicit
information from the respondents. Keeping in view the nature of the problem and
population questionnaire was used to collect data. Questionnaire is a set of questions
addressed to obtain reliable answers from respondents of a selected sample. It is the most
frequently used tool to collect information from or about a certain subjects through
survey (Hussey & Hussey, 1997). Gay (1996) has pointed out that questionnaires are
used to obtain information from informants who cannot be interviewed personally
because of distance or time constrains. According to Cassell and Symon (1994)
questionnaire is the preferred choice of the researchers because:
i. Questionnaire is an economical, quick and less bias data collection technique.
ii. The respondents become more open while answering questions because the
questionnaire is more anonymous than an interview.
iii. Questionnaires are a flexible way to obtain data even from a large population
or sample.
According to Sekaran (2003) questionnaires can be administered personally, mailed
to the respondents, or electronically distributed. Moreover, they have the advantages of
covering a wide geographical area in the survey and the ease with which the respondents
can complete the questionnaires in their homes at their own pace. However, she has
warned against the disadvantages associated with the mail questionnaires like low
response rate, ill-represented sample responses as a result of the low response rate, the
researcher inability, being away, to clarify the respondents’ doubts and the difficulty
faced in case of illiterate/less educated respondents. However, she has contended that
these disadvantages can be overcome by employing effective techniques like sending
follow-up letters, offering some monetary incentives, providing self-addressed, stamped
return envelopes and keeping the questionnaire as short as possible and adding pictures

136
for the less educated respondents. She maintains that in view of the low response rate
associated with the mail questionnaire, a 30% response rate is acceptable. In the next
section some guidelines regarding the design and construction of an effective
questionnaire are discussed.
3.2 Questionnaire construction
The manner in which the questions are formulated and framed is vital for
constructing a well-designed and effective questionnaire. It is difficult to achieve the
research objectives if the questionnaire is ill-constructed and mismanaged. According to
Sekaran (2003) three areas need to be focused to design an effective questionnaire. First
the wording of the questions should be according to the level of understanding of the
respondents. Second, deciding and planning of issues pertaining to measurement of the
variables as how they will be categorized, scaled, and coded after receipt of the
responses. In this respect she has suggested that wherever possible interval and ratio
scales be preferred over nominal and ordinal scales. The third aspect is related to the
general appearance of the questionnaire. She has pointed out that an attractive and neat
questionnaire with appropriate instructions, well-arrayed set of questions and response
alternatives will make it easier for the respondents to answer them. She has further
suggested that information on income and other sensitive personal data and open-ended
questions be asked toward the end of the questionnaire to avoid respondent’s bias and
allow for sufficient space for open ended questions. Gay (1996) has given the following
tips for developing an effective questionnaire:
a. Questions should be precise, brief and easy to respond
b. The questionnaire should be brief, well-managed and attractive
c. There should be a single concept in a single question
d. There should be a demographic data item for the respondent’s identity and the
population’s sub groups discussion
Best and Kahn (1999) have pointed out the following characteristics of and effective
questionnaire:
a. It deals with a significant topic
b. It seeks only that information which cannot be obtained from other sources

137
c. It is attractive in appearance, neatly arranged, and clearly duplicated or printed
d. Directions for a good questionnaire are clear and complete.
e. Important terms are defined
f. Questions are clearly worded as simply and clearly as possible.
Some of the caveats for constructing an effective questionnaire suggested by Neuman
(1997) are as follows:
1. Each question should be relevant and useful.
2. When choices are offered, they should be simple and easy to make.
3. Questions should be asked in such a way that the respondent will not find them
offensive or objectionable.
4. The items should be phrased to elicit the required depth of response.
5. Grammar and spelling should be correct.
6. The items should be stated in such a way as to avoid biased responses.
7. Key words in questions should be underlined".
Due care was taken while constructing instrument for the study. The items were
developed and framed in the light of aforementioned tips and suggestions put forward by
the renowned authors. Clear, concise and simple instructions were given for completing
the questionnaires. Five-point Likert scale was used for the items and respondents were
asked to place himself on the continuum from ‘Always =5, ‘Often = 4’, ‘Usually = 3’,
‘Sometimes = 2’ and ‘Never = 1’.
3.2.1 Research instrument development An entirely new instrument was developed for the study to obtain empirical data
from HEIs to test the hypotheses. Keeping in view the requirements of ISO 9001, the
items for the instrument were selected as a result of the literature review for the study.
Majority of the items were taken from Gozacan Borahan & Ziarati’s (2002) article. Thus
an items-bank of 143 items was created. Then these items were broadly grouped under
the headings of five sections of ISO 9001 i.e. Documentation Management, Management
Responsibility, Resource Management, Product Realization and Monitoring,
Measurement and Improvement. The items under each section were further grouped
under sub-sections as shown in the table 3.1 and APPENDIX A.

138
Table 3.1 Distribution of Questions According to Five Dimensions of ISO 9001
No. of Questions Asked
Group Variables Total
A – Documentation Management (Quality Management System) 8
1. Documentation 5
2 Record 3
B - Management Responsibility 28
1 Management Commitment 9
2 Customer Focus 7
3 Responsibility and Authority 4
4 Internal Communication 8
C - Resource Management 34
1 Financial Resources 3
2 Human Resources 8
3 Training & Development 3
4 Infrastructure 10
5 Work Environment 10
D - Product Realization 48
1 Programme Planning 6
2 Programme Design 22
3 Teaching Related Processes 8
4 Assessment Processes 7
5 Students Induction Processes 5
E - Measurement, Improvement and Analysis 26
1 Customer Satisfaction 8
2 Monitoring and Measurement of Processes 7
3 Monitoring and Measurement of Product 11
Total Questions 143 143

139
The items thus arranged were divided under the same headings into five
questionnaires for vice-chancellors, registrars, deans, teachers and students (see
APPENDIX B). The purpose was to get information from the most concerned person as
in higher education institutions no regular database is available. Also it would have been
difficult for one respondent to answer all the questions keeping in view their busy
routine. Moreover, some questions were asked from more then one respondents which
serve as a cross-check.
Majority of the questions consisted of close-ended questions and respondents
were asked to respond on 5-point Likert scale with ‘Always = 5, ‘Often = 4’, ‘Usually =
3’, ‘Sometimes = 2’ and ‘Never = 1 except the second last question where three
alternatives ‘No = 3’, ‘To Some Extent = 2’ and ‘Yes = 1’ were given. The last question
was open-ended.
3.2.2 Design of the Instrument
Each questionnaire consisted of the following parts:
a. Description
On top of the first page of each questionnaire, a short description indicating the
person the questionnaire was addressed to e.g. “QUESTIONNAIRE FOR VICE-
CHANCELLOR” and “QUESTIONNAIRE FOR REGISTRAR” etc.
b. Title
The description was followed by the title of study indicating what the study was
all about.
c. Demographic Profile
This part was included to get demographic data and ensure the respondents’
identity and the institution they belong to. The respondents were supposed to give the
following details: Name, Age (optional), Gender, Institution’s Name, Designation and
Qualifications.
d. Response rubric
Each respondent was instructed how to complete the questionnaire. The following
instructions were given:
i. Please express your opinion by ticking () the most appropriate box against
each statement

140
ii. Please make sure you have completed all items thoroughly.
e. Body of the questionnaire
This part of the questionnaire consisted of the questions asked which were
divided into groups with separate headings
f. End of the questionnaire
Before the conclusion of each questionnaire, there was a space for the
respondent’s signature followed by expression of gratitude "Thank you for completing
the questionnaire".
3.2.3 The cover letter
The cover letter is of immense importance and has a great influence on the
response rate. According to Gay (1996) every mailed questionnaire must be accompanied
by a cover letter that explains what is being asked of the respondent and why. He has
given the following tips for a response enhancer cover letter:
a. The letter should be brief, neat, and addressed specifically to the potential
responder.
b. The letter should also explain the purpose of the study, emphasizing its
importance and significance, and give the responder a good reason for
cooperating
c. The letter should state commitment to share the results of the study when
completed.
d. The letter should promise complete confidentiality to the responder as it increases
the truthfulness of responses as well as the percentage of returns.
e. Each letter should be sent, if possible, signed individually.
f. The letter should inform the responder how to return the completed questionnaire.
The act of responding should be made as painless as possible. A Stamped,
addressed, return envelope should be included for the return post.
The cover letter for the questionnaires of the study fully followed the above
suggestions. The letter was formally and clearly written. It carried information about the
research purpose and background. Being a new concept, Witcher’s (1990) concise
definition of TQM along with introduction was also given to help respondents understand

141
the concept and complete the questionnaires accordingly. Sufficient details regarding the
researcher’s identity, contacts (postal address, e-mail address and cell number) and
questionnaire return information for which a stamped and self-addressed envelope was
enclosed. The respondents were also promised, if interested, to share the results of the
study at the completion. The survey packets included a questionnaire, a cover letter and a
stamped and self-addressed envelop. (Appendices A & D)
3.2.4 Validity and Reliability of the research instrument
Best and Kahn (1999) have stated that validity is that quality of data gathering
instrument or procedure that enables it to measure what it is supposed to measure and
added that validity and reliability is very important for any data gathering procedure. For
the same reasons, Gay (1996) has argued that validation of a questionnaire is a hassle
worth doing and maintained that a questionnaire should be pretested and pilot tested as
these processes help in identifying deficiencies in the questionnaire and refine it. He has
further suggested that after constructing the questionnaire, it should be pre-tested with
two or three people and they should be asked for comments and suggestions concerning
directions, recording procedures, and specific items. The improved questionnaire, after
pretesting, should be pilot tested with a small sample from the intended population or a
highly similar population. McDaniel and Gates (1996) have suggested that before
administering the instrument it must be ensured that the instrument (a) clearly define
what is to be measured, (b) checked by experts, (c) pre-tested and (d) contain open-ended
questions to identify other items that may be included. Best and Kahn (1999) have
maintained that the content validity of the questionnaire may be established by showing
it to a panel of experts.
The questionnaire used for this study was validated in the same manner. After
initial construction, the questionnaires were shown to 5 experts. These people had
sufficient experience in teaching and knowledge of the field of Total Quality
Management and organizational studies. Two of them were professors holding PhD
degree in Engineering Management and Total Quality Management; two were assistant
professors, teaching TQM at M.B.A and B.B.A levels and another was a consultant on

142
ISO 9000 and TQM. The researcher personally held meetings and discussed the
questionnaire with these experts. The questionnaire was specially designed for pretesting
by converging the text in the middle to create more space towards the margins of the
pages for writing comments and suggestions. Similarly two extra plain pages were
attached to the questionnaire as the pretest subjects were requested to provide comments
and suggestions. After pretesting, the refined and modified questionnaire was pilot-tested
in five universities with vice-chancellors, registrar, deans, teacher s and students to
further debug it and the response was satisfactory as shown in the table 3.2.
Table 3.2 Sample Size and Response Rate for Pilot-Test
Categories
No of
Subjects
Questionnaires Response
Rate Sent Returned Discarded Used
Vice-chancellors 5
5 U
nive
rsit
ies
& D
AIs
5 3 0 3 60%
Registrars 5 5 2 0 2 40%
Deans 5 5 3 0 3 60%
Teachers 10 10 10 0 10 100%
Students 20 20 20 0 20 100%
Total 45 45 38 0 38 84.4%
As a result of pre-test and pilot test, the questionnaire was greatly improved and
refined. In the light of the feedback some questions were divided into parts. Some
questions had nominal response scale like ‘Yes’ and ‘No’ which were replaced with
Likert Scale. Similarly an open-ended question at the end of the questionnaire regarding
the types of problems faced by the higher education institutions to enhance the quality of
education at their respective institutions was modified. In the final questionnaires that
open-ended question was converted into a close-ended question by listing the problems
identified by the respondents in the pretesting and pilot testing and the respondent were
asked which of the problems from the listed ones their institutions were facing. The

143
purpose was to make questionnaire hassles free for the respondents and save their time.
Thus another open-ended question was included at the end for free feedback.
Another characteristic of good research instrument that also contributes to its
validity is reliability. Reliability refers to the degree to which an instrument or test
consistently measures whatever it measures (Gay, 1996). The methods used for
determining the reliability of an instrument are test-retest and equivalent-form methods
for stability measure and split-half and inter-items consistency reliability measure internal
consistency. Internal consistency means that the items collectively as well as
individually measure the same construct and shows the homogeneity of the items under a
construct. The techniques most frequently used for measuring inter items consistency
reliability are Cronbach Alpha for multipoint-scaled items and Kuder-Richardson
formulas (K-20 & K-21) for dichotomous items. Cronbach Alpha is an ample measure of
internal consistency reliability. (Sekaran, 2003) Reliability is expressed numerically as a
coefficient ranging for 0-1. The higher the reliability coefficient, the higher the reliability
and 1 shows the perfect reliability. (Gay, 1996) Different researchers have suggested how
high the Alpha should be. Generally 0.6 is considered to be an acceptable criterion for
scale reliability in the socials science. Cronbach alpha calculated for questionnaires for
the Vice-chancellors, the Registrar, the Dean, the Teachers and the Students were 0.958,
0.977, 0.975, 0.958 and 0.918. Details are given in APPENDIX K.
3.3 Population of the study
Population is a collection of all the elements the researcher is studying and about
which they are trying to draw conclusions (Best & Kahn, 1999, Levin & Rubin, 2000;
Sekaran, 2003) A single member of the population is called element (Sekaran, 2003).
The population of this study included all the higher education institutions
(universities and degree awarding institutions (DAIs)) running in the public sector in
Pakistan. So, all the administrative and academic heads, full time teachers and students
studying at bachelor and master level constituted the population of the study. Details of
the population are given in the table 3.3.

144
Table 3.3 Population of the Study
Higher Education Institutions
Vice-chancellors/ Heads of the
Institutes
Registrars/ Administrative
Heads
Deans/ Academic
Heads Teachers
Students (Bachelor +
Master Level) Universities DAIs
49 8 57 57 240* 10471 404379
57
Source: Statistical Booklet on Higher Education in Pakistan; HEC, 2007 * Data regarding number of Deans was collected from universities/DAIs’ websites.
3.4 Sample and sampling techniques
A sample is a collection of some but not all of the elements of the population
under study used to describe the population. It is a sub-set or segment of the population
(Levin & Rubin, 2000, Sekaran, 2003). A single member of a sample is called a subject
(Sekaran, 2003).
When the population is large, then the researcher may take a sample of the total
population and the approach is called sampling. According to Sekaran (2003) sampling is
the process of selecting a sufficient number of elements from the population, so that a
study of the sample and understanding of its properties or characteristics would enable us
to generalize such properties or characteristics to the population elements. Moreover,
studying a sample is easier than studying the whole population and costs less and takes
less time (Levin & Rubin, 2000). However, a sample must be representative and possess
the relevant characteristics of the population in the same proportions as they are present
in that population (Levin & Rubin (2000). The size of the sample should be as large as
manageable within limited time and budget (Gay, 1996).
Sampling may be random (probability) and non-random (non-probability). Best &
Kahn (1999) have argued that random is an ideal selection as every member of the
population stands an equal chance to be selected. Hussey and Hussey (1997) have
maintained that the sample should be unbiased and randomly selected.
The researcher paid due attention to all afore mentioned factors and opted for
random stratified convenience sampling to select the sample for the study.

145
Simple random sampling technique selects samples on the basis that each item in
the entire population has an equal chance of being selected for the sample (Levin &
Rubin, 2000). The sample thus collected is unbiased. The sample of higher education
institutions was selected by applying simple random sampling method.
In stratified sampling the population is divided into relatively homogeneous
groups called strata and then either a specified number of elements from each stratum
according to the proportion of that stratum in population as a whole is selected at random
or an equal number of elements from each stratum are drawn randomly and give
weightage to the results according to the stratum’s proportion of total population. In both
cases every element in the population has a chance of being selected and the strata have
due representation. This method was employed in selecting samples from the different
stakeholders of higher education i.e. the vice-chancellors, the registrars, the deans, the
teacher and the students. In case of the deans, the teachers and the students’ selection
convenience sample techniques was used. Convenience sampling is a non-probabilistic
approach in which elements are selected from the population on the basis of convenience
and their availability (Levin & Rubin, 2000). In case of deans the institutions were
requested to nominate a dean and to that dean the questionnaire was sent. These methods
were employed when selecting vice-chancellors, registrars, deans, teachers and students
representing different strata of the educational set-up.
The sample for the study consisted of 25 higher education intuitions as shown in
table 3.4, table 3.5 and APPENDIX L, with due representation from all the four provinces
and AJK, represented by 25 vice-chancellors, 25 registrars, 25 deans, 500 teachers and
1500 students. The institutions selected for pilot testing sample were not included in the
selection of final sample for the study. As the study was an academic endeavour
constrained by time and resources, the sample size was selected that was manageable
within the available time and resources (Gay, 1996).

146
Table 3.4 Region-Wise Distribution of the Sample
Region
Universities Selected
Region-Wise % Total
Islamabad Capital Territory (ICT) 02 08
Punjab 10 40
Khyber-Pukhtunkhwa 05 20 25
Sindh 04 16
Balochistan 03 12
Azad Jammu & Kashmir 01 04
3.5 Data collection procedures
Collection of data for research study is really a challenging task. This stage
arrives when the researcher has set the purpose of study, identified the population,
selected the sample and the research instrument is ready.
Before embarking on data collection spree, the following steps were conducted:
1. Different websites of the higher education institutions that were on the sample
were surfed on the internet for postal and e-mail addresses and other contact
details of people who were part of the sample.
2. The teachers were contacted in different institutions and requested them if they
can act on the researcher’s behalf and get the questionnaires completed from their
colleagues and students and thus secured their willingness for the purpose.
3. The survey packets were prepared which consisted of Stamped and Self-addressed
Envelop for return post plus a copy of the questionnaire along with the cover
letter.
4. Some packets were prepared for the teachers who had shown willingness to get
the questionnaires filled up by his/her colleagues and the students and send back
the completed questionnaires. The packet consisted of a letter of thanks and
gratitude to the teacher and a set of questionnaires for teachers and a set of

147
questionnaires for students along with a Stamped and Self-addressed Envelop for
the return of the questionnaires.
Total 245 survey packets were mailed to the participants in 25 universities and
DAIs. The researcher personally visited four universities and one DAI but was only
successful to get the questionnaires filled by the teachers and students. Vice-chancellors,
Registrars and Deans were not available or busy and asked to come next day. The
researcher visited these institutions again and again till he was granted 5 completed
questionnaires. Some of the remaining participants excused as they were too busy to have
time for questionnaire completion, others promised to send the completed questionnaire
by post. As a result of the initial mailing, 10 vice-chancellors, 7 registrar and 6 deans’
questionnaires were returned. Similarly the researcher received 18 teachers and 25
students’ questionnaire from four universities.
3.6 Follow –up procedures
The researcher selected the postal questionnaire to collect the data. The inherent
drawback of this method is low response rate. Best and Kahn (1999) have stated that mail
questionnaire is the most used and abused method of data collection. Personally
administered questionnaire helps develop rapport and the researcher may explain the
purpose of the study and clarify the meaning of the items but it is not always possible to
personally administer the questionnaire. They have stated that recipients are often slow to
return completed questionnaires. To increase the number of returns, a vigorous follow-up
procedure is necessary for which they have suggested the following measures:
a. A courteous post card reminding the recipient that the completed
questionnaire have not been sent yet.
b. A personal letter of reminder and in extreme cases a telegram, phone call or
personal visit may bring additional responses.
c. Sending another copy of letter with the follow-up letter
d. The research must keep a record of the retuned questionnaires to avoid
duplication.
The researcher was well aware of the drawback of this method. As expected the
response was low. The researcher utilized all the means to boost the response rate.

148
After waiting for three weeks, the researcher contacted the participants at their
office phone numbers as well as personal phone number where possible. Some
participants promised to complete the questionnaires as soon as possible while others had
misplaced the questionnaires and asked for another copy of the questionnaire. So they
were mailed copies of the questionnaire along with a stamped and self-addressed envelop
and a cover letter. On the other hand when the researcher contacted the teachers who
where supposed to get the questionnaires filled up by their colleagues and students were
complaining that the students were delaying returning the questionnaires and some
students got away with the questionnaires. Similarly the teachers were taking time to
complete the questionnaires as they were busy in their own academic activities. After
waiting for two to three weeks, 5 vice-chancellor, 3 registrar and 4 deans returned the
questionnaires. Similarly 20 teachers and 35 students’ questionnaire were received.
During the contact with the participants, some of them said that they did not
receive any copy of the questionnaire and maintained that they might have gone astray.
So the researcher decided to take help of the internet and electronic copies of the
questionnaires as an attachment were emailed to all those whose email addresses the
researcher had. The researcher kept on striving for getting the acceptable response rate.
As a 100% return rate would of course be the best possible result of any survey whether
the entire population or a sample is surveyed but such results are rare. According to Gay
(1996) one should not expect 100% response but one should not be satisfied with
whatever one gets after your first mailing and has cautioned that if the percentage of
return is not 70% or so, the validity of your conclusions will be weak.
The result was that the researcher received questionnaires from 25 universities
including 25 vice-chancellors, 25 registrars, 25 deans, 401 teachers and 1150 students.
Twenty-three (23) questionnaire filled by the teachers and seventy (70) students
questionnaires were rejected as being ineligible and unusable. The questionnaires used
for final analysis include 25 questionnaires from vice-chancellors, 25 from registrars, 25
from deans, 378 from teachers and 1080 from students. Total response rate was 82.3%
which was calculated by using the following formula:

149
In case of the Vice-chancellors, the Registrars, and the Deans the response rate
was 100 % while in case of the Teachers and the Students the response rate was 84.7%
and 80.4% respectively as given in table 3.5. The reason for the 100% response rate in
case of the Vice-chancellors, the Registrars and the Deans was that these officials were
easy to contact through e-mails and official telephone numbers along with meeting them
in person. However, it was after many attempts, concerted efforts and by using all
available means that this response was possible despite the respondents’ busy routine.
Table 3.5 Sample Size and Response Rate
Categories
No of
Subjects
Questionnaires Response
Rate Sent Returned Discarded Used
Vice-chancellors 25
25 U
nive
rsit
ies
& D
AIs
25 25 0 25 100%
Registrars 25 25 25 0 25 100%
Deans 25 25 25 0 25 100%
Teachers 500 500 401 23 378 84.7%
Students 1500 1500 1150 70 1080 80.4%
Total 2075 2075 1626 93 1533 82.3%
3.7 Data analysis
To determine the statistical analysis of the study, the respondents’ data were fed
into the SPSS version 18.0. SPSS is a computer statistical software program for the social
sciences. The descriptive and inferential statistics was used to analyze the data. The
descriptive statistics in this study included frequency distributions with minimum and
maximum value, means percentages, standard deviation and inferential statistics included
correlation, regression and one-way analysis of variances (ANOVA). Mean was
calculated as 3. So the variables with mean value 1-2, 2-3, 3, 3-4 and 4-5 were considered

150
to be ‘Minimum’, ‘Below Average’, ‘Average’, ‘Above Average’ and ‘Sufficiently
Above Average/Maximum’ respectively.
3.8 Limitations and hassles in data collection
There was a lack of cooperation on the part of the majority of the participants as
they thought completing the questionnaire wastage of their time.
a. The participants looked at the research as benefiting only the researcher in getting
PhD degree with no tangible benefit to them.
b. They were reluctant to share factual information and present true picture because
they thought that their responses might be used against them.
c. Quality in education is a new concept in Pakistan. The participants were not that
much familiar with the quality related concepts. Moreover, due to lack of
information and communication in higher education institutions, the participants
especially Vice-chancellors, Registrars and Deans would pass the buck to their
subordinate and asked them to fill and send rather than to gather information and
fill up the questionnaire themselves.
d. Postal services were annoying too as some of the survey packets did not reach
their destinations and vice versa.
e. Such problems impeded the pace of the research and data gathering took more
time than anticipated. However, the researcher tried to capture the true picture as
much as was possible and for that used all possible means.
3.9 Summary
The chapter provided information about the research design, methodology and
various issues regarding research. It gave a rationale for the selection of research design
and methodology for this study. It also discussed the sample selection, development of
research instrument, the method of data collection and analysis. The next chapter presents
the results of the data analyzed.

151
CHAPTER 4
DATA ANALYSIS
4. Introduction
The previous chapter discussed the research methodology chosen for this piece of
research work. This chapter is concerned with the preliminary research findings. The
chapter covers through the analysis the third, fourth, fifth, seventh and eighth objective of
the study. The demographic information presents the sample’s characteristics. The
descriptive analysis reveals the overall status of quality management practices in the
institutions selected for the study. It shows the aspects of the quality management system
where these institutions are strong and also the grey areas where the institutions are
lacking and need improvement. The correlation and multiple regression analysis were
performed to investigate the association among the critical success factors and impact of
the critical success factors on customer focus and satisfaction. Then through ANOVA the
stakeholders’ perceptions regarding critical success factors were compared and
contrasted.
4.1 Demographic Profile of the Respondents
The respondents’ demographic characteristics are summed up as: total number of
the respondents who returned eligible and usable questionnaires was 1533 which include
25 VCs, 25 deans, 25 registrars, 378 teachers and 1080 students.
Among vice-chancellors 2 (8%) were female and 23 (92%) male. Qualification-
wise VCs distribution was: 12 (48%) PhD, 6 (24%) M.Sc/M.Phil and 7 (28%) were
Master degree holders. Their average experience of holding current positions was 2.8
years (S.D = 1.8) with median 2 years, the least experience of holding current position
was 1 and the most experience in the current position was 8 years. The mean years of the
vice-chancellor’s career experience was 25 (S.D = 1.8) with median 31 years, the longest

152
career was 53 and the shortest was 3 years. The average age of the vice-chancellors was
51.1 years with (S.D = 12) and median was 57 years, the eldest was 69 years and the
youngest was 38 years.
The deans included 3 (12%) female and 22 (88%) male. Their qualification-wise
distribution was: 21(84%) PhDs and 4 (16%) had M.Sc/M.Phil qualifications. Their
average present experience of deanship was 4.6 years (S.D = 3.9) with median 3 years,
longest period as a dean was 15 and the short was 1 year. The average career experience
of the deans was 28 years (S.D = 7.5) with median 30 years, the longest career was 13
and the shortest was 40 years. The mean years of the deans’ age was 54.1 (S.D = 5.7)
with median 55 years, the eldest was 65 and the youngest was 42 years of age.
The registrars who returned usable questionnaire include 2 (8%) female and 23
(92%) male. Among the registrars 9 (36%) were PhDs, 3 (12%) M.Sc/M.Phil and 13
(52%) were Master degree holders. The mean years of the registrars’ holding present
position was 3.2 (S.D = 1.8) with median 3 years, the longest experience was 8 while the
shortest experience was 1 year. The average career experience of the registrars was 20
years (S.D = 9.6) with median 19 years, longest career was 38 and the shortest was 5
years. The means years of the registrars’ age was 46.9 (S.D = 9.5) with median 45 years,
the eldest among the registrars was 62 years of age while the youngest was 29.
. The teachers who responded were 120 (31.65%) female and 258 (68.35%) male.
Among the teachers 79 (20.89%) were PhDs, 77 (20.25%) M.Sc/M.Phils and 222
(58.86%) were Master degree holders. Academic rank-wise distribution of the teachers
was: 17 (4.43%) professors, 34 (8.86%) associate professors, 105 (27.85%) assistant
professors and 222 (58.86%) were lecturers. Teachers’ average present experience was
3.9 years (S.D = 2.8) with median 4 years, maximum teaching experience in present
position was 18 years while the minimum teaching experience was 1 year. The average of
the teachers’ entire experience in teaching was 10 years (S.D = 8.7) with median 9 years,
longest experience was 40 while the shortest was 1 year. The average age of the teachers
who participated in the survey was 35.9 years (S.D = 9.6) with median 33 years, the
eldest among the teachers was 65 years of age while the youngest was 22 years old.
The students included 435 (40.31%) female and 645 (59.69%) male studying in
different academic programmes in the sampled 25 universities during the Spring and Fall

153
session in 2007-2008. The average age of the student participants was 21.4 (S.D = 2.6)
with median 21 years, the eldest was 24 while the youngest was 18 years of age.
The percentage-wise composition of the sample was: the top management (VCs
(1.63%), deans (1.63%) and registrar (1.63%) constituted 4.89% of the total respondents
while teachers and the students were 24.66% and 70.45% respectively. For the above
information in tabular form please see APPENDIX E. The demographic information
revealed that the top management and the teachers were well qualified and had sufficient
experience.
4.2 Analysis and interpretations
This section contains the analysis of the data obtained form the survey of 25
higher education institutions running in public sector in Pakistan. The data was duly
analyzed and interpreted on construct basis. The responded answered almost all the
questions except the last two open-ended questions (Q. 76, Q77 in VC’s questionnaire, Q.
75 & Q.76 Registrar’s questionnaire, Q. 119, Q. 120 in Dean’s questionnaire, Q. 61, Q.
62 in Teachers’ questionnaire and Q. 37, Q.38 in Students’ Questionnaire) where the
respondents were encouraged to mention those problems faced by their institutions which
were not covered by the respective questionnaires; and forward suggestions for
improving the quality of education in the institutions. The reason may be that the
respondents were satisfied and convinced of the comprehensiveness of the
questionnaires.
4.2.1 Survey results of higher education institutions
Survey result of the higher education institutions include descriptive statistics
regarding ISO 9001:2008 requirements being observed in these institutions and
inferential statistics like correlation to show association among TQM critical success
factors and also among the sections of the ISO 9001, regression to show impact of critical
success factors on customer focus and satisfaction and the comparison and contrast of the
respondents’ perceptions regarding important critical success factors by using ANOVA
as shown in figure 4.1.

154
F
igur
e 4.
1 A
naly
sis
proc
ess
of th
e da
ta c
olle
cted
thro
ugh
ques
tion
nair
e su
rvey

155
4.2.1.1 Descriptive Statistics
The following tables show the survey results of 25 public sector higher education
institutions in Pakistan. The survey was carried out to explore the observance of the ISO
9001:2008 requirements. The participants’ responses were measured on 5-point Likert
Scale except the second last question in all questionnaires regarding the problems faced
by higher education institutions to enhance the quality of education where 3-point scale
was used. The results for the data analysis are summed up below:
Table 4.1 Quality Management System
Note. Never = 1, Sometime = 2, Usually = 3, Often = 4, Always = 5 1-2 = Minimum, 2-3 = Below Average, 3 = Average, 3-4 = Above Average, 4-5 = Sufficiently Above Average/Maximum (Based on Mean Value)
Quality Management System
Note. Never = 1, Sometime = 2, Usually = 3, Often = 4, Always = 5
Table 4.1 shows descriptive statistics of overall QMS of the selected public sector
universities of Pakistan. Twenty-five public sector universities were selected for all over
Pakistan. Mean value of QMS of the selected universities was found to be 3.702 which
indicates above average observance of QMS. Standard deviation was found to be 0.72
which indicates on the average respondents’ opinion regarding overall QMS at the
selected universities deviated 0.72 units form their mean value.
Descriptive Statistics
N Minimum Maximum Mean Std. Deviation
Quality Management System 25 3.00 5.00 3.702 .723
Valid N (list wise) 25
Frequency Percent Valid Percent
Cumulative
Percent
Valid Usually 10 40.0 40.0 40.0
Often 11 44.0 44.0 84.0
Always 4 16.0 16.0 100.0
Total 25 100.0 100.0

156
Lower table indicates the frequency distribution at QMS at the selected
universities. 10 universities (40%) out of 25 claims that the QMS is ‘usually’ observed
which shows average level of observance on a five point scales used to assess the QMS
for this study. Eleven universities (44%) claim the overall QMS is ‘often’ observed that is
above average level of observance on five point scales. Four universities which constitute
16% of the total universities claim to have maximum observance of over all QMS at their
campuses.
Cumulative percentage indicates that QMS in 84% of the universities is partially
observed while it has maximum observation in 16% of the selected universities.
Dimensions of QMS are explained below.
Table 4.2 Dimensions of Quality Management System N Minimum Maximum Mean Std. Deviation
Documentation Management
25 2.00 5.00 3.70 1.190
Management Responsibility 25 2.00 5.00 3.68 .707
Resource Management 25 2.00 5.00 3.67 .688
Product Realization 25 3.00 5.00 3.72 .627
Measurement, Analysis and
Improvement 25 2.00 5.00 3.74 .8525
Valid N (list wise) 25
Note. Never = 1, Sometime = 2, Usually = 3, Often = 4, Always = 5 1-2 = Minimum, 2-3 = Below Average, 3 = Average, 3-4 = Above Average, 4-5 = Sufficiently Above Average/Maximum (Based on Mean Value)
Table 4.2 elaborates the dimensions used to assess the overall QMS.
Measurement Analysis and Improvement was found to have the highest mean (3.74) that
indicates it had highest level of observance among five dimensions of Quality
management System. On the other hand Resource Management was found to have lowest
mean value i.e. 3.67. It indicates that the Resource Management has lowest level of
observance among five dimensions of quality Management System.

157
Table 4.3 Documentation Management
N Minimum Maximum Mean Std. Deviation
Documentation
Management 25 2.00 5.00 3.70 1.190
Valid N (list wise) 25
Note. Never = 1, Sometime = 2, Usually = 3, Often = 4, Always = 5 1-2 = Minimum, 2-3 = Below Average, 3 = Average, 3-4 = Above Average, 4-5 = Sufficiently Above Average/Maximum (Based on Mean Value)
Documentation Management
Frequency Percent Valid Percent Cumulative
Percent
Valid Sometimes 6 24.0 24.0 24.0
Usually 2 8.0 8.0 32.0
Often 8 32.0 32.0 64.0
Always 9 36.0 36.0 100.0
Total 25 100.0 100.0
Note. Never = 1, Sometime = 2, Usually = 3, Often = 4, Always = 5
Table 4.3 shows descriptive statistics of Documentation Management, a
dimension of Quality Management System. Twenty-five public sector universities were
selected from all over Pakistan. Mean value of Documentation Management of the
selected universities was found to be 3.70 which indicates above average observance of
Documentation Management. Standard deviation was found to be 1.19 which indicates
on the average respondents’ opinion regarding overall Documentation Management at the
selected universities deviated 1.19 units form their mean value.
Lower table indicates the frequency distribution at Documentation Management
at the selected universities. In six universities i.e. 24% of the sampled universities,
Documentation Management is ‘sometimes’ observed which is next to the lowest level on
five-point scale. Two universities (8%) out of 25 claim that the Documentation
Management is ‘usually’ observed which shows average level of observance on a five-
point scales used to assess the Documentation Management. Eight universities (32%)

158
claim that Documentation Management is ‘often’ observed that is above average level of
observance on five- point scale. Nine universities which constitute 36% of the total
universities claim maximum observance of Documentation Management at their
campuses.
Cumulative percentage indicates that Documentation Management has maximum
observance in 36% of the selected universities while in 64% of the universities they are
practiced at different levels.
Table 4.4 Management Responsibility
N Minimum Maximum Mean Std. Deviation
Management Responsibility 25 2.00 5.00 3.68 .707
Valid N (list wise) 25
Note. Never = 1, Sometime = 2, Usually = 3, Often = 4, Always = 5 1-2 = Minimum, 2-3 = Below Average, 3 = Average, 3-4 = Above Average, 4-5 = Sufficiently Above Average/Maximum (Based on Mean Value)
Management Responsibility
Frequency Percent Valid Percent Cumulative
Percent
Valid Sometimes 1 4.0 4.0 4.0
Usually 6 24.0 24.0 28.0
Often 15 60.0 60.0 88.0
Always 3 12.0 12.0 100.0
Total 25 100.0 100.0
Note. Never = 1, Sometime = 2, Usually = 3, Often = 4, Always = 5
Table 4.4 shows descriptive statistics of Management Responsibility, a dimension
of Quality Management System. Twenty-five public sector universities were selected
from all over Pakistan. Mean value of Management Responsibility of the selected
universities was found to be 3.68 which indicates above average observance of
Management Responsibility. Standard deviation was found to be 0.707 which indicates
159
on the average respondents’ opinion regarding overall Management Responsibility at the
selected universities deviated 0.707 units form their mean value.
Lower table indicates the frequency distribution at Management Responsibility at
the selected universities. In one university i.e. 4% of the sampled universities,
Management Responsibility is ‘sometimes’ observed which is next to the lowest level on
five-point scale. Six universities (24%) out of 25 claim that the Management
Responsibility is ‘usually’ observed which shows average level of observance on a five-
point scales used to assess Management Responsibility. Fifteen universities (60%) claim
that Management Responsibility is ‘often’ observed that is above average level of
observance on five- point scale. Three universities which constitute 12% of the total
universities claim maximum observance of Management Responsibility at their
campuses.
Cumulative percentage indicates that Management Responsibility has maximum
observance in 12% of the selected universities while in 88% of the universities
Management Responsibility exists at different levels.

160
Table 4.5 Resource Management
N Minimum Maximum Mean Std. Deviation
Resource Management 25 2.00 5.00 3.67 .688
Valid N (list wise) 25
Note. Never = 1, Sometime = 2, Usually = 3, Often = 4, Always = 5 1-2 = Minimum, 2-3 = Below Average, 3 = Average, 3-4 = Above Average, 4-5 = Sufficiently Above Average/Maximum (Based on Mean Value)
Resource Management
Frequency Percent Valid Percent Cumulative
Percent
Valid Sometimes 1 4.0 4.0 4.0
Usually 5 20.0 20.0 24.0
Often 16 64.0 64.0 88.0
Always 3 12.0 12.0 100.0
Total 25 100.0 100.0
Note. Never = 1, Sometime = 2, Usually = 3, Often = 4, Always = 5
Table 4.5 shows descriptive statistics of Resources Management, a dimension of
Quality Management System. Twenty-five public sector universities were selected from
all over Pakistan. Mean value of Resources Management of the selected universities was
found to be 3.67 which indicates above average observance of Resources Management.
Standard deviation was found to be 0.688 which indicates on the average respondents’
opinion regarding overall Resources Management at the selected universities deviated
0.688 units form their mean value.
Lower table indicates the frequency distribution at Resources Management at the
selected universities. In one university i.e. 4% of the sampled universities, Resources
Management is ‘sometimes’ observed which is next to the lowest level on five-point
scale. Five universities (20%) out of 25 claim that the Resources Management is ‘usually’
observed which shows average level of observance on a five-point scales used to assess
the Resources Management. Sixteen universities (64%) claim that Resources
Management is ‘often’ observed that is above average level of observance on five- point

161
scale. Three universities which constitute 12% of the total universities claim maximum
observance of Resources Management at their campuses.
Cumulative percentage indicates that Resources Management has maximum
observance in 12% of the selected universities while in 88% of the universities Resources
Management exists at different levels.
Table 4.6 Product Realization
N Minimum Maximum Mean Std. Deviation
Product Realization 25 3.00 5.00 3.72 .646
Valid N (list wise) 25
Note. Never = 1, Sometime = 2, Usually = 3, Often = 4, Always = 5 1-2 = Minimum, 2-3 = Below Average, 3 = Average, 3-4 = Above Average, 4-5 = Sufficiently Above Average/Maximum (Based on Mean Value)
Product Realization
Frequency Percent Valid Percent
Cumulative
Percent
Valid Usually 8 32.0 32.0 32.0
Often 14 56.0 56.0 88.0
Always 3 12.0 12.0 100.0
Total 25 100.0 100.0
Note. Never = 1, Sometime = 2, Usually = 3, Often = 4, Always = 5
Table 4.6 shows descriptive statistics of Product Realization, a dimension of
Quality Management System. Twenty-five public sector universities were selected from
all over Pakistan. Mean value of Product Realization of the selected universities was
found to be 3.80 which indicates above average observance of Product Realization.
Standard deviation was found to be 0.646 which indicates on the average respondents’
opinion regarding overall Product Realization at the selected universities deviated 0.646
units form their mean value.
Lower table indicates the frequency distribution at Product Realization at the
selected universities. In eight universities i.e. 32% of the sampled universities, Product

162
Realization is ‘usually’ observed which is an average level on five-point scale. Fourteen
universities (56%) out of 25 claim that the Product Realization is ‘often’ that is above
average level of observance on five- point scale. Three universities which constitute 12%
of the total universities claim maximum observance of Product Realization at their
campuses.
Cumulative percentage indicates that Product Realization has maximum
observance 12% of the selected universities while in 88% of the universities it is
practiced at different levels.
Table 4.7 Measurement, Analysis and Improvement
N Minimum Maximum Mean Std. Deviation
Measurement, Analysis
and Improvement 25 2.00 5.00 3.74 .852
Valid N (list wise) 25
Note. Never = 1, Sometime = 2, Usually = 3, Often = 4, Always = 5 1-2 = Minimum, 2-3 = Below Average, 3 = Average, 3-4 = Above Average, 4-5 = Sufficiently Above Average/Maximum (Based on Mean Value)
Measurement, Analysis and Improvement
Frequency Percent Valid Percent Cumulative
Percent
Valid Sometimes 2 8.0 8.0 8.0
Usually 8 32.0 32.0 40.0
Often 11 44.0 44.0 84.0
Always 4 16.0 16.0 100.0
Total 25 100.0 100.0
Note. Never = 1, Sometime = 2, Usually = 3, Often = 4, Always = 5
Table 4.7 shows descriptive statistics of Measurement, Analysis and
Improvement, a dimension of Quality Management System. Twenty-five public sector
universities were selected from all over Pakistan. Mean value of Measurement, Analysis
and Improvement of the selected universities was found to be 3.74 which indicates above
average observance of Measurement, Analysis and Improvement. Standard deviation was

163
found to be 0.852 which indicates on the average respondents’ opinion regarding overall
Measurement, Analysis and Improvement at the selected universities deviated 0.852 units
form their mean value.
Lower table indicates the frequency distribution at Measurement, Analysis and
Improvement at the selected universities. In two universities i.e. 8% of the sampled
universities, Measurement, Analysis and Improvement are ‘sometimes’ observed which
is next to the lowest level on five-point scale. Eight universities (32%) out of 25 claim
that the Measurement, Analysis and Improvement are ‘usually’ observed which shows
average level of observance on a five-point scales used to assess Measurement, Analysis
and Improvement. Eleven universities (44%) claim that Measurement, Analysis and
Improvement is ‘often’ observed that is above average level of observance on five- point
scale. Four universities which constitute 16% of the total universities claim maximum
observance of Measurement, Analysis and Improvement at their campuses.
Cumulative percentage indicates that Measurement, Analysis and Improvement
has maximum observance in 16% of the selected universities while in 84% of the
universities Measurement, Analysis and Improvement exists at different levels.

164
Table 4.8 Components of Documentation Management
N Minimum Maximum Mean Std. Deviation
Existence of Quality
Assurance System 25 1.00 5.00 3.72 1.748
Quality Assurance and
Control Manual 25 1.0 5.0 3.70 1.8028
Clarity Manual Procedures
and Instructions 25 1.00 5.00 3.72 1.748
Details of Students’ Learning
Activities 25 1.00 5.00 3.60 1.715
Details of Quality Assurance
and Control Staff 25 1.00 5.00 3.92 1.778
Records of Students'
Assessments 25 1.00 5.00 4.08 1.077
Records of Students Transfer
in and out of Programme 25 1.00 5.00 3.42 1.294
Relevant Statistical Data of
Students' Progression 25 2.00 5.00 3.40 1.155
Valid N (list wise) 25
Note. Never = 1, Sometime = 2, Usually = 3, Often = 4, Always = 5 1-2 = Minimum, 2-3 = Below Average, 3 = Average, 3-4 = Above Average, 4-5 = Sufficiently Above Average/Maximum (Based on Mean Value)
Table 4.8 reveals different variables/factors i.e. existence of quality management
system, quality manual, quality assurance staff and records used to assess Documentation
Management at the 25 selected universities. Record of Students’ Assessment was found
to have the highest mean (4.08) that indicates it had highest level of observance among
eight variables of Documentation Management. On the other hand Statistical Data of
Students’ Progression was found to have lowest mean value i.e. 3.40. It indicates that the
Statistical Data of Students’ Progression have lowest level of observance among the
variables of the Documentation Management.

165
Table 4.9 Components of Management Responsibility
N Minimum Maximum Mean Std. Deviation
Management Commitment 25 2.00 5.00 3.62 .57155
Students Focused Processes 25 2.00 5.00 3.36 .95219
Responsibility and
Authority 25 2.00 5.00
4.24 .87939
Internal Communication 25 2.00 5.00 3.50 .83267
Valid N (list wise) 25
Note. Never = 1, Sometime = 2, Usually = 3, Often = 4, Always = 5 1-2 = Minimum, 2-3 = Below Average, 3 = Average, 3-4 = Above Average, 4-5 = Sufficiently Above Average/Maximum (Based on Mean Value)
Table 4.9 elaborates the components used to assess Management Responsibility.
Responsibility and Authority was found to have the highest mean (4.24) that indicates it
had highest level of observance among four components of Management Responsibility.
On the other hand Students Focused processes were found to have lowest mean value i.e.
3.36. It indicates that the Students Focused processes have lowest level of observance
among four components of Management Responsibility.
Table 4.10 Components of Resource Management
N Minimum Maximum Mean Std. Deviation
Financial Resources 25 2.00 5.00 3.60 1.08012
Human Resources 25 1.00 5.00 3.56 .97125
Training and Development 25 2.00 5.00 3.46 .86987
Infrastructure 25 2.00 5.00 3.65 .73485
Work Environment 25 3.00 5.00 4.12 .72572
Valid N (list wise) 25
Note. Never = 1, Sometime = 2, Usually = 3, Often = 4, Always = 5 1-2 = Minimum, 2-3 = Below Average, 3 = Average, 3-4 = Above Average, 4-5 = Sufficiently Above Average/Maximum (Based on Mean Value)
Table 4.10 displays the components used to assess the Resource Management.
Work Environment was found to have the highest mean (4.12) that indicates it had

166
highest level of observance among five components of Resources Management. On the
other hand Training and Development was found to have lowest mean value i.e. 3.46. It
indicates that the Training and Development has the lowest level of observance among
five components of Resources Management.
Table 4.11 Components of Product Realization
N Minimum Maximum Mean Std. Deviation
Academic Programme
Planning 25 2.00 5.00 3.56 .961
Academic Programme
Design 25 3.00 5.00 3.68 .792
Teaching Processes 25 3.00 4.00 3.52 .509
Assessment Processes 25 2.00 5.00 3.62 .909
Student Induction Processes 25 2.00 5.00 4.28 .792
Valid N (list wise) 25
Note. Never = 1, Sometime = 2, Usually = 3, Often = 4, Always = 5 1-2 = Minimum, 2-3 = Below Average, 3 = Average, 3-4 = Above Average, 4-5 = Sufficiently Above Average/Maximum (Based on Mean Value)
Table 4.11 reveals the components used to assess Product Realization. Student
Induction Processes was found to have the highest and same mean (4.28) that indicates
they had the highest level of observance among five components of Product Realization.
On the other hand Teaching Related processes were found to have lowest mean value i.e.
3.52. It indicates that the Teaching Related Processes have the lowest level of observance
among five components of Product Realization.

167
Table 4.12 Components of Measurement, Analysis and Improvement
N Minimum Maximum Mean Std. Deviation
Monitoring and Measuring Students' Satisfaction Processes
25 2.00 5.00 3.70 .98658
Monitoring and Measuring Academic and Administrative Processes
25 3.00 5.00 3.60 .69041
Measuring Performance Evaluation Processes
25 2.00 5.00 3.92 .95394
Valid N (list wise) 25
Note. Never = 1, Sometime = 2, Usually = 3, Often = 4, Always = 5 1-2 = Minimum, 2-3 = Below Average, 3 = Average, 3-4 = Above Average, 4-5 = Sufficiently Above Average/Maximum (Based on Mean Value)
Table 4.12 shows the components used to assess Measurement, Analysis and
Improvement. Measuring Performance Evaluation Processes were found to have the
highest mean (3.92) that indicates it had highest level of observance among three
components of Measurement, Analysis and Improvement. On the other hand Monitoring
and Measuring Academic and Administrative Processes were found to have the lowest
mean value i.e. 3.60. It indicates that the Monitoring and Measuring Academic and
Administrative Processes have lowest level of observance among three components of
Measurement, Analysis and Improvement.

168
Table 4.13 Problems Faced by Higher Education Institutions to Enhance Quality
N Yes % To Some Extent %
No % Total %
Lack of Financial Resources
1533
43.1
39.0
17.9
100
Lack of Planning
1533
41.7
33.5
24.8
100
Lack of Quality Assurance at Feeding Colleges & Schools
1533 40.3 39.7 20.0 100
Lack of Physical Resources
1533
40.2
38.0
21.8
100
Centralized Decision-making
1533
38.7
42.1
19.2
100
Lack of Equipped Lib. & Lab.
1533
38.1
35.6
26.3
100
Lack of Communication Between Students and Administration
1533 37.9 36.9 25.2
100
Lack of Human Resources 1533 36.4 42.3 21.4 100 Politics Among Students & Teachers
1533 35.5 29.8 34.7 100
Favouritism Nepotism 1533 34.8 38.5 26.6 100
Poor Governance 1533 33.4 28.1 38.5 100 Lack of Communication Between Teachers & Administration
1533 32.6 35.3 32.1 100
Resistance to Change
1533
32.1
41.3
26.6
100
Lack of Adequate Space
1533
31.3
32.4
36.3
100
External Interference 1533 30.0 32.9 37.1 100
Lack of Incentives for Teachers’ Prof. Development
1533 29.5 41.0 29.5 100
Lack of Facilities & Poor Pay Structure
1533 27.4 35.3 37.3 100
Outdated Curriculum 1533 25.2 35.3 39.5 100
Valid N (list wise) 1533

169
Table 4.13 shows descriptive statistics regarding the problems faced by the higher
education institutions in Pakistan. The problems are rated on the ‘Yes %’ of the
participants’ responses.
a. 43.1% of the respondents believed that the institutions were facing shortage of
financial resources while 17.9% maintained that there was no lack of financial
resources. Similarly 39.0 % opined that the problem of lack of financial resources
existed to some extent.
b. 41.7% of the participants viewed that there was lack of planning at the institutions
while 24.8% maintained that there was no lack of planning at the institutions.
Moreover, 33.5 % opined that there was lack of planning to some extent at the
institutions.
c. 40.3% of the respondents believed that there was lack of quality assurance at
feeding colleges and schools which was affecting the quality of education in
higher education institutions while 20.0% maintained that lack of quality
assurance at feeding colleges and schools was not an obstacle in enhancing the
quality of education. Similarly 39.7 % opined that it was a problem to some
extent.
d. 40.2 % of the participants viewed that there was lack of physical resources which
was affecting the quality of education in the institutions while 21.8% maintained
that there was no lack of physical resources. Moreover, 38.0 % opined that the
problem of shortage of physical resources existed to some extent.
e. 38.7% of the respondents believed that the mode of decision-making was
centralized which was adversely affecting the quality of education at the
institutions while 19.2% maintained that the mode of decision-making was not
centralized. Similarly 42.1 % opined that the mode of decision –making was
centralized to some extent.
f. 38.1 % of the participants viewed that libraries and laboratories at the institutions
were not well equipped and was affecting the quality of education while 26.3%
maintained that libraries and laboratories were well equipped and this problem did
not exist. Moreover, 35.6 % opined that libraries and laboratories were not fully
equipped and was a problem to some extent.

170
g. 37.9% of the respondents believed that there was a lack of communication
between the students and the administration which was affecting the quality of
education at institutions while 25.2% maintained that lack of communication
between the students and the administration was not a problem. Similarly 36.9 %
opined that the problem existed but to some extent and not that much severe.
h. 36.4% of the respondents believed that human resources were inadequate which
was affecting the quality of education adversely while 21.4% maintained that
there was no dearth of human resources and not a problem. Similarly 42.3 %
opined that human resources were insufficient to some extent.
i. 35.5% of the respondents believed that the students and the teachers were
involved in politics and this problem was affecting the quality of education while
34.7% maintained that there was no politics among the students and the teachers.
Similarly 29.8 % opined that the problem of politics among the students and the
teachers existed to some extent.
j. 34.8% of the respondents believed that there was favouritism and nepotism in the
appointment of faculty and other staff and assigning tasks which badly affecting
the quality of education while 26.6% maintained that there was no favouritism
and nepotism as such. Similarly 38.5 % opined that the problem of favouritism
and nepotism existed to some extent.
k. 33.4% of the respondents believed that governance at the institutions was poor
and affecting the quality of education negatively while 38.5% maintained that
governance was not poor. Similarly 28.1 % opined that the governance at the
institutions was weak to some extent.
l. 32.6% of the respondents believed that there was communication gap between the
teachers and the administration and the communication was not that much
effective and frequent while 32.1% of the respondents were satisfied and
maintained that there was no lack of effective communication between the
teachers and the administration. Similarly 35.3 % opined that it was a problem to
some extent.
m. 32.1% of the respondents believed that any change for improvement of quality of
education that resulted in extra work and discipline was resisted while 26.6%

171
maintained that change was not resisted. Similarly 41.3 % opined that resistance
to change was a problem to some extent.
n. 31.3% of the respondents believed that available space and infrastructure was
inadequate which hampering the quality of education while 36.3% maintained
that the available space and infrastructure was adequate. Similarly 32.4 % opined
that lack of space was a problem to some extent.
o. 30.0% of the respondents believed that there was external interference (from
powerful people in the society and other government institutions) which had a
negative impact on the quality of education in the institution while 37.1%
maintained that no external interference was taking place. Similarly 32.9 %
opined that external interference was taking place to some extent.
p. 29.5% of the respondents believed that there were no sufficient incentives for the
teachers’ professional development while 29.5% maintained that incentives for
the teachers’ professional developments were sufficient and posed no problem for
the quality of education at the institutions. Similarly 41.0 % opined that it was a
problem to some extent.
q. 27.4% of the respondents believed that there was lack of facilities for the teachers
and remuneration was insufficient which was affecting the quality of education
while 37.3% were satisfied with the facilities and pay structure. Similarly 35.3 %
opined that it was a problem to some extent.
r. 25.2% of the respondents believed that existing curricula were outdated and they
considered it a problem in enhancing the quality of education while 39.5% opined
that the existing curricula were not outdated and hence not a barrier in enhancing
the quality of education. Similarly 35.3% believed that the existing curricula need
improvement and considered them a problem existed to some extent.

172
4.2.1.2 Inferential Statistics
Inferential statistics including correlation analysis, regression analysis and
Analysis of Variance (ANOVA) was performed to test the main and sub-hypotheses to
answer the research questions and achieve research objectives.
4.2.1.2.1 Correlation Analysis
Correlation is a statistical tool to show how two variables are related. The Pearson
Correlation Coefficient (r) measures the strength of a linear relationship/association
between two quantitative variables. For the purpose a Pearson’s correlation matrix/table
is used which indicates the direction, strength and significance of the bivariate
relationship of all the variables in the study, however, it does not establish the causation.
Causation can best be studied through a true experiment and also a longitudinal study
when variables are measured at different points in time. Correlation just explains the
association and the significance of the independent variable (Sekaran, 2003; De Vaus,
2002).
Correlation coefficient is denoted with “r” and its value ranges from -1.0 to +1.0
with 0 means no correlation. The sign of r shows the direction between two variables; if
plus sign mean unidirectional and if minus then oppositional change. If taken square of
the r can also explain the variance in one another (Sekaran, 2003; Levin & Rubin, 2000).
De Vaus (2002) has motioned the following values of Pearson’s correlation coefficient r
as a determining criterion for reporting the results: Weak/Low Correlation if r 0.01 ≤
0.29; Moderate/Medium Correlation if 0.30 < r < 0.49; Large/High Correlation if 0.50 < r
< 0.69 and Strong/Highest Correlation if r ≥ 0.70.
Correlation analysis was carried out to measure the interrelationship between
TQM construct variables based on the perception of top management, teachers and
students’ perceptions. Similarly correlation was found out among the five components/
section of ISO 9001. The results of the analysis are given in the following tables 4.14-
4.17:

173
Table 4.14 Correlation Matrix of TQM Constructs Based on Top Management’s Perceptions
Management
Commitment
Infra-
structure
Work
Environment
Teaching
Processes
Processes
Measurement
Internal
Comication
Infra-structure .425**
.000
Work
Environment
.454**
.000
.502**
.000
Teaching
Processes
.236*
.042
.463**
.000
.390**
.001
Processes
Measurement
.626**
.000
.481**
.000
.722**
.000
.412**
.000
Internal
Comication
.659**
.000
.689**
.000
.621**
.000
.273*
.018
.760**
.000
Customer Focus
and Satisfaction
.442**
.000
.518**
.000
.675
.520
.492**
.000
.383**
.001
.463**
.000
Correlation Strength: r ≥ 0.70 = Highest; 0.50 < r < 0.69 = High; 0.30 < r < 0.49 = Medium; r 0.01 ≤ 0.29 = Low
**. Correlation is significant at the 0.01 level (2-tailed).
*. Correlation is significant at the 0.05 level (2-tailed).
Upper figure in the Cell = Pearson Correlation Coefficient (r)
Lower figure in the Cell = P-value
The above table 4.14 displays the results of interrelationship between TQM
constructs as per top management’s perceptions. The table shows that all the variables
have positive correlations with one other with high significance value P = .000 and p =
.01. There is highest correlation between Processes Measurement and Internal
Communication (r =0.760, P = .000), and Process Measurement and Work Environment
(r =0.722, P = .000). Similarly High correlation has been observed between Internal
Communication and infrastructure (r =0.689, P = .000); Customer Focus and Satisfaction
and Work Environment (r =0.675, P = .000); Internal Communication and Management
Commitment (r =0.659, P = .000); Process Measurement and Management Commitment
(r =0.626, P = .000); Internal Communication and Work Environment (r =0.621, P =
.000); Customer Focus and Satisfaction Infrastructure (r =0.518, P = .000) and Work
Environment and Infrastructure (r =0.502, P = .000)Medium correlation has been

174
observed between Customer Satisfaction and Management Commitment (r =0.442, P =
.000); Customer Satisfaction and Teaching Processes (r =0.492, P = .000); Customer
Satisfaction and Process Measurement (r =0.383, P = .001); Customer Satisfaction and
Internal Communication (r =0.463, P = .000); Process Measurement and Infrastructure (r
=0.481, P = .000); Process Measurement and Teaching Processes (r =0.412, P = .000);
Teaching Processes and Infrastructure (r =0.463, P = .000); Teaching Processes and
Work Environment (r =0.390, P = .001); Work Environment and Management
Commitment (r =0.454, P = .000) and Infrastructure and Management Commitment (r
=0.425, P = .000). Low correlation has been observed between Internal Communication
and Teaching Processes (r =0.273, P = .018) and Management Commitment and
Teaching Processes (r =0.236, P = .042).
Table 4.15 Correlation Matrix of TQM Constructs Based on Teachers’ Perceptions
Documention
Management
Customer
Focus
Infra-
structure
Work
Envirment
Program
Design
Teaching
Processes
Assessment
Processes
Customer
Focus
.442**
.000
Infra-structure .304**
.000
.422**
.000
Work
Environment
.528**
.000
.625**
.000
.378**
.000
Program
Design
.651**
.000
.528**
.000
.360**
.000
.482**
.000
Teaching
Processes
.673**
.000
.559**
.000
.318**
.000
.473**
.000
.841**
.000
Assessment
Processes
.621**
.000
.368**
.000
.115
.000
.370**
.000
.771**
.000
.693**
.000
Product
Measurement
.721**
.000
.446**
.000
.235**
.000
.538**
.000
.719**
.000
.696**
.000
.767**
.000
Correlation Strength: r ≥ 0.70 = Highest; 0.50 < r < 0.69 = High; 0.30 < r < 0.49 = Medium; r 0.01 ≤ 0.29 = Low
**. Correlation is significant at the 0.01 level (2-tailed).
Upper figure in the Cell = Pearson Correlation Coefficient (r)
Lower figure in the Cell = P-value

175
The table 4.15 displays the results of interrelationship between TQM constructs as
per teachers’ perceptions. The table shows that all the variables have positive correlations
with one other with high significance value P = .000. There is highest correlation between
Product Measurement and Documentation Management (r =0.721, P = .000); Product
Measurement and Program Design (r =0.719, P = .000); Product Measurement and
Assessment Processes (r =0.767, P = .000); Assessment Processes and Program Design (r
=0.771, P = .000) and Teaching Processes and Program Design (r =0.841, P = .000). High
correlation has been observed between Product Measurement and Work Environment (r
=0.538, P = .000); Product Measurement and Teaching Processes (r =0.696, P = .000);
Assessment Processes and Documentation Management (r =0.621, P = .000); Assessment
Processes and Teaching Processes(r =0.693, P = .000); Teaching Processes and
Documentation Management(r = 0.673, P = .000); Teaching Processes and Customer
Focus and Satisfaction(r = 0.559, P = .000); Program Design and Documentation
Management (r = 0.651, P = .000); Program Design and Customer Focus and
Satisfaction(r = 0.528, P = .000); Work Environment and Documentation Management(r
= 0.528, P = .000) and Work Environment and Customer Focus and Satisfaction (r =
0.625, P = .000). Medium correlation has been observed between Product Measurement
and Customer Focus and Satisfaction (r = 0.446, P = .000); Assessment Processes and
Customer Focus and Satisfaction (r = 0.368, P = .000); Assessment Processes and Work
Environment (r = 0.370, P = .000); Teaching Processes and Infrastructure (r = 0.318, P =
.000); Teaching Processes and Work Environment (r = 0.473, P = .000); Program Design
and Infrastructure (r = 0.360, P = .000); Program Design and Work Environment (r =
0.482, P = .000); Work Environment and Infrastructure (r = 0.378, P = .000);
Infrastructure and Documentation Management (r = 0.304, P = .000); Infrastructure and
Customer Focus and Satisfaction (r = 0.422, P = .000) and Customer Focus and
Satisfaction and Documentation Management (r = 0.442, P = .000). Low correlation has
been observed between Product Management and Infrastructure (r = 0.235, P = .003) and
Assessment Processes and Infrastructure (r = 0.115, P = .015).

176
Table 4.16 Correlation Matrix of TQM Constructs Based on Students’ Perceptions
Customer
Focus
Internal
Communication Infrastructure
Program
Design
Teaching
Processes
Internal Communication .507**
.000
Infrastructure .308**
.000
.409**
.000
Program Design .490**
.000
.572**
.000
.267**
.000
Teaching Processes .579**
.000
.574**
.000
.319**
.000
.755**
.000
Assessment Processes .611**
.000
.561**
.000
.303**
.000
.682**
.000
.740**
.000
Correlation Strength: r ≥ 0.70 = Highest; 0.50 < r < 0.69 = High; 0.30 < r < 0.49 = Medium; r 0.01 ≤ 0.29 = Low
**. Correlation is significant at the 0.01 level (2-tailed).
Upper figure in the Cell = Pearson Correlation Coefficient (r)
Lower figure in the Cell = P-value
The above table 4.16 displays the results of interrelationship between TQM
constructs as per top Students’ perceptions. The table shows that all the variables have
positive correlations with one other with high significance value P = .000. There is
highest correlation between Assessment Processes and Teaching Processes (r = 0.740, P
= .000) and Teaching processes and Program Design (r = 0.755, P = .000). High
correlation has been observed between Assessment Processes and Customer Focus and
Satisfaction (r = 0.611, P = .000); Assessment Processes and Internal Communication (r
= 0.561, P = .000); Assessment Processes and Program Design (r = 0.682, P = .000);
Teaching Processes and Customer Focus and Satisfaction (r = 0.579, P = .000); Teaching
Processes and Internal Communication (r = 0.574, P = .000); Program Design and
Internal Communication (r = 0.572, P = .000) and Internal Communication and Customer
Focus and Satisfaction (r = 0.507, P = .000). Medium correlation has been observed
between Assessment Processes and Infrastructure (r = 0.3030, P = .000); Teaching
Processes and Infrastructure (r = 0.319, P = .000); Program Design and Customer Focus

177
and Satisfaction (r = 0.490, P = .000); Infrastructure and Customer Focus and Satisfaction
(r = 0.308, P = .000); Infrastructure and Internal Communication (r = 0.409, P = .000).
Low correlation has been observed between Program Design and Infrastructure (r =
0.267, P = .000).
Table 4.17 Correlation Matrix of five components of ISO 9001
Documentation
Mgt
Mgt
Responsibility
Resource
Mgt Product Realization
Mgt Responsibility .779**
.000
Resource Mgt .718**
.000
.693**
.000
Product Realization .676**
.000
.705**
.000
.700**
.000
Measurement Analysis
& Improvement
.695**
.000
.699**
.000
.636**
.000
.879**
.000
Correlation Strength: r ≥ 0.70 = Highest; 0.50 < r < 0.69 = High; 0.30 < r < 0.49 = Medium; r 0.01 ≤ 0.29 = Low
**. Correlation is significant at the 0.01 level (2-tailed).
Upper figure in the Cell = Pearson Correlation Coefficient (r)
Lower figure in the Cell = P-value
The above table 4.17 displays the results of interrelationship between ISO 9001
main sections. The table shows that all the variables have positive correlations with one
other at high significance value P = .000 and p = .01. There is highest correlation between
Measurement Analysis and Improvement and Product Realization (r = 0.879, P = .000);
Product Realization and Management Responsibility (r = 0.705, P = .000); Product
Realization and Resource Management (r = 0.700, P = .000); Resource Management and
Documentation Management (r = 0.718, P = .000) and Management Responsibility and
Documentation Management (r = 0.779, P = .000); High correlation has been observed
between Measurement Analysis and Improvement and Documentation Management (r =
0.695, P = .000); Measurement Analysis and Improvement and Management
Responsibility (r = 0.699, P = .000); Measurement Analysis and Improvement and

178
Resource Management (r = 0.636, P = .000); Product Realization and Documentation
Management (r = 0.676, P = .000) and Resource Management and Management
Responsibility (r = 0.693, P = .000).
4.2.1.2.2 Multiple Regression Analysis
Correlation coefficient r shows the strength of relationship between two variables,
however, it does not explain the variance/effect on the dependent or criterion variable
when several independent variables are hypothesized to affect it simultaneously. In order
to explain the variance in the dependent variable regression analysis is done. For the
purpose several independent variables or predictors are regressed against dependent
variable to compute multiple r or multiple correlation and then the square of multiple r,
R-square or R2 explains the variance in the dependent variable in percentage (%).
The multiple regression analysis provides the following information:
a. the amount of variability in the dependent variable accounted for by
independent variables is inferred from Squared multiple R value,
b. which predictors are significant is explained by t-values (p < 0.05)
c. whether the model as a whole viable is explained by significance F-ratio (p
< 0.05)
Once the values of the constant and regression coefficients (b) are known, raw score regression model equation can be computed.
Y = Constant + b1 X1 + b2 X2 + b3 X3 + b4 X4 + ………bn Xn Where Y is dependent variable and X represents independent variables. In this study three multiple linear regression models, as per the
stakeholders of higher education i.e. top management, the teachers and the students were
developed for quality parameter i.e. customer focus and satisfaction using different
independent quality management constructs and applying stepwise method. For each
regression model, first regression coefficients and constant along with t-value are
calculated to develop the model equation, second ANOVA is done to analyze the
performance of the model and lastly R-square (R2) is calculated to determine the
percentage of variation accounted for by the predictors in the model.

179
a. Multiple Linear Regression Model - 1 for Customer Focus and Satisfaction
Based on Top Management’s Perceptions
Multiple linear regression analysis was performed applying stepwise method to
measure the relationship of independent variables including management commitment,
internal communication, infrastructure, work environment, Responsibility and authority,
Training and Development, Process management and teaching processes with a
dependent variable i.e. customer focus and satisfaction. Details of the most significant
model is given below and for excluded variables and models see APPENDIX F
i. Parameter Estimates of Customer Focus and Satisfaction
Computed parameter estimates for the customer focus and satisfaction using step-
wise method are given in the following table 4.18:
Table 4.18 Customer Focus and Satisfaction Model - 1 Estimates as per Top Management’s Perceptions
Model Unstandardized
Coefficients Standardized Coefficients t Sig.
B Std. Error Beta (β)
Cus
tom
er F
ocus
an
d S
atis
fact
ion
(Constant) .650 .709 .916 .363
Infrastructure .391 .192 .242 2.041 .045
Teaching Processes .793 .167 .439 4.750 .000
Work Environment .863 .165 .550 5.240 .000
Internal Communication .475 .192 .350 2.467 .016
Management Commitment .441 .182 .255 2.423 .018
The following model equation was established based on the statistical analysis:
CFS = 0.650 + 0.391 INFRA + 0.793 TP + 0.863 WE + 0.475 IC + 0.441 MC
Where CFS = Customer Focus and Satisfaction; INFRA = Infrastructure; TP = Teaching Processes; WE = Work Environment; IC = Internal Communication; MC = Management Commitment
The above table 4.18 shows a significant relationship between the dependent
variable i.e. customer focus and satisfaction and all the five independent variables. All
five factors contribute positive coefficients in defining the regression model for customer

180
focus and satisfaction. This shows that a high level of adoption and implementation of
each factor would result in increase of customer focus and satisfaction. Among the
predictors, work environment (WE) is contributing highest with 0.863 followed by
teaching processes, internal communication, management commitment and infrastructure
with regression coefficient values of 0.793, 0.475, 0.441 and 0.391 respectively at P <
0.05 in defining the customer focus and satisfaction in the universities.
ii. ANOVA of Customer Focus and Satisfaction Model - 1
ANOVA was performed to test the significance of the model. The results of
ANOVA are given in Table 4.19.
Table 4.19 ANOVA of Customer Focus and Satisfaction Model - 1
Model Sum of Squares df Mean Square F Sig.
Customer Focus and Satisfaction
Regression 49.167 5 9.833
Residual 36.388 69 .527 18.646 .000 Total 85.555 74
Table 4.19 shows that the model is highly significant as ANOVA p=0.000 at level of
0.01.
iii. Summary of Customer Focus and Satisfaction Model - 1
A regression model summary consists of multiple correlation coefficient (R),
multiple regression coefficient (R2) Adjusted R Square and Standard Error of the
Estimate. The summary of customer focus and satisfaction is given in the following table
4.20.

181
Table 4.20 Summary of Customer Focus and Satisfaction Model -1
Model R R Square Adjusted R Square Std. Error of the Estimate
Customer Focus and
Satisfaction .758 .575 .544 .726
The above table 4.20 shows Customer Focus and Satisfaction model has R Square
(R2) value 0.575 which means that 58% of the variance in Customer Focus and
Satisfaction has been significantly accounted for by the five independent variables in the
model. High Adjusted R-Squared value > 0.50 also shows that the model is significant.
The standard Error of Estimate is 0.726 which shows that the observed data was not far
away from the estimated line and the model is justified.
b. 2. Multiple Linear Regression Model - 2 for Customer Focus and Satisfaction
Based on Teachers’ Perceptions
Multiple linear regression model was used to measure the relationship of a set of
independent/regressor variables including work environment, teaching processes,
infrastructure, assessment processes, monitoring and measurement of product, program
design and documentation management with a dependent variable i.e. Customer Focus
and Satisfaction. Stepwise method was applied. Details of the most significant model is
given below and for excluded variables and models see APPENDIX G
i. Parameter Estimates of Customer Focus and Satisfaction
Parameter estimates for the Customer Focus and Satisfaction using step-wise
method are given in the following table 4.21:

182
Table 4.21 Customer Focus and Satisfaction Model - 2 Estimates as per Teachers’ Perceptions
Model Unstandardized
Coefficients Standardized Coefficients t Sig.
B Std. Error Beta (β)
Cus
tom
er
Foc
us a
nd
Sat
isfa
ctio
n (Constant) .394 .235 1.675 .096
Work Environment .516 .083 .416 6.206 .000 Teaching Processes .296 .063 .310 4.731 .000 Infrastructure .177 .066 .167 2.679 .008
The model equation was established based on the empirical results obtained:
CFS = 0.394 + 0.516 WE + 0.296 TP + 0.177 INFRA Where CFS = Customer Focus and Satisfaction; WE = Work Environment; TP = Teaching Processes; INFRA = Infrastructure
The above table 4.21 shows a significant relationship between the dependent
variable i.e. Customer Focus and Satisfaction and all the three independent variables. All
three factors contribute positive coefficients in defining the regression model for
Customer Focus and Satisfaction. This shows that a high level of adoption and
implementation of each factor would result in increase of Customer Focus and
Satisfaction. Among the predictors, Work Environment (WE) is contributing highest with
0.516 followed by Teaching Processes and Infrastructure with regression coefficient
values of 0.296 and 0.177 respectively at P < 0.05 in defining the Customer Focus and
Satisfaction at the universities.
ii. ANOVA of Customer Focus and Satisfaction Model - 2
ANOVA was performed to test the significance of the model. The results are
displayed in table 4.22.

183
Table 4.22 ANOVA of Customer Focus and Satisfaction Model - 2
Model Sum of Squares df Mean Square F Sig.
Customer Focus and Satisfaction
Regression 63.224 3 21.075
Residual 62.408 154 .405 52.005 .000
Total 125.633 157
Table 4.22 shows that the model is highly significant p=0.000 at level 0.01.
iii. Summary of Customer Focus and Satisfaction Model - 2
A regression model summary consists of multiple correlation coefficient (R), multiple
regression coefficient (R2) Adjusted R Square and Standard Error of the Estimate. The
summary of Customer Focus and Satisfaction is given in the following table 4.23.
Table 4.23 Summary of Customer Focus and Satisfaction Model - 2
Model R R Square Adjusted R Square Std. Error of the Estimate
Customer Focus
and Satisfaction .709 .503 .494 .637
The above table 4.23 shows Customer Focus and Satisfaction model - 2 has R
Square (R2) value 0.503 which means that 50% of the variance in Customer Focus and
Satisfaction has been significantly accounted for by the three independent variables i.e.
Work Environment, Teaching Processes and Infrastructure. Adjusted R-Squared value
also shows that the model is significant. The standard Error of Estimate is 0.637 which
shows that the observed data was not far away from the estimated line and the model is
justified.

184
c. Multiple Linear Regression Model - 3 for Customer Focus and Satisfaction
Based on Students’ Perceptions
Multiple linear regression stepwise method was applied to measure the
relationship of independent variables including internal communication, infrastructure,
program design, teaching processes and Assessment processes with a dependent variable
i.e. customer focus and satisfaction. Details of the most significant model are given below
and for excluded variables and models see APPENDIX H.
i. Parameter Estimates of Customer Focus and Satisfaction
Parameter estimates for the Customer Focus and Satisfaction using step-wise
method are given in the following table 4.24:
Table 4.24 Customer Focus and Satisfaction Model - 3 Estimates as per Students’ Perceptions
Model Unstandardized
Coefficients Standardized Coefficients t Sig.
B Std. Error Beta (β)
Cus
tom
er
Foc
us a
nd
Sat
isfa
ctio
n
(Constant) .385 .129 2.988 .003 Assessment Processes
.292 .050 .348 5.883 .000
Intrl. Communication .161 .041 .191 3.923 .000
Teaching Processes .200 .056 .212 3.544 .000
The prediction equation was established based on the statistical analysis:
CFS = 0.385 + 0.292 AP + 0.161 IC + 0.200 TP Where CFS = Customer Focus and Satisfaction; AP = Assessment Processes; IC = Internal Communication; TP = Teaching Processes
The above table 4.24 shows a significant relationship between the dependent
variable i.e. Customer Focus and Satisfaction and three independent variables. All three
factors contribute positive coefficients in defining the regression model for Customer
Focus and Satisfaction. This shows that a high level of adoption and implementation of

185
each factor would result in increase of Customer Focus and Satisfaction. Among these
predictors, Assessment Processes (AP) is contributing highest with 0.292 followed by
Teaching Processes and Internal Communication with regression coefficient values of
0.200 and 0.161 respectively at P < 0.05 in defining the Customer Focus and Satisfaction
in the universities.
b. ANOVA of Customer Focus and Satisfaction Model - 3
ANOVA was performed to test the significance of the model. The results are
displayed in Table 4.25.
Table 4.25 ANOVA of Customer Focus and Satisfaction Model - 3
Model Sum of Squares df Mean Square F Sig. Customer Focus and Satisfaction
Regression 96.116 3 32.039 Residual 126.493 383 .330 97.007 .000 Total 222.609 386
Table 4.25 shows that the model is highly significant as p=000 which at the level of 0.01.
c. Summary of Customer Focus and Satisfaction Model - 3
A regression model - 3 summary consists of multiple correlation coefficient (R), multiple
regression coefficient (R2) Adjusted R Square and Standard Error of the Estimate. The
summary of Customer Focus and Satisfaction is given in the following table 4.26.
Table 4.26 Summary of Customer Focus and Satisfaction Model - 3
Model R R Square Adjusted R Square Std. Error of the Estimate
Customer Focus and Satisfaction
.657 .432 .427 .575
The table 4.26 shows Customer Focus and Satisfaction model - 3 has R Square
(R2) value 0.432 which means that 43% of the variance in Customer Focus and

186
Satisfaction has been significantly accounted for by the three independent variables i.e.
Assessment Processes, internal Communication and Teaching processes. Adjusted R-
Squared value .43 also shows that the model is significant. The standard Error of
Estimate is 0.575 which shows that the observed data was not far away from the
estimated line and the model is justified. Summary of the three models is given in the
following figure 4.2
Figure 4.2 Summary of the regression models (1-3)

187
4.2.1.2.3 Analysis of Variance (ANOVA) H05A There is no significant difference regarding Documentation Management as
perceived by the Top Management.
Table 4.27 Top Management’s Perception Regarding Documentation Management
Sum of
Squares df
Mean
Square F Sig.
Top Management -
Documentation
Management
Between Groups 11.492 2 5.746
4.720 .012 Within Groups 87.657 72 1.217
Total 99.149 74
Note. P < .05
Table 4.27 explains that F value (4.720) is significant at .05 level of significance,
so the null hypothesis that: there is no significant difference regarding Documentation
Management as perceived by the Top Management is rejected and it is concluded that
there is a significant difference regarding Documentation management in the universities.
Descriptive statistics are given in APPENDIX I and Table I1.

188
H05B There is no significant difference regarding Documentation Management among
the universities as perceived by the Teachers.
Table 4.28 Teachers' Perceptions Regarding Documentation Management
Sum of
Squares df
Mean
Square F Sig.
Teachers –
Documentation
Management
Between Groups 60.779 24 3.199
4.196 .000 Within Groups 305.215 353 .762
Total 365.994 377
Note. P < .05
Table 4.28 explains that F value (4.196) is significant at .05 level of significance,
so the null hypothesis that: there is no significant difference regarding Documentation
Management among the universities as perceived by the Teachers is rejected and it is
concluded that there is a significant difference regarding Documentation Management
among the universities. See APPENDIX I and Table I8 for descriptive statistics.

189
H06A
There is no significant difference regarding Management Commitment as
perceived by the Top Management.
Table 4.29 Top Management’s Perception Regarding Management Commitment
Sum of
Squares df
Mean
Square F Sig.
Top Management –
Management
Commitment
Between Groups .138 2 .069
.174 .840 Within Groups 28.493 72 .396
Total 28.631 74
Note. P < .05
Table 4.29 explains that F value (0.174) is not significant at 0.05 level of
significance, so the null hypothesis that “there is no significant difference regarding
Management Commitment as perceived by the Top Management” is accepted and it is
concluded that there is no significant difference regarding Management Commitment in
the universities. Descriptive statistics are given in APPENDIX I and Table I2.

190
H07A There is no significant difference regarding Customer Focus and Satisfaction
as perceived by the Top Management.
Table 4.30 Top Management’s Perception Regarding Customer Focus and Satisfaction
Sum of
Squares df
Mean
Square F Sig.
Top Management –
Customer Focus &
Satisfaction
Between Groups 6.761 2 3.380
4.726 .012 Within Groups 51.497 72 .715
Total 58.258 74
Note. P < .05
Table 4.30 explains that F value (4.726) is significant at .05 level of significance,
so the null hypothesis that: there is no significant difference regarding Customer Focus
and Satisfaction as perceived by the Top Management is rejected and it is concluded that
there is a significant difference regarding Customer Focus and Satisfaction in the
universities. See APPENDIX I and Table I3 for descriptive statistics.

191
H07B There is no significant difference regarding Customer Focus and Satisfaction
among the universities as perceived by the Teachers.
Table 4.31 Teachers' Perceptions Regarding Customer Focus and Satisfaction
Sum of
Squares df
Mean
Square F Sig.
Teachers –
Customer Focus
& Satisfaction
Between Groups 30.484 24 1.604
2.325 .003 Within Groups 95.232 353 .690
Total 125.716 377
Note. P < .05
Table 4.31 explains that F value (2.325) is significant at .05 level of significance,
so the null hypothesis that: there is no significant difference regarding Customer Focus
and Satisfaction among the universities as perceived by the Teachers is rejected and it is
concluded that there is a significant difference regarding Customer Focus and
Satisfaction among the universities. Descriptive statistics are given in APPENDIX I and
Table I9.

192
H07C There is no significant difference regarding Customer Focus & Satisfaction
among the universities as perceived by the Students.
Table 4.32 Students' Perceptions Regarding Customer Focus and Satisfaction
Sum of
Squares df
Mean
Square F Sig.
Students –
Customer Focus
& Satisfaction
Between Groups 40.986 24 2.157
4.359 .000 Within Groups 181.623 1055 .495
Total 222.609 1079
Note. P < .05
Table 4.32 explains that f value (4.359) is significant at .05 level of significance,
so the null hypothesis that: there is no significant difference regarding customer focus
and satisfaction among the universities as perceived by the Students is rejected and it is
concluded that there is a significant difference regarding customer focus among the
universities. Descriptive statistics are given in APPENDIX I and Table I14.

193
H08A There is no significant difference regarding Internal Communication as
perceived by the Top Management.
Table 4.33 Top Management’s Perceptions Regarding Internal Communication
Sum of
Squares df
Mean
Square F Sig.
Top Management -
Internal Communication
Between Groups .840 2 .420
.344 .710 Within Groups 87.826 72 1.220
Total 88.667 74
Note. P < .05
Table 4.33 explains that F value (0.344) is not significant at .05 level of
significance, so the null hypothesis that: there is no significant difference regarding
internal communication in the universities as perceived by the Top Management is
accepted and it is concluded that there is no significant difference regarding internal
communication in the universities. See APPENDIX I and Table I4 for descriptive
statistics.

194
H08B There is no significant difference regarding Internal Communication among
the universities as perceived by the Students.
Table 4.34 Students' Perceptions Regarding Internal Communication
Sum of
Squares df
Mean
Square F Sig.
Students – Internal
Communication
Between Groups 37.695 24 1.984
2.646 .000 Within Groups 275.225 1055 .750
Total 312.920 1079
Note. P < .05
Table 4.34 explains that F value (2.646) is significant at .05 level of significance,
so the null hypothesis that: there is no significant difference regarding internal
communication among the universities as perceived by the Students is rejected and it is
concluded that there is a significant difference regarding internal communication among
the universities. Descriptive statistics are given in APPENDIX I and Table I15.

195
H09A There is no significant difference regarding Infrastructure as perceived by the Top
Management.
Table 4.35 Top Management’s Perceptions Regarding Infrastructure
Sum of
Squares df
Mean
Square F Sig.
Top Management -
Infrastructure
Between Groups 4.214 2 2.107
5.136 .008 Within Groups 29.540 72 .410
Total 33.755 74
Note. P < .05
Table 4.35 explains that F value (5.136) is significant at .05 level of significance,
so the null hypothesis that: there is no significant difference regarding infrastructure in
the universities as perceived by the Top Management is rejected and it is concluded that
there is a significant difference regarding infrastructure in the universities. See
APPENDIX I and Table I5 for descriptive statistics.

196
H09B There is no significant difference regarding Infrastructure among the
universities as perceived by the Teachers.
Table 4.36 Teachers' Perceptions Regarding Infrastructure
Sum of
Squares df
Mean
Square F Sig.
Teachers -
Infrastructure
Between Groups 56.934 24 2.997
7.595 .000
Within Groups 54.447 353 .395
Total 111.382 377
Note. P < .05
Table 4.36 explains that F value (7.595) is significant at .05 level of significance,
so the null hypothesis that: there is no significant difference regarding infrastructure
among the universities as perceived by the Teachers is rejected and it is concluded that
there is a significant difference regarding infrastructure among universities. Descriptive
statistics are given in APPENDIX I and Table I10.

197
H09C There is no significant difference regarding Infrastructure among the universities
as perceived by the Students.
Table 4.37 Students' Perceptions Regarding Infrastructure
Sum of
Squares df
Mean
Square F Sig.
Students –
Infrastructure
Between Groups 31.674 24 1.667
9.090 .000 Within Groups 67.305 1055 .183
Total 98.979 1079
Note. P < .05
Table 4.37 explains that F value (9.090) is significant at .05 level of significance,
so the null hypothesis that: there is no significant difference regarding infrastructure
among the universities as perceived by the Students is rejected and it is concluded that
there is a significant difference regarding infrastructure among the universities. See
APPENDIX I and Table I16 for descriptive statistics.

198
H010A There is no significant difference regarding Work Environment as perceived
by the Top Management.
Table 4.38 Top Management’s Perception Regarding Work Environment
Sum of
Squares df
Mean
Square F Sig.
Top Management –
Work Environment
Between Groups 10.763 2 5.381
9.265 .000 Within Groups 41.820 72 .581
Total 52.583 74
Note. P < .05
Table 4.38 explains that F value (9.265) is significant at .05 level of significance,
so the null hypothesis that: there is no significant difference regarding Work
Environment in the universities as perceived by the Top Management is rejected and it is
concluded that there is significant difference regarding Work Environment in the
universities. Descriptive statistics are given in APPENDIX I and Table I6.

199
H010B There is no significant difference regarding Work Environment among the
universities as perceived by the Teachers.
Table 4.39 Teachers' Perceptions Regarding Work Environment
Sum of
Squares df
Mean
Square F Sig.
Teachers – Work
Environment
Between Groups 41.555 24 2.187
7.538 .000 Within Groups 40.037 353 .290
Total 81.592 377
Note. P < .05
Table 4.39 explains that F value (7.538) is significant at .05 level of significance,
so the null hypothesis that: there is no significant difference regarding work environment
among universities as perceived by the Teachers is rejected and it is concluded that there
is a significant difference regarding work environment among universities. Descriptive
statistics are given in APPENDIX I and Table I11.

200
H011A There is no significant difference regarding Teaching Processes as perceived
by the Top Management.
Table 4.40 Top Management’s Perception Regarding Teaching Processes
Sum of
Squares df
Mean
Square F Sig.
Top Management -
Teaching Processes
Between Groups 1.892 2 .946
4.646 .013 Within Groups 14.660 72 .204
Total 16.552 74
Note. P < .05
Table 4.40 explains that F value (4.646) is significant at .05 level of significance, so the
null hypothesis that: there is no significant difference regarding Teaching Processes in
the universities as perceived by the Top Management is rejected and it is concluded that
there is a significant difference regarding Teaching Processes in the universities.
Descriptive statistics are given in APPENDIX I and Table I7.

201
H011B There is no significant difference regarding Teaching Processes among the
universities as perceived by the Teachers.
Table 4.41 Teachers' Perceptions Regarding Teaching Processes
Sum of
Squares df
Mean
Square F Sig.
Teachers -
Teaching
Processes
Between Groups 46.588 24 2.452
3.735 .000 Within Groups 90.588 353 .656
Total 137.176 377
Note. P < .05
Table 4.41 explains that F value (3.735) is significant at .05 level of significance,
so the null hypothesis that: there is no significant difference regarding Teaching
Processes among the universities as perceived by the Teachers is rejected and it is
concluded that there is a significant difference regarding Teaching Processes among the
universities. Descriptive statistics are given in APPENDIX I and Table I12.

202
H011C There is no significant difference regarding Teaching Processes among the
universities as perceived by the Students.
Table 4.42 Students' Perceptions Regarding Teaching Processes
Sum of
Squares df
Mean
Square F Sig.
Students –
Teaching
Processes
Between Groups 56.585 24 2.978
5.623 .000 Within Groups 194.363 1055 .530
Total 250.947 1079
Note. P < .05
Table 4.42 explains that F value (5.623) is significant at .05 level of significance,
so the null hypothesis that: there is no significant difference regarding Teaching
Processes among the universities as perceived by the Students is rejected and it is
concluded that there is a significant difference regarding Teaching Processes among the
universities. See APPENDIX I and Table I17 for descriptive statistics.

203
H012A There is no significant difference regarding Assessment Processes among the
universities as perceived by the Teachers.
Table 4.43 Teachers' Perceptions Regarding Assessment Processes
Sum of
Squares df
Mean
Square F Sig.
Teachers –
Assessment Processes
Between Groups 54.692 24 2.879
3.791 .000 Within Groups 104.772 353 .759
Total 159.464 377
Note. P < .05
Table 4.43 explains that F value (3.791) is significant at .05 level of significance,
so the null hypothesis that: there is no significant difference regarding Assessment
Processes among the universities as perceived by the Teachers is rejected and it is
concluded that there is a significant difference regarding Assessment Processes among
the universities. Descriptive statistics are given in APPENDIX I and Table I13.

204
H012B There is no significant difference regarding Assessment Processes among the
universities as perceived by the Students.
Table 4.44 Students' Perceptions Regarding Assessment Processes
Sum of
Squares df
Mean
Square F Sig.
Students –
Assessment
Processes
Between Groups 62.215 24 3.274
4.728 .000 Within Groups 254.169 1055 .693
Total 316.384 1079
Note. P < .05
Table 4.44 explains that f value (4.728) is significant at .05 level of significance,
so the null hypothesis that: there is no significant difference regarding Assessment
Processes among universities as perceived by the Students is rejected and it is concluded
that there is a significant difference regarding Assessment Processes among the
universities. Descriptive statistics are given in APPENDIX I and Table I18.

205
CHAPTER 5
FINDINGS, CONCLUSIONS AND RECOMMENDATIONS
5. Introduction
After analyzing the data in the last chapter, this chapter highlights the major
findings of the study and gives a better understanding of the quality in education and
issues related to quality in higher education institutions in Pakistan. The chapter also
contains conclusions based on the findings of the study and discusses limitations of the
study. The researcher puts forward the proposed conceptual framework for the
implementation of Total Quality Management in higher education institutions and
suggests recommendations for further research to assist the future researchers.
5.1 Summary
The two main objectives of the research study were to investigate the level
implementation of quality management practices and propose a TQM implementation
framework for public sector universities in Pakistan. Besides, other supporting
objectives of the study were to highlight and explain the importance TQM and ISO
9000 and their implementation in education, to explore critical success factor for TQM
implementation, to investigate the influence o TQM construct variables on Customer
Focus and Satisfaction, the ultimate aim of TQM, and their impact on each other and
also to unearth the problems faced by higher education institution to enhance the quality
of education. In order to achieve these objectives a comprehensive research study was
conducted.

206
A self-reporting survey research design was chosen for the study. The survey
questionnaires were based on the requirements of ISO 9001:2008 representing the five
dimensions/sections of the quality management system according to the standards.
These dimensions were Documentation Management, Management Responsibility,
Resource Management, Product Realization and Measurement, Analysis and
Improvement as shown in the figure 5.1. Of these dimensions, Resource Management
and Management Responsibility had the smallest mean value (see table 4.2) which
indicated that higher education institutions are weak in these areas which are important
dimensions of the management system and must be observed fully.
3.62
3.64
3.66
3.68
3.7
3.72
3.74
Documentation Mgt.
Mgt. Responsibility
Resource Mgt.Product
RealizationMeas. Analysis
n Imprv.
Figure 5.1. Five dimensions of ISO 9001 as observed at higher education institutions
The study covered different aspects of TQM i.e. adoption, implementation and
implication through extensive literature review and empirical study. The first chapter
contained background information to the research problem, research questions,
hypotheses and research objectives and brief introduction to research methodology. The
second chapter covered higher education in Pakistan, TQM fundamentals and other
related concepts. Issues related to TQM in general and in education were also
highlighted in this chapter. The second chapter also documented critical success factors
and various models and frameworks of TQM implementation. Chapter three gave the
details of the research design and methodology while chapter four covered data analysis.
Finally the chapter five provided findings of the study, conclusions, limitations of the
study, recommendations for future research and the proposed TQM framework.

207
The study found that the organizational experiences of TQM implementation in
education sector in Pakistan are far from being mature as is shown in figure 5.2. The
survey results revealed that TQM is still a new management concept, and is widely
unknown.
Figure 5.1. A snapshot of quality management practices at surveyed HEIs
The study has made significant contributions to research and knowledge regarding
TQM. TQM is a new concept of management in Pakistan. Research into TQM is sparse
and fragmented. The study is a step towards contributing to the body of knowledge
regarding TQM as it has brought together a large body of relevant literature and unified
different thoughts into one integrative perspective.
The concept of TQM is at a developmental stage and evolving in different
dimensions of contexts, principles and philosophy. Emerged in the corporate world, it has
extended its tentacles to other sectors with the passage of time. Adoption of TQM in
educations is an important development. Many educational institutions have made
remarkable improvements by integrating TQM concepts and principles in their
management affairs. The research study provides new theoretical grounds for studying the
concept of TQM in education and presents a framework for TQM implementation in
higher education institutions. The study assessed the level of preparedness of higher
education institutions with respect to ISO 9001: 2008 which is considered to be the
stepping stone to TQM. The study revealed that import critical success factors for TQM
implementation were, inter alia, management commitment, internal Communication, Work
3.6
3.65
3.7
3.75
Documentation Management
Management Responsibility
Resource Management
Product Realization
Measurement Analysis & Improvement

208
Environment, Infrastructure, Teaching Processes and Assessment Processes and these
factors also had direct significant impact on Customer Focus and Implementation. A
strong positive correlation was found among different TQM constructs and also among
five dimensions of ISO 9001 quality management system. The study also presented
limitations of research study and forward recommendations along with directions for
future research.
5.2 Findings of the study
This section contains the findings from literature review, descriptive analysis and
inferential analysis of the empirical data gathered through questionnaire survey.
5.2.1 Findings from literature review
Following findings from literature review on TQM address research objective 1
“To study the application and implementation of TQM through best practices
analysis”
a. Quality is a relative term and means different things to different individuals.
b. TQM is implemented around the world in different educational institutions.
c. Different tools like business excellence models and management standards are
adopted on way to TQM.
d. TQM implementation results in a competitive edge, efficient use of resources and
customer satisfaction.
e. TQM is based on principles like leadership, total customer satisfaction,
continuous improvement, people involvement, training and education, ownership,
reward and recognition, error prevention and teamwork etc..
f. Initially TQM application was limited to administration in HEIs.
g. TQM implementation depends on some critical success factors like management
commitment, customer focus, internal communication, product design, process
management, training and development etc.
h. TQM is applicable to every aspect of the HEIs.
i. TQM implementation involves expenses with regarding to training and education
j. TQM implementation is time taking.

209
k. Implementation of TQM leads to customer satisfaction, improved learning and
increased enrollment.
l. Approaches to the implementation of TQM vary from organizing to organization
depending on maturity level of the quality culture of the organization.
Following findings from literature review on ISO 9000 address research objective
2 “To highlight the application of ISO 9001:2008 Quality Management System”
a. ISO 9001 has been successfully implemented in different higher education
institutions around the world
b. ISO 9001 is generic in nature and consists of eight sections out which five
sections i.e. Documentation Management, Management Responsibility, Resource
Management, Product Realization and Measurement, Analysis and Improvement
are concerned with the implementation ISO 9001.
c. ISO 9001 is used for contractual and certification purposes.
d. ISO 9000 and TQM are not synonyms.
e. ISO 9000 and TQM are compatible and implementation of ISO 9000 is first step
toward TQM.
f. Implementation of ISO 9000 is time consuming and an expensive exercise.
g. ISO 9000 leads to streamlined organizational processes and clearer understanding
of roles, responsibilities and authority.
h. Implementation of ISO 9000 results in improved market image.
5.2.2 Findings from descriptive analysis
Findings from descriptive analysis address research objective 3 “To survey the
presence of effective quality assurance processes in HEIs in Pakistan”, objective 4
“To survey the application and implementation of TQM in Pakistani HEIs” and 5
“To explore the problems faced by the institutions to improve the quality of
education”.
a. Table 4.1 shows that the mean value of QMS of the selected universities was
found to be 3.70 which indicates above average observance of QMS. Standard

210
Deviation was found to be 0.72 which shows average deviation of the
respondents’ opinion from the mean value.
b. Lower part of the table 4.1 indicates that QMS was observed ‘Usually’ 40%,
‘Often” 44% and ‘Always’ 16% in the sample universities.
c. Cumulative percentage indicates that QMS was partially observed among 84% of
the universities while it had maximum observance in 16% of the selected
universities.
d. In table 4.2 the mean values of different dimensions of QMS like Documentation
Management, Management Responsibility, Resource Management, Product
Realization and Measurement, Analysis and Improvement were 3.70, 3.68, 3.67,
3.72 and 3.74 respectively.
e. In table 4.3 standard deviation regarding Documentation Management was found
to be 1.19. Moreover, the lower part of the table shows that the respondents rated
this aspect ‘Sometime’ 24%, ‘Usually’ 8%, ‘Often’ 32% and Always 36%.
f. In table 4.4 standard deviation regarding Management Responsibility was found
to be 0.707. Moreover, the lower part of the table shows that the respondents
rated this aspect ‘Sometime’ 4, ‘Usually’ 24%, ‘Often’ 60% and Always 12%.
g. In table 4.5 standard deviation regarding Resource Management was found to be
0.687. Moreover, the lower part of the table shows that the respondents rated this
aspect ‘Sometime’ 4%, ‘Usually’ 20%, ‘Often’ 64% and Always 12%.
h. In table 4.6 standard deviation regarding Product Realization was found to be
0.646. Moreover, the lower part of the table shows that the respondents rated this
aspect ‘Usually’ 32%, ‘Often’ 56% and Always 12%.
i. In table 4.7 standard deviation regarding Measurement, Analysis and
Improvement was found to be .852. Moreover, the lower part of the table shows
that the respondents rated this aspect ‘Sometime’ 8%, ‘Usually’ 32%, ‘Often’
44% and Always 16%.
j. In table 4.8 the mean values of different components of Documentation
Management like existence of quality assurance system, quality assurance control
manual, clarity of manual procedures, details of Students’ learning activities,
details of quality assurance and control staff, records of students assessments,

211
record of students transferred in and out of programme and relevant statistical
data of students progression were 3.72, 3.70, 3.72, 3.60, 3.92, 4.08, 3.42 and 3.40
respectively.
k. In table 4.9 the mean values of different components of management
responsibility like management commitment, students focused processes,
responsibility and authority and internal communication were 3.62, 3.36, 4.24,
and 3.50 respectively.
l. In table 4.10 the mean values of different components of resource management
like financial resources, human resources, training and development,
infrastructure and work environment were 3.60, 3.56, 3.46, 3.65 and 4.12
respectively.
m. In table 4.11 the mean values of different components of Product Realization like
academic programme planning, academic programme design, teaching processes,
assessment processes and students induction processes were 3.56, 3.68, 3.52, 3.62
and 4.28 respectively.
n. In table 4.12 the mean values of different components of Measurement, Analysis
and Improvement like monitoring and measuring students’ satisfaction processes,
monitoring and measuring academic and administrative processes, measuring
performance evaluation processes were 3.70, 3.60 and 3.92 respectively.
o. Table 4.13 shows the problems confronted by the higher education institutions.
The respondents believed that problems like lack of financial resources (43.1%),
lack of planning (41.7%), lack of quality assurance at the feeding schools and
colleges (40.3%), lack of physical resources (40.2%), lack of well equipped
libraries and laboratories (38.1%), lack of communication between the students
and the administration (37.9%) and politics among the students and the teachers
(35.5%) were existed and hampering the moves to improve the quality of
education in these institutions. Similarly they opined that problems like lack of
human resources (42.3%), centralized decision-making (42.1%), resistance to
change (41.3%), lack of incentives for the teachers’ professional development
(41.0%), favouritism and nepotism (38.5%), and lack of communication between
the teachers and the administration (35.3%) were present to some extent. in the

212
respondents’ view there were no such problems like outdated curricula (39.5%),
poor governance (38.5%), lack of facilities and poor pay structure (37.3%),
external interference (37.1%) and lack of adequate space (36.3%).
5.2.3 Findings from inferential analysis
Findings from inferential analysis consist of findings from correlation, regression
and ANOVA.
5.2.3.1 Findings from Correlation Analysis
Findings from correlation analysis address objective 7 “To explore correlation
among different management practices in HEIs”. The following insights may be
extracted from Correlation Analysis:
a. From table 4.14, 4.15 and 4.16 it is clear that highest correlation (r ≥ 0.70) was
found between Program Design and Assessment Processes, Assessment Processes
and Teaching Processes, Processes Measurement and Internal Communication,
Process Measurement and Work Environment, Product Measurement and
Documentation Management, Product Measurement and Program Design,
Assessment Processes and Product Measurement and Program Design and
Teaching processes. Similarly high correlation (0.50 < r < 0.69) was found
between Internal Communication and infrastructure, Assessment Processes and
Program Design , Infrastructure and Work Environment, Assessment Processes
and Teaching Processes, Teaching Processes and Internal Communication,
Management Commitment and Internal Communication, Management
Commitment and Process Measurement, Internal Communication and Work
Environment, Product Measurement and Work Environment, Assessment
Processes and Documentation Management, Product Measurement and Teaching
Processes, Teaching Processes and Documentation Management, Program Design
and Documentation Management, Documentation Management and Work
Environment, Assessment Processes and Internal Communication and Program
Design and Internal Communication. The study also revealed medium correlation
(0.30 < r < 0.49) between Infrastructure and Internal Communication, Program

213
Design and Infrastructure, Work Environment and Infrastructure, Teaching
Processes and Work Environment, Teaching Processes and Work Environment,
Assessment Processes and Infrastructure, Teaching Processes and Infrastructure,
Teaching Processes and Infrastructure, Teaching Processes and Infrastructure,
Work Environment and Management Commitment, Infrastructure and
Management Commitment, Process Measurement and Teaching Processes,
Process Measurement and Infrastructure, Assessment Processes and Work
Environment, Program Design and Work Environment and Infrastructure and
Documentation Management. There was low (r 0.01 ≤ 0.29) correlation between
Program Design and Infrastructure, Assessment Processes and Infrastructure,
Internal Communication and Teaching Processes, Management Commitment and
Teaching Processes and Product Management and Infrastructure.
So the null hypothesis H01 “there is no significant correlation among different
aspects/construct of TQM in higher education institutions stands null and void as
all variables have correlation with each other ranging from highest(r ≥ 0.70) to
lowest (r 0.01 ≤ 0.29).
b. It was found (table 4.14, 4.15 and 4.16) that Customer Focus and Satisfaction
had high correlation (0.50 < r < 0.69) with Infrastructure, Program Design,
Assessment Processes, Teaching Processes, Work Environment, Internal
Communication. Similarly the study also divulged that Customer Focus and
Satisfaction had medium correlation (0.30 < r < 0.49) with Management
Commitment, Product Measurement, Program Design, Teaching Processes,
Assessment Processes, Process Measurement, Infrastructure, Internal
Communication and Documentation Management So the null hypothesis H02
“Customer Focus and Satisfaction has no correlation with other TQM aspects” is
unsubstantiated and hence rejected.
c. The study revealed (table 4.17) that five components of ISO 9001 i.e.
Documentation Management, Management responsibility, Resource Management,
Product Realization and Measurement, Analysis & Improvement had highest (r ≥
0.70) and high (0.50 < r < 0.69) positive correlation among them. So the null

214
hypothesis H03 “there is no correlation among the five components of ISO 9001”
stands null and void.
5.2.3.2 Findings from Multiple Regression Analysis
The following findings from multiple regression analysis address objective 6 “To
explore critical success factors for successful TQM implementation in HEIs” and
objective 8 “To find out the factors influencing Customer Focus and Satisfaction in
HEIs”.
a. Multiple Linear Regression Model - 1 was found highly significant at 0.01 level
(p=0.000) accounting for 58% (R2) of the total variation in the dependent variable
i.e. Customer Focus and Satisfaction with work environment, among the regressors,
contributing highest with 86% followed by teaching processes, internal
communication, management commitment and infrastructure 79%, 48%, 44% and
39% respectively (see tables 4.18, 4.19, 4.20).
The above findings were also confirmed by Correlation analysis where high
correlation was found between Customer Focus and Satisfaction and Work
Environment (r =0.675, P = .000) and Infrastructure (r =0.518, P = .000) while
medium Correlation was seen between Customer Focus and Satisfaction and
Management Commitment (r =0.442, P = .000); Teaching Processes (r =0.492, P
= .000) and Internal Communication (r =0.463, P = .000).
b. The 3-varible Regression Model - 2 was found highly significant at 0.01 level
(p=0.000) accounting for 50% (R2) variance in the dependent variable i.e. Customer
Focus and Satisfaction with work environment, among the predictors, contributing
highest with 52% followed by Teaching Processes and Infrastructure 30% and
18% respectively (see tables 4.21, 4.22, 4.23).
Correlation Analysis findings also supported the above findings where high
correlation was found between Customer Focus and Satisfaction and Work
Environment (r = 0.625, P = .000); Teaching Processes (r = 0.559, P = .000) and
Infrastructure (r = 0.422, P = .000)
c. Multiple Linear Regression Model - 3 was found highly significant at 0.01 level
(p=0.000) accounting for 43% (R2) variance in the dependent variable i.e. Customer

215
Focus and Satisfaction with Assessment Processes (AP), among the factors,
contributing highest with 29% followed by Teaching Processes and Internal
Communication 20% and 16% respectively(see tables 4.24, 4.25, 4.26).
The regression model was supported by correlation analysis findings where high
correlation was observed between Customer Focus and Satisfaction and
Assessment Processes (r = 0.611, P = .000); Teaching Processes (r = 0.579, P =
.000); Internal Communication (r = 0.507, P = .000).
The three regression models i.e. Model – 1, Model – 2, and Model – 3, developed
through stepwise regression method divulged that some of the aspects of TQM
had a significant influence on the dependent variable Customer Focus and
Satisfaction while others had no direct and tangible influence, so in the light of
these findings the null hypothesis H04 “different aspects of TQM have no
significant impact on Customer Focus and Satisfaction in higher education
institution” stands partially accepted.
5.2.3.3 Findings from Analysis of Variance (ANOVA)
The Following finding from ANOVA address objective 3 “To survey the
presence of effective quality assurance processes in HEIs in Pakistan” and
objective 4 “To survey the application and implementation of TQM in Pakistani
HEIs”.
Given the nature of the data, sub-null hypothesis were developed and tested to
support or reject the main hypotheses as given below:
Main-hypothesis - H05
There is no significant difference regarding Documentation Management in the
universities as perceived by the stakeholders.
Sub-hypothesis
H05A There is no significant difference regarding Documentation Management as
perceived by the Top Management.

216
H05B There is no significant difference regarding Documentation Management
among the universities as perceived by the Teachers.
In the table 4.27 the value of F is 4.720 which showed that there was a significant
difference regarding Documentation Management as perceived by the Top Management.
So the sub-null-hypothesis H05A “there is no significant difference regarding
Documentation Management in the universities as perceived by the Top Management”
was rejected.
In the table 4.28 the value of F is 4.196 which showed that there was a significant
difference regarding Documentation Management among the universities as perceived by
the Teachers. So the sub-null-hypothesis H05B “there is no significant difference
regarding Documentation Management in the universities as perceived by the Teachers”
was rejected.
On the whole the main null hypothesis H05 “there is no significant difference
regarding Documentation Management in the universities as perceived by the
stakeholders” was rejected.
Main-hypothesis - H06
There is no significant difference regarding Management Commitment in the
universities as perceived by the stakeholders.
Sub-hypotheses
H06A There is no significant difference regarding Management Commitment as
perceived by the Top Management.
In the table 4.29 the value of F is 0.174 which showed that there was no
significant difference regarding Management Commitment as perceived by the Top
Management. So the sub-null-hypothesis H06A “there is no significant difference
regarding Management Commitment in the universities as perceived by the Top
Management” was accepted.
The main null hypothesis H06 “there is no significant difference regarding
Management Commitment in the universities as perceived by the stakeholders” was
accepted.

217
Main-hypothesis - H07
There is no significant difference regarding Customer Focus and Satisfaction in the
universities as perceived by the stakeholders.
Sub-hypotheses
H07A There is no significant difference regarding Customer Focus and
Satisfaction as perceived by the Top Management.
H07B There is no significant difference regarding Customer Focus and
Satisfaction among the universities as perceived by the Teachers.
H07C There is no significant difference regarding Customer Focus & Satisfaction
among the universities as perceived by the Students.
In the table 4.30 the F value is 4.726 which showed that there was a significant
difference regarding Customer Focus and Satisfaction as perceived by the Top
Management. So the sub-null-hypothesis H07A “there is no significant difference
regarding Customer Focus and Satisfaction in the universities as perceived by the Top
Management” was rejected.
In the table 4.31 the value of F 2.325 which showed that there was a significant
difference regarding Customer Focus and Satisfaction among the universities as
perceived by the Teachers. So the sub-null-hypothesis H07B “there is no significant
difference regarding Customer Focus and Satisfaction among the universities as
perceived by the Teachers” was rejected.
In the table 4.32 the value of F is 4.359 which showed that there was a significant
difference regarding Customer Focus and Satisfaction among the universities as
perceived by the Students. So the sub-null-hypothesis H03C “there is no significant
difference regarding Customer Focus and Satisfaction among the universities as
perceived by the Students” was rejected.
On the whole the main null hypothesis H07 “there is no significant difference
regarding Customer Focus and Satisfaction in the universities as perceived by the
stakeholders” was rejected.
218
Main-hypothesis - H08
There is no significant difference regarding Internal Communication in the
universities as perceived by the stakeholders.
Sub-hypotheses
H08A There is no significant difference regarding Internal Communication as
perceived by the Top Management.
H08B There is no significant difference regarding Internal Communication among
the universities as perceived by the Students.
The F value in the table 4.33 is 0.344 which showed that there was no significant
difference regarding internal communication in the universities as perceived by the Top
Management. So the sub-null-hypothesis H08A “there is no significant difference
regarding internal communication in the universities as perceived by the Top
Management” was accepted.
In the table 4.34 the value of F is 2.646 which showed that there was a significant
difference regarding internal communication among the universities as perceived by the
Students. So the sub-null-hypothesis H08B “there is no significant difference regarding
internal Communication as perceived by the Students” was rejected.
On the whole the main null hypothesis H08 “there is no significant difference
regarding Internal Communication in the universities as perceived by the stakeholders”
was partially accepted.
Main-hypothesis - H09
There is no significant difference regarding the Infrastructure in the universities as
perceived by the stakeholders.
Sub-hypotheses
H09A There is no significant difference regarding Infrastructure as perceived by
the Top Management.
H09B There is no significant difference regarding Infrastructure among the
universities as perceived by the Teachers.

219
H09C There is no significant difference regarding Infrastructure among the
universities as perceived by the Students.
The value of F is 5.136 in table 4.35 which showed that there was a significant
difference regarding Infrastructure in the universities as perceived by the Top
Management. So the sub-null-hypothesis H09A “there is no significant difference
regarding Infrastructure in the universities as perceived by the Top Management” was
rejected.
In the table 4.36 the value of F is 7.595 which showed that that there was a
significant difference regarding Infrastructure among the universities as perceived by the
Teachers. So the sub-null-hypothesis H09B “there is no significant difference regarding
Infrastructure among the universities as perceived by the Teachers” was rejected.
In the table 4.37 the value of F is 9.090 which showed that there was a significant
difference regarding Infrastructure among the universities as perceived by the Students.
So the sub-null-hypothesis H09C “there is no significant difference regarding
Infrastructure among the universities as perceived by the Students” was rejected.
On the whole the main null hypothesis H09 “there is no significant difference
regarding the Infrastructure in the universities as perceived by the stakeholders” was
rejected.
Main-hypothesis - H010
There is no significant difference regarding the Work Environment in the
universities as perceived by the stakeholders.
Sub-hypotheses
H010A There is no significant difference regarding Work Environment as perceived
by the Top Management.
H010B There is no significant difference regarding Work Environment among the
universities as perceived by the Teachers.
In the table 4.38 the value of F is 9.265 which showed that there was a significant
difference regarding Work Environment in the universities as perceived by the Top
Management. So the sub-null hypothesis H010A “there is no significant difference

220
regarding Work Environment in the universities as perceived by the Top Management”
was rejected.
In the table 4.39, the F value is 7.538 which showed that there was a significant
difference regarding Work Environment among universities as perceived by the
Teachers. So the sub-null hypothesis H010B “there is no significant difference regarding
Work Environment among universities as perceived by the Teachers” was rejected.
On the whole the main null hypothesis H010 “there is no significant difference
regarding Work Environment in the universities as perceived by the stakeholders” was
rejected.
Main -hypothesis - H011
There is no significant difference regarding Teaching Processes in the universities
as perceived by the stakeholders.
Sub-hypotheses
H011A There is no significant difference regarding Teaching Processes as perceived
by the Top Management.
H011B There is no significant difference regarding Teaching Processes among the
universities as perceived by the Teachers.
H011C There is no significant difference regarding Teaching Processes among the
universities as perceived by the Students.
In the table 4.40 the value of F is 4.646 which showed that there was a significant
difference regarding Teaching Processes in the universities as perceived by the Top
Management. So the sub-null hypothesis H011A “there is a significant difference regarding
Teaching Processes in the universities as perceived by the Top Management” was
rejected.
In the table 4.41 the F value is 3.735 which showed that there was a significant
difference regarding Teaching Processes among the universities as perceived by the
Teachers. So the sub-null hypothesis H011B “there is no significant difference regarding
Teaching Processes among the universities as perceived by the Teachers” was rejected.

221
In the table 4.42 the value of F is 5.623 which showed that there was a significant
difference regarding Teaching Processes among the universities as perceived by the
Students. So the sub-null hypothesis H011C “there is no significant difference regarding
Teaching Processes among the universities as perceived by the Students” was rejected.
On the whole the main null hypothesis H011 “there is no significant difference
regarding Teaching Processes in the universities as perceived by the stakeholders” was
rejected.
Main-hypothesis - H012
There is no significant difference regarding Assessment Processes in the
universities as perceived by the stakeholders.
Sub-hypotheses
H012A There is no significant difference regarding Assessment Processes among
the universities as perceived by the Teachers.
H012B There is no significant difference regarding Assessment Processes among
the universities as perceived by the Students.
In the table 4.43 the F value is 3.791 which showed that there was a significant
difference regarding Assessment Processes among the universities as perceived by the
Teachers. So the sub-null hypothesis H012A “there is no significant difference regarding
Assessment Processes among the universities as perceived by the Teachers” was rejected.
In the table 4.44 the F value is 4.728 which showed that there was a significant
difference regarding Assessment Processes among universities as perceived by the
Students. So the sub-null hypothesis H012B “there is no significant difference regarding
Assessment Processes among the universities as perceived by the Students” was rejected.
On the whole the main null hypothesis H012 “there is no significant difference
regarding Assessment Processes among the universities as perceived by the stakeholders”
was rejected.

222
5.3 Discussion
The prime objectives of the study were to assess the level of preparedness of the
public sector higher education institutions in Pakistan for the implementation of ISO
9001:2008 and propose a Total Quality Management implementation framework for
public sector universities in Pakistan.
The quest for quality is an ancient one. Initially being peripheral, the modern age
phenomena like cut-throat competition, diminishing resources and complex
manufacturing items has now brought it to the centre of the stage. Events like the Second
World War, mass production and industrial revolution gave currency to search for
quality.
Quality is a notorious term for being vague and ambiguous. It is difficult to define
and measure ‘Quality’ in clear-cut terms. Started with measuring quality with gouges and
cuts in objects and coins, the measurement of quality has attained more complex form.
Even in the corporate world where quality should have been defined clearly, it lacks a
single and universal definition. Scanning of the literature reveals that the definition of
quality varies from author to author. Ranging for excellence, exception, conformance to
specifications, consistency, transformation, value for money and fitness for purpose, the
quality is defined as loosely as meeting and exceeding customer’s satisfaction and quality
lies in the eyes of the beholder. Different dimensions for a product quality like
performance, features, reliability, conformance, durability, serviceability, aesthetics and
perceived quality have been mentioned. Similarly dimensions like reliability,
responsiveness, assurance, empathy and tangibles have been used to measure service
quality.
The concept of quality become more illusive and complex when it comes to
education due to lack of tangibility of the product as it is consumed when presented,
duality of the student’s role in the educational process as being raw material to be
transformed into a product and a customer to be satisfied and the ambiguity as whether
the product of the educational process is the educational programme, the educational
services or the students themselves. Moreover, the question arises ‘whose quality?’ the
students, the parents, the employers, the society and the government or the institution
administration’s as all of them are the stakeholders of the educational process. This

223
multiplicity of the stakeholders, potential education customers, in itself unleashes a
discussion about whose perspective on quality be preferred. These issues emphasize the
determination of the quality definition and recognition of the customer and the product in
the educational process. Perusal of the literature divulges that the issues can be amicably
resolved when the customers are categorized into primary, secondary and tertiary
customer (Kanji & Tambi, 1999). The students are the primary customers, employers and
parents are the secondary customers and government and the society at large as the
tertiary customers. For the primary customer the product is the educational programme
and the educational services offered by the institution and for the secondary customer the
products is educational programme and the students. Actually educational programme
and the students are like the two sides of a coin. The operational definition of quality for
the study was fitness for purpose and achieving standard or objectives in transforming the
students. The students were treated as primary customer and the educational programme
and allied services as the product.
Confronted with the challenges as mentioned in the first paragraph of the section,
the corporate world resorted to Total Quality Management to tackle these challenges after
weighing and trying different options. Total Quality Management like quality has a
plethora of definitions. A comprehensive definition of Total Quality Management and
which was also adopted as operational definition for the study and the proposed Total
Quality Management model is given by Spanbauer (1995) who has defined TQM as a
management philosophy that puts systems and processes in place to meet and exceed
customer expectation. It is a relentless quest for continuous improvement through
documentation and the use of tools in a problem solving atmosphere that features team
action and good leadership.
Total Quality Management is a philosophy which focuses on harnessing the
organization’s resources to achieve the organizational objectives effectively and
efficiently to the full satisfaction of the customers. It is an organization-wide and
customer oriented approach. Total Quality Management is based on certain principles
like leadership, commitment, total customer satisfaction, continuous improvement, total
involvement, training and education, ownership of problems, reward and recognition,
error prevention, and teamwork.

224
Emerged from the manufacturing and corporate world, TQM has penetrated
service organizations like bank, health care centres and educational institutions. When
higher education institutions like their corporate colleagues were facing challenges of
increasing competition, a constant reduction in public funding and reduction in student
enrollment coupled with the growing demand for accountability on the part of
stakeholders they found that it is not possible to ride out the storm. Realizing the fact they
resolved to work with the limited resources by using them effectively and efficiently
while at the same time maintaining and improving the quality of education. Seeing the
success of TQM in the corporate world they decided to implement it in higher education
institutions. A number of case studies are available in the literature documenting the
attempts of higher education institutions to instill TQM into the educational setting.
These institutions are from the developed and the developing world alike, for example
Billing (1996) has documented the endeavours for quality at the University of
Westminster in 1992, Clayton (1995) at Aston University, Morris and Haigh (1996) at
Sheffield Hallam University, Oakland and Porter (1995) at TQM Centre at Bradford
University, Dowlatshahi (1996) at the University of Texas, Coate (1993) at Oregon State
University etc. Evans and Lindsay (2005) at University of Wisconsin-Stout, Oregon State
University Purdue University and Michael, et al, (1997), Boston, Columbia, Northern
Arizona and Tennessee. Other success stories of TQM implementation programmes at
US universities include: Harvard University, Michigan State University and Missouri
State University. University of Wisconsin-Stout was the first university to win Baldrige
Award in Education category in 1999.
Various approaches are in vogue to implement Total Quality Management. For
the purpose different quality systems, standards and excellence model and awards based
on these models are adopted en route to TQM like European Foundation for Quality
Model (EFQM) and award, Malcolm Baldrige National Quality Award (MBNQA),
Canadian Awards for Business Excellence, Australian Quality Awards, The Deming
Prize, Balanced Scorecard and ISO 9000 are some of them besides some other national
level quality awards and standards. As these model are theoretical in nature, some authors
have come up with there own frameworks for the TQM implementation. The adoption of
a model varies from organization to organization. Selection of a quality model or

225
standards depends, inter alia, largely on the maturity level of the quality culture at the
organization. As in Pakistan and especially in higher education institutions, the quality
culture is not that much ripe, so ISO 9000 was selected as an approach to Total Quality
Management. Also the Government of Pakistan push for adopting ISO 9000 in the
higher education institutions and Higher Education Commission endeavours for quality
assurance in these institutions contributed to the choice of ISO 9000 standards for the
study. ISO 9000 is considered to be a good start towards Total Quality Management.
Another thing is that once things are streamlined and the culture is mature enough, it is
easier to switch over to adopting other well known Business Excellence Modes like
EFQM or MBNQA.
ISO 9000 series is a set of quality management standards developed by Geneva,
Switzerland, based International Organization for Standardization in 1987. ISO was
founded in 1947. The purpose behind establishing ISO and the release of ISO 9000 series
was to develop international standards to replace different national standards which were
in vogue at that time and were creating confusion.
The series of ISO 9000 was released in 1987 which was revised in 1994 as ISO
9000: 1994, ISO 9001: 1994, ISO 9002: 1994, ISO 9003: 1994 and ISO 9004: 1994. The
standards were revised again in 2000 with phenomenal changes as ISO 9000: 2000, ISO
9001: 2000, ISO 9004: 2000. The purpose was to make the standards generic and
applicable to all type of organizations irrespective of their size and nature. For the third
time the series was revised recently. The revised versions of ISO 9000 was released in
2005, ISO 9001 in 2008 and ISO 9004 in 2009. This time no mega changes like addition
or omission of the clauses or requirements took place. The changes were limited to the
vocabulary to make it user friendly and easy to comprehend and apply.
ISO 9000 series consists of three parts. The first part ISO 9000:2005 deals with
vocabulary of the standards and ISO 9001:2008 embodies the minimum requirements of
the quality management system to be certified. The third part ISO 9004: 2009 consists of
the guidelines for the organization which want to further improve its performance after
successful implementation of ISO 9001: 2008.
Of all the three parts, only ISO 9001:2008 is used for contractual purpose and
certification is awarded against this part. The certification validity lasts for three years.

226
However, it needs to be kept in mind that the certification is not a badge of good quality
product as it is a process oriented approach and only certifies that quality assurance
processes are in place and the minimum requirements of ISO 9001 quality management
system have been met.
ISO 9001 is consist of eight sections i.e. scope, normative reference, terms and
definitions, quality management system, management responsibility, resource
management, product realization and measurement, analysis and improvement. Of these
eight the last five sections are the basic ones and deal with how to implement ISO 9001.
Each section consists of its own requirements. Moreover, ISO 9000 is based on eight
principles which are customer focus, leadership, involvement of people, process
approach, system approach to management, continual improvement, factual approach to
decision making, mutually beneficial supplier relationships.
ISO 9000 is equally applicable in manufacturing as well as service organizations
including higher education institutions. Many education organizations have successfully
implemented ISO 9000. Wolverhampton University, UK, was the first university that
successfully implemented ISO 9000 and got certified. ISO 9000 has been implemented in
UK in different educational institutions from schools to universities (Moreland & Clark,
1998; Doherty, 1995). University of Wolverhampton, Leads Metropolitan University and
University College Dublin are some of the examples where quality assurance system has
been implemented successfully. In Australia many universities like Victoria University,
Queensland University and Monash University are a few among the many universities
that have embraced quality assurance and management practices. Open University
Malaysia, University of Technology and many other universities in Malaysia are actively
involved in the implementation of ISO 9001 (Jung, 2004). Similarly universities in
Turkey (Gozacan Borahan & Ziarati, 2002), Thailand and Hong Kong (Lo & Sculli,
1996) have been implementing quality assurance and management practices. In Pakistan
some universities like National University of Science and Technology, University of
Engineering and Technology, Jamshoro Sindh, NED University of Engineering and
Technology has got ISO 9001 certification and recently Balochistan University of
Information Technology Engineering & Management Sciences joined this league on 16th
January, 2012.

227
Some of the benefits associated with TQM and ISO 9000 implementation are
streamlined internal organizational procedures and operation, improved customer
satisfaction, improved work environment, motivated staff, effective internal
communication, improved public perception and image of the organization, savings and
increased enrollment.
However there are some problems reported too in the literature. Some of these
problems are which model of ISO 9000 is suitable for application, straight jacketing and
over documentation, confusion regarding vocabulary and terminology, time consuming
and expensive. The first problem regarding the choice of model has been resolved with
the new version of 2000 and 2008 as there is only ISO 9001 which is applicable to all
type and size of organization. Regarding the straight jacketing and documentation the
experts believe that it is misinterpretation of the ISO 9000 management standards on the
part of the implementer of ISO 9001 (Hoyle, 2003). ISO 9000 is not prescriptive and
moreover, it is not a system of documents but a documented management system. Only
those core processes which affect the quality of the product need to be documented. The
confusion regarding vocabulary and terminology has been diluted to large extent with the
release of International Workshop Agreement: Guidelines for the Implementation of ISO
9001 in educational setting by International Organization for Standardization. It is a fact
that the implementation of TQM and ISO 9000 is time consuming and expensive too as
initial training and documentation is required. However, it depends upon the maturity
level of the quality culture and how far the things are already streamlined in the
organization. The efforts made in the implementation of ISO and TQM bring benefits
which are many folds.
The present study was focused on TQM in higher education through the
implementation of ISO 9001:2008. The results/findings of the study portray the following
picture regarding TQM and ISO 9001:2008 in higher education institutions in Pakistan.
The study indicated that quality management system observance is above average
in the sampled public sector universities. Among the dimensions of QMS, Measurement,
Analysis and Improvement had the highest observance while Resource Management had
the lowest observance (table 4.2).

228
. Documentation Management was observed above average (table 4.3). Among
the components of Documentation Management, records of students’ assessments were
sufficiently high above the average while other components were observed above average
(table 4.8). Management Responsibility was observed above average (table 4.4). Among
its components Responsibility and Authority was observed sufficiently above average
while other components were observed above average (table 4.9). Resource Management
was observed above average (table 4.5). Among its components Work Environment was
observed sufficiently above average while other components were observed above
average (table 4.10). Product Realization was observed above average (table 4.6). Among
its components Academic Programme Design and Students Induction Processes were
observed sufficiently above average while other components were observed above
average (table 4.11). Measurement, Analysis and improvement were observed above
average (table 4.7). All its components were observed above average (table 4.12).
The study also investigated the problems faced by HEIs in enhancing the quality
of education. Lack of quality assurance at the feeding schools and institutions is one of
the three major problems identified by the study that adversely impact the quality of
education at HEIs. This finding confirms Owlia and Aspinwell’s (1997) that supplier
quality management was a critical factor for quality enhancement in education
The study showed that there is a strong correlation among the five sections of ISO
9001 and also among the critical success factors of TQM which means that there should
an equal emphasis on the five sections and all the critical success should be duly
considered when implementing ISO 9001 and TQM to reap the dividends it brings. This
finding is in concord with Hoyle’s (2003) who has stressed on equal importance of all the
sections of ISO 9001. He has contended that over emphasis on the documentation has led
people to consider ISO 9000 as straight jacketing and a system of documents which is not
in fact.
TQM is a catalyzing agent for enhance the quality of education (Cuttance, 1994)
and is adopted in higher education institutions to achieve and maintain excellence (Ho &
Wearn, 1995). TQM starts with the customer and its ultimate aim is a total customer
satisfaction (Walsh et al., 2002; Zairi, 1995). The implementation of TQM and the level

229
of quality can be gauged from customer satisfaction with services being offered at HEIs
(Vavra, 1997; Milakovich, 1995; Beaver, 1994; Mazelan et al., 1991).
There is a growing trend among the universities to consider customer focus as a
core value (Peterson et al., 1997). Higher education has many customers including
students, faculty, staff, parents and employers etc. (Willis & Taylor, 1999). Most of the
universities consider students as the primary customer (Craig et al., 1999; Zairi, 1995; Ho
& Wearn, 1995; Sallis, 1993).The Oregon State University considers the students’
satisfaction as the purpose for its existence (Coate, 1993). Harvard University considers
any who is provided with information and services as its customer (Hubbard, 1994).
Students’ satisfaction can be measured against support services, infrastructure, teaching
processes (delivery medium) and quality of the course (Abbasi, et al., 2011; Zhao, 2003).
Sakthivel & Raju (2006 a) contends that HEIs should survey students’ satisfaction
regarding management commitment and leadership, the extent of realization of students’
needs, communication procedures, delivery of courses, campus facilities, assessment of
the students’ performance, congenial learning environment and the extent the authorities
encourage the students to bring out their innovative and creative skills
In this study customer focus and satisfaction was used as a dependent variable and
a proxy to measure TQM level of implementation and quality of education being offered
in HEIs in Pakistan (Sirvanci, 2004).. The impact of different factors or constructs
(independent variables) was studied on customer focus and satisfaction which showed
that the most important factors were management commitment, internal communication,
work environment, infrastructure, teaching processes and assessment processes and
accounted for significant variation in customer focus and satisfaction.
The study showed that the top Management in HEI can ensure customer
satisfaction and remain customer focused by identifying students, employees and staff’s
needs and in the light of their feedback on various operational aspects of the institution
while using factual information gathered through monitoring of the process, develops
quality vision, mission and quality policy, quality objectives and values. Similarly the top
management demonstrates its commitment by foreseeing the institution’s needs and
allocating sufficient resources for the developmental purposes and quality management
implementation; and realizing the needs of the job specification equip the employee’s and

230
faculty with necessary training and education. Many authors have highlighted the
importance of commitment and leadership of the vice-chancellor, rector, president dean,
director etc. (Top management) for the implementation of TQM and ensuring total
customer satisfaction. Karapetrovic and Willborn (1999) has emphasized the role of vice-
chancellor, deans, director for the implementation of TQM . Similarly Ebrahimpour
(1985) has maintained that top management can ensure customer satisfaction by creating
values, goals and a system. Aly and Akpovi (2001) have assessed the management
commitment by allocation of the resources. Davies et al. (2001) have argued that
leadership at the universities is of paramount importance to create vision, communicate
policy and deploy strategy and enable universities to survive in the competitive world of
today.
Communication is vital for the implementation of TQM and leads to customer
satisfaction. Students, staff and the employees’ awareness and understanding of the
institution vision, mission and quality objectives and arrangements of their realization
reflects top management commitment for the implementation of TQM. The study showed
that informing students of their rights and responsibilities and providing information on
the available resources leads to their satisfaction. Similarly taking both academic and
non-academic staff and employees on board regarding quality plans and sharing with
them what is expected of them and later on encouraging feedback on their performance
appraisal outcome leads to their satisfaction and performance improvement. Effective
liaison between the teaching and non-teaching staff is not only results in their satisfaction
but contributes to students’ satisfaction as well. This finding of the study is in line with
what we find in literature and studies. The literature shows that communication is of
paramount important for TQM implementation and customer satisfaction. According to
Spanbauer (1995) the best starting point for quality improvement initiatives in higher
education is to improve communication and provide congenial work environment.
Communication has a cementing effect in erecting the quality structure (Kanji & Asher,
1993) and help organization to remain customer focus (Cuthbert, 1996). Sila and
Ebrahimpour (1985) have contended that across different departments communication is
essential so that there is information and knowledge sharing regarding customer needs
and expectation in order to ensure customer satisfaction. Communication between the

231
students and the lecturer (Owlia & Aspinwall, 1996) and academic and non-academic
staff (Oldfield & Baron, 2000) leads to improved quality of service and students
satisfaction.
Infrastructure impacts the implementation of TQM and the satisfaction of the
customers. The study showed that provision of sufficient health and emergency services
and access to IT facilities and other learning resources for teaching and learning at the
campus add to the students and faculty satisfaction. Quality education needs provision of
sufficient physical resources and accommodation for library, laboratory and IT facilities.
Similarly provision of residential facilities for the students and the faculty hailing from
far flung areas; transport services to those who daily commute to the institution and other
utility services including Xerox services, sports, common rooms, refreshment and
recreational points etc. result in the students and faculty satisfaction. Abbasi, et al.,
(2011) have concluded in their study that physical facilities like library, laboratories,
computer, hostel accommodation and sports impact the students’ satisfaction. Similarly
different authors have highlighted the importance of infrastructure and physical facilities
in higher education institutions. Physical aspect of the services in education is the first
that strikes the prospective students (Russell, 2005). Oldfield and Baron (2000) have
maintained that since students spend most of their time with the physical elements i.e.
lecture theatre, laboratories, library etc. so they are influenced by the physical facilities of
the educational institution. Sureshchandar et al. (2002) have maintained that physical
appearance of equipments, signage and even employees affects customers as well as the
employees psychologically, physiologically, sociologically, emotionally and cognitively.
Owlia and Aspinwall (1996) are of the view that not only essential physical facilities like
laborites, libraries and computers etc. facilitate learning and teaching but support
facilities like sports centers, restaurants, residential facilities and prevailing environment
as a whole contribute to the learning process.
Congenial work environment at HEIs supplements TQM implementation and
enhances customer satisfaction. As per the study an institution where faculty is
encouraged and supported to conduct research studies and where there are equal
opportunities for the faculty and the students, irrespective of creed, cast and sex, results
in their satisfaction. Institution providing conducive environment for teaching and

232
learning and where students and faculty feel themselves safe and secure lead to customer
satisfaction. Similarly institutions that acknowledge and award faculty for performing
well, celebrate students’ achievements and where team work is encouraged earn the
students and the faculty’s acclaim. In congruous to this finding of the study, Van
Zadelhoff and De Wet (1995) have emphasized environment for learning that is based on
understanding between the students and the teachers and among the students where they
can easily discuss different topics and share ideas. Spanbauer (1995) has maintained that
a teamwork, people involvement, reward and recognition lead to customer satisfaction
and a culture conducive for germinating a TQM seed.
Teaching and learning experiences are the core processes which directly impact
TQM implementation and students’ satisfaction. The study found that an academic
programme in which the programme aims and objectives are clearly stated and
understood by the faculty and the students, where delivery methodology determined in
advance and where there is clear demarcation of whether the learning experiences would
be teacher or student centered leads to better learning and maximum achievement of the
stated learning outcomes. Similarly students prefer such academic programme where
learning experiences are relevant to the future profession the students would take up and
where learning activities are pre-planned and pre-mentioned to be students specific or
teacher specific and also the students are involved by allowing them to arrange activities
for their self-learning. Similarly keeping a record of the activities arranged for the
students learning, personal development and leadership skills help in achieving the
desired transformational changes in the students and to gauge the effectiveness of the
product i.e. the academic programme. Dowlatshahi (1996) has contended that HEIs can
effectively tackle students’ concerns regarding teachers’ effectiveness and teaching
quality by implementing TQM. Oldfield and Baron (2000) have emphasized a trained and
qualified faculty who are aware of the course provision, have knowledge of their needs
and treat them with care.
Assessment processes help monitoring and assess the transformation changes in
the students and the effectiveness of academic programme. The study found that students
feel satisfied when assessment processes are clearly mentioned in advance for each
course and when the assessment tools like question papers, test and other modes of

233
examination measure the indented outcomes. Similarly students feel satisfied with
assessment processes when there is clearly mentioned for each course/subjects how their
academic works will be assessed and the grades awarded. Assessment is an integral part
of total quality education and serves as a feedback for assessing and improving students
learning, teachers’ performance and the learning processes. (Angelo, 1995; Macy et al.,
1998)
5.4 Conclusion
This section contains conclusion drawn from the findings based on literature
review and the descriptive and inferential analysis of the empirical data gathered though
the survey questionnaire.
5.4.1 Conclusion from literature
TQM is an organization wide management philosophy which seeks to achieve
organizational objectives efficiently and effectively through leadership, total customer
satisfaction, continuous improvement, people involvement, training and education,
ownership, reward and recognition, error prevention and co-operation.
TQM is applicable to all aspects of education including administration, support
services and core activities of teaching, learning and research. There are many routes to
TQM but most frequently adopted approach in less mature quality culture is to implement
ISO 9001 first to erect a house of TQM. ISO 9001 implementation though expensive and
time consuming, results in a documented quality management system which
continuously improves the performance of the organization through Plan-Do-Check-Act
and leads to streamlined organizational processes, clearer understanding of roles,
responsibilities and authority and better market image.
TQM implementation like the definition of quality in education needs to be
customized due to intangible educational product, greater involvement of human factor
and different stakeholders to satisfy. Some factors like management commitment, internal
communication, infrastructure, work environment, product design, team-work and
process management etc. are critical for successful implementation of TQM which results

234
in increased enrollment of the students, financial savings, increased customer satisfaction
and better learning.
5.4.2 Conclusions from descriptive analysis
Conclusions drawn from the findings based on descriptive analysis of the data are
given below:
a. Cumulative percentage of the participants’ responses shows that the observance of
Quality Management System was above average. Only in small number of the
universities (16%) quality management system had maximum observance while
in majority of the universities (84%) it was partially observed.
Among the five dimensions of Quality Management System, Resource
Management had the highest level of observance while Measurement, Analysis
and Improvement had the lowest level of observance.
b. Cumulative percentage of the participants’ responses shows that the observance of
Documentation Management was above average. Only in 36% of the universities
Documentation Management was observed to the maximum while in the majority
of the universities (64%) it was partially observed.
Among the five components of the Documentation Management, records of the
students’ assessments were observed sufficiently above the average while the
other components were observed above average.
c. Cumulative percentage of the participants’ responses shows that the observance of
Management Responsibility was above average. Only in 12% of the universities
Management Responsibility was observed to the maximum while in the majority
of the universities (88%) it was partially observed.
Among the components of Management Responsibility, responsibility and
authority was observed sufficiently above the average while the other components
were observed above average.
d. Cumulative percentage of the participants’ responses shows that the observance of
Resource Management was above average. Only in 12% of the universities
Resource Management had maximum observance while in the majority of the
universities (88%) it was partially observed.

235
Among the components of Resource Management, work environment was
observed sufficiently above the average while the other components were
observed above average.
e. Cumulative percentage of the participants’ responses shows that the observance of
Product Realization was above average. Only in 12% of the universities Product
Realization was observed to the maximum while in the majority of the
universities (88%) it was partially observed.
Among the components of Product Realization, academic programme design and
students induction processes were observed sufficiently above the average while
the other components were observed above average.
f. Cumulative percentage of the participants’ responses shows that the observance of
Measurement, Analysis and Improvement was above average. Only in 16% of the
universities Measurement, Analysis and Improvement was observed to the
maximum while in the majority of the universities (84%) it was partially
observed.
All the components of Measurement, Analysis and Improvement, were observed
above average.
5.4.3 Conclusions from inferential analysis
In the light of the above finding, following conclusions are made:
a. Null hypothesis H01 “there is no significant correlation among different
aspects/construct of TQM in higher education institutions” was rejected and it
was concluded that TQM construct variables were positively correlated to one
another. Improvement in the implementation of one variable augmented and
improved implementation of other correlated variables.
b. Null hypothesis H02 “Customer Focus and Satisfaction has no significant
correlation with other TQM aspects” was rejected. It was concluded that
Customer Focus and Satisfaction had positive correlation with other construct
variables of TQM. So improvement in correlated variables would lead to
enhanced customer Focus and Satisfaction.

236
c. Null hypothesis H03 “there is no significant correlation among the five
sections/components of ISO 9001” was not supported. It is concluded that five
sections of ISO 9001 i.e. Documentation Management, Management
Responsibility, Resource Management, Product Realization and Monitoring,
Measurement & Improvement were positively correlated. For successful
implementation of ISO 9001, all sections must be equally focused and
emphasized as any deficiency or leniency in the implementation of any section
would affect the other sections and hence the over all implementation of ISO
9001 would suffer.
d. Null hypothesis H04 “different aspects of TQM have no significant impact on
Customer Focus and Satisfaction in higher education institution” was partially
accepted. From the results of the regression models, it was concluded that some
construct variables like Management Commitment, Work Environment, Internal
Communication, Infrastructure, Teaching Processes and Assessment Processes
had strong direct impact on the Customer Focus and Satisfaction, the ultimate aim
of TQM, while other construct variable influenced Customer Focus and
Satisfaction indirectly.
e. Sub-hypotheses about Top Management and Teachers’ perceptions regarding
Documentation Management were not supported, so the main hypothesis H05
“there is no significant difference regarding Documentation Management as
perceived by the stakeholder” was rejected.
f. Sub-hypothesis about Top Management’s perceptions regarding Management
Commitment remained unsubstantiated, so the main null hypothesis H06 “there is
no significant difference regarding Management Commitment in higher education
institutions as perceived by the stakeholders” was accepted.
g. All the three sub-null-hypotheses “there is no significant difference regarding
Customer Focus and Satisfaction in the universities as perceived by the Top
Management, the Teachers and the Students” were not supported; the main
hypothesis H07 “there is no significant difference regarding Customer Focus and
Satisfaction in the universities as perceived by the stakeholders” was rejected too.

237
h. Sub-null-hypothesis “there is no significant difference regarding internal
communication in the universities as perceived by the Top Management ” was
accepted while sub-null-hypothesis that “there is no significant difference
regarding internal Communication as perceived by the Students” was rejected, so
the main-null-hypothesis H08 “there is no significant difference regarding internal
Communication in the universities as perceived by the stakeholders” was partially
accepted.
i. All the three sub-null-hypotheses “there is no significant difference regarding
infrastructure in the universities as perceived by the Top Management, the
Teachers and the Students” were rejected, so the main null hypothesis H09 “there
is no significant difference regarding the Infrastructure in the universities as
perceived by the stakeholders” was rejected too.
j. Sub-null hypotheses “there is no significant difference regarding Work
Environment in the universities as perceived by the Top Management and the
Teachers” were rejected; the main null hypothesis H010 “there is no significant
difference regarding Work Environment in the universities as perceived by the
stakeholders” was not accepted too.
k. All the three sub-null hypotheses “there is no significant difference regarding
Teaching Processes in the universities as perceived by the Top Management, the
Teachers and the Students” were rejected; the main null hypothesis H011 “there is
no significant difference regarding Teaching Processes in the universities as
perceived by the stakeholders” was rejected too.
l. Sub-null hypotheses “there is no significant difference regarding Assessment
Processes among the universities as perceive by the Teachers and the Students”
were rejected, main null hypothesis H012 “there is no significant difference
regarding Assessment Processes among the universities as perceived by the
stakeholders” was rejected too.
5.5 Recommendations
a. As the study showed that the construct variables of TQM were positively
correlated, all these aspects of TQM should be equally and effectively emphasized

238
and implemented; otherwise no tangible results would be produced. Similarly the
four sections of ISO 9001 which are vital for the successful implementation of
ISO 9001, on way to TQM, were positively correlated and need equal emphasis
while implementing ISO 9001; otherwise would lead to fiasco.
For the purpose capacity building of the concerned personnel of higher
education institutions is a must. They should be properly educated and trained
regarding different aspects and concepts of ISO 9001 and TQM and how to
implement them. In the early implementation stages a consultant’s services are
recommended in order to initiate the program on sound footing.
b. The regression models developed as a result of the regression analysis revealed
that some factors were significant and accounted for considerable variation in
Customer Focus and Satisfaction, the dependent variable in the study and ultimate
aim of TQM implementation, in the universities. It is suggested that those
construct variables which directly affect the Customer Focus and Satisfaction
should be especially taken care of while implementing ISO 9001 and TQM but
not at the cost of the other variables. These less significant construct variables, as
revealed by the correlation analysis, contribute and influence indirectly. Study of
the literature on the implementation of ISO 9001 and TQM shows that a sizable
number of ISO 9001 and TQM implementation efforts were aborted due to
imbalance in their approach while implementing them and hence were abandoned
after some attempts.
c. As the case studies revealed that the implementation of TQM involves time,
training and money, so necessary arrangements should be made when considering
the implementation of the proposed model. The implementation of the TQM
model should be a strategic move. The top management should be a role model
and sufficiently demonstrate commitment to the implementation of the total
quality model. It should be a top-down approach. The top management should
carefully plan, involve the stakeholders, provide them with feedback and
empower them. Education and training is sine qua non for the implementation of
TQM as a change requires a change in mind besides changing the methods and
skills. Training is mandatory in acquiring the required skills for carrying out the

239
change (Fullan, 1995). Training workshops to create awareness and equip the
management and the employees with use of the statistical tools must be arranged.
Sufficient budget should be made available for the implementation of this project.
d. TQM is not a quick fix and needs patience and continuous efforts to reap the
expected benefits.
5.5.1 Proposed TQM framework
The teachings of quality gurus (Deming, Shewhart, Crosby, Juran, Feigenbaum,
Ishikwaa etc. have always been a beacon and a source of guidance for any quality
imitative. The proposed implementation framework blends the approaches to quality
assurance of earlier gurus’ who has focused on technical processes and tools i.e. hard
aspects and advocated system approach to quality; and the later gurus who has focused on
management dimensions i.e. soft aspects and emphasized humanistic approach to quality
(Ross, 1995). Both approaches are essential for successful implementation of TQM
(Ciampa, 1992) as two mega causes of quality problems are management and the system.
The system approach is a processes oriented approach that includes monitoring and
inspection of the processes and procedures to ensure their conformance to documented
specifications and standards. The humanistic approach adopts a broader one and
encompasses planning, management, leadership, customer focus, education and training,
teamwork besides conformance to specification and standards.
The conceptual framework is based on Edwards’ (1991) Model for TQM
implementation in higher education and ISO 9001 Quality Management System. David
Edwards’ Model provides the foundation (theoretical background) while ISO 9001
Quality management model is the operational aspect (practical background) of the
proposed total quality management framework for higher education institutions. The
framework has three components a documented quality management system; statistical
process control and Team work (Edwards, 1991) as shown in the figure 5.3. Interaction
of these three components will engender continuous improvement represented by rotating
arrows and will lead to total quality management environment in the higher education
institutions.

240
Figure 5.3. Components of proposed TQM framework (Edwards, 1991; adapted)
The major component of the TQM framework i.e. a documented quality
management system consists of a quality and procedural manual with documented
procedure for control of documents and records.
The ISO 9001:2008 Quality Management System, as shown in the figure 5.4, was
used as a basis for the conceptual framework and the empirical study.
Figure 5.4. ISO 9001:2008 quality management system. (ISO, n.d.)

241
ISO 9001 Quality Management System is based on process approach (Hoyle,
2003, ISO) with a quality improvement cycle indicated by circular arrows. The inputs i.e.
the customer and stakeholders’ requirements on the left hand side of the diagram are
converted into outputs which are on the right side in the diagram through the processes
indicated by the middle cycle. The design and production of the product through the
processes is called product realization. The quality of the product determines the level of
customers’ satisfaction and the quality of the product is ensured through monitoring and
control of the processes.
Controlling of processes determines the quality of the product and preempting
non-conformities. The processes are controlled by monitoring and measuring the process
and the data thus gathered are analyzed with the help of various statistical tools and
techniques like Pareto analysis, Fish bone diagram, brainstorming etc. In this way the
quality of the product is maintained and continuously improved.
Teamwork is another component of the proposed conceptual framework.
Working in team achieves better results than working individually. When people work in
team their participation and involvement may be secured and a chain of customer and
supplier is established. Teamwork helps avert compartmentalization and effectively
tackle the problems that cross functional boundaries. It is also effective in eliminating per
functional area problems as the people who perform the job best understand the job and
know how to improve the product and processes. The teamwork may take the form of
cross-sectional teams, quality circles and self-managed teams. (Evans & Lindsay, 2005)
Process-based ISO 9001: 2008 quality management model was adapted to
develop a conceptual total quality management framework for the institutions of higher
educations as shown in the figure 5.5.

242
Fig
ure
5.5
. Pro
pos
ed c
once
ptu
al t
otal
qu
alit
y m
anag
emen
t fr
amew
ork
for
hig
her
ed
uca
tion
inst
itu
tion
s.
INN
OV
AT
ION
& L
EA
RN
ING

243
The conceptual framework has quality assurance through statistical process
control and feedback loop, a system approach in which different processes when
combined together convert the inputs into outputs and continuous improvement through
Deming’s quality improvement cycle of Plan-Do-Check-Act. The framework recognizes
the importance of the processes for ensuring quality of the product to satisfy the
customers. In order to achieve quality product, there should be a documented
management system which give the organization confidence what it is going to do, then
the organization do exactly what is documented by controlling the processes and
continuously improve its performance through Plan-Do-Act-Check wheel and customer
feedback and satisfy the customer needs continuously.
In the figure 5.5 the two columns with an oval in the middle represents the
process aspect of the framework. The column on the left hand side represents the inputs
identified from the literature. The inputs include students and their knowledge, academic
programme, human resource, students support services, academic rules and regulations,
researchers, research topic and existing knowledge, theories and philosophies
(Karapetrovic, 1998b). The oval in the middle represents transformational processes of
the product realization including design, development and improvement of the product.
The core activities like academic programme and courses development, teaching,
learning and research activities and assessment and evaluation take place here. The
rotating arrows show interaction and improvement of the processes through PDCA cycle
and monitoring and measurement. Monitoring and Measurement include formative and
summative evaluation and customers and stakeholders’ feedback. The column on the
right hand side in the framework represents the educational process products i.e. students
with knowledge and skills gained, Academic programme and courses and research and
knowledge generated catering the respective customers. The Innovation and Learning
arrow from the right hand to the left hand column represents the organizational learning
loop and continuous improvement based on Deming’s wheel. The dashed arrows
represent the feedback. The quality assurance department will gather the feedback and
share the information at different management level represented by the triangle on the top
side of the diagram.

244
The triangle with Quality Assurance Department is the functional aspect of the
framework. The triangle represents top, middle and low level management. The top
management in the light of the feedback data from the inputs and outputs will set the
future direction and improvement plan of the intuition by setting vision, mission, quality
policy and quality objective which will be realized with help of the middle and low level
management.
The conceptual total quality management framework has two stages. The first
stage, a quality assurance stage, marks the completion of the implementation ISO 9001:
2008. At this stage the institution may wish to go for certification. At the end of this stage
and certification, the institution will have the pre-requisites for total quality management
such as organizational structure, responsibilities, processes and resources to embrace
TQM. The next stage is the Total Quality Management and continuous improvement
journey with the help Plan-Do-Check-Act and customer’s feedback as shown in the
figure 5.6. This empirical study investigated the processes needed for the attainment of
the first stage. Once this stage is reached, the organization will be ready to embark on an
endless journey of TQM.
Figure 5.6. Proposed two-stage quality management framework with Deming’s cycle.

245
5.5.2 Implementation of the proposed TQM framework
The proposed TQM implementation model consists of Two Stages. The Stage – I
is further divided into four Phases (4P’s) as shown in figure 5.7. Its timeline is at least 1-5
years as TQM is not a set of processes to be carried out in just one go but time consuming
before it is up and running (Moosa, 2007). However, the implementation of a quality
management system and the time required for it to be fully operational varies from
organization to organization (Van den Berghe, 1997). A proposed organization structure
is also given in figure 5.8 to support the implementation of the proposed TQM
framework. Inputs for the proposed model are based on the extensive literature review.
Details of implementation are given in the following lines.
STAGE – I: (1-3 Yrs)
TQM implementation should commence with both short and long terms
objectives in view to be successfully implemented. The first priority should be
implementation of TQM structure i.e. the implementation of ISO 9001QMS which may
be initiated as a project with the help of a consultant or external help. This stage is
extended from the conception of TQM and first successful internal assessment of quality
management system and may take 1-3 years time depending upon the level of quality
culture maturity prevailing in the HEIs and its structure. The stage has four phases (4P’s)
i.e. Preparation, presentation, Practice and Preview.
i. Preparation
This is the first phase when the top management shows interest in the
implementation of TQM. In order to gain insight and knowledge of the TQM, its related
concepts and its implementation requirements, the top management is required to review
literature on TQM and its implementation methodologies. At this stage attending
conferences and seminars on TQM and visiting TQM organizations may be helpful to
create awareness, commitment and confidence. When fully convinced the top
management decides to go for quality management system (ISO 9001) implementation,
determines its scope – whether TQM is to be implemented at administration level or any
particular discipline, and shows commitment by formulating TQM conducive policies

246
and plans in accordance with the envisaged quality vision and allocates resources for the
purpose. Moreover, timeline is set for step-wise implementation of the TQM. Quality
Board consisting of Vice-chancellor, Dean, members of Sent and Syndicate may be
established for the purpose.
ii. Presentation
At this point the top management presents its intent of TQM implementation
institution wide. Vision, mission, quality policy and quality objectives are documented
and the top management share plans and creates awareness by arranging seminars and
workshops and how quality objectives would be achieved. The top management conducts
GAP analysis to assess the gap between the present situation and management system
requirements. Quality council formation takes place which establishes project team after
having identified the projects. Middle managers like directors, head of the departments
and programme coordinators are trained and educated specifically and rest of the
personnel in general in statistical processes control and other quality tools. The institution
takes feedback from the stakeholders through students’ satisfaction surveys, students
forums and dialogue sessions, industry needs and satisfaction surveys and evaluation of
teaching and learning effectiveness. In the light of their feedback the key processes and
procedures are identified, existed ones are revamped and documented with the help of a
consultant in case of lack of skills and expertise internally. However, it is advisable to
involve own employees through capacity building in the identification and documentation
of the quality management system as in this way the employees develop ownership and
hence greater interest and motivation for successful implementation of the quality
management system. Benchmarking may prove helpful. Similarly Quality Function
Deployment (QFD) may be used to capture customers’ needs and expectations in the
academic programme designing. Responsibilities and authorities of decision-making are
entrusted at relevant levels. Also a management representative (QED director) is
appointed to oversee the management system implementation. Any milestone achieved is
celebrated to create interest and motivation. Quality Council, Quality Enhancement
Department and Quality assurance team at department level are established for the above
purpose.

247
iii. Practice
This is an implementation and practice phase. What has been documented is
implemented and record is maintained of what is being done. First trial of the
implementation may not be as successful as expected but the intuition should not be
disheartened and the minor problems should be fixed as soon as possible. However, in
case of severe deficiencies, the processes and procedures are redesigned. Similarly on
satisfactory results the institution should not be contented but continue with the same zeal
and zest for a couple of repeat to establish the processes. At satisfactory results the
project teams are rewarded to recognize their efforts. At the end of this phase the
management programme is up and running.
iv. Preview
At satisfactory results in the last stage, self-assessment and internal audit is
conducted of entire quality management system. In case of satisfactory results the
institution may decide to go for certification of ISO 9000 QMS. With this the project of
quality management system is completed and the next stage starts.
STAGE – II: (3-5 Yrs)
The Second Stage –II starts when ISO 9001 implementation project is complete
and the management system is fully functional. This stage is a continuous process of
updating and improving upon existed quality management system with Deming’s cycle
PDCA. At least once in a year internal self-assessment of the whole quality management
system is arranged.
At the start of this stage new assignments are assigned and job descriptions are
revised with long term focus to run the programme on permanent basis. Actually at this
stage the TQM programme is assimilated into the organizational structure and becomes a
permanent feature. Use of Statistical Process Control and other quality tools becomes a
routine activity to check the processes. Similarly Quality Circles are established to take
on quality problems surfacing during the routine operations.
The first stage is time bound but this is an unending stage as attitudinal and
cultural change takes place and the institution move towards the excellence day by day
under the committed management and leadership toeing an approach characterized by

248
customer focus and mutually beneficial relationship with feeding institutions and industry
; when employees, faculty and students, chained in customer-supplier relationship, work
in teams and the academic programs are continuously improved in the light of the
stakeholders’ feedback and the data attained from the monitoring of the processes.

249
Figure 5.7. Proposed TQM implementation framework

250
Figure 5.8. Proposed organogram for proposed TQM implementation framework

251
5.6 Limitations of the study
Like other research studies, this research also contributes in some way to the
knowledge of quality in education and has some limitations too. It is hoped that
mentioning of the limitations may be helpful to the future researches in this area of the
study. These limitations are related to the broadness of the research topic under study,
lack of homogenous organizational experience, measurement and time constraint. These
major inherent drawbacks of the study are discussed in details.
5.6.1 Research topic
TQM is a new concept especially in education in the developing world. There is
paucity of local published research material and awareness about TQM in education.
TQM is an organization wide approach encompassing all the functions and departments
of the organization but the study is focusing on teaching, learning and research activities,
the raison d'être of higher education institutions. This necessitates organization-wide
approach, a close and detailed study by keeping close contact with respondents and study
a huge literature to capture the real picture. The researcher reviewed a large body of
literature but that is mainly related to advanced countries. Similarly the researcher tried to
collect data form different stakeholders and the customers to collect correct information.
Despite the researcher’s endeavours, it is not possible to claim that this empirical study
highlighted all the issues. This was mainly due to time, money and limited access to the
organizational information.
5.6.2 Research design
Due to the cross sectional nature of the study it has certain limitations. The cross-
sectional design for survey research in the quantitative phase means that data were
collected through mail survey, which captured the perceptions of the respondents at a
given point of time. As the study was not longitudinal, the researcher can make no causal
inferences for within the dimensions and components of Quality Management System
and among the TQM factors. Only longitudinal research can establish causation among
the constructs of interest. The cross-sectional design of the overall study did not allow
drawing inferences about the true nature of the causation among the constructs. These
252
constructs are dynamic in nature and require incorporation of the time element in order to
study them precisely. For example, whether increase in one or more of the dimensions or
components of Quality Management System like management commitment or
monitoring and measurement etc. bring any change in another components or
dimensions. However, the money and the time constraints prevented to venture in a
longitudinal research for this purpose.
5.6.3 Self-Reporting Perception Measure
Another limitation of the study is its total dependence on the subjective, self-
report indicators to measure the different dimensions of Quality Management System
through the survey questionnaire. Use of objective indicators would improve precision.
To this end to capture objective indicators the researchers asked questions form different
stakeholders i.e. the vice-chancellors, the registrars, the deans, the teachers and the
students in order to get the perceptions of the most relevant persons and to serve as a
cross-check also.
5.6.4 Dependence on studies from developed countries
In view of few local similar studies and published material, the findings of the
study could not be compared and contrasted with findings of other studies. Quality
assurance in higher education institutions is at a nascent stage in the developing world
and had to bank on the experiences gained in the developed countries. (Hopkin, 2004)
5.7 Recommendations for future research
The study has many potential implications for future research due to the vastness
of its scope. Research may be conducted in different directions emanating from the study
regarding the methodology employed in collecting and analyzing the data and the
findings of the study. Following are the major recommendations for future research:
a. Empirically testing and refining the proposed generic model, and exploring
relationships among the various variables by collecting data from organizations
that have already implemented TQM.

253
b. Undertaking more in-depth study by selecting a bigger sample and including
qualitative data from local case studies through interviews.
c. Studying the impact of training on the implementation of the ISO 9000 and Total
Quality Management.
d. Investigating the factors affecting the choice of implementation approach and its
impact on the implementation process.
e. Studying the impact of the leadership and management commitment on the
implementation of TQM.

254
References
Aaker, A., Kumar, V., & Day, G. (1995). Marketing research (5th ed.). New York, NY: John Wiley and Sons
Abbasi, M. N.; Malik, A; Chaudhry, I. S. & Imdadullah, M. (2011). A study on student satisfaction in Pakistani universities: The case of Bahauddin Zakariya University, Pakistan, Asian Social Science, 7 (7), 209-219
AIOU (2004). Total quality management (code # 5575), Rawalpindi, Pakistan: Classic Royal Printers
ALNabhani, M. (2007). Developing the education system in the Sultanate of Oman through implementing total quality management: The Ministry of Education Central Headquarters - a case study, (Doctoral dissertation). Retrieved from http://theses.gla.ac.uk/41/01/2007AlNabhaniPhD.pdf
Ali, M. & Shastri, R. K. (2010). Implementation of total quality management in higher education, Asian Journal of Business Management, 2 (1), 9-16.
Aly, N. & Akpovi, J. (2001). Total Quality Management in California public higher education, Quality Assurance in Education, 9(3), 127–131.
Angelo, T. A. (1995). American Society of Higher Education Bulletin, November, pp. 7–9.
Bagozzi, R. P. (1994). Principles of marketing research. London, UK: Basil Blackwell.
Batool, Z., & Qureshi, R. H. (2007). Quality assurance manual: For higher education in Pakistan. Islamabad, Pakistan: Higher Education Commission
Bayraktar, E., Tatoglu, E. & Zaim, S. (2008). An instrument for measuring the critical factors of TQM in Turkish higher education, Total Quality Management, 19 (6), 551–574

255
Beaver, W. (1994). Is TQM appropriate for the classroom?, College Teaching, 42 (3), 111–115.
Best, J., & Kahn, J. (1989). Research in education. Eaglewood Cliffs, NJ: Prentice Hall New Jersey.
Besterfield, D. H., Besterfield-Michna, C., Besterfield, G. H. & Besterfield-Sacre, M. (2008). Total quality management (8th Ed.). Delhi, India: Dorling Kindersley
Bevans-Gonzles, T. L. & Nair, A. T. (2004). The strengths and weaknesses of ISO 9000 in vocational education, Journal of Vocational Education and Training, 56 (2), 163-180
Billing, D. (1996). Managing quality policy and projects in a university. Total Quality Management, 7(2), 203-202
Bolton, A. (1995). A rose by any other name: TQM in higher education, Quality Assurance in Education, 3 (2), 13–18
Boston Group (n.d). Higher education in Pakistan: Towards a reform agenda: A contribution to the task force on improvement of higher education in Pakistan. Retrieved from http://web.mit.edu/bilal/www/education/education_report.pdf
Brotherton, B. & Shaw, J. (1996). “Towards an identification and classification of critical success factors in UK hotels plc”, International Journal of Hospitality Management, 15 (2), 113-35.
BSI (2008). World Quality Day, Retrieved from http://www.worldqualityday.org
BSI (n.d.). Quality management. Retrieved from http://www.bsieducation.org/Education /HE/subjectsstandards/quality-management/quality-management.html
Calvo-Mora, A., Leal, A., & Roldan, J. L. (2005). Relationships between the EFQM model criteria: a Study in Spanish universities, Total Quality Management, 16 (6), 741–770

256
Calvo-Mora, A., Leal, A., & Roldan, J.L. (2006). Using enablers of the EFQM model to manage institutions of higher education. Quality Assurance in Education, 14 (2), 31-55
Cheng, Y. C. & Tam, W. M. (1997). Multi-models of quality in education, Quality Assurance in Education, 5 (1), 22–31
Churchill, G. A. (1995). Marketing research: Methodological foundation (6th ed.). USA: Routledge.
Ciampa, D (1992). Total Quality: A User guide for implementation, Addison Wesley Publishing Company, USA.
Clark, M., & Moreland, N. (1997). Sense-making and ISO 9000 in educational organizations, Research in Post-Compulsory Education. 2(1), 29-45
Clayton, M. (1995). Encouraging the kaizen approach to quality in a university. Total Quality Management, 6, 593-609.
Clayton, M. (1993). Toward total quality management in higher education at Aston University-A case study. Higher Education, 25 (3), 363-71
Coate, E. (1993). The introduction of total quality management at Oregon State University. Higher Education, 25 (3), 303-320.
Craig, R. J., Clarke, F. L. & Amernic, J. H.(1999). Scholarship in university business schools Cardinal Newman, Creeping corporatisation and farewell to the ‘disturber of the peace?’, Accounting, Auditing and Accountability Journal, 12 (5), 510–524.
Cremonini, L. Westerheijden, D. and Enders, J. (2008). Disseminating the right information to the right audience: cultural determinants in the use (and misuse) of rankings Higher Education, 55, 373–385.
Creswell, J. W. (2003). Research design: Qualitative and quantitative approaches. Thousand Oaks, CA: Sage Publications

257
Crosby, P. B. (1979). Quality is free. New York, NY: McGraw Hill.
Cuthbert, P. F. (1996). Managing service quality in HE: is SERVQUAL the answer? Part 1, Managing Service Quality, 6 (2), 11–16.
Cuttance, P. (1994). Monitoring education quality through performance indicators for school practice, School. Effectiveness and School Improvement, 5(2), 106–126.
Dahlgaard, J.J., Kristensen, K. & Kanji, G. (1995). PART I: Introduction: Total quality management and education. Total Quality Management, 6 (5,6), 16-26.
Davies, J., Hides, M. T. & Casey, S. (2001). Leadership in higher education, Total Quality Management, 12 (7, 8), 1025–1030.
Dean, J., & Brown, D. (1994). Management theory and total quality: Improving research and practice through theory development. Academy of Management Review, 19 (8), 392-418.
Deming, W. E. (1986). Out of the crisis. Cambridge: MIT Press.
Denzin, N. K., & Lincoln, Y. S. (1994). Handbook of qualitative research. London, UK: Sage Publications
De Vaus, D.A. (2002), Surveys in social research (5th ed.), Routledge, London
Digman, L.A. (1990). Strategic management: Concepts, decisions, cases. (2nd ed.) Homewood, IL: Irwin.
Dill, D & Soo, M. (2004). Is there a global definition of academic quality?: a cross-national analysis of university ranking systems. Department of Public Policy University of North Carolina at Chapel Hill.
Doherty, G. D. (1995). BS 5750 parts 1 and 2/ISO 9000 (series); 1987 and education - Do they fit and is it worth it? Quality Assurance in Education, 3(3), 3-9

258
Dowlatshahi, S. (1996). Total quality Management in higher education: A case study, Total Quality Management, 7 (2), 219-222
Eagle, L., & Brennan, R. ( 2007). Are students customers? TQM and marketing perspectives. Quality Assurance in Education, 15 (1), 44-60
Ebrahimpour, M. (1985). An examination of quality management in Japan: implications for management in the United States, Journal of Operations Management, 5(4), 419–431.
Edwards, D. (1991). Total quality management in higher education. Management Services, 35(12), 18-20
Evans, J. R., & Lindsay, W. M. (2005). The management and control of quality (6th ed.). Ohio, SW: Thomson.
Feigenbaum, A. V. (1951). Total quality control. (2nd ed.) New York: McGraw Hill.
Feigenbaum, A. V. (1956). Total quality control. Harvard Business Review, 34(6): 93-101.
Flynn, B.B., Schroder, R.G., & Sakakibara, S. (1994). A framework for quality management research and an associated measurement instrument. Journal of Operations Management, 11(4), 339–366.
Frankfort-Nachmias, C., & Nachmias, D. (1996). Research methods in the social sciences (5th ed.). London, UK: Arnold.
Fryer K. J., Antony, J. & Douglas, A. (2007). Critical success factors of continuous improvement in the public sector: A literature review and some key findings, The TQM Magazine, 19 (5), 497-517
Fullan, M. (1995). Change forces: Probing the depths of educational reform. London, UK: The Falmer Press.
Galloway, L. (1998). Quality perceptions of internal and external customers: A case study in educational administration. The TQM Magazine, 10 (1), 20–26.

259
Garvin, D.A. (1987). Competing in the eight dimensions of quality. Harvard Business Review, 65 (6), 101-109.
Garvin, D.A. (1988). Managing quality: The strategic and competitive advantage. New York, NY: Free Press.
Gay, L. R. (1996). Educational research: Competencies for analysis and application (5th ed.). New Jersey, NJ: Merrill Prentice Hall
Goetsch, D. L., & Davis, S. B. (2000a). Quality management: Introduction to total quality management for production, processing and services (3rd ed.). Upper Saddler River, NJ: Pearson Education, Inc.
Goetsch, D.L., & Davis, S. B. (2002b). Understanding and implementing ISO 9000: 2000 (2nd ed.). Upper Saddle River, NJ: Pearson Education, Inc.
Good, C.V. (1973). Dictionary of education (3rd ed.). McGraw Hill, NY: McGraw Hill.
Government of Pakistan. (1998). National education policy 1998-2010. Islamabad, Pakistan: Ministry of Education Press.
Government of Pakistan. (2007). Annual report 2007-2008. Islamabad, Pakistan: Planning Commission.
Gozacan Borahan, N., & Ziarati, R. (2002). Developing quality criteria for application in the higher education sector in Turkey. Total Quality Management, 13 (7), 913–926.
Gregory, M., (1996). Developing effective college leadership for the management of educational change. Leadership Org. Dev. J., 17(4): 46-51.
Hafeez, K., Malak, N., & Abdelmeguid, H. (2006). A framework for TQM to achieve business excellence. Total Quality Management, 17 (9), 1213–1229.
Hammersley, M. (1987). Some notes on the terms validity and reliability. British Educational Research Journal, 13 (1), 73-81.

260
Harris, R.W. (1994). Alien or Ally? TQM, Academic Quality and the New Public Management. Quality Assurance in Education, 2 (3), 33-39
Hayes, L. D. (1987). The crisis of education in Pakistan. Lahore, Pakistan: Vanguard Books.
HEC (2009). Higher education commission report, 2002-2008. Islamabad, Pakistan: HEC Press
Hides, M. T., Davies, J. & Jackson, S. (2004). Implementation of EFQM excellence model self-assessment in the UK higher education, The TQM Magazine, 16 (3), 194-201
Hill, T. (1983). Production/operations management. London, UK: Prentice Hall.
Hills, S., & Wilkinson, A. (1995). In search of TQM. Employment Relations, 17 (4), 8-25.
Ho, S. K. M. (1994). Is the ISO 9000 Series for total quality management? International Journal of Quality and Reliability Management, 11 (9), 74-89.
Ho, S. K. M. (1995). Is the ISO 9000 series for total quality management?. International Journal of Physical Distribution & Logistics Management, 25 (1), 51-66.
Ho, S. K. & Wearn, K. (1995). A TQM model for higher education and training, Training for Quality, 3(2), 25–33
Hopkin, A. G. (2004). Frame factors and a quality assurance agency in ‘Embryonic’ higher education system. Quality in Higher Education, 10(3), 181-195.
Horsburgh, M. (1998). Quality monitoring in two institutions: A comparison. Quality in Higher Education, 4 (2), 115-135.
Hosen, T., & P. Nerille. (1985). The international encyclopedia of education. Oxford, GB: Pergamon Press

261
Hoyle, D. (2001). ISO 9000: 2000: An A–Z guide. New York, NY: Butterwoth–Heinemann.
Hoyle, D. (2003). ISO 9000: Quality system handbook. Burlington: Butternworth-Heinemann
Hubbard, D. L. (1994). Higher education: continuous quality improvement: Making the transition to education. Journal of Academic Librarianship, 19(6), 401.
Hussey, J., & Hussey, R. (1997). Business research: A practical guide for undergraduate and postgraduate students. London, UK: Macmillan.
Iqbal, A. (2004) Problems and prospects of higher education in Pakistan. (Doctoral dissertation). Retrieved from http://eprints.hec.gov.pk/440.
Isani, U. A. G., & Virk M. L. (2005). Higher education in Pakistan: A historic and futuristic perspective. Islamabad, Pakistan: National Book Foundation.
ISO (n.d.). International organization for standardization: ISO: 9000. Retrieved from http://www.iso.org
IWA 2 (2003). Quality management systems–guidelines for the application of ISO 9001: 2000 in education. Geneva, Switzerland: International Organization for Standardization.
IWA 2 (2007). Quality management systems – guidelines for the application of ISO 9001: 2000 in education. Geneva: International Organization for Standardization.
Johannsen, C. G. (1996). ISO 9000 – a managerial approach. Library Management. 17(5), 14–24
Jung, I. S. (2004). A survey on quality assurance systems in mega-universities and selected distance teaching institutions. UNESCO second global forum on international quality assurance, accreditation and the recognition of qualifications in higher education. Paris: Retrieved from http://www.unesco.org/ education/higher_education/global_forum/second_meeting

262
Kanji, G. K., & Tambi, M. A. (1999). Total quality management in UK higher education institutions. Total Quality Management, 10 (1), 129-153
Kanji, G. K. & Asher, M. (1993). Total quality management process – a systematic approach, Advances in total quality management series (Abingdon: Carfax).
Knowles, T. (1994). Total Quality Management in a Community College. A paper presented at the annual Conference of the Association of Canadian Community College (Ottawa, Ontario, Canada, May 26-28, 1994)
Karapatrovic, S. (1998). Quality assurance in the university system. (Unpublished doctoral dissertation). University of Manitoba, Canada.
Karapetrovic, S., Rajamani, D., & Willborn, W. (1998). ISO 9001 quality system: An interpretation for the university. International Journal of Engineering Education, 14 (2), 105-118
Kartha, C. P. (2004). A comparison of ISO 9000:2000 quality system standards, QS 9000, ISO/TS 16949 and Baldrige criteria, The TQM Magazine, 16(5), 331-340
Khan, N. (2008). Total quality management. Rawalpindi, PK: University Press
Korukonda, A.R. (1992). Managerial action skills in business education: missing link or misdirected emphasis?. SAM Advanced Management Journal, 57 (3), 27-42.
Lam, S.S.K. (1995). Quality management and job satisfaction: An empirical study, International Journal of Quality & Reliability Management. 12 (4), 72-78.
Lawrence, J. J. & Dangerfield, B. (2001). Integrating professional reaccreditation and quality award processes. Quality Assurance in Education, 9 (2), 80-91
Lenn, M. P. (2003). Strengthening world bank support for quality assurance and accreditation in higher education in East Asia and the Pacific. World Bank Document

263
Levin, R. I., & Rubin, D. S. (2000). Statistics for management (7th ed.). Islamabad, Pakistan: National Book Foundation,
Lewis, R. G., & Smith, D. H. (1994). Total quality in higher education, Delray Beach, FL: St. Lucie Press.
Lo,V.H.Y., & Sculli, D. (1996). An application of TQM concepts in education. Training for Quality. 4 (3), 16-22
Loya, T. A., & Boli, J. (1999). Standardization in the world polity: Technical rationality over power. In J. Boli & G. M Thomas (Eds.), Constructing world culture: International nongovernmental organizations since 1875. Stanford, CA: Stanford University Press.
Lozier, G. G., & Teeter, D. J. (1996). Quality improvement pursuits in American higher education. Total Quality Management, 7 (2), 189-201.
Lundquist, R. (1997). Quality systems and ISO 9000 in higher education. Assessment & Evaluation in Higher Education, 22 (2), 159-164.
Macy, G., Neal, J. & Waner, K. K. (1998). Harder than I thought: a qualitative study of the implementation of a total quality management approach in business education. Innovative Higher Education, 23(1), 27–46.
Madsen, O. N., & Carlsson, R. (1995), Total quality in education: A case study, Total Quality Management, 6 (6), 613-19.
Magd, H., & Curry, A. (2003). ISO 9000 and TQM: Are they complementary or contradictory to each other?, The TQM Magazine, 15(4), 244-256
Maguad, B. A. (2006). The modern quality movement: Origins, development and trends. Total Quality Management, 17 (2), 179–203
Malik, S. (2002) Factors affecting the development of female higher education in Pakistan and future strategies. (Doctoral dissertation). Retrieved from http://eprints.hec.gov.pk/3882.

264
Mann, R., & Kehoe, D. (1995). Factors affecting the implementation and success of TQM. International Journal of Quality and Reliability Management, 12 (2), 11-23.
Mazelan, P., Brannigan, C, Green, D., Tormey, P. & O'Shea, J. (1991). Using measures of student satisfaction: the implications of a user-led strategy of quality assurance in higher education. Broadcast, 18, 4–5.
McClintock, C., Brannon, D., & Maynard-Moody, S. (1979). Applying the logic of sample surveys to qualitative case studies. Administrative Science Quarterly, 24 (4), 612-629.
McDaniel, C. & Gates, R. (1996). Contemporary marketing research. (3rd ed.) Minneapolis, USA: Western Publishing.
Meade, P. (1995). Managing quality by devolution, Higher Education Management, 7 (1) 63-80.
Merisotis, J. & Sadlak, J. (2005). Higher education rankings: Evolution, acceptance, and dialogue, Higher Education in Europe, 30(2), 20-34.
Michael, R. K., Sower, V. E., & Motwani, J. (1997). A comprehensive model for implementing total quality management in higher education, Benchmarking for Quality Management & Technology, 4 (2), 104-120.
Milakovich, M. E. (1995) Improving Service Quality, Delray Beach, FL: St. Lucie Press.
Miller, D. C. (1991). Handbook of research design and social measurements, London, UK: Sage Publications.
Moosa, K. (2007). Practical guide to ISO 9000 (3rd ed.). Lahore, Pakistan: Ibrahim Publishers.
Moosa, K. (2009). Framework for effective implementation of total quality management in Pakistan (Doctoral Dissertation) University of Taxila.
Moreland, N., & Clark, M. (1998). Quality and ISO 9000 in educational organizations, Total Quality Management, 9 (2,3), 311-320

265
Morris, D.S., & Haigh, R. H. (1996). Introducing total quality management into the student service department of a college of further education in the UK. Total Quality Management, 7 (2,1) 223-232
Motwani, J. (2001). Critical factors and performance measures of TQM. The TQM Magazine, 13 (4), 292-300.
Motwani, J. & Kumar, A. (1997). The need for implementing total quality management in education. The International Journal of Educational Management, 11 (3), 131-135.
Neuman, W. (1997). Social research methods: Qualitative and quantitative approaches (3rd
ed.). Needham Heights, MA: Allyn & Bacon.
Nightingale, P. (1997). Higher education graduates and new employment market. Review of Higher Education Funding and Policy, 19 (1), 1-4.
N.P.O (2010). Prime Minister Quality Award (2011-2012): Criteria for performance excellence, Islamabad, Pakistan, National Productivity Organization. Retrieved from http://www.npo.gov.pk/PMQA/down.html
Oakland, J. S. (1989). Total quality management. Oxford: Heinemann.
Oakland, J. S. (1991), The European centre for total quality management. Total Quality Management, 2 (3), 305-308.
Oakland, J. S. (1993). Total quality management (2nd ed.), Oxford: Heinemann.
Oakland, J. S. (1995). Total quality management-texts with cases. Oxford: Butterworth-Heinemann.
Oakland, J. S. (2000). TQM: Text with cases. (2nd ed.), Oxford: Butterworth-Heinemann.
OECD. (1997). Education Database: Definitions and Explanation – Enrolments Accessed at: www.oecd.org.els.stats.edu_db/def_uoe2.htm.

266
Oldfield, B. M. & Baron, S. (2000). Student perceptions of service quality in a UK university business and management faculty. Quality Assurance in Education, 8 (2), 85–95.
Osseo-Asare, A. E., Longbottom, D.. & Murphy, W. D. (2005). Leadership best practices for sustaining quality in UK higher education from the perspective of the EFQM excellence model. Quality Assurance in Education, 13 (2), 148-170
Owlia, M. & Aspinwell, E. (1997). TQM in higher education – a review. International Journal of Quality and Reliability Management, 14 (5), 527-43.
Owlia, M. S. & Aspinwall, E. M. (1996). A framework for the dimensions of quality in higher education. Quality Assurance in Education, 4(2), 12–20.
Partington, P., & Brown, G. (1997). Quality assessment, staff development and cultural change. Quality Assurance in Education, 5(4), 208-217.
Paunescu, C., & Fok, W. (2005). Commitment to quality education services through ISO 9000: A Case Study of Romania, 1-5. Retrieved from http://www.eric.ed.gov/ERICWebPortal/search/detailmini.jsp?_nfpb=true&_&ERICExtSearch_SearchValue_0=ED491518&ERICExtSearch_SearchType_0=no&accno=ED491518.
P. E. C. (2007). Manual of accreditation (1st ed). Islamabad, Pakistan: Pakistan Engineering Council Engineering Accreditation and Quality Evaluation Committee.
Peter, J. & Wills, G. (1998). ISO 9000 as a global educational accreditation structure, Quality Assurance in Education, 6 (2), 83-89.
Peterson, S.L., Kovel- Jarboe, P. & Schwartz, S.A. (1997). Quality improvement in higher education: implications for student retention. Quality in Higher Education, 3(2), 131–141.
Reeves, C.A., & Bender, D.A. (1994). Defining quality: Alternatives and implications. Academy of Management Review, 19 (3), 419-445.

267
Reid, R. D., & Sanders, N. R (2002). Operations management. New York, NY: John Wiley & Sons Inc
Ross, J. E. (1995). Total quality management: Text, cases and readings (2nd ed.). Delray Beach, FL: St. Lucie Press.
Russell, M. (2005). Marketing education: a review of service quality perceptions among international students. International Journal of Contemporary Management, 17(1), 66–77.
Saeed, M. (2007). Education system of Pakistan and the UK: Comparisons in context to inter-provincial and inter-countries reflections. Bulletin of Education & Research. 29 (2), 43-57
Sahney, S., Banwet, D.K. & Karunes, S. (2004). Conceptualizing total quality in higher education. The TQM Magazine, 16(2), 145–159.
Sakthivel, P. B. & Raju, R. (2006 a) An instrument for measuring engineering education quality from students’ perspective. Quality Management Journal, 13(3), 23–34.
Sakthivel, P. B. & Raju, R. (2006 b). Conceptualizing total quality management in engineering education and developing a TQM educational excellence model. Total Quality Management, 17 (7), 913–934.
Sallis, E. (1993). Total quality management in education, London: Kogan Page.
Saraph, J.V., Benson, G.B., & Schroeder, R.G. (1989). An instrument for measuring the critical factors of quality management, Decision Sciences, 20 (4), 810–829.
Sekaran, U. (2003). Research methods for business: A skill building approach (4th ed.). New York: John Wiley & Sons, Inc.
Shah, D. (2009). Monitoring the quality of secondary education in the context of decentralization in Pakistan, Bulletin of Education and Research, 31 (1), 1-25

268
Shami, P. A., & Hussain, S. (2005). Development of education in Pakistan. Islamabad, MoE, Academy of Educational Planning and Management.
Sheffield Hallam University (2003). EFQM excellence model: Higher education version 2003, Sheffield, UK: Centre for Integral Excellence.
Shewhart, W. A. (1931). Economic control of quality of manufactured products. New York: Van Nostrand.
Sila, I. & Ebrahimpour, M. (2002). An investigation of the total quality management survey based research published between 1989 and 2000. International Journal of Quality & Reliability Management, 19(7), pp. 902–970.
Sirvanci, M. B. (1996). Are students the true customers of higher education? Quality Progress, 29 (1), 99-103.
Sirvanci, M. B. (2004). TQM implementation: Critical issues for TQM implementation in higher education, The TQM Magazine, 16 (6), 382-386
Smith, G.F. (1993). The meaning of quality. Total Quality Management, 4 (7), 235-43.
Spanbauer, S. J. (1995), Reactivating higher education with total quality Management: using quality and productivity concepts, techniques and tools to improve higher education. Total Quality Management, 6 (5, 6) 518-538
Stimson, W. A. (1998). Beyond ISO 9000: How to sustain quality in a dynamic world. New York, NY: AMACOM, American Management Association.
Sureshchandar, G. S., Rajedran, C. & Anantharaman, R. N. (2002). Determinants of customer–perceived service quality: a confirmatory factor analysis approach. Journal of Services Marketing, 16(1), pp. 9–34.
Symon, G., & Cassell, C. (1994). Qualitative methods and analysis in organizational research: A practical guide. London, UK: Sage Publications

269
Taguchi, G. (1986). Introduction to quality engineering: Designing quality into products and processes. Tokyo: Asian Productivity Organization.
Tang, K., & Zairi, M. (1998). Benchmarking quality implementation in a service context: A comparative analysis of financial services and institutions of higher education, part II. Total Quality Management, 9 (7), 539-552.
Thaigarajan, T., Zairi, M., & Dale, B. G. (2001). A proposed model of TQM implementation based on an empirical study of Malaysian industry. International Journal of Quality and Reliability Management, 18 (3), 289-306.
Hameedullah, M. (2005). Comparison of the quality of higher education in public and private sector institutions in Pakistan. (Doctoral Dissertation). Retrieved from http://eprints.hec.gov.pk/627
UNESCO. (1989). The Prospects for Education Planning. Paris, France: IIEP.
UNESCO. (1996). Quality assurance for higher educations: Developing and managing quality assurance for higher education system and institutions in Asia and the Pacific. Bangkok, Thailand: Asia-Pacific Centre of Educational Innovation for Development (ACEID).
UNESCO. (2008). Global Initiative for Quality Assurance Capacity (GIQAC) Governance Terms, Paris http://unesdoc.unesco.org/images/0015/001591/159197 e.pdf
UNESCO. (2009). World conference on higher education. Retrieved from http://www.unesco.no/arrangement/tidligere-arrangement/196-world-conference-on-higher-education
Van den Berghe, W. (1997). Application of ISO 9000 standards to education and training: Interpretation and guidelines in a European perspective. Marinou Antipa, Thessaloniki: Center for the Development of Vocational Training (CEDEFOP).
Van Zadelhoff, C. J. & De Wet, A. G. (1995). Quality management principles applied to the teaching of operations research at a small university, Total Quality Management, 6(5), 539–546.

270
Vavra, T. G. (1997). Improving your measure of customer satisfaction: A guide to creating, conducting, analyzing, and reporting customer satisfaction measurement programs, Milwaukee, WI: American Society for Quality.
Venkatraman, S. (2007). A Framework for implementing TQM in higher education programs. Quality Assurance in Education, 15 (1), 92-112
Walsh, A., Hughes, H. & Maddox, D. (2002). Total quality management continuous improvement: is the philosophy a reality?, Journal of European Industrial Training, 26(6), 299–307.
Wild, C. J. (1995). Continuous improvement of teaching: A case study in a large statistics course, International Statistical Review, 63 (1), 49-68
Willis, T. H. & Taylor, A. J. (1999). Total Quality Management and higher education: the employers’ perspective, Total Quality Management, 10(7), 997–1007.
Witcher, B. J. (1990) Total marketing: Total quality and the marketing concept, The Quarterly Review of Marketing, 15 (2), 1-6.
World Bank (1992). Islamic Republic of Pakistan. Higher Education and Scientific Research: Strategy for Development and Reform. No. 10884-Pak, Population and Human Resources Division, Country Department III, South Asia region.
Yin, R. (1994). Case study research: Design and methods (2nd ed.). Beverly Hills, CA: Sage Publishing.
Yorke, M. (2009). Two complex issues: Rankings and learning outcomes, trends in quality assurance: A selection of papers from the 3rd European quality Assurance forum. Retrieved from www.eua.be on Dec. 12, 2011
Yorke, M. (1999). Assuring quality and standards in globalised higher education, Quality Assurance in Education, 7(1), 14-24
Youssef, M. & Zairi, M. (1995a). Benchmarking critical factors for TQM part I: Theory and foundations. Benchmarking for Quality Management & Technology, 2 (1), 5-20.

271
Youssef, M. & Zairi, M. (1995b). Benchmarking critical factors for TQM part II – Empirical results from different regions in the world. Benchmarking for Quality Management & Technology, 2 (2), 3-19.
Zairi, M. (1995). Total Quality Education for superior performance, Training for Quality, 3(1), 29–35.
Zhao, F. (2003) Enhancing the quality of online higher education through measurement, Quality Assurance in Education, 11(4), 214–221.
Zikmund, W. G. (1997). Business research methods. Philadelphia, USA: The Dryden Press.
Zink, K. J., Schmidt, A., & Vob, W. (1997). Total Quality ‘down under’: The Australian quality award - An innovative model for business excellence. The TQM Magazine, 9 (3), 217-220.

272
APPENDIX A
ITEMS BANK AS PER ISO 9001 QMS FOR THE STAKEHOLDERS
Documentation Management ( Documents &Records Control)
1. A quality assurance system exists at the university /institution.
VC Reg Dean
2. A manual of the quality assurance system exists at the university.
VC Reg Dean
3. The quality assurance and quality control manual has clear procedures and instructions.
VC Reg Dean
4. Details of the staff involved in quality assurance and control arrangement is available.
VC Reg Dean
5. Details of learning activities and students’ personal development and leadership skills are available.
Dean Tcher
6. The records of students’ assessments are up to date and available.
Dean Tcher
7. Transfers in and out of programmes or courses are clearly reconsidered and recorded.
Dean Tcher
8. Record and statistical data of students’ progression are available.
Dean Tcher
MANAGEMENT RESPONSIBILITY
Management Commitment
9. The university has a clear vision. VC Reg Dean
10. The university has a clear mission. VC Reg Dean
11. The university has a policy to improve quality and maintain standards.
VC Reg Dean
12. The university has clear objectives and values. VC Reg Dean
13. Needs of the university are clearly identified. VC Reg Dean
14. Study is conducted to identify the needs of the students/ staff/employees.
VC Reg Dean
15. Needs of job specifications are clearly identified. Reg
16. The students’/ staff’s views on the operational aspects of the institution are sought.
VC Reg Dean
17. Decision-making is based on factual information in the university/institution.
VC Reg Dean
5.2 Customer Focus
18. The students have access to an office for their social and co-curricular activities.
VC Reg Dean Stdnt
19. Students/Teaching staff/Non-academic staff is involved in decision-making.
VC Reg Dean Tcher Stdnt
20. There are arrangements for counseling and welfare support for the students/the teachers.
VC Reg Dean Tcher Stdnt
21. There is a comprehensive service to students on careers and the world of employment.
VC Reg Dean Stdnt
22. Financial support for poor but talented students is available.
VC Reg Dean Stdnt

273
23. Teachers are provided opportunities to improve their qualifications.
Tcher
24. The official of the university/institution are easily available to the teachers and the students.
Tcher Stdnt
Responsibility & Authority
25. Academic programme leader is identified. VC Reg Dean
26. The roles of other staff involved in the programme are established.
VC Reg Dean
27. Roles of staff involved in learning resources and technical support staff are identified.
VC Reg Dean
28. There is job specification for the staff/employees. VC Reg Dean
Internal Communication
29. The students/ staff/ employees are aware of quality assurance and control arrangements.
VC Reg Dean
30. The students/ staff are aware of the vision, mission and objectives of the institution.
VC Reg Dean
31. The students are fully informed of their rights and responsibilities.
VC Reg Dean Stdnt
32. Details regarding the location and availability of all learning and physical resources such as buildings, playgrounds, libraries, IT labs etc., including those available off-site are provided to students.
VC Reg Dean Stdnt
33. Plans are communicated to the academic and the non-academic staff/ employees.
VC Reg Dean
34. The staff/employees are made aware of the appraisal. VC Reg Dean
35. There is effective liaison between academic staff and learning resources staff.
VC Reg Dean
36. The employees are informed of their job specifications and requirements.
VC Reg
RESOURCE MANAGEMENT
Financial Resources
37. There is central support for research at the university. VC Dean
38. There is localised support for research at the university. VC Dean
39. Sufficient funds for research are allocated in the university’s annual budget.
VC Dean
Human Resources
40. Sufficient technical and administrative support staff is available.
Reg
41. There is a liaison staff to support the students’ social & co-curricular activities.
Reg Dean
42. The staff is sufficient in number. Dean
43. The staff is appropriately qualified. Dean
44. Learning resources staff is appropriately experienced. Dean
45. Learning resources staff is sufficient in number. Dean
46. Learning resources staff is appropriately qualified. Dean

274
47. There are sufficient human resources to support teaching and learning.
Reg Dean
Training and Development
48. Development and training programme exists for academic staff/ non-academic staff/employees..
VC Reg Dean
49. There is a support for continuing professional development of academic staff.
VC Reg Dean
50. Training and development needs of learning resources staff/ employees / academic staff are identified.
VC Reg Dean
Infrastructure
51. Sufficient health services are available at the campus. VC Reg Dean Tcher Stdnt
52. Sufficient emergency services are available at the campus.
VC Reg Dean Tcher Stdnt
53. The students/the teachers have access to relevant and appropriate IT facilities including internet, application software and on- line databases.
VC Reg Dean Tcher Stdnt
54. There is overall strategy for learning resources and their development.
VC Reg Dean
55. There are sufficient physical resources to support teaching and learning.
VC Reg Dean
56. Accommodation for laboratories, library and IT is appropriate.
VC Reg Dean Stdnt
57. Transport facility is available to the day scholars who want to avail it.
VC Stdnt
58. Recreational facilities for the students are available at the campus.
VC Stdnt
59. Refreshment points with hygienic food and drinks are available for the students at the campus.
VC Stdnt
60. Hostel accommodation is available for the students and the teachers.
VC Reg Dean Tcher Stdnt
Work Environment
61. The teachers are encouraged to conduct research studies. VC Reg Dean Tcher
62. The university is an equal opportunity institution. VC Reg Dean
63. Teachers are awarded for performing well. VC Reg Dean Tcher
64. There are chances of promotion for the teachers from one scale to another
VC Tcher
65. Teachers are getting enough remuneration. Tcher
66. Upward mobility of the teachers is fair and merit based. VC Tcher
67. The students’/Teachers’ safety is ensured at the campus. VC Reg Dean Tcher Stdnt
68. Award is given to group/team rather than individuals to inculcate team spirit.
VC Reg Dean
69. Convocation is held regularly and annually for awarding degrees to the students.
VC Reg Dean
70. Environment and facilities at the hostels are satisfactory. VC Reg Dean Stdnt

275
PRODUCT REALIZATION
Programme Planning
71. Market research is conducted for the proposed programme by the institution.
Dean
72. A cost and benefit analysis for the proposed programme is conducted prior to consideration by the Institution.
Dean
73. Human resources are identified and addressed prior to the launching of the academic programme.
Reg Dean
74. Physical resources are identified and addressed prior to the launching of the academic programme.
Reg Dean
75. There is a programme committee with a defined composition and terms of reference to oversee the programme operation and evaluation.
Reg Dean
76. Academic programme handbook with details of rules and regulations and support etc. is available.
Reg Dean
Programme Design
77. Programmes have clear aims & objectives. Dean Tcher Stdnt
78. Objectives of programme regarding skills to be imparted are identified in advance.
Dean Tcher
79. Courses within the programme are clearly identified. Dean Tcher
80. All electives are identified and classified appropriately. Dean Tcher
81. The mix of core, elective and basic science courses satisfies the institution’s rules and regulations.
Dean Tcher
82. Level of the courses, including elective subjects is decided before the start of the programme.
Tcher
83. The structures of the courses are coherent. Dean Tcher
84. Pre-requisites for each course are investigated and established.
Dean Tcher
85. The courses selected satisfy the range and depth of knowledge required for the relevant academic programme.
Dean Tcher
86. The subjects content are related to the programme aims and objectives.
Dean Tcher
87. The contents of selected courses are developed in such a way to ensure minimal overlap unless otherwise intended.
Dean Tcher
88. The academic depth for each course is decided based on the intended student entry.
Dean Tcher
89. Each course contents are developed after discussions with internal staff with expertise in that particular area.
Dean Tcher
90. Each course contents are developed after discussions with external staff with expertise in that particular area.
Dean Tcher
91. Total number of credits is established. Dean Tcher
92. There is arrangement for credit rating such that the students are not disadvantaged if they decide to opt out of the institution at any time.
Dean Tcher
93. The students’ progression routes are well defined. Dean Tcher
94. A year is broken down into specific periods of study i.e. semesters, terms.
Dean Tcher

276
95. Curriculum satisfies the academic requirements of the profession.
Dean Tcher
96. The courses are well organized. Stdnt
97. Overall contents of the courses are excellent Stdnt
98. The nature of the courses is intellectually challenging. Stdnt
Teaching Processes
99. The academic programmes aims and objectives are understood by the staff.
VC Reg Dean Tcher
100. The academic programme aims and objectives understood by are the students.
VC Reg Dean Stdnt
101. Delivery methodology of course is decided in advance. Dean Tcher
102. Learning experiences of the students are relevant to employment.
VC Reg Dean Tcher Stdnt
103. Students are given opportunities to become involved in programme operation and take responsibility for their own learning.
VC Reg Dean Tcher Stdnt
104. The learning strategy clearly identifies teacher-centered & student-centered activities.
Dean Tcher
105. Teacher-centered & student-centered activities are planned before start of the programme.
Dean Tcher
106. Students are involved in teaching and encouraged to take part in discussion.
Tcher Stdnt
Assessment Processes
107. The students’ assessment methodology for each course is determined in advance.
Dean Tcher
108. The assessment papers i.e. examinations and assignment briefs are prepared in accordance with the assessment requirements for the intended outcome.
Dean Tcher
109. The assessment ensures the students attain the required standards.
Dean Tcher Stdnt
110. There is a students’ assessment criterion as well as grading criterion for each course/subject.
Dean Tcher
111. Students assessed work is returned in time. Tcher Stdnt
112. Grading practice is explained to the students in advance. Tcher Stdnt
113. Teachers provide useful feedback. Tcher Stdnt
Students Induction Processes
114. There are planned arrangements for students’ admission and induction.
Dean
115. There are students’ selection criteria for the programme. Dean
116. The students’ selection criteria for programmes are strictly followed.
Dean
117. All the staff is aware of these arrangements for admission.
Dean
118. The student entry and intended outcome of programmes and courses are carefully matched.
Dean

277
MEASUREMENT, IMPROVEMENT & ANALYSIS
Customer Satisfaction
119. A system for taking staff’s views exists at the university. VC Reg Dean
120. There is a system for taking the students’ views to improve quality.
VC Reg Dean
121. The students provide feedback on the quality of the courses they study.
VC Reg Dean
122. The students provide feedback on the quality of teaching.
VC Reg Dean
123. Class proceedings and activities are to the point and well directed.
Stdnt
124. Teachers provide useful feedback. Stdnt
125. Teachers’ attitude to the students’ queries is encouraging.
Stdnt
126. Teachers provide assistance to the students. Stdnt
Monitoring and Measurement of Processes
127. Academic programmes are monitored for quality. VC Reg Dean
128. Administrative support services are monitored for quality.
VC Reg Dean
129. Feedback on the processes and procedures of the institution is received from teachers/students.
VC Reg Dean
130. There is an appraisal and peer review of staff, including teaching skills.
VC Reg Dean
131. Programmes are compared with other institutions for quality.
VC Reg Dean
132. The institution processes and procedures are compared with the best institutions for benchmarking.
VC Reg Dean
133. Link programmes of the university with other institutions in an advanced country exist.
VC
Monitoring and Measurement of Product
134. There is a systematic and progressive development & assessment of achievement skills.
VC Reg Dean Tcher
135. There are clear arrangements to monitor students’ career development after graduation.
VC Reg Dean
136. A programme evaluation is carried out at the completion.
VC Reg Dean
137. The quality assurance system ensures curriculum review and development.
VC Reg Dean Tcher
138. Programme evaluation is carried out at completion. VC Reg Dean Tcher
139. There is an assessment schedule for the students so that they know what, when and how they are going to be assessed.
Dean Tcher Stdnt
140. There are procedures for internal verification and evaluation of all aspects of assessment process.
Dean Tcher
141. There are clear procedures to ensure grades and certification awarded to students are fair and unbiased.
Dean Tcher Stdnt
142. The students’ progression rates and non-completion rates are clearly identified.
Dean Tcher
143. There is gender discrimination in the assessment of the students.
Tcher

278
144. Problems faced by HEIs to in enhancing the quality of education.
VC Reg Dean Tcher Stdnt
Total Questions Asked from Each Stakeholder 75 74 118 60 36
*VC = Vice-chancellor, **Reg = Registrar, ***Dean = Dean, ****Tcher = Teacher, *****Stdnt = Student

279
APPENDIX B
QUESTIONNAIRE FOR THE VICE-CHANCELLOR
Research Topic:
“Developing A Total Quality Management Framework for Public Sector Universities in Pakistan.”
Personal Information: Name: _______________________________________ Age: ___________________________________________
Gender: ______________________________________ Qualifications: ____________________________________
Designation: ___________________________________ Institution’s Name: ________________________________
1. Please express your opinion by ticking ( ) the most appropriate box against each statement. 2. Please make sure you have completed all the items thoroughly.
Documentation Management
1. A quality assurance system exists at the university /institution.
Always Often Usually Seldom Never
2. A manual of the quality assurance system exists at the university.
Always Often Usually Seldom Never
3. The quality assurance and quality control manual has clear procedures and instructions.
Always Often Usually Seldom Never
4. Details of the staff involved in quality assurance and control arrangement is available.
Always Often Usually Seldom Never
Management Commitment
5. The university has a clear vision. Always Often Usually Seldom Never
6. The university has a clear mission. Always Often Usually Seldom Never
7. The university has a policy to improve quality and maintain standards.
Always Often Usually Seldom Never
8. The university has clear objectives and values. Always Often Usually Seldom Never
9. Needs of the university are clearly identified. Always Often Usually Seldom Never
10. Study is conducted to identify the needs of the costumers (students/ staff/employees).
Always Often Usually Seldom Never
11. The students’ views on the operational aspects of the institution are sought.
Always Often Usually Seldom Never
12. Decision-making is based on factual information in the university/institution.
Always Often Usually Seldom Never
Customer Focus & Satisfaction
13. The students have access to an office for their social and co-curricular activities.
Always Often Usually Seldom Never
14. Students and staff are involved in decision-making. Always Often Usually Seldom Never
15. There are arrangements for counseling and welfare support for the students and the teachers.
Always Often Usually Seldom Never

280
16. There is a comprehensive service to students on careers and the world of employment.
Always Often Usually Seldom Never
17. Financial support for poor but talented students is available.
Always Often Usually Seldom Never
18. A system for taking staff’s views exists at the university.
Always Often Usually Seldom Never
19. A system for taking the students’ views exists at the university to improve quality in general.
Always Often Usually Seldom Never
20. The students provide feedback on the quality of the courses they study.
Always Often Usually Seldom Never
21. The students provide feedback on the quality of teaching.
Always Often Usually Seldom Never
Responsibility & Authority
22. Academic programme leader is identified. Always Often Usually Seldom Never
23. The roles of other staff involved in the academic programme are established.
Always Often Usually Seldom Never
24. Roles of staff involved in learning resources and technical support staff are identified.
Always Often Usually Seldom Never
25. There is job specification for the staff and employees. Always Often Usually Seldom Never
Internal Communication
26. The students are aware of quality assurance and control arrangements.
Always Often Usually Seldom Never
27. The students are aware of the vision, mission and objectives of the institution.
Always Often Usually Seldom Never
28. The students are fully informed of their rights and responsibilities.
Always Often Usually Seldom Never
29. Details regarding the location and availability of all learning and physical resources such as buildings, playgrounds, libraries, IT labs etc., including those available off-site are provided to students.
Always Often Usually Seldom Never
30. Plans are communicated to the academic and the non-academic staff.
Always Often Usually Seldom Never
31. The staff is made aware of the appraisal. Always Often Usually Seldom Never
32. There is effective liaison between academic staff and learning resources staff.
Always Often Usually Seldom Never
33. The employees are informed of their job specifications and their requirements.
Always Often Usually Seldom Never
Financial Resources
34. There is central support for research at the university. Always Often Usually Seldom Never
35. There is localised support for research at the university. Always Often Usually Seldom Never
36. Sufficient funds for research are allocated in the university’s annual budget.
Always Often Usually Seldom Never
Training and Development
37. A staff development and training programme exists for academic staff.
Always Often Usually Seldom Never
38. A staff development and training programme exists for non-academic staff.
Always Often Usually Seldom Never

281
39. A staff development and training programme exists for learning resources staff.
Always Often Usually Seldom Never
Infrastructure
40. Sufficient health services are available at the campus. Always Often Usually Seldom Never
41. Sufficient emergency services are available at the campus.
Always Often Usually Seldom Never
42. The students have access to relevant and appropriate IT facilities including internet, application software and on- line databases.
Always Often Usually Seldom Never
43. There is overall strategy for learning resources and their development.
Always Often Usually Seldom Never
44. There are sufficient physical resources to support teaching and learning.
Always Often Usually Seldom Never
45. Accommodation for laboratories, library and IT is appropriate.
Always Often Usually Seldom Never
46. Transport facility is available to the day scholars who want to avail it.
Always Often Usually Seldom Never
47. Recreational facilities for the students are available at the campus.
Always Often Usually Seldom Never
48. Refreshment points with hygienic food and drinks are available for the students at the campus.
Always Often Usually Seldom Never
49. Hostel accommodation is available for the students and the teachers.
Always Often Usually Seldom Never
Work Environment
50. The teachers are encouraged to conduct research studies.
Always Often Usually Seldom Never
51. The university is an equal opportunity institution. Always Often Usually Seldom Never
52. Teachers are awarded for performing well. Always Often Usually Seldom Never
53. There are chances of promotion for the teachers from one scale to another
Always Often Usually Seldom Never
54. Upward mobility of the teachers is fair and merit based.
Always Often Usually Seldom Never
55. The students’ safety is ensured at the campus. Always Often Usually Seldom Never
56. Award is given to group/team rather than individuals to inculcate team spirit.
Always Often Usually Seldom Never
57. Convocation is held regularly and annually for awarding degrees to the students.
Always Often Usually Seldom Never
58. Environment and facilities at the hostels are satisfactory.
Always Often Usually Seldom Never
Teaching Processes
59. The programmes aims and objectives are understood by the staff.
Always Often Usually Seldom Never
60. The programme aims and objectives understood by are the students.
Always Often Usually Seldom Never
61. Learning experiences of the students are relevant to employment.
Always Often Usually Seldom Never
62. Students are given opportunities to become involved in programme operation and take responsibility for their own learning.
Always Often Usually Seldom Never

282
Process Management
63. Academic programmes are monitored for quality. Always Often Usually Seldom Never
64. Administrative support services are monitored for quality.
Always Often Usually Seldom Never
65. Feedback on the processes and procedures of the institution is received from the teachers and the students.
Always Often Usually Seldom Never
66. There is an appraisal and peer review of staff, including teaching skills.
Always Often Usually Seldom Never
67. Programmes are compared with other institutions for quality.
Always Often Usually Seldom Never
68. The institution processes and procedures are compared with the best institutions for benchmarking.
Always Often Usually Seldom Never
69. Link programmes of the university with other institutions in an advanced country exist.
Always Often Usually Seldom Never
Product Management
70. There is a systematic and progressive development &
assessment of achievement skills. Always Often Usually Seldom Never
71. There are clear arrangements to monitor students’ career development after graduation.
Always Often Usually Seldom Never
72. A programme evaluation is carried out at the completion.
Always Often Usually Seldom Never
73. The quality assurance system ensures curriculum review and development.
Always Often Usually Seldom Never
74. Programme evaluation is carried out at completion. Always Often Usually Seldom Never
75. In your view, which of the following Problems your institution is facing in enhancing the quality of education.
a. Lack of financial resources Yes To Some Extent No
b. Lack of physical resources (buildings, libraries, labs etc.)
Yes To Some Extent No
c. Lack of human resources (qualified teachers etc.) Yes To Some Extent No
d. Lack of adequate space Yes To Some Extent No
e. Lack of well-equipped libraries and labs Yes To Some Extent No
f. Out-dated curriculum Yes To Some Extent No
g. Poor governance Yes To Some Extent No
h. Resistance to change Yes To Some Extent No
i. Lack of facilities and poor pay structure for the teachers
Yes To Some Extent No
j. Lack of incentives for the teachers for professional growth and performance
Yes To Some Extent No
k. Lack of planning Yes To Some Extent No
l. Politics among both students and teachers Yes To Some Extent No
m. External interference in the affairs of the institution
Yes To Some Extent No

283
n. Favouritism and nepotism in decision making and appointment of staff and employees
Yes To Some Extent No
o. Lack of quality assurance system at the feeding colleges and schools
Yes To Some Extent No
p. Centralized decision making Yes To Some Extent No
q. Lack of communication between the teachers and the administration
Yes To Some Extent No
r. Lack of communication between the students and the administration
Yes To Some Extent No
76. Please write down the problems faced by your institution other than the above ones. 1. 2. 3. 4.
77. What are your suggestions for improving the quality of education in your institution? 1. 2. 3. 4.
Respondent’s Signature_____________________________
THANK YOU VERY MUCH FOR COMPLETING THE QUESTIONNAIRE.

284
QUESTIONNAIRE FOR THE REGISTRAR
Research Topic:
“Developing A Total Quality Management Framework for Public Sector Universities in Pakistan.”
Personal Information: Name: _______________________________________ Age: ___________________________________________
Gender: ______________________________________ Qualifications: ____________________________________
Designation: ___________________________________ Institution’s Name: ________________________________
1. Please express your opinion by ticking ( ) the most appropriate box against each statement. 2. Please make sure you have completed all the items thoroughly.
Documentation Management
1. A quality assurance system exists at the university /institution.
Always Often Usually Seldom Never
2. A manual of the quality assurance system exists at the university.
Always Often Usually Seldom Never
3. The quality assurance and quality control manual has clear procedures and instructions.
Always Often Usually Seldom Never
4. Details of the staff involved in quality assurance and control arrangement is available.
Always Often Usually Seldom Never
Management Commitment
5. The university has a clear vision. Always Often Usually Seldom Never
6. The university has a clear mission. Always Often Usually Seldom Never
7. The university has a policy to improve quality and maintain standards.
Always Often Usually Seldom Never
8. The university has clear objectives and values. Always Often Usually Seldom Never
9. Needs of the university are clearly identified. Always Often Usually Seldom Never
10. Study is conducted to identify the needs of the employees.
Always Often Usually Seldom Never
11. Needs of job specifications are clearly identified. Always Often Usually Seldom Never
12. The staff’s views on the operational aspects of the institution are sought.
Always Often Usually Seldom Never
13. Decision-making is based on factual information in the university/institution.
Always Often Usually Seldom Never
Customer Focus & Satisfaction
14. The students have access to an office for their social and co-curricular activities.
Always Often Usually Seldom Never
15. Non-academic staff is involved in decision-making. Always Often Usually Seldom Never
16. There are arrangements for counseling and welfare support for the teachers.
Always Often Usually Seldom Never

285
17. There is a comprehensive service to students on careers and the world of employment.
Always Often Usually Seldom Never
18. Financial support for poor but talented students is available.
Always Often Usually Seldom Never
19. A system for taking staff’s views exists at the university.
Always Often Usually Seldom Never
20. There is a system for taking the students’ views to improve quality.
Always Often Usually Seldom Never
21. The students provide feedback on the quality of the courses they study.
Always Often Usually Seldom Never
22. The students provide feedback on the quality of teaching.
Always Often Usually Seldom Never
Responsibility & Authority
23. A programme leader is identified. Always Often Usually Seldom Never
24. The roles of other staff involved in the programme are established.
Always Often Usually Seldom Never
25. Roles of staff involved in learning resources and technical support staff are identified.
Always Often Usually Seldom Never
26. There is job specification for the employees. Always Often Usually Seldom Never
Internal Communication
27. The employees are aware of quality assurance and control arrangements.
Always Often Usually Seldom Never
28. The staff is aware of the vision, mission and objectives of the institution.
Always Often Usually Seldom Never
29. The students are fully informed of their rights and responsibilities.
Always Often Usually Seldom Never
30. Details regarding the location and availability of all learning and physical resources such as buildings, playgrounds, libraries, IT labs etc., including those available off-site are provided to students.
Always Often Usually Seldom Never
31. Plans are communicated to the non-academic staff and the employees.
Always Often Usually Seldom Never
32. The employees are made aware of the appraisal. Always Often Usually Seldom Never
33. There is effective liaison between academic staff and learning resources staff.
Always Often Usually Seldom Never
34. The employees are informed of their job specifications and requirements.
Always Often Usually Seldom Never
Human Resources 35. Sufficient technical and administrative support staff is
available. Always Often Usually Seldom Never
36. There is a liaison staff to support the students’ social & co-curricular activities.
Always Often Usually Seldom Never
37. There are sufficient human resources to support teaching and learning.
Always Often Usually Seldom Never
Training and Development
38. Development and training programme exists for employees.
Always Often Usually Seldom Never
39. There is a support for continuing professional development of academic staff.
Always Often Usually Seldom Never

286
40. Training and development needs of the employees are identified.
Always Often Usually Seldom Never
Infrastructure
41. Sufficient health services are available at the campus. Always Often Usually Seldom Never
42. Sufficient emergency services are available at the campus.
Always Often Usually Seldom Never
43. The teachers have access to relevant and appropriate IT facilities including internet, application software and on- line databases.
Always Often Usually Seldom Never
44. There is overall strategy for learning resources and their development.
Always Often Usually Seldom Never
45. There are sufficient physical resources to support teaching and learning.
Always Often Usually Seldom Never
46. Accommodation for laboratories, library and IT is appropriate.
Always Often Usually Seldom Never
47. Hostel accommodation is available for the teachers. Always Often Usually Seldom Never
Work Environment
48. The teachers are encouraged to conduct research studies.
Always Often Usually Seldom Never
49. The university is an equal opportunity institution. Always Often Usually Seldom Never
50. Teachers are awarded for performing well. Always Often Usually Seldom Never
51. The students and teachers’ safety is ensured at the campus.
Always Often Usually Seldom Never
52. Award is given to group/team rather than individuals to inculcate team spirit.
Always Often Usually Seldom Never
53. Convocation is held regularly and annually for awarding degrees to the students.
Always Often Usually Seldom Never
54. Environment and facilities at the hostels are satisfactory.
Always Often Usually Seldom Never
Academic Programme Planning
55. Human resources are identified and addressed prior to the launching of the academic programme.
Always Often Usually Seldom Never
56. Physical resources are identified and addressed prior to the launching of the academic programme.
Always Often Usually Seldom Never
57. There is a programme committee with a defined composition and terms of reference to oversee the programme operation and evaluation.
Always Often Usually Seldom Never
58. Academic programme handbook with details of rules and regulations and support etc. is available.
Always Often Usually Seldom Never
Teaching Processes
59. The academic programmes aims and objectives are understood by the staff.
Always Often Usually Seldom Never
60. The academic programme aims and objectives understood by are the students.
Always Often Usually Seldom Never
61. Learning experiences of the students are relevant to employment.
Always Often Usually Seldom Never
62. Students are given opportunities to become involved in programme operation and take responsibility for their own learning.
Always Often Usually Seldom Never

287
Process Management
63. Academic programmes are monitored for quality. Always Often Usually Seldom Never
64. Administrative support services are monitored for quality.
Always Often Usually Seldom Never
65. Feedback on the processes and procedures of the institution is received from teachers.
Always Often Usually Seldom Never
66. There is an appraisal and peer review of staff, including teaching skills.
Always Often Usually Seldom Never
67. Programmes are compared with other institutions for quality.
Always Often Usually Seldom Never
68. The institution processes and procedures are compared with the best institutions for benchmarking.
Always Often Usually Seldom Never
Product Management
69. There is a systematic and progressive development & assessment of achievement skills.
Always Often Usually Seldom Never
70. There are clear arrangements to monitor students’ career development after graduation.
Always Often Usually Seldom Never
71. A programme evaluation is carried out at the completion.
Always Often Usually Seldom Never
72. The quality assurance system ensures curriculum review and development.
Always Often Usually Seldom Never
73. Programme evaluation is carried out at completion. Always Often Usually Seldom Never
74. In your view, which of the following Problems your institution is facing in enhancing the quality of education.
a. Lack of financial resources Yes To Some Extent No
b. Lack of physical resources (buildings, libraries, labs etc.)
Yes To Some Extent No
c. Lack of human resources (qualified teachers etc.) Yes To Some Extent No
d. Lack of adequate space Yes To Some Extent No
e. Lack of well-equipped libraries and labs Yes To Some Extent No
f. Out-dated curriculum Yes To Some Extent No
g. Poor governance Yes To Some Extent No
h. Resistance to change Yes To Some Extent No
i. Lack of facilities and poor pay structure for the teachers
Yes To Some Extent No
j. Lack of incentives for the teachers for professional growth and performance
Yes To Some Extent No
k. Lack of planning Yes To Some Extent No
l. Politics among both students and teachers Yes To Some Extent No
m. External interference in the affairs of the institution
Yes To Some Extent No
n. Favouritism and nepotism in decision making and appointment of staff and employees
Yes To Some Extent No
o. Lack of quality assurance system at the feeding colleges and schools
Yes To Some Extent No

288
p. Centralized decision making Yes To Some Extent No
q. Lack of communication between the teachers and the administration
Yes To Some Extent No
r. Lack of communication between the students and the administration
Yes To Some Extent No
75. Please write down the problems faced by your institution other than the above ones. 1. 2. 3. 4.
76. What are your suggestions for improving the quality of education in your institution?
1. 2. 3. 4.
Respondent’s Signature_____________________________
THANK YOU VERY MUCH FOR COMPLETING THE QUESTIONNAIRE.

289
QUESTIONNAIRE FOR THE DEAN
Research Topic:
“Developing A Total Quality Management Framework for Public Sector Universities in Pakistan.”
Personal Information: Name: _______________________________________ Age: ___________________________________________
Gender: ______________________________________ Qualifications: ____________________________________
Designation: ___________________________________ Institution’s Name: ________________________________
1. Please express your opinion by ticking ( ) the most appropriate box against each statement. 2. Please make sure you have completed all the items thoroughly.
Documentation Management
1. A quality assurance system exists at the university /institution.
Always Often Usually Seldom Never
2. A manual of the quality assurance system exists at the university.
Always Often Usually Seldom Never
3. The quality assurance and quality control manual has clear procedures and instructions.
Always Often Usually Seldom Never
4. Details of the staff involved in quality assurance and control arrangement is available.
Always Often Usually Seldom Never
5. Details of learning activities and students’ personal development and leadership skills are available.
Always Often Usually Seldom Never
6. The records of students’ assessments are up to date and available.
Always Often Usually Seldom Never
7. Transfers in and out of programmes or courses are clearly reconsidered and recorded.
Always Often Usually Seldom Never
8. Record and statistical data of students’ progression are available.
Always Often Usually Seldom Never
Management Commitment
9. The university has a clear vision. Always Often Usually Seldom Never
10. The university has a clear mission. Always Often Usually Seldom Never
11. The university has a policy to improve quality and maintain standards.
Always Often Usually Seldom Never
12. The university has clear objectives and values. Always Often Usually Seldom Never
13. Needs of the university are clearly identified. Always Often Usually Seldom Never
14. Study is conducted to identify the needs of the staff. Always Often Usually Seldom Never
15. The staff’s views on the operational aspects of the institution are sought.
Always Often Usually Seldom Never
16. Decision-making is based on factual information in the university/institution.
Always Often Usually Seldom Never

290
Customer Focus & Satisfaction
17. The students have access to an office for their social and co-curricular activities.
Always Often Usually Seldom Never
18. Academic staff is involved in decision-making. Always Often Usually Seldom Never
19. There are arrangements for counseling and welfare support for the students and the teachers.
Always Often Usually Seldom Never
20. There is a comprehensive service to students on careers and the world of employment.
Always Often Usually Seldom Never
21. Financial support for poor but talented students is available.
Always Often Usually Seldom Never
22. A system for taking staff’s views exists at the university.
Always Often Usually Seldom Never
23. There is a system for taking the students’ views to improve quality.
Always Often Usually Seldom Never
24. The students provide feedback on the quality of the courses they study.
Always Often Usually Seldom Never
25. The students provide feedback on the quality of teaching.
Always Often Usually Seldom Never
Responsibility & Authority
26. A programme leader is identified. Always Often Usually Seldom Never
27. The roles of other staff involved in the programme are established.
Always Often Usually Seldom Never
28. Roles of staff involved in learning resources and technical support staff are identified.
Always Often Usually Seldom Never
29. There is job specification for the staff. Always Often Usually Seldom Never
Internal Communication
30. The staff is aware of quality assurance and control arrangements.
Always Often Usually Seldom Never
31. The staff is aware of the vision, mission and objectives of the institution.
Always Often Usually Seldom Never
32. The students are fully informed of their rights and responsibilities.
Always Often Usually Seldom Never
33. Details regarding the location and availability of all learning and physical resources such as buildings, playgrounds, libraries, IT labs etc., including those available off-site are provided to students.
Always Often Usually Seldom Never
34. Plans are communicated to the academic and the non-academic staff.
Always Often Usually Seldom Never
35. The staff is made aware of the appraisal. Always Often Usually Seldom Never
36. There is effective liaison between academic staff and learning resources staff.
Always Often Usually Seldom Never
Financial Resources
37. There is central support for research at the university. Always Often Usually Seldom Never
38. There is localised support for research at the university.
Always Often Usually Seldom Never

291
Human Resources
39. There is a liaison staff to support the students’ social & co-curricular activities.
Always Often Usually Seldom Never
40. The staff is sufficient in number. Always Often Usually Seldom Never
41. The staff is appropriately qualified. Always Often Usually Seldom Never
42. Learning resources staff is appropriately experienced. Always Often Usually Seldom Never
43. Learning resources staff is sufficient in number. Always Often Usually Seldom Never
44. Learning resources staff is appropriately qualified. Always Often Usually Seldom Never
45. There are sufficient human resources to support teaching and learning.
Always Often Usually Seldom Never
Training and Development
46. Development and training programme exists for non-academic staff.
Always Often Usually Seldom Never
47. There is a support for continuing professional development of academic staff.
Always Often Usually Seldom Never
48. Training and development needs of learning resources staff are identified.
Always Often Usually Seldom Never
Infrastructure
49. Sufficient health services are available at the campus. Always Often Usually Seldom Never
50. Sufficient emergency services are available at the campus.
Always Often Usually Seldom Never
51. The teachers have access to relevant and appropriate IT facilities including internet, application software and on- line databases.
Always Often Usually Seldom Never
52. There is overall strategy for learning resources and their development.
Always Often Usually Seldom Never
53. There are sufficient physical resources to support teaching and learning.
Always Often Usually Seldom Never
54. Accommodation for laboratories, library and IT is appropriate.
Always Often Usually Seldom Never
55. Hostel accommodation is available for the students. Always Often Usually Seldom Never
Work Environment
56. The teachers are encouraged to conduct research studies.
Always Often Usually Seldom Never
57. The university is an equal opportunity institution. Always Often Usually Seldom Never
58. Teachers are awarded for performing well. Always Often Usually Seldom Never
59. The teachers’ safety is ensured at the campus. Always Often Usually Seldom Never
60. Award is given to group/team rather than individuals to inculcate team spirit.
Always Often Usually Seldom Never
61. Convocation is held regularly and annually for awarding degrees to the students.
Always Often Usually Seldom Never

292
62. Environment and facilities at the hostels are satisfactory.
Always Often Usually Seldom Never
Programme Planning
63. Market research is conducted for the proposed programme by the institution.
Always Often Usually Seldom Never
64. A cost and benefit analysis for the proposed programme is conducted prior to consideration by the Institution.
Always Often Usually Seldom Never
65. Human resources are identified and addressed prior to the launching of the academic programme.
Always Often Usually Seldom Never
66. Physical resources are identified and addressed prior to the launching of the academic programme.
Always Often Usually Seldom Never
67. There is a programme committee with a defined composition and terms of reference to oversee the programme operation and evaluation.
Always Often Usually Seldom Never
68. Academic programme handbook identifying the following is available.
Always Often Usually Seldom Never
Programme Design
69. Programmes have clear aims & objectives. Always Often Usually Seldom Never
70. Objectives of programme regarding skills to be imparted are identified in advance.
Always Often Usually Seldom Never
71. Courses within the programme are clearly identified. Always Often Usually Seldom Never
72. All electives are identified and classified appropriately.
Always Often Usually Seldom Never
73. The mix of core, elective and basic science courses satisfies the institution’s rules and regulations.
Always Often Usually Seldom Never
74. The structures of the courses are coherent. Always Often Usually Seldom Never
75. Pre-requisites for each course are investigated and established.
Always Often Usually Seldom Never
76. The courses selected satisfy the range and depth of knowledge required for the relevant academic programme.
Always Often Usually Seldom Never
77. The subjects content are related to the programme aims and objectives.
Always Often Usually Seldom Never
78. The contents of selected courses are developed in such a way to ensure minimal overlap unless otherwise intended.
Always Often Usually Seldom Never
79. The academic depth for each course is decided based on the intended student entry.
Always Often Usually Seldom Never
80. Each course contents are developed after discussions with internal staff with expertise in that particular area.
Always Often Usually Seldom Never
81. Each course contents are developed after discussions with external staff with expertise in that particular area.
Always Often Usually Seldom Never
82. Total number of credits is established. Always Often Usually Seldom Never
83. There is arrangement for credit rating such that the students are not disadvantaged if they decide to opt out of the institution at any time.
Always Often Usually Seldom Never

293
84. The students’ progression routes are well defined. Always Often Usually Seldom Never
85. A year is broken down into specific periods of study i.e. semesters, terms.
Always Often Usually Seldom Never
86. Curriculum satisfies the academic requirements of the profession.
Always Often Usually Seldom Never
Teaching Processes
87. The programmes aims and objectives are understood by the staff.
Always Often Usually Seldom Never
88. The programme aims and objectives understood by are the students.
Always Often Usually Seldom Never
89. Delivery methodology of course is decided in advance.
Always Often Usually Seldom Never
90. Learning experiences of the students are relevant to employment.
Always Often Usually Seldom Never
91. Students are given opportunities to become involved in programme operation and take responsibility for their own learning.
Always Often Usually Seldom Never
92. The learning strategy clearly identifies teacher-centered & student-centered activities.
Always Often Usually Seldom Never
93. Teacher-centered & student-centered activities are planned before start of the programme.
Always Often Usually Seldom Never
Assessment Processes
94. The students’ assessment methodology for each course is determined in advance.
Always Often Usually Seldom Never
95. The assessment papers i.e. examinations and assignment briefs are prepared in accordance with the assessment requirements for the intended outcome.
Always Often Usually Seldom Never
96. The assessment ensures the students attain the required standards.
Always Often Usually Seldom Never
97. There is a students’ assessment criterion as well as grading criterion for each course/subject.
Always Often Usually Seldom Never
Students Induction Processes
98. There are planned arrangements for students’ admission and induction.
Always Often Usually Seldom Never
99. There are students’ selection criteria for the programme.
Always Often Usually Seldom Never
100. The students’ selection criteria for programmes are strictly followed.
Always Often Usually Seldom Never
101. All the staff is aware of these arrangements for admission.
Always Often Usually Seldom Never
102. The student entry and intended outcome of programmes and courses are carefully matched.
Always Often Usually Seldom Never
Process Management
103. Academic programmes are monitored for quality. Always Often Usually Seldom Never
104. Administrative support services are monitored for quality.
Always Often Usually Seldom Never

294
105. Feedback on the processes and procedures of the institution is received from the students.
Always Often Usually Seldom Never
106. There is an appraisal and peer review of staff, including teaching skills.
Always Often Usually Seldom Never
107. Programmes are compared with other institutions for quality.
Always Often Usually Seldom Never
108. The institution processes and procedures are compared with the best institutions for benchmarking.
Always Often Usually Seldom Never
Product Management
109. There is a systematic and progressive development &
assessment of achievement skills. Always Often Usually Seldom Never
110. There are clear arrangements to monitor students’ career development after graduation.
Always Often Usually Seldom Never
111. A programme evaluation is carried out at the completion.
Always Often Usually Seldom Never
112. The quality assurance system ensures curriculum review and development.
Always Often Usually Seldom Never
113. Programme evaluation is carried out at completion. Always Often Usually Seldom Never
114. There is an assessment schedule for the students so that they know what, when and how they are going to be assessed.
Always Often Usually Seldom Never
115. There are procedures for internal verification and evaluation of all aspects of assessment process.
Always Often Usually Seldom Never
116. There are clear procedures to ensure grades and certification awarded to students are fair and unbiased.
Always Often Usually Seldom Never
117. The students’ progression rates and non-completion rates are clearly identified.
Always Often Usually Seldom Never
118. In your view, which of the following Problems your institution is facing in enhancing the quality of education.
a. Lack of financial resources Yes To Some Extent No
b. Lack of physical resources (buildings, libraries, labs etc.)
Yes To Some Extent No
c. Lack of human resources (qualified teachers etc.) Yes To Some Extent No
d. Lack of adequate space Yes To Some Extent No
e. Lack of well-equipped libraries and labs Yes To Some Extent No
f. Out-dated curriculum Yes To Some Extent No
g. Poor governance Yes To Some Extent No
h. Resistance to change Yes To Some Extent No
i. Lack of facilities and poor pay structure for the teachers
Yes To Some Extent No
j. Lack of incentives for the teachers for professional growth and performance
Yes To Some Extent No
k. Lack of planning Yes To Some Extent No
l. Politics among both students and teachers Yes To Some Extent No
m. External interference in the affairs of the institution
Yes To Some Extent No

295
n. Favouritism and nepotism in decision making and appointment of staff and employees
Yes To Some Extent No
o. Lack of quality assurance system at the feeding colleges and schools
Yes To Some Extent No
p. Centralized decision making Yes To Some Extent No
q. Lack of communication between the teachers and the administration
Yes To Some Extent No
r. Lack of communication between the students and the administration
Yes To Some Extent No
119. Please write down the problems faced by your institution other than the above ones.
1. 2. 3. 4.
120. What are your suggestions for improving the quality of education in your institution?
1. 2. 3. 4.
Respondent’s Signature_____________________________
THANK YOU VERY MUCH FOR COMPLETING THE QUESTIONNAIRE.

296
QUESTIONNAIRE FOR THE TEACHERS
Research Topic:
“Developing A Total Quality Management Framework for Public Sector Universities in Pakistan.”
Personal Information: Name: _______________________________________ Age: ___________________________________________
Gender: ______________________________________ Qualifications: ____________________________________
Designation: ___________________________________ Institution’s Name: ________________________________
1. Please express your opinion by ticking ( ) the most appropriate box against each statement. 2. Please make sure you have completed all the items thoroughly.
Documentation Management
1. Details of learning activities and students’ personal development and leadership skills are available.
Always Often Usually Seldom Never
2. The records of students’ assessments are up to date and available.
Always Often Usually Seldom Never
3. Transfers in and out of programmes or courses are clearly reconsidered and recorded.
Always Often Usually Seldom Never
4. Record and statistical data of students’ progression are available.
Always Often Usually Seldom Never
Customer Focus & Satisfaction
5. Teaching staff is involved in decision-making. Always Often Usually Seldom Never
6. There are arrangements for counseling and welfare support for the teachers.
Always Often Usually Seldom Never
7. Teachers are provided opportunities to improve their qualifications.
Always Often Usually Seldom Never
8. The official of the university/institution are easily available to the teachers.
Always Often Usually Seldom Never
Infrastructure
9. Sufficient health services are available at the campus. Always Often Usually Seldom Never
10. Sufficient emergency services are available at the campus.
Always Often Usually Seldom Never
11. The teachers have access to relevant and appropriate IT facilities including internet, application software and on- line databases.
Always Often Usually Seldom Never
12. Hostel accommodation is available for the teachers Always Often Usually Seldom Never
Work Environment
13. The teachers are encouraged to conduct research studies.
Always Often Usually Seldom Never
14. Teachers are awarded for performing well. Always Often Usually Seldom Never

297
15. There are chances of promotion for the teachers from one scale to another
Always Often Usually Seldom Never
16. Teachers are getting enough remuneration. Always Often Usually Seldom Never
17. Upward mobility of the teachers is fair and merit based.
Always Often Usually Seldom Never
18. The teachers’ safety is ensured at the campus. Always Often Usually Seldom Never
Programme Design 19. Programmes have clear aims & objectives. Always Often Usually Seldom Never
20. Objectives of programme regarding skills to be imparted are identified in advance.
Always Often Usually Seldom Never
21. Courses within the programme are clearly identified. Always Often Usually Seldom Never
22. All electives are identified and classified appropriately.
Always Often Usually Seldom Never
23. The mix of core, elective and basic science courses satisfies the institution’s rules and regulations.
Always Often Usually Seldom Never
24. The structures of the courses are coherent. Always Often Usually Seldom Never
25. Pre-requisites for each course are investigated and established.
Always Often Usually Seldom Never
26. The contents of selected courses are developed in such a way to ensure minimal overlap unless otherwise intended.
Always Often Usually Seldom Never
27. Level of the courses, including elective subjects is decided before the start of the programme.
Always Often Usually Seldom Never
28. The courses selected satisfy the range and depth of knowledge required for the relevant academic programme.
Always Often Usually Seldom Never
29. The subjects content are related to the programme aims and objectives.
Always Often Usually Seldom Never
30. The academic depth for each course is decided based on the intended student entry.
Always Often Usually Seldom Never
31. Each course contents are developed after discussions with internal staff with expertise in that particular area.
Always Often Usually Seldom Never
32. Each course contents are developed after discussions with external staff with expertise in that particular area.
Always Often Usually Seldom Never
33. Total number of credits is established. Always Often Usually Seldom Never
34. There is arrangement for credit rating such that the students are not disadvantaged if they decide to opt out of the institution at any time.
Always Often Usually Seldom Never
35. The students’ progression routes are well defined. Always Often Usually Seldom Never
36. A year is broken down into specific periods of study i.e. semesters, terms.
Always Often Usually Seldom Never
37. Curriculum satisfies the academic requirements of the profession.
Always Often Usually Seldom Never

298
Teaching Processes
38. The programmes aims and objectives are understood by the teachers.
Always Often Usually Seldom Never
39. Delivery methodology of course is decided in advance.
Always Often Usually Seldom Never
40. Learning experiences of the students are relevant to employment.
Always Often Usually Seldom Never
41. Students are given opportunities to become involved in programme operation and take responsibility for their own learning.
Always Often Usually Seldom Never
42. The learning strategy clearly identifies teacher-centered & student-centered activities.
Always Often Usually Seldom Never
43. Teacher-centered & student-centered activities are planned before start of the programme.
Always Often Usually Seldom Never
44. Students are involved in teaching and encouraged to take part in discussion.
Always Often Usually Seldom Never
Assessment Processes
45. The students’ assessment methodology for each course is determined in advance.
Always Often Usually Seldom Never
46. The assessment papers i.e. examinations and assignment briefs are prepared in accordance with the assessment requirements for the intended outcome.
Always Often Usually Seldom Never
47. The assessment ensures the students attain the required standards.
Always Often Usually Seldom Never
48. There is a students’ assessment criterion as well as grading criterion for each course/subject.
Always Often Usually Seldom Never
49. Students assessed work is returned in time. Always Often Usually Seldom Never
50. Grading practice is explained to the students in advance.
Always Often Usually Seldom Never
51. Teachers provide useful feedback. Always Often Usually Seldom Never
Product Management
52. There is a systematic and progressive development & assessment of achievement skills.
Always Often Usually Seldom Never
53. The quality assurance system ensures curriculum review and development.
Always Often Usually Seldom Never
54. Programme evaluation is carried out at completion. Always Often Usually Seldom Never
55. There is an assessment schedule for the students so that they know what, when and how they are going to be assessed.
Always Often Usually Seldom Never
56. There are procedures for internal verification and evaluation of all aspects of assessment process.
Always Often Usually Seldom Never
57. There are clear procedures to ensure grades and certification awarded to students are fair and unbiased.
Always Often Usually Seldom Never
58. The students’ progression rates and non-completion rates are clearly identified.
Always Often Usually Seldom Never
59. There is gender discrimination in the assessment of the students.
Always Often Usually Seldom Never

299
60. In your view, which of the following Problems your institution is facing in enhancing the quality of education.
a. Lack of financial resources Yes To Some Extent No
b. Lack of physical resources (buildings, libraries, labs etc.)
Yes To Some Extent No
c. Lack of human resources (qualified teachers etc.)
Yes To Some Extent No
d. Lack of adequate space Yes To Some Extent No
e. Lack of well-equipped libraries and labs Yes To Some Extent No
f. Out-dated curriculum Yes To Some Extent No
g. Poor governance Yes To Some Extent No
h. Resistance to change Yes To Some Extent No
i. Lack of facilities and poor pay structure for the teachers
Yes To Some Extent No
j. Lack of incentives for the teachers for professional growth and performance
Yes To Some Extent No
k. Lack of planning Yes To Some Extent No
l. Politics among both students and teachers Yes To Some Extent No
m. External interference in the affairs of the institution
Yes To Some Extent No
n. Favouritism and nepotism in decision making and appointment of staff and employees
Yes To Some Extent No
o. Lack of quality assurance system at the feeding colleges and schools
Yes To Some Extent No
p. Centralized decision making Yes To Some Extent No
q. Lack of communication between the teachers and the administration
Yes To Some Extent No
r. Lack of communication between the students and the administration
Yes To Some Extent No
61. Please write down the problems faced by your institution other than the above ones.
1. 2. 3. 4.
62. What are your suggestions for improving the quality of education in your institution?
1. 2. 3. 4.
Respondent’s Signature_____________________________
THANK YOU VERY MUCH FOR COMPLETING THE QUESTIONNAIRE.

300
QUESTIONNAIRE FOR THE STUDENTS
Research Topic:
“Developing A Total Quality Management Framework for Public Sector Universities in Pakistan.”
Personal Information: Name: ________________________________________ Roll No: __________________________________________
Class:
_________________________________________ Department: _______________________________________
Session: _______________________________________ Institution’s Name: __________________________________
1. Please express your opinion by ticking ( ) the most appropriate box against each statement. 2. Please make sure you have completed all the items thoroughly.
Customer Focus & Satisfaction
1. The students have access to an office for their social and co-curricular activities.
Always Often Usually Seldom Never
2. Students are involved in decision-making. Always Often Usually Seldom Never
3. There are arrangements for counseling and welfare support for the students.
Always Often Usually Seldom Never
4. There is a comprehensive service to students on careers and the world of employment.
Always Often Usually Seldom Never
5. Financial support for poor but talented students is available.
Always Often Usually Seldom Never
6. The official of the university/institution are easily available to the students.
Always Often Usually Seldom Never
7. Class proceedings and activities are to the point and well directed.
Always Often Usually Seldom Never
8. Teachers provide useful feedback. Always Often Usually Seldom Never
9. Teachers’ attitude to the students’ queries is encouraging.
Always Often Usually Seldom Never
10. Teachers provide assistance to the students. Always Often Usually Seldom Never
11. Environment and facilities at the hostels are satisfactory.
Always Often Usually Seldom Never
Internal Communication
12. The students are fully informed of their rights and responsibilities.
Always Often Usually Seldom Never
13. Details regarding the location and availability of all learning and physical resources such as buildings, playgrounds, libraries, IT labs etc., including those available off-site are provided to students.
Always Often Usually Seldom Never
Infrastructure
14. Sufficient health services are available at the campus. Always Often Usually Seldom Never
15. Sufficient emergency services are available at the campus.
Always Often Usually Seldom Never

301
16. The students have access to relevant and appropriate IT facilities including internet, application software and on- line databases.
Always Often Usually Seldom Never
17. Accommodation for laboratories, library and IT is appropriate.
Always Often Usually Seldom Never
18. Transport facility is available to the day scholars who want to avail it.
Always Often Usually Seldom Never
19. Recreational facilities for the students are available at the campus.
Always Often Usually Seldom Never
20. Refreshment points with hygienic food and drinks are available for the students at the campus.
Always Often Usually Seldom Never
21. Hostel accommodation is available for the students and the teachers.
Always Often Usually Seldom Never
Programme Design
22. The courses are well organized. Always Often Usually Seldom Never
23. Overall contents of the courses are excellent Always Often Usually Seldom Never
24. The nature of the courses is intellectually challenging. Always Often Usually Seldom Never
Teaching Processes
25. Programmes have clear aims & objectives. Always Often Usually Seldom Never
26. The programme aims and objectives are understood by the students.
Always Often Usually Seldom Never
27. Learning experiences of the students are relevant to employment.
Always Often Usually Seldom Never
28. Students are given opportunities to become involved in programme operation and take responsibility for their own learning.
Always Often Usually Seldom Never
29. Students are involved in teaching and encouraged to take part in discussion.
Always Often Usually Seldom Never
Assessment Processes
30. The assessment ensures the students attain the required standards.
Always Often Usually Seldom Never
31. Students assessed work is returned in time. Always Often Usually Seldom Never
32. Grading practice is explained to the students in advance.
Always Often Usually Seldom Never
33. Teachers provide useful feedback. Always Often Usually Seldom Never
Product Management 34. There is an assessment schedule for the students so
that they know what, when and how they are going to be assessed.
Always Often Usually Seldom Never
35. There are clear procedures to ensure grades and certification awarded to students are fair and unbiased.
Always Often Usually Seldom Never
36. In your view, which of the following Problems your institution is facing in enhancing the quality of education.
a. Lack of financial resources Yes To Some Extent No
b. Lack of physical resources (buildings, libraries, labs etc.)
Yes To Some Extent No
c. Lack of human resources (qualified teachers etc.) Yes To Some Extent No
302
d. Lack of adequate space Yes To Some Extent No
e. Lack of well-equipped libraries and labs Yes To Some Extent No
f. Out-dated curriculum Yes To Some Extent No
g. Poor governance Yes To Some Extent No
h. Resistance to change Yes To Some Extent No
i. Lack of facilities and poor pay structure for the teachers
Yes To Some Extent No
j. Lack of incentives for the teachers for professional growth and performance
Yes To Some Extent No
k. Lack of planning Yes To Some Extent No
l. Politics among both students and teachers Yes To Some Extent No
m. External interference in the affairs of the institution
Yes To Some Extent No
n. Favouritism and nepotism in decision making and appointment of staff and employees
Yes To Some Extent No
o. Lack of quality assurance system at the feeding colleges and schools
Yes To Some Extent No
p. Centralized decision making Yes To Some Extent No
q. Lack of communication between the teachers and the administration
Yes To Some Extent No
r. Lack of communication between the students and the administration
Yes To Some Extent No
37. Please write down the problems faced by your institution other than the above ones.
1. 2. 3. 4.
38. What are your suggestions for improving the quality of education in your institution?
1. 2. 3. 4.
Respondent’s Signature_____________________________
THANK YOU VERY MUCH FOR COMPLETING THE QUESTIONNAIRE.

303
APPENDIX C
ISO 9001 CONTENTS
0.0 INTRODUCTION
0.1 General 0.2 Process Approach 0.3 Relationship with ISO 9004 0.4 Compatibility with other Management Systems(i.e. ISO 14001:1996 for Environment)
1.0 SCOPE
1.1 General 1.2 Application (Permissible Exclusions)
2.0 NORMATIVE REFERENCE 3.0 TERMS AND DEFINITIONS 4.0 QUALITY MANAGEMENT SYSTEM
4.1 General Requirements 4.2 Documentation Requirements
4.2.1 General 4.2.2 Quality Manual 4.2.3 Control of Documents 4.2.4 Control of Records
5.0 MANAGEMENT RESPONSIBILITY
5.1 Management Commitment 5.2 Customer Focus 5.3 Quality Policy 5.4 Planning
5.4.1 Quality Objectives 5.4.2 QMS Planning
5.5 Responsibility, Authority and Communication 5.5.1 Responsibility and Authority 5.5.2 Management Representative 5.5.3 Internal Communication
5.6 Management Review 5.6.1 General 5.6.2 Review Input 5.6.3 Review Output

304
6.0 RESOURCE MANAGEMENT
6.1 Provision of Resources 6.2 Human Resources
6.2.1 General 6.2.2 Competence, Awareness and Training
6.3 Infrastructure 6.4 Work Environment
7.0 PRODUCT REALISATION
7.1 Planning of Realisation 7.2 Customer-related Processes
7.2.1 Determination of Product Requirements 7.2.2 Review of Product Requirements 7.2.3 Customer Communication
7.3 Design and Development 7.3.1 Design and Development Planning 7.3.2 Design and Development Inputs 7.3.3 Design and Development Outputs 7.3.4 Design and Development Review 7.3.5 Design and Development Verification 7.3.6 Design and Development Validation 7.3.7 Control of Design and Development Changes
7.4 Purchasing 7.4.1 Purchasing Process 7.4.2 Purchasing Information 7.4.3 Verification of Purchased Product
7.5 Product and Service Provision 7.5.1 Control of Production & Service Provision 7.5.2 Validation of Processes for Production & Service Provision 7.5.3 Identification and Traceability 7.5.4 Customer Property 7.5.5 Preservation of Product
7.6 Control of Monitoring and Measuring Devices 8. MEASUREMENT, ANALYSIS AND IMPROVEMENT
8.1 General 8.2 Monitoring and Measurement
8.2.1 Customer Satisfaction 8.2.2 Internal Audit 8.2.3 Measurement and Monitoring Processes 8.2.4 Monitoring and Measurement of Product
8.3 Control of Non-conforming Product 8.4 Analysis of Data 8.5 Improvement
8.5.1 Continual Improvement 8.5.2 Corrective Action 8.5.3 Preventive Action

305
APPENDIX D
COVER LETTERS FOR THE RESPONDENTS
I - COVER LETTERS FOR VICE CHANCELLORS, REGISTRARS, DEANS
AND TEACHERS QUESTIONNAIRE
National University of Modern Languages Sector: H-9, Islamabad Cell # 03005764289 E-mail Add: [email protected] Dear Sir/Madam Subject: COMPLETION OF THE QUESTIONNAIRE FOR PhD RESEARCH I am a PhD student at National University of Modern Languages, Islamabad; working on the topic “Developing Total Quality Management Frame-work for Public Sector Universities in Pakistan”. This survey is part of my doctoral study. Please find enclosed a questionnaire meant for collecting data for the study and a self addressed & stamped envelope for return post. Total Quality Management (TQM), a philosophy, has been successfully implemented in business and industry and its principles are equally useful and applicable to educational institutions. TQM means:
Total: Everyone in the organization (university/Degree Awarding Institute) is involved (including customers (the students) and the suppliers (V.C., Registrar, faculty members etc.)
Quality: Customer (students) requirements are met exactly Management: Senior executives (V.C, Deans, and Registrar etc.) are fully
committed. Principles of TQM are:
a. Focus on the customers (students) b. Participation and teamwork c. Continuous improvement and learning d. Active leadership e. Top management commitment

306
You are requested to complete the questionnaire in the light of above mentioned conception of TQM in education and post it. I shall be personally obliged for this academic assistance. I assure you that the information provided and opinion expressed by you in the questionnaire will be kept confidential and will not be used for any other purpose except this research. In case you need the findings once the study is complete, please let me know. I am ready to share the findings of the study. Hope you will cooperate and send the completed questionnaire as soon as possible. Kind regards Faridullah Khan PhD Student

307
II - COVER LETTER FOR STUDENTS QUESTIONNAIRE
National University of Modern Languages
H-9, Islamabad
Cell # 03005764289
E-mail: [email protected]
Dear Student I am a PhD scholar at National University of Modern Languages, Islamabad; working on the topic “Developing Total Quality Management Frame-work for Public Sector Universities in Pakistan”. You are requested to complete the questionnaire. I shall be personally obliged for this academic assistance. I assure you that the information provided and opinion expressed by you in the questionnaire will be kept confidential and will not be used for any other purpose except this research.
Hope you will cooperate and complete the questionnaire.
Kind regards
Faridullah Khan
PhD Student

308
APPENDIX E
Respondents (Number)
Sex
Qualifications
Academic Ranks
Present Position Experience in Years
Career Experience in Years
Age in Years
Sample percen
tage F1
M2
Ph
D
M.S
c3 / M
.Ph
il
Mas
ter4
Pro
fess
or
Ass
ocia
te
Pro
fess
or
Ass
ista
nt
Pro
fess
or
Lec
ture
r
Mea
n
Med
ian
S.D
Min
.
Max
.
Mea
n
Med
ian
S.D
Min
.
Max
.
Mea
n
Med
ian
S.D
Min
.
Max
.
Vince-chancellors (25)
2 23 12 6 7 --- --- --- ---
2.8 2 1.8 1 8 25 31 13.6 3 53 51.1 57 12 38 69 1.63 %
8% 92% 48% 24% 28% --- --- --- ---
Deans (25)
3 22 21 4 --- --- --- --- ---
4.6 3 3.9 1 15 28 30 7.5 13 40 54.1 55 5.7 42 65 1.63 % 12% 88% 84% 16% --- --- --- --- ---
Registrars (25)
2 23 9 3 13 --- --- --- ---
3.2 3 1.8 1 8 20 19 9.6 5 38 46.9 45 9.5 29 62 1.63 % 8% 92% 36% 12% 52% --- --- --- ---
Teachers (378)
120 258 79 77 222 17 34 105 222 3.9 4 2.8 1 18 10 9 8.7 1 40 35.9 33 9.6 22 65 24.66%
32% 68% 21% 20% 59% 4% 9% 28% 59%
Students (1080)
435 645
--- --- --- --- --- --- --- --- --- --- -- --- --- --- --- --- --- 21.4 21 2.6 18 24 70.45%
40% 60%
1 F = Female 3 M.Sc = 16
+ Years of Education
2 M = Male 4 Master = 16 Years of Education

309
APPENDIX F
Table F1 Summary of Multiple Linear Regression Models -1 for Customer Focus and Satisfaction Based on Top Management’s Perceptions
Model R R Square Adjusted R Square Std. Error of the
Estimate
1 .518a .269 .259 .92570
2 .592b .350 .332 .87888
3 .654c .427 .403 .83080
4 .734d .538 .512 .75104
5 .758e .575 .544 .72620
Table F2 Summary of ANOVA for Customer Focus and Satisfaction Based on Top Management’s Perceptions
Model Sum of Squares df Mean Square F Sig.
1 Regression 23.000 1 23.000 26.841 .000a
Residual 62.555 73 .857
Total 85.555 74 2 Regression 29.939 2 14.970 19.380 .000b
Residual 55.616 72 .772
Total 85.555 74 3 Regression 36.549 3 12.183 17.651 .000c
Residual 49.006 71 .690
Total 85.555 74 4 Regression 46.071 4 11.518 20.420 .000d
Residual 39.484 70 .564
Total 85.555 74 5 Regression 49.167 5 9.833 18.646 .000e
Residual 36.388 69 .527
Total 85.555 74

310
Table F3 Summary of Customer Focus and Satisfaction Regression Coefficients as per Top Management’s Perceptions Model Unstandardized
Coefficients Standardized Coefficients
B Std.
Error Beta t Sig.
1 (Constant) .475 .639 .743 .460
Infrastructure .838 .162 .518 5.181 .000 2 (Constant) .565 .699 .809 .421
Infrastructure .598 .173 .370 3.450 .001
Teaching Processes .580 .194 .321 2.997 .004 3 (Constant) .229 .709 .323 .748
Infrastructure .815 .178 .504 4.573 .000
Teaching Processes .699 .187 .387 3.738 .000
Work Environment .516 .167 .328 3.095 .003 4 (Constant) .186 .641 .290 .772
Infrastructure .348 .197 .215 1.764 .082
Teaching Processes .828 .172 .459 4.819 .000
Work Environment .840 .170 .535 4.940 .000 Internal Communication
.708 .172 .521 4.109 .000
5 (Constant) .650 .709 -.916 .363
Infrastructure .391 .192 .242 2.041 .045
Teaching Processes .793 .167 .439 4.750 .000
Work Environment .863 .165 .550 5.240 .000 Internal Communication
.475 .192 .350 2.467 .016
Mgt. Commitment .441 .182 .255 2.423 .018

311
Table F4 Summary of Excluded Variables of Regression Models for Customer Focus and Satisfaction Based on Top Management’s Perceptions
Model Beta In t Sig.
1 Management Commitment .271a 2.539 .013 Responsibility and Authority .096a .931 .355 Training and Development .258a 2.209 .030 Work Environment .247a 2.189 .032 Teaching Processes .321a 2.997 .004 Monitoring & Measurement of Processes .174a 1.541 .128 Internal Communication .201a 1.466 .147
2 Management Commitment .256b 2.525 .014 Responsibility and Authority .086b .876 .384 Training and Development .179b 1.530 .131 Work Environment .328b 3.095 .003 Monitoring & Measurement of Processes .101b .905 .368 Internal Communication .230b 1.777 .080
3 Management Commitment .385c 4.078 .000 Responsibility and Authority .198c 2.085 .041 Training and Development .397c 3.456 .001 Monitoring & Measurement of Processes .486c 3.989 .000 Internal Communication .521c 4.109 .000
4 Management Commitment .255d 2.423 .018 Responsibility and Authority .061d .625 .534 Training and Development .252d 2.113 .038 Monitoring & Measurement of Processes .289d 1.923 .059
5 Responsibility and Authority .063e .592 .556 Training and Development .188e 1.550 .126 Monitoring & Measurement of Processes .218e 1.444 .153

312
APPENDIX G Table G1 Summary of Multiple Linear Regression Model-2 for Customer Focus and Satisfaction Based on Teachers’ Perceptions
Model R R Square Adjusted R
Square Std. Error of the Estimate
1 .625a .391 .387 .70058
2 .693b .480 .473 .64916
3 .709c .503 .494 .63659
Table G2 Summary of ANOVA for Customer Focus and Satisfaction Based on Teachers’ Perceptions
Model Sum of Squares df Mean Square F Sig.
1
Regression 49.066 1 49.066 99.970 .000a
Residual 76.567 156 .491
Total 125.633 157
2
Regression 60.315 2 30.158 71.565 .000b
Residual 65.317 155 .421
Total 125.633 157
3 Regression 63.224 3 21.075 52.005 .000c Residual 62.408 154 .405 Total 125.633 157

313
Table G3 Summary of Customer Focus and Satisfaction Regression Coefficients as per Teachers’ Perceptions
Model
Unstandardized Coefficients
Standardized Coefficients
B Std. Error Beta t Sig. 1 (Constant) 1.205 .205 5.889 .000
Work Environment .775 .078 .625 9.998 .000 2 (Constant) .668 .216 3.093 .002
Work Environment .576 .082 .464 7.067 .000 Teaching Processes .325 .063 .340 5.167 .000
3 (Constant) .394 .235 1.675 .096 Work Environment .516 .083 .416 6.206 .000 Teaching Processes .296 .063 .310 4.731 .000
Infrastructure .177 .066 .167 2.679 .008
Table G4 Summary of Excluded Variables of Regression Models for Customer Focus and Satisfaction Based on Teachers’ Perceptions
Model Beta In t Sig.
1 Infrastructure .217a 3.321 .001
Documentation Management .155a 2.130 .035
Program Design .295a 4.368 .000 Teaching Processes .340a 5.167 .000 Assessment Processes .159a 2.399 .018 Monitoring Measurement of Product .155a 2.112 .036
2 Infrastructure .167b 2.679 .008
Documentation Management -.065b -.788 .432
Program Design .064b .587 .558
Assessment Processes -.075b -.927 .355
Monitoring Measurement of Product -.087b -1.020 .309 3 Documentation Management -.075c -.924 .357
Program Design .025c .227 .821
Assessment Processes -.038c -.470 .639
Monitoring Measurement of Product -.070c -.836 .405
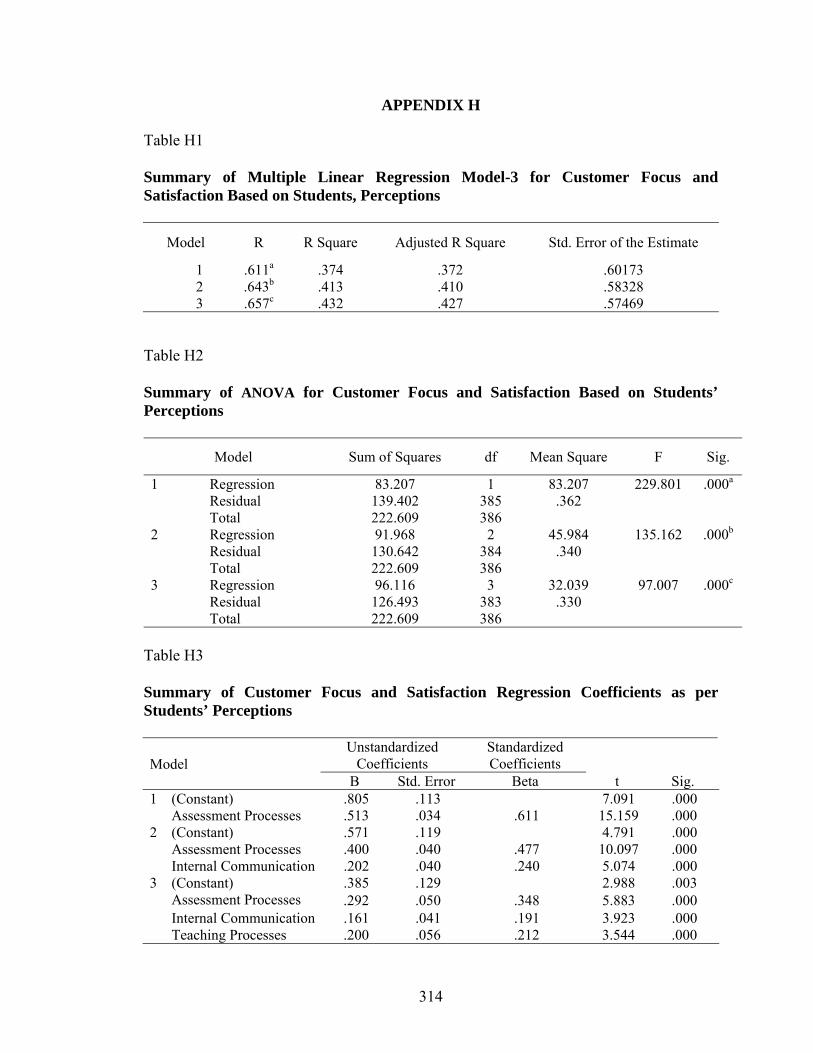
314
APPENDIX H
Table H1 Summary of Multiple Linear Regression Model-3 for Customer Focus and Satisfaction Based on Students, Perceptions
Model R R Square Adjusted R Square Std. Error of the Estimate
1 .611a .374 .372 .60173 2 .643b .413 .410 .58328 3 .657c .432 .427 .57469
Table H2 Summary of ANOVA for Customer Focus and Satisfaction Based on Students’ Perceptions
Model Sum of Squares df Mean Square F Sig.
1 Regression 83.207 1 83.207 229.801 .000a Residual 139.402 385 .362 Total 222.609 386
2 Regression 91.968 2 45.984 135.162 .000b Residual 130.642 384 .340 Total 222.609 386
3 Regression 96.116 3 32.039 97.007 .000c Residual 126.493 383 .330 Total 222.609 386
Table H3 Summary of Customer Focus and Satisfaction Regression Coefficients as per Students’ Perceptions
Model Unstandardized
Coefficients Standardized Coefficients
B Std. Error Beta t Sig. 1 (Constant) .805 .113 7.091 .000
Assessment Processes .513 .034 .611 15.159 .000 2 (Constant) .571 .119 4.791 .000
Assessment Processes .400 .040 .477 10.097 .000 Internal Communication .202 .040 .240 5.074 .000
3 (Constant) .385 .129 2.988 .003 Assessment Processes .292 .050 .348 5.883 .000 Internal Communication .161 .041 .191 3.923 .000 Teaching Processes .200 .056 .212 3.544 .000

315
Table H4 Summary of Excluded Variables of Regression Models for Customer Focus and Satisfaction Based on Students’ Perceptions
Model Beta In t Sig.
1 Internal Communication .240a 5.074 .000
Infrastructure .135a 3.232 .001
Program Design .137a 2.500 .013
Teaching Processes .279a 4.779 .000 2 Infrastructure .079b 1.851 .065
Program Design .058b 1.024 .307 Teaching Processes .212b 3.544 .000
3 Infrastructure .070c 1.646 .101 Program Design -.041c -.663 .508

316
APPENDIX I
Table I1 Top Management’s Perception Regarding Documentation Management
N Mean Std.
Deviation
Std.
Error
95% Confidence Interval for Mean Minimum Maximum
Lower Bound Upper Bound VC 25 3.73 1.14 0.23 3.26 4.20 1.86 5.00
Registrar 25 3.46 1.37 0.27 2.90 4.03 1.00 5.00
Dean 25 2.80 0.68 0.14 2.52 3.08 1.57 3.86
Total 75 3.33 1.16 0.13 3.07 3.60 1.00 5.00
Table I2
Top Management’s Perception Regarding Management Commitment
N Mean Std.
Deviation
Std.
Error
95% Confidence Interval for Mean Minimum Maximum
Lower Bound Upper Bound VC 25 4.02 0.60 0.12 3.77 4.27 2.18 4.82
Registrar 25 3.97 0.64 0.13 3.70 4.24 2.27 4.82
Dean 25 4.08 0.64 0.13 3.81 4.34 2.00 4.60
Total 75 4.02 0.62 0.07 3.88 4.17 2.00 4.82
Table I3 Top Management’s Perception Regarding Customer Focus and Satisfaction
N Mean Std.
Deviation
Std.
Error
95% Confidence Interval for Mean Minimum Maximum
Lower Bound Upper Bound VC 25 3.56 0.83 0.17 3.22 3.90 1.85 5.00
Registrar 25 2.89 0.58 0.12 2.65 3.13 1.92 3.85
Dean 25 3.48 1.06 0.21 3.05 3.92 1.69 5.00
Total 75 3.31 0.89 0.10 3.11 3.52 1.69 5.00
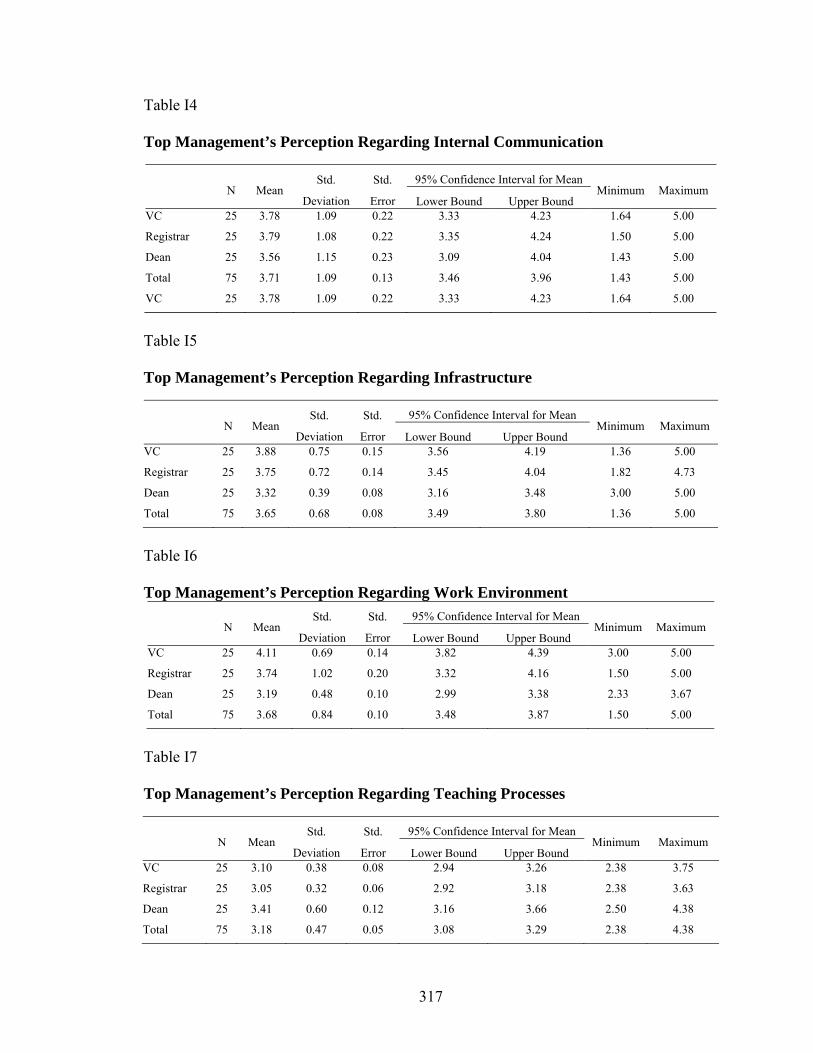
317
Table I4 Top Management’s Perception Regarding Internal Communication
N Mean Std.
Deviation
Std.
Error
95% Confidence Interval for Mean Minimum Maximum
Lower Bound Upper Bound VC 25 3.78 1.09 0.22 3.33 4.23 1.64 5.00
Registrar 25 3.79 1.08 0.22 3.35 4.24 1.50 5.00
Dean 25 3.56 1.15 0.23 3.09 4.04 1.43 5.00
Total 75 3.71 1.09 0.13 3.46 3.96 1.43 5.00
VC 25 3.78 1.09 0.22 3.33 4.23 1.64 5.00
Table I5 Top Management’s Perception Regarding Infrastructure
N Mean Std.
Deviation
Std.
Error
95% Confidence Interval for Mean Minimum Maximum
Lower Bound Upper Bound VC 25 3.88 0.75 0.15 3.56 4.19 1.36 5.00
Registrar 25 3.75 0.72 0.14 3.45 4.04 1.82 4.73
Dean 25 3.32 0.39 0.08 3.16 3.48 3.00 5.00
Total 75 3.65 0.68 0.08 3.49 3.80 1.36 5.00
Table I6 Top Management’s Perception Regarding Work Environment
N Mean Std.
Deviation
Std.
Error
95% Confidence Interval for Mean Minimum Maximum
Lower Bound Upper Bound VC 25 4.11 0.69 0.14 3.82 4.39 3.00 5.00
Registrar 25 3.74 1.02 0.20 3.32 4.16 1.50 5.00
Dean 25 3.19 0.48 0.10 2.99 3.38 2.33 3.67
Total 75 3.68 0.84 0.10 3.48 3.87 1.50 5.00
Table I7 Top Management’s Perception Regarding Teaching Processes
N Mean Std.
Deviation
Std.
Error
95% Confidence Interval for Mean Minimum Maximum
Lower Bound Upper Bound VC 25 3.10 0.38 0.08 2.94 3.26 2.38 3.75
Registrar 25 3.05 0.32 0.06 2.92 3.18 2.38 3.63
Dean 25 3.41 0.60 0.12 3.16 3.66 2.50 4.38
Total 75 3.18 0.47 0.05 3.08 3.29 2.38 4.38

318
Table I8 Teachers’ Perception Regarding Documentation Management
N Mean Std.
Deviation
Std.
Error
95% Confidence Interval for Mean Minimum Maximum
Lower Bound Upper Bound UET Peshawar 18 3.90 1.02 0.32 3.17 4.63 2.00 5.00
UET Kuzdar 17 2.95 0.96 0.30 2.27 3.63 2.00 5.00
UET Taxila 15 4.07 1.17 0.44 2.99 5.15 2.00 5.00
UET NED Karachi 17 4.33 0.87 0.29 3.67 5.00 3.00 5.00
.Agri. Uni. Faisal Abad 12 4.40 0.42 0.19 3.88 4.92 4.00 5.00
Agri. Uni. Peshawar 15 3.95 0.55 0.17 3.56 4.34 3.00 5.00
Arid Agri. Uni. R-pindi 14 3.43 0.67 0.25 2.81 4.05 3.00 5.00
Federal Urdu University 18 2.17 0.61 0.20 1.70 2.64 2.00 4.00
BZU Multan 14 3.57 0.73 0.28 2.89 4.25 3.00 5.00
COMSATS 17 3.91 0.83 0.20 3.48 4.34 2.00 5.00
Gomal Uni. DIK 12 2.80 1.04 0.46 1.51 4.09 1.00 4.00
Islmiya Uni. Bahawalpur 12 3.50 0.61 0.27 2.74 4.26 3.00 4.00
L.C.W. Uni. Lahore 15 3.15 1.27 0.40 2.24 4.06 1.00 5.00
Uni. of Peshawar 15 3.10 0.74 0.23 2.57 3.63 2.00 4.00
Hazara University 15 2.70 1.03 0.33 1.96 3.44 2.00 4.00
Education Uni. Lahore 10 2.88 0.85 0.43 1.52 4.23 2.00 4.00
Uni. of Balochistan 16 3.50 1.04 0.37 2.63 4.37 3.00 5.00
Bahria Uni. 15 4.20 0.68 0.21 3.72 4.68 3.00 5.00
University of Faisalabad 16 3.91 0.83 0.20 3.48 4.34 2.00 5.00
G.C. University Lahore 15 2.80 1.04 0.46 1.51 4.09 1.00 4.00
Balochistan University
Info. Tech. Mgt. 18 3.50 0.61 0.27 2.74 4.26 3.00 4.00
Sindh Agri University 15 3.15 1.27 0.40 2.24 4.06 1.00 5.00
Quaid-e-Awam Uni 17 3.10 0.74 0.23 2.57 3.63 2.00 4.00
Uni. of Sargodha 15 2.25 0.35 0.25 -0.93 5.43 2.00 3.00
Uni. of AJk 15 4.17 0.76 0.44 2.27 6.06 4.00 5.00
Total 378 3.49 1.03 0.08 3.33 3.66 1.00 5.00

319
Table I9 Teachers’ Perception Regarding Customer Focus and Satisfaction
N Mean Std.
Deviation
Std.
Error
95% Confidence Interval for Mean Minimum Maximum
Lower Bound Upper Bound UET Peshawar 18 3.00 0.75 0.24 2.46 3.54 1.67 4.33
UET Kuzdar 17 2.80 0.39 0.12 2.52 3.08 2.33 3.33
UET Taxila 15 3.67 0.75 0.28 2.98 4.36 3.00 5.00
UET NED Karachi 17 4.07 0.64 0.21 3.58 4.57 3.00 5.00
.Agri. Uni. Faisal Abad 12 3.20 0.96 0.43 2.01 4.39 2.00 4.33
Agri. Uni. Peshawar 15 3.37 0.94 0.30 2.70 4.04 2.00 5.00
Arid Agri. Uni. R-pindi 14 3.33 0.90 0.34 2.50 4.17 2.33 5.00
Federal Urdu University 18 2.22 0.41 0.14 1.91 2.54 1.67 3.00
BZU Multan 14 3.43 0.76 0.29 2.72 4.13 2.33 4.33
COMSATS 17 3.51 0.87 0.21 3.06 3.96 1.67 5.00
Gomal Uni. DIK 12 3.47 0.51 0.23 2.84 4.09 2.67 4.00
Islmiya Uni. Bahawalpur 12 2.67 0.62 0.28 1.89 3.44 1.67 3.33
L.C.W. Uni. Lahore 15 3.40 1.40 0.44 2.40 4.40 1.33 5.00
Uni. of Peshawar 15 2.67 0.77 0.24 2.12 3.22 1.67 4.00
Hazara University 15 2.87 0.91 0.29 2.22 3.51 1.67 4.00
Education Uni. Lahore 10 2.83 0.84 0.42 1.50 4.17 1.67 3.67
Uni. of Balochistan 16 2.75 0.58 0.21 2.26 3.24 2.33 4.00
Bahria Uni. 15 3.50 1.02 0.32 2.77 4.23 1.67 5.00
University of Faisalabad 16 2.75 0.58 0.21 2.26 3.24 2.33 4.00
G.C. University Lahore 15 2.67 0.77 0.24 2.12 3.22 1.67 4.00
Balochistan University
Info. Tech. Mgt. 18 2.22 0.41 0.14 1.91 2.54 1.67 3.00
Sindh Agri University 15 3.67 0.75 0.28 2.98 4.36 3.00 5.00
Quaid-e-Awam Uni 17 3.51 0.87 0.21 3.06 3.96 1.67 5.00
Uni. of Sargodha 15 3.17 0.71 0.50 -3.19 9.52 2.67 3.67
Uni. of AJk 15 3.22 0.84 0.48 1.14 5.31 2.33 4.00
Total 378 3.17 0.89 0.07 3.03 3.31 1.33 5.00

320
Table I10 Teachers’ Perception Regarding Infrastructure
N Mean Std.
Deviation
Std.
Error
95% Confidence Interval for Mean Minimum Maximum
Lower Bound Upper Bound UET Peshawar 18 3.52 0.43 0.14 3.21 3.83 3.00 4.20
UET Kuzdar 17 3.24 0.75 0.24 2.70 3.78 2.00 5.00
UET Taxila 15 3.89 0.30 0.11 3.61 4.17 3.40 4.20
UET NED Karachi 17 4.04 0.49 0.16 3.67 4.42 3.20 4.80
.Agri. Uni. Faisal Abad 12 3.36 0.61 0.27 2.61 4.11 2.40 4.00
Agri. Uni. Peshawar 15 3.14 0.54 0.17 2.75 3.53 2.40 4.00
Arid Agri. Uni. R-pindi 14 2.74 0.64 0.24 2.15 3.33 2.20 4.00
Federal Urdu University. 18 1.96 0.60 0.20 1.50 2.42 1.20 3.00
BZU Multan 14 3.03 0.72 0.27 2.37 3.69 2.00 4.00
COMSATS 17 2.54 0.60 0.15 2.23 2.85 1.60 3.60
Gomal Uni. DIK 12 4.08 0.64 0.29 3.28 4.88 3.00 4.60
Islmiya Uni. Bahawalpur 12 3.60 0.51 0.23 2.97 4.23 2.80 4.20
L.C.W. Uni. Lahore 15 2.14 0.68 0.22 1.65 2.63 1.20 2.80
Uni. of Peshawar 15 2.86 0.65 0.21 2.39 3.33 2.00 3.80
Hazara University 15 2.74 0.75 0.24 2.20 3.28 1.60 4.00
Education Uni. Lahore 10 2.20 0.82 0.41 0.90 3.50 1.60 3.40
Uni. of Balochistan 16 2.48 0.74 0.26 1.86 3.09 1.60 3.80
Bahria Uni. 15 2.56 0.63 0.20 2.11 3.01 1.80 3.60
University of Faisalabad 16 2.48 0.74 0.26 1.86 3.09 1.60 3.80
G.C. University Lahore 15 2.74 0.75 0.24 2.20 3.28 1.60 4.00
Balochistan University
Info. Tech. Mgt. 18 1.96 0.60 0.20 1.50 2.42 1.20 3.00
Sindh Agri University 15 2.74 0.75 0.24 2.20 3.28 1.60 4.00
Quaid-e-Awam Uni 17 2.54 0.60 0.15 2.23 2.85 1.60 3.60
Uni. of Sargodha 15 3.20 0.28 0.20 0.66 5.74 3.00 3.40
Uni. of AJk 15 2.27 0.90 0.52 0.03 4.51 1.40 3.20
Total 378 2.94 0.84 0.07 2.80 3.07 1.20 5.00

321
Table I11
Teachers’ Perception Regarding Work Environment
N Mean Std.
Deviation
Std.
Error
95% Confidence Interval for Mean Minimum Maximum
Lower Bound Upper Bound UET Peshawar 18 2.72 0.53 0.17 2.34 3.10 1.80 3.40
UET Kuzdar 17 1.96 0.26 0.08 1.77 2.15 1.80 2.60
UET Taxila 15 3.26 0.65 0.25 2.66 3.86 2.00 3.80
UET NED Karachi 17 3.11 0.58 0.19 2.66 3.56 2.40 4.00
.Agri. Uni. Faisal Abad 12 2.76 0.62 0.28 1.99 3.53 1.80 3.40
Agri. Uni. Peshawar 15 2.58 0.68 0.22 2.09 3.07 1.60 3.60
Arid Agri. Uni. R-pindi 14 2.29 0.69 0.26 1.65 2.93 1.60 3.60
Federal Urdu University. 18 1.87 0.28 0.09 1.65 2.08 1.40 2.40
BZU Multan 14 3.11 0.34 0.13 2.80 3.43 2.60 3.60
COMSATS 17 3.01 0.67 0.16 2.67 3.36 1.80 4.20
Gomal Uni. DIK 12 2.84 0.33 0.15 2.43 3.25 2.40 3.20
Islmiya Uni. Bahawalpur 12 1.76 0.38 0.17 1.28 2.24 1.20 2.20
L.C.W. Uni. Lahore 15 2.00 0.48 0.15 1.66 2.34 1.40 2.80
Uni. of Peshawar 15 2.00 0.27 0.08 1.81 2.19 1.60 2.40
Hazara University 15 2.26 0.68 0.22 1.77 2.75 1.40 3.40
Education Uni. Lahore 10 2.05 0.53 0.26 1.21 2.89 1.60 2.80
Uni. of Balochistan 16 2.05 0.55 0.20 1.59 2.51 1.60 3.00
Bahria Uni. 15 3.34 0.56 0.18 2.94 3.74 2.40 4.20
University of Faisalabad 16 2.05 0.55 0.20 1.59 2.51 1.60 3.00
G.C. University Lahore 15 2.00 0.48 0.15 1.66 2.34 1.40 2.80
Balochistan University
Info. Tech. Mgt. 18 1.87 0.28 0.09 1.65 2.08 1.40 2.40
Sindh Agri University 15 2.00 0.48 0.15 1.66 2.34 1.40 2.80
Quaid-e-Awam Uni 17 3.01 0.67 0.16 2.67 3.36 1.80 4.20
Uni. of Sargodha 15 2.50 0.42 0.30 -1.31 6.31 2.20 2.80
Uni. of AJk 15 3.13 0.58 0.33 1.70 4.57 2.80 3.80
Total 378 2.54 0.72 0.06 2.42 2.65 1.20 4.20
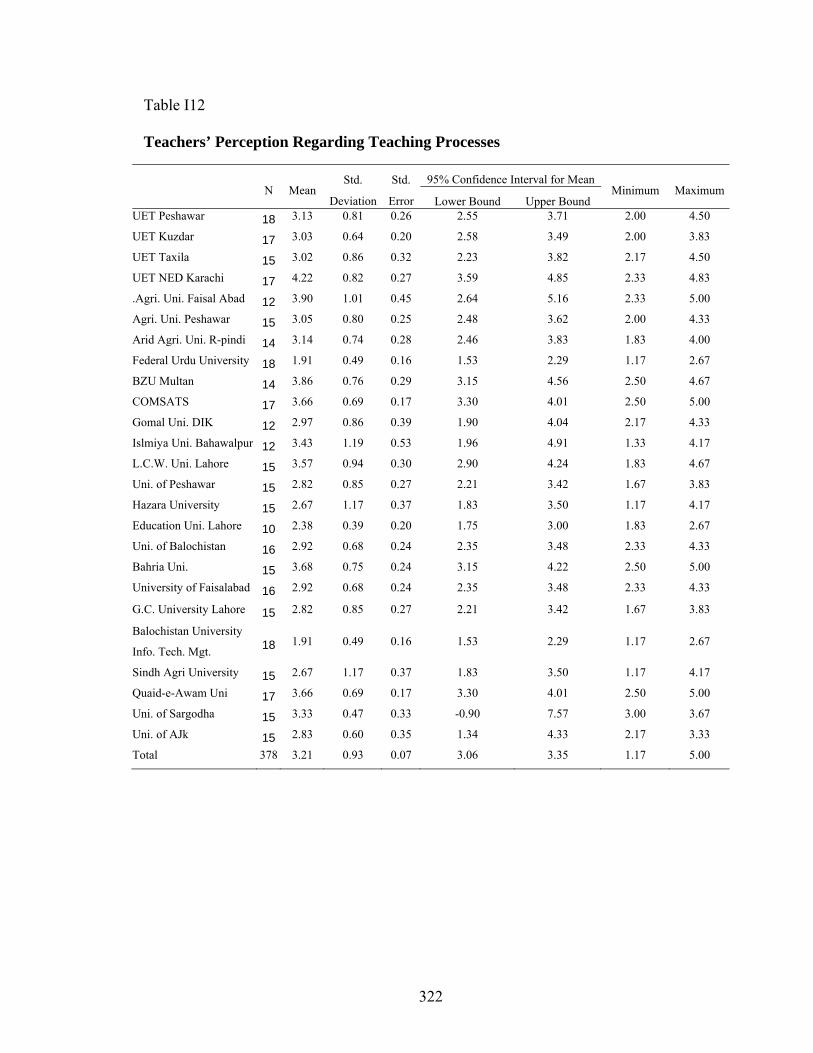
322
Table I12 Teachers’ Perception Regarding Teaching Processes
N Mean Std.
Deviation
Std.
Error
95% Confidence Interval for Mean Minimum Maximum
Lower Bound Upper Bound UET Peshawar 18 3.13 0.81 0.26 2.55 3.71 2.00 4.50
UET Kuzdar 17 3.03 0.64 0.20 2.58 3.49 2.00 3.83
UET Taxila 15 3.02 0.86 0.32 2.23 3.82 2.17 4.50
UET NED Karachi 17 4.22 0.82 0.27 3.59 4.85 2.33 4.83
.Agri. Uni. Faisal Abad 12 3.90 1.01 0.45 2.64 5.16 2.33 5.00
Agri. Uni. Peshawar 15 3.05 0.80 0.25 2.48 3.62 2.00 4.33
Arid Agri. Uni. R-pindi 14 3.14 0.74 0.28 2.46 3.83 1.83 4.00
Federal Urdu University 18 1.91 0.49 0.16 1.53 2.29 1.17 2.67
BZU Multan 14 3.86 0.76 0.29 3.15 4.56 2.50 4.67
COMSATS 17 3.66 0.69 0.17 3.30 4.01 2.50 5.00
Gomal Uni. DIK 12 2.97 0.86 0.39 1.90 4.04 2.17 4.33
Islmiya Uni. Bahawalpur 12 3.43 1.19 0.53 1.96 4.91 1.33 4.17
L.C.W. Uni. Lahore 15 3.57 0.94 0.30 2.90 4.24 1.83 4.67
Uni. of Peshawar 15 2.82 0.85 0.27 2.21 3.42 1.67 3.83
Hazara University 15 2.67 1.17 0.37 1.83 3.50 1.17 4.17
Education Uni. Lahore 10 2.38 0.39 0.20 1.75 3.00 1.83 2.67
Uni. of Balochistan 16 2.92 0.68 0.24 2.35 3.48 2.33 4.33
Bahria Uni. 15 3.68 0.75 0.24 3.15 4.22 2.50 5.00
University of Faisalabad 16 2.92 0.68 0.24 2.35 3.48 2.33 4.33
G.C. University Lahore 15 2.82 0.85 0.27 2.21 3.42 1.67 3.83
Balochistan University
Info. Tech. Mgt. 18 1.91 0.49 0.16 1.53 2.29 1.17 2.67
Sindh Agri University 15 2.67 1.17 0.37 1.83 3.50 1.17 4.17
Quaid-e-Awam Uni 17 3.66 0.69 0.17 3.30 4.01 2.50 5.00
Uni. of Sargodha 15 3.33 0.47 0.33 -0.90 7.57 3.00 3.67
Uni. of AJk 15 2.83 0.60 0.35 1.34 4.33 2.17 3.33
Total 378 3.21 0.93 0.07 3.06 3.35 1.17 5.00
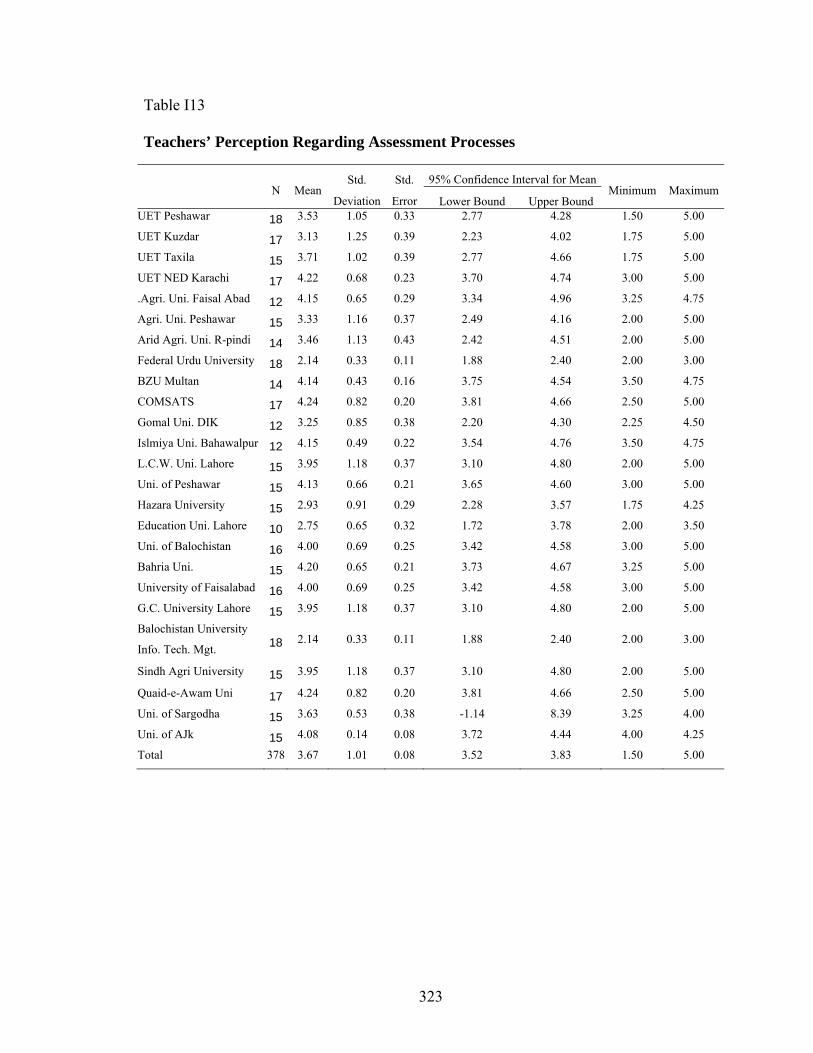
323
Table I13 Teachers’ Perception Regarding Assessment Processes
N Mean Std.
Deviation
Std.
Error
95% Confidence Interval for Mean Minimum Maximum
Lower Bound Upper Bound UET Peshawar 18 3.53 1.05 0.33 2.77 4.28 1.50 5.00
UET Kuzdar 17 3.13 1.25 0.39 2.23 4.02 1.75 5.00
UET Taxila 15 3.71 1.02 0.39 2.77 4.66 1.75 5.00
UET NED Karachi 17 4.22 0.68 0.23 3.70 4.74 3.00 5.00
.Agri. Uni. Faisal Abad 12 4.15 0.65 0.29 3.34 4.96 3.25 4.75
Agri. Uni. Peshawar 15 3.33 1.16 0.37 2.49 4.16 2.00 5.00
Arid Agri. Uni. R-pindi 14 3.46 1.13 0.43 2.42 4.51 2.00 5.00
Federal Urdu University 18 2.14 0.33 0.11 1.88 2.40 2.00 3.00
BZU Multan 14 4.14 0.43 0.16 3.75 4.54 3.50 4.75
COMSATS 17 4.24 0.82 0.20 3.81 4.66 2.50 5.00
Gomal Uni. DIK 12 3.25 0.85 0.38 2.20 4.30 2.25 4.50
Islmiya Uni. Bahawalpur 12 4.15 0.49 0.22 3.54 4.76 3.50 4.75
L.C.W. Uni. Lahore 15 3.95 1.18 0.37 3.10 4.80 2.00 5.00
Uni. of Peshawar 15 4.13 0.66 0.21 3.65 4.60 3.00 5.00
Hazara University 15 2.93 0.91 0.29 2.28 3.57 1.75 4.25
Education Uni. Lahore 10 2.75 0.65 0.32 1.72 3.78 2.00 3.50
Uni. of Balochistan 16 4.00 0.69 0.25 3.42 4.58 3.00 5.00
Bahria Uni. 15 4.20 0.65 0.21 3.73 4.67 3.25 5.00
University of Faisalabad 16 4.00 0.69 0.25 3.42 4.58 3.00 5.00
G.C. University Lahore 15 3.95 1.18 0.37 3.10 4.80 2.00 5.00
Balochistan University
Info. Tech. Mgt. 18 2.14 0.33 0.11 1.88 2.40 2.00 3.00
Sindh Agri University 15 3.95 1.18 0.37 3.10 4.80 2.00 5.00
Quaid-e-Awam Uni 17 4.24 0.82 0.20 3.81 4.66 2.50 5.00
Uni. of Sargodha 15 3.63 0.53 0.38 -1.14 8.39 3.25 4.00
Uni. of AJk 15 4.08 0.14 0.08 3.72 4.44 4.00 4.25
Total 378 3.67 1.01 0.08 3.52 3.83 1.50 5.00

324
Table I14 Students’ Perception Regarding Customer Focus and Satisfaction
N Mean Std.
Deviation
Std.
Error
95% Confidence Interval for Mean Minimum Maximum
Lower Bound Upper Bound UET Peshawar 45 2.19 0.64 0.15 1.87 2.51 1.20 3.60
UET Kuzdar 47 2.50 0.58 0.13 2.23 2.77 1.60 3.80
UET Taxila 53 2.44 0.84 0.20 2.03 2.86 1.20 4.00
UET NED Karachi 50 2.82 0.58 0.14 2.53 3.11 1.80 3.60
.Agri. Uni. Faisal Abad 36 2.53 0.26 0.08 2.37 2.70 2.20 3.20
Agri. Uni. Peshawar 50 2.19 0.64 0.15 1.87 2.51 1.20 3.60
Arid Agri. Uni. R-pindi 45 2.32 0.54 0.12 2.07 2.57 1.20 3.40
Federal Urdu University 56 2.01 0.97 0.22 1.56 2.47 1.00 4.20
BZU Multan 53 2.38 0.64 0.12 2.14 2.62 1.00 4.20
COMSATS 50 2.26 0.71 0.11 2.03 2.49 1.00 3.60
Gomal Uni. DIK 36 2.44 0.72 0.17 2.08 2.80 1.40 3.60
Islmiya Uni. Bahawalpur 42 1.84 0.54 0.13 1.56 2.12 1.20 3.00
L.C.W. Uni. Lahore 55 2.20 0.66 0.15 1.88 2.52 1.00 3.40
Uni. of Peshawar 55 2.27 0.64 0.15 1.95 2.59 1.20 3.60
Hazara University 41 3.04 0.81 0.20 2.61 3.47 1.40 4.20
Education Uni. Lahore 55 2.82 0.74 0.16 2.48 3.16 1.40 4.00
Uni. of Balochistan 35 3.16 0.69 0.19 2.76 3.56 1.40 4.20
Bahria Uni. 42 2.82 0.84 0.20 2.39 3.26 1.40 4.00
University of Faisalabad 30 2.01 0.97 0.22 1.56 2.47 1.00 4.20
G.C. University Lahore 32 2.38 0.64 0.12 2.14 2.62 1.00 4.20
Balochistan University
Info. Tech. Mgt. 30 2.26 0.71 0.11 2.03 2.49 1.00 3.60
Sindh Agri University 25 2.44 0.72 0.17 2.08 2.80 1.40 3.60
Quaid-e-Awam Uni 30 1.84 0.54 0.13 1.56 2.12 1.20 3.00
Uni. of Sargodha 50 2.88 0.86 0.19 2.48 3.28 1.60 4.20
Uni. of AJk 37 2.65 0.76 0.20 2.23 3.07 1.80 4.20
Total 1080 2.46 0.76 0.04 2.39 2.54 1.00 4.20

325
Table I15 Students’ Perception Regarding Internal Communication
N Mean Std.
Deviation
Std.
Error
95% Confidence Interval for Mean Minimum Maximum
Lower Bound Upper Bound UET Peshawar 45 2.76 0.86 0.20 2.33 3.19 1.00 4.00
UET Kuzdar 47 2.43 0.91 0.20 2.01 2.86 1.00 4.33
UET Taxila 53 2.91 0.65 0.15 2.58 3.23 2.00 4.33
UET NED Karachi 50 3.30 0.72 0.17 2.94 3.66 1.67 4.33
.Agri. Uni. Faisal Abad 36 3.33 0.60 0.17 2.95 3.72 2.33 4.00
Agri. Uni. Peshawar 50 2.76 0.86 0.20 2.33 3.19 1.00 4.00
Arid Agri. Uni. R-pindi 45 3.30 0.87 0.19 2.89 3.71 1.33 4.33
Federal Urdu University 56 2.43 0.95 0.21 1.99 2.88 1.00 4.33
BZU Multan 53 2.93 0.94 0.17 2.58 3.28 1.00 4.33
COMSATS 50 2.87 0.97 0.16 2.56 3.19 1.00 4.33
Gomal Uni. DIK 36 2.72 0.89 0.21 2.28 3.16 1.00 4.00
Islmiya Uni. Bahawalpur 42 2.55 0.53 0.13 2.28 2.82 1.33 3.67
L.C.W. Uni. Lahore 55 2.84 0.84 0.19 2.44 3.25 1.67 4.33
Uni. of Peshawar 55 2.76 0.86 0.20 2.33 3.19 1.00 4.00
Hazara University 41 3.38 1.10 0.28 2.79 3.96 1.00 4.33
Education Uni. Lahore 55 3.32 0.80 0.18 2.94 3.69 1.33 4.33
Uni. of Balochistan 35 3.43 0.87 0.23 2.93 3.93 2.00 4.33
Bahria Uni. 42 2.98 0.69 0.17 2.62 3.34 1.67 4.33
University of Faisalabad 30 3.30 0.87 0.19 2.89 3.71 1.33 4.33
G.C. University Lahore 32 2.43 0.95 0.21 1.99 2.88 1.00 4.33
Balochistan University
Info. Tech. Mgt. 30 2.93 0.94 0.17 2.58 3.28 1.00 4.33
Sindh Agri University 25 2.87 0.97 0.16 2.56 3.19 1.00 4.33
Quaid-e-Awam Uni 30 2.72 0.89 0.21 2.28 3.16 1.00 4.00
Uni. of Sargodha 50 3.48 0.89 0.20 3.06 3.90 1.00 4.33
Uni. of AJk 37 3.00 1.02 0.26 2.43 3.57 1.33 4.33
Total 1080 2.96 0.90 0.05 2.87 3.05 1.00 4.33

326
Table I16 Students’ Perception Regarding Infrastructure
N Mean Std.
Deviation
Std.
Error
95% Confidence Interval for Mean Minimum Maximum
Lower Bound Upper Bound UET Peshawar 45 2.79 0.34 0.08 2.62 2.96 2.17 3.44
UET Kuzdar 47 2.58 0.35 0.08 2.42 2.74 1.94 3.33
UET Taxila 53 2.91 0.38 0.09 2.72 3.10 2.11 3.50
UET NED Karachi 50 2.98 0.33 0.08 2.81 3.14 2.28 3.44
.Agri. Uni. Faisal Abad 36 2.51 0.48 0.14 2.21 2.82 2.00 3.11
Agri. Uni. Peshawar 50 2.79 0.34 0.08 2.62 2.96 2.17 3.44
Arid Agri. Uni. R-pindi 45 2.72 0.43 0.10 2.51 2.92 1.89 3.39
Federal Urdu
University 56 2.29 0.42 0.09 2.10 2.49 1.72 3.56
BZU Multan 53 2.91 0.44 0.08 2.75 3.08 1.61 3.67
COMSATS 50 2.23 0.36 0.06 2.11 2.34 1.61 2.94
Gomal Uni. DIK 36 2.55 0.35 0.08 2.38 2.73 2.00 3.33
Islmiya Uni.
Bahawalpur 42 2.46 0.20 0.05 2.36 2.56 2.11 2.94
L.C.W. Uni. Lahore 55 2.49 0.47 0.11 2.27 2.72 1.83 3.22
Uni. of Peshawar 55 2.77 0.34 0.08 2.60 2.94 2.17 3.44
Hazara University 41 1.98 0.61 0.15 1.66 2.30 1.22 3.56
Education Uni. Lahore 55 2.20 0.60 0.13 1.92 2.48 1.44 3.00
Uni. of Balochistan 35 2.65 0.74 0.20 2.23 3.08 1.50 3.56
Bahria Uni. 42 2.53 0.42 0.10 2.32 2.75 1.78 3.17
University of
Faisalabad 30 2.98 0.33 0.08 2.81 3.14 2.28 3.44
G.C. University Lahore 32 2.51 0.48 0.14 2.21 2.82 2.00 3.11
Balochistan University
Info. Tech. Mgt. 30 2.79 0.34 0.08 2.62 2.96 2.17 3.44
Sindh Agri University 25 2.72 0.43 0.10 2.51 2.92 1.89 3.39
Quaid-e-Awam Uni 30 2.29 0.42 0.09 2.10 2.49 1.72 3.56
Uni. of Sargodha 50 3.09 0.34 0.08 2.93 3.25 2.56 3.61
Uni. of AJk 37 2.52 0.51 0.13 2.23 2.80 1.89 3.56
Total 1080 2.59 0.51 0.03 2.54 2.64 1.22 3.67

327
Table I17 Students’ Perception Regarding Teaching Processes
N Mean Std.
Deviation
Std.
Error
95% Confidence Interval for Mean Minimum Maximum
Lower Bound Upper Bound UET Peshawar 45 3.29 0.57 0.13 3.01 3.58 2.23 4.15
UET Kuzdar 47 2.71 0.53 0.12 2.46 2.96 1.85 3.77
UET Taxila 53 3.34 0.91 0.21 2.89 3.79 1.85 4.62
UET NED Karachi 50 3.16 0.40 0.09 2.96 3.36 2.46 3.77
.Agri. Uni. Faisal Abad 36 3.49 0.37 0.11 3.26 3.73 3.00 3.92
Agri. Uni. Peshawar 50 3.29 0.57 0.13 3.01 3.58 2.23 4.15
Arid Agri. Uni. R-pindi 45 3.68 0.70 0.16 3.36 4.01 2.00 4.77
Federal Urdu University 56 2.55 0.82 0.18 2.16 2.93 1.31 4.15
BZU Multan 53 3.15 0.77 0.14 2.86 3.43 1.92 4.46
COMSATS 50 3.31 0.70 0.11 3.08 3.53 1.77 4.54
Gomal Uni. DIK 36 2.85 1.02 0.24 2.34 3.35 1.62 4.31
Islmiya Uni. Bahawalpur 42 2.66 0.52 0.13 2.39 2.93 1.69 3.31
L.C.W. Uni. Lahore 55 3.58 0.43 0.10 3.38 3.79 2.85 4.23
Uni. of Peshawar 55 3.29 0.57 0.13 3.01 3.58 2.23 4.15
Hazara University 41 3.86 0.42 0.10 3.63 4.08 2.85 4.31
Education Uni. Lahore 55 3.78 1.25 0.28 3.19 4.36 2.15 8.08
Uni. of Balochistan 35 3.99 0.66 0.18 3.61 4.38 2.46 4.85
Bahria Uni. 42 3.31 0.88 0.21 2.86 3.76 1.38 4.46
University of Faisalabad 30 3.68 0.70 0.16 3.36 4.01 2.00 4.77
G.C. University Lahore 32 2.55 0.82 0.18 2.16 2.93 1.31 4.15
Balochistan University
Info. Tech. Mgt. 30 3.15 0.77 0.14 2.86 3.43 1.92 4.46
Sindh Agri University 25 3.31 0.70 0.11 3.08 3.53 1.77 4.54
Quaid-e-Awam Uni 30 2.85 1.02 0.24 2.34 3.35 1.62 4.31
Uni. of Sargodha 50 3.82 0.79 0.18 3.45 4.19 2.46 4.92
Uni. of AJk 37 3.27 0.79 0.20 2.84 3.71 1.85 4.38
Total 1080 3.30 0.81 0.04 3.22 3.38 1.31 8.08

328
Table I18 Students’ Perception Regarding Assessment Processes
N MeanStd.
Deviation
Std.
Error
95% Confidence Interval for Mean Minimum Maximum
Lower Bound Upper Bound UET Peshawar 45 3.14 0.78 0.18 2.75 3.53 1.75 4.63
UET Kuzdar 47 2.84 0.75 0.17 2.49 3.19 1.38 4.50
UET Taxila 53 3.03 1.01 0.24 2.53 3.54 1.50 4.38
UET NED Karachi 50 3.38 0.67 0.16 3.04 3.71 2.38 4.25
.Agri. Uni. Faisal Abad 36 3.25 0.31 0.09 3.05 3.45 2.88 3.63
Agri. Uni. Peshawar 50 3.14 0.78 0.18 2.75 3.53 1.75 4.63
Arid Agri. Uni. R-pindi 45 3.41 0.83 0.18 3.02 3.79 1.88 4.75
Federal Urdu University 56 2.39 1.27 0.28 1.79 2.98 1.00 5.00
BZU Multan 53 2.81 0.88 0.16 2.48 3.14 1.13 5.00
COMSATS 50 3.46 0.71 0.11 3.23 3.69 2.13 4.50
Gomal Uni. DIK 36 2.84 0.89 0.21 2.40 3.28 1.88 4.50
Islmiya Uni. Bahawalpur 42 2.54 0.92 0.22 2.06 3.01 1.13 4.00
L.C.W. Uni. Lahore 55 3.45 0.54 0.12 3.19 3.71 2.50 4.63
Uni. of Peshawar 55 3.23 0.80 0.19 2.83 3.63 1.75 4.75
Hazara University 41 3.85 0.84 0.21 3.40 4.30 2.50 5.00
Education Uni. Lahore 55 3.82 0.68 0.15 3.50 4.14 2.50 4.88
Uni. of Balochistan 35 3.96 0.72 0.19 3.55 4.38 2.00 5.00
Bahria Uni. 42 3.24 0.84 0.20 2.81 3.68 1.75 4.63
University of Faisalabad 30 2.81 0.88 0.16 2.48 3.14 1.13 5.00
G.C. University Lahore 32 3.46 0.71 0.11 3.23 3.69 2.13 4.50
Balochistan University
Info. Tech. Mgt. 30 2.84 0.89 0.21 2.40 3.28 1.88 4.50
Sindh Agri University 25 2.54 0.92 0.22 2.06 3.01 1.13 4.00
Quaid-e-Awam Uni 30 3.45 0.54 0.12 3.19 3.71 2.50 4.63
Uni. of Sargodha 50 3.61 1.03 0.23 3.12 4.09 2.13 5.00
Uni. of AJk 37 3.39 0.87 0.22 2.91 3.87 1.88 4.75
Total 1080 3.23 0.91 0.05 3.14 3.32 1.00 5.00

329
APPENDIX J
Strategy Matrix for Answering Research Questions and Achieving Research Objectives

330
APPENDIX K
Table K1 Internal Consistency of the Vice-chancellor Questionnaire
Construct No. of Items Cronbach Alpha
Documentation Management 4 .935
Management Commitment 8 .788
Customer Focus & Satisfaction 9 .725
Responsibility & Authority 4 .868
Internal Communication 8 .825
Financial Resource 3 .754
Training & Development 3 .679
Infrastructure 10 .780
Work Environment 9 .605
Teaching Processes 4 .650
Processes Management 7 .701
Product Management 5 .670
Total 74 .958

331
Table K2 Internal Consistency of the Registrar Questionnaire
Construct No. of Items Cronbach Alpha
Documentation Management 4 .754
Management Commitment 9 .876
Customer Focus & Satisfaction 9 .625
Responsibility & Authority 4 .667
Internal Communication 8 .854
Human Resource 3 .647
Training & Development 3 .574
Infrastructure 7 .680
Work Environment 7 .784
Academic Programme Planning 4 .746
Teaching Processes 4 .685
Processes Management 6 .882
Product Management 5 .843
Total 73 .977

332
Table K3 Internal Consistency of the Dean Questionnaire
Construct No. of Items Cronbach Alpha
Documentation Management 8 .747
Management Commitment 8 .814
Customer Focus & Satisfaction 9 .895
Responsibility & Authority 4 .766
Internal Communication 7 .756
Financial Resources 2 .859
Human Resources 7 .688
Training & Development 3 .778
Infrastructure 7 .724
Work Environment 7 .764
Programme Planning 6 .695
Programme Design 18 .945
Teaching Processes 7 .873
Assessment Processes 4 .922
Student Induction Processes 5 .841
Processes Management 6 .782
Product Management 9 .898
Total 117 .975

333
Table K4 Internal Consistency of the Teachers Questionnaire
Construct No. of Items Cronbach Alpha
Documentation Management 4 .663
Customer Focus & Satisfaction 4 .632
Infrastructure 4 .641
Work Environment 6 .751
Programme Design 19 .929
Teaching Processes 7 .847
Assessment Processes 7 .881
Product Management 8 .688
Total 59 .958
Table K5 Internal Consistency of the Students Questionnaire
Construct No. of Items Cronbach Alpha
Customer Focus & Satisfaction 11 .782
Internal Communication 2 .717
Infrastructure 8 .762
Programme Design 3 .642
Teaching Processes 5 .626
Assessment Processes 4 .743
Product Management 2 .654
Total 35 .918

334
APPENDIX L
LIST OF THE UNIVERSITIES PARTICIPATED IN THE SURVEY
Islamabad Capital Territory (ICT)
1. Bahria University, Islamabad
2. COMSATS Institute of Information Technology
Khyber-Pukhtunkhawa
1. University of Hazara
2. University of Peshawar
3. Gomal University, D.I. Khan
4. University of Agriculture, Peshawar
5. University of Engineering & Technology, Peshawar
Punjab
1. University of Sargodha
2. University of Faisalabad
3. University of Education, Lahore
4. Islamia University, Bahawalpur
5. Govt. College University, Lahore
6. University of Agriculture, Faisalabad.
7. Lahore College for Women University
8. Baha-ud-Din Zakariya University, Multan
9. University of Arid Agriculture, Rawalpindi
10. University of Engineering & Technology, Taxila
Balochistan
1. Balochistan University
2. Balochistan University of Engineering & Technology, Khuzdar
3. Balochistan University of Information Technology & Management Sciences

335
Sindh
1. Sindh Agriculture University, Tandojam
2. NED University of Engineering & Technology
3. Quaid-e-Awam University of Engineering, Science and Technology
4. Federal Urdu University of Arts, Sciences and Technology, Karachi
Azad Jammu & Kashmir
1. Azad Jammu & Kashmir University

336
APPENDIX M
Figure L1: Affinity Diagram: Causes of the faculty abandoning of an institute
Figure L2: Tree Diagram: How to improve academic performance

337
Queries Week 6Monday Tuesday Wednesday Thursday Friday Total
Study material availability / / 2
Timetable query / // 3
Assignment due date /// / // /// ///// / 15
Extension to assignment ///// // /// / / ///// ///// /// 25
Assignment cover sheet /// //// // / ///// ///// // 22
Contact number of lecturer /// ///// ///// / //// ///// /// 26
Lecturer availability ///// / // /// ///// // ///// / 24
Problem with laboratory computers
/ /// /// ///// // 14
Exam dates / 1
Other / //// // ///// / 13
Figure L3: Check Sheet: Queries received at the reception of a university faculty
Figure L4: Histogram: Normal distribution

338
Figure L5: Histogram: Right skewed distribution
Figure L6: Pareto Chart: Students failing in different modules

339
Figure L7: Cause and Effect Diagram: Causes of poor examination performance
Figure L8: Control Chart: Number of errors in students class assignments
Poor exam performance
Classes Study material
Teaching Organisation
Bad time of day
Clash with another class
Not well prepared
Does not know subject material
Poorly written
Arrived late
Poor explanations
Too expensive
No planning
Busy social life
Not interesting
Absent regularly
Too many late nights
Not available outside class
Watching TV

340
Figure L9: Flowchart of the photocopying process
Figure L10: Deming’s Cycle of Continuous Improvement