developing a scale for self-regulated l2 learning strategy use · developing a scale for...
TRANSCRIPT

e-ISSN: 2536-4758 http://www.efdergi.hacettepe.edu.tr/
Hacettepe Üniversitesi Eğitim Fakültesi Dergisi (H. U. Journal of Education) 33(2): 337-352 [2018]
doi: 10.16986/HUJE.2017033805 [Araştırma Makalesi / Research Article]
Developing a Scale for Self-Regulated L2 Learning Strategy Use
Öz-Düzenlemeli Yabancı Dil Öğrenme Strateji Kullanımı Ölçeği'nin
Geliştirilmesi*
Dinçay KÖKSAL**
, Sinem DÜNDAR***
Received: 29.07.2017 Accepted: 06.11.2017 Published: 02.04.2018
ABSTRACT: This study aims to develop a scale on the use of self-regulated L2 learning strategies based on
Oxford's (2011) Strategic Self-Regulation (S2R) Model. The study was conducted with 305 (232 female, 73 male)
participants. In order to determine construct validity, EFA and CFA were applied. Depending on the results of EFA,
the scale is composed of 35 items on a 4 point Likert type embedded in 6 dimensions (the total variance explained is
41.625%, factor loadings of 35 items vary from .80 to .35.). CFA confirmed the results of EFA, and the findings
showed that the model had acceptable fit (χ2/ df=1298.61/545). The corrected item total correlation values of items in
the scale range from .44 to .76. The results of t-test with top 27% and bottom 27% groups revealed that the
differences are significant (p<.05) for all items and factors. The overall reliability of the model demonstrated that the
model is acceptable with a Cronbach’s alpha statistic of 0.85. The findings reveal that the scale is a valid and reliable
instrument which can be used to identify L2 learners' strategy preferences and to what extent they use them in
language education contexts.
Keywords: Self-Regulated L2 Learning Strategies, the Strategic Self-Regulation (S2R) Model, Foreign Languages
Education, Scale Development
ÖZ: Bu çalışmanın amacı, Oxford (2011) tarafından geliştirilen Stratejik Öz-Düzenleme Modeli'ne dayanarak öz-
düzenlemeli yabancı dil öğrenme stratejisi kullanımına ilişkin bir ölçek geliştirmektir. Araştırma, 305 (232 kız, 73
erkek) öğrencinin katılımıyla gerçekleşmiştir. Ölçeğin yapı geçerliliğini belirlemek için açımlayıcı ve doğrulayıcı
faktör analizleri uygulanmıştır. Açımlayıcı faktör analizi sonuçlarına göre ölçek altı alt boyuttan ve dörtlü Likert tipi
35 maddeden oluşmuştur (Ölçeğin açıkladığı toplam varyans miktarı 41.625%, maddelerin faktör yük değerleri .80
ile .35 arasında değişmektedir). Doğrulayıcı faktör analiz sonuçları, ölçeğin açımlayıcı faktör analiz sonuçlarını
doğrulamıştır ve bulgular modelin uygun olduğunu göstermiştir (χ2/ df=1298.61/545). Ölçeğin düzeltilmiş madde
toplam korelasyonları .44 ve .76 arasında değişmektedir. Üst %27 ve alt %27 grupları ile yapılan t-test sonuçları,
farkların tüm madde ve faktörler için anlamlı olduğunu ortaya koymuştur (p<.05). Ölçeğin Cronbach Alfa iç tutarlılık
katsayısı 0.85 olarak belirlenmiştir. Çalışmanın bulguları, Öz-Düzenlemeli Yabancı Dil Öğrenme Strateji Kullanımı
Ölçeği'nin, yabancı dil öğrenenlerinin strateji tercihlerini belirlemede ve bu stratejileri yabancı dil eğitimi bağlamında
ne derecede kullandıklarını tespit etmekte yararlanılacak geçerli ve güvenilir bir ölçme aracı olduğunu göstermiştir.
Anahtar Kelimeler: Öz-Düzenlemeli Yabancı Dil Öğrenme Stratejileri, Stratejik Öz-Düzenleme Modeli, Yabancı
Dil Eğitimi, Ölçek Geliştirme
1. INTRODUCTION
In the field of Foreign Language Education (FLE), there has been an attempt to develop
theories, methods and approaches (i.e. Grammar Translation Method, Audiolingualism, the
Communicative Approach) over the years (Griffiths, 2013), and these developments have
mainly focused on the teaching standpoint of the education process. In this context, language
educators have attached importance to teaching dimension of foreign languages by suggesting
* This study is the part of the doctoral dissertation titled: "Investigating Factors related to the Use of Self-Regulated
L2 Learning Strategies in a Foreign Language Education Context" submitted to the Graduate School of Educational
Sciences, ÇOMU. ** Prof. Dr., Çanakkale Onsekiz Mart University, Faculty of Education, Çanakkale, TURKEY. e-mail:
[email protected] (ORCID: 0000-0002-8681-4093) *** Res. Assist. Dr., Trakya University, Faculty of Education, Edirne, TURKEY. e-mail: [email protected]
(ORCID: 0000-0001-5076-2087)
Dinçay Köksal, Sinem Dündar
e-ISSN: 2536-4758 http://www.efdergi.hacettepe.edu.tr/
338
different activities for teaching language skills; hence "how to become a good teacher" has been
mainly the focus of FLE contexts.
Accordingly, departments of FLE have been offering prospective foreign language (FL)
teachers education on how to teach the target language more effectively in their future
professions. However, it is crucial to bear in mind that prospective FL teachers are the learners
of the target language they are going to teach as well. As they go through an FLE process, the
experiences they gain, or how they deal with the difficulties they face in language learning
process may affect or construct their future teaching practices. However, studies about
experiences and difficulties that L2 (second or foreign language) learners as prospective FL
teachers have in language learning process, have been neglected so far; hence, it becomes
primarily significant to seek out how prospective FL teachers manage to deal with L2 they are
going to teach, apart from the methodologies they are going to apply for teaching the target
language.
In this sense, self-regulation, as a new concept, has been the recent research interest of
various scholars. "Self-regulation" is broadly defined as the degree to which learners actively
participate in their learning (Dörnyei, 2005). It is "a more dynamic concept than learning
strategy, highlighting the learners' own strategic efforts to manage their own achievement
through specific beliefs and processes" (Zimmerman & Risemberg, 1997, p.105). This means
that self-regulated learners, as the name implies, take control and responsibility of their learning
process. Active roles taken enable learners to become autonomous. So, they improve themselves
in their learning situations.
Self-regulated learning is considered enabling learners to individually trigger and
maintain cognitions, affects, and behaviors that are thoroughly oriented to the achievement of
their learning objectives (Schunk & Zimmerman, 2008). Thus, self -regulation is considered
separate from mental capability. Instead, as suggested by Zimmerman (2001, p.1) , it is "the
self-directive process through which learners transform their mental abilities into task-related
academic skills." In this context, self-regulated learning provides learners not only efficiently
carry out the task and control himself or herself but also engage in the learning environment
(Oxford, 2011).
It is well-accepted that Oxford (1990) is one of the most foremost researchers dealing
with learning strategies in the field of language studies, and her taxonomy related to language
learning strategies (LLS) has been the most outstanding one in the literature so far. Oxford
(1990) divided LLS into two main categories as "direct strategies" and "indirect strategies".
Direct strategies involve memory strategies (e.g. grouping, associating/ elaborating, placing new
words into a context), cognitive strategies (e.g. repeating, taking notes, summarizing), and
compensation strategies (e.g. getting help, switching to the mother tongue, using a
circumlocution or synonym). On the other hand, indirect strategies include metacognitive
strategies (e.g. paying attention, organizing, setting goals and objectives), affective strategies
(e.g. rewarding oneself, using music, making positive statements) and social strategies (e.g.
cooperating with peers, asking for clarification, and asking for correction) (Oxford, 1990, p. 17)
In 2011, Oxford updated her taxonomy and the current the Strategic Self-Regulation
(S2R) Model is comprised of three major dimensions: cognitive, affective and sociocultural-
Interactive (SI).
Cognitive Strategies help the learner construct, transform, and apply L2 knowledge.
The S2R Model includes six cognitive strategies as "Using the Senses to Understand and
Remember, Activating Knowledge, Reasoning, Conceptualizing with Details, Conceptualizing
Broadly, and Going beyond the Immediate Data." (Oxford, 2011, p. 46)

Developing a Scale for Self-Regulated L2 Learning Strategy Use 339
e-ISSN: 2536-4758 http://www.efdergi.hacettepe.edu.tr/
Affective Strategies offer the learner some assistance with creating positive feelings
and manner, and keep motivated. There are two affective strategies in the S2R Model are
"Activating Supportive Emotions, Beliefs, and Attitudes, and Generating and Maintaining
Motivation." (Oxford, 2011, p. 64)
SI Strategies help the learner with communication, sociocultural contexts, identity,
and power. They enable learners to interact and collaborate with others, ask for help, maintain
social interaction when knowledge gaps occur as well. Three strategies included in the new
model are "Interacting to Learn and Communicate, Overcoming Knowledge Gaps in
Communicating, Dealing with Sociocultural Contexts and Identities." (Oxford, 2011, p. 88)
Apart from these three major strategies, three types of metastrategies are included in each
dimension; metacognitive, meta-affective, and meta-SI strategies:
Metacognitive Strategies provide the learner to control cognitive strategy use. These
strategies are extremely employed by proficient L2 learners at the whole stages of proficiency.
There are eight metacognitive strategies in the new model as "Paying Attention to Cognition,
Planning for Cognition, Obtaining, and Using Resources for Cognition, Organizing for
Cognition, Implementing Plans for Cognition, Orchestrating Cognitive Strategy Use,
Monitoring Cognition, Evaluating Cognition." (Oxford, 2011, p.45)
Meta-affective Strategies facilitate learner control of affective strategy use. L2
learners are considered as both being cognitive information-processing mechanisms and having
certain feelings, beliefs, attitudes, and motivations. The eight meta-affective strategies included
in the model are "Paying Attention to Affect, Planning for affect, Obtaining and Using
Resources for Affect, Organizing for Affect, Implementing Plans for Affect, Orchestrating
Affective Strategy Use, Monitoring Affect, and Evaluating Affect." (Oxford, 2011, p. 63)
Meta-SI Strategies enable the learner to control SI strategy use. There are eight meta-
SI strategies as "Paying Attention to Contexts, Communication, and Culture, Planning for
Contexts, Communication, and Culture, Obtaining and Using Resources for Contexts,
Communication, and Culture, Organizing for Contexts, Communication, and Culture,
Implementing Plans for Contexts, Communication, and Culture, Orchestrating Strategies for
Contexts, Communication, and Culture, Monitoring for Contexts, Communication, and Culture,
and Evaluating Contexts, Communication, and Culture." (Oxford, 2011, p. 87).
The S2R Model relies upon research on strategically self-regulated learners. In her book
titled Teaching and Researching Language Learning Strategies, Oxford (2011) outlines the
characteristics of these learners as follows:
strategically self-regulated learners actively participate in their own learning; achieve
learning goals by controlling various aspects of their learning; regulate their cognitive and
affective states (covert self-regulation), their observable performance (behavioural self-
regulation), and the environmental conditions for learning (environmental self-regulation);
use strategies to control their own beliefs about learning and themselves; cognitively move
from declarative (conscious) knowledge to procedural (automatic) knowledge with the use
of strategies; choose appropriate strategies for different conditions, purposes, situations
and settings; understand that no strategy is necessarily appropriate under very
circumstance or for every purpose; and show awareness of the relationship between
strategy use and learning outcomes (2011, p.15).
Hence, it can be inferred that self-regulated learners are conscious and take necessary
steps in their studies that make them improve in their life-long learning process. It is important
to become aware of the self-regulated L2 learning strategies used by L2 learners in FLE
contexts to understand how learners deal with the target language and whether strategy use lead
to a successful L2 learning process or not. In the literature, the most well-known self-regulated
learning assessment instruments are the Motivated Strategies for Learning Questionnaire
Dinçay Köksal, Sinem Dündar
e-ISSN: 2536-4758 http://www.efdergi.hacettepe.edu.tr/
340
(MSLQ) (Pintrich, Smith, Garcia & McKeachie, 1991) and the Learning and Strategies
Inventory (LASSI) (Weinstein & Palmer, 1990). These two instruments were developed to
investigate students’ motivational orientations, self-regulation and their learning strategy types.
On the other hand, Oxford (1990) developed Strategy Inventory for Language Learning (SILL)
which is the most commonly used instrument in the field of language learning and teaching to
identify strategy use of students studying English as a second or foreign language.
Although, there have been recent studies related to scale development on self-regulated
learning strategy use in Turkish context (Çelik, 2012; Kadıoğlu, Uzuntiryaki & Aydın, 2011;
Turan, 2009), there isn’t any scale for determining the self-regulated L2 learning strategy use of
learners, particularly in the field of FLE. For this reason, it is assumed that this study will fill the
gap in the literature by introducing a valid and reliable scale which will be helpful for language
educators and L2 learners in terms of determining self-regulated L2 learning strategy use and
understanding to what extent they are employed in Turkish FLE contexts. Furthermore, it is
supposed that the study will provide an enlightening and helpful instrument for researchers to
conduct further studies on the use of self-regulated L2 learning strategies.
2. METHOD
This study aims to develop a reliable and valid scale on the use of self-regulated L2
learning strategies based on Oxford's (2011) S2R Model. In this sense, on the basis of the scale
development procedures that have been suggested in the literature; item generation, content
validity, draft form administration, construct validity, and internal consistency assessment steps
were implemented during the development of the Self-Regulated L2 Learning Strategy Use
Scale.
2.1. Participants
The participants included in the scale development phase were based on a simple random
sample of 305 L2 learners attending to the Department of FLE at Trakya University. These
learners were selected from all grades of the department as the representatives of the population.
The number of the participants involved in the study is displayed below according to their
gender, departments, and grade.
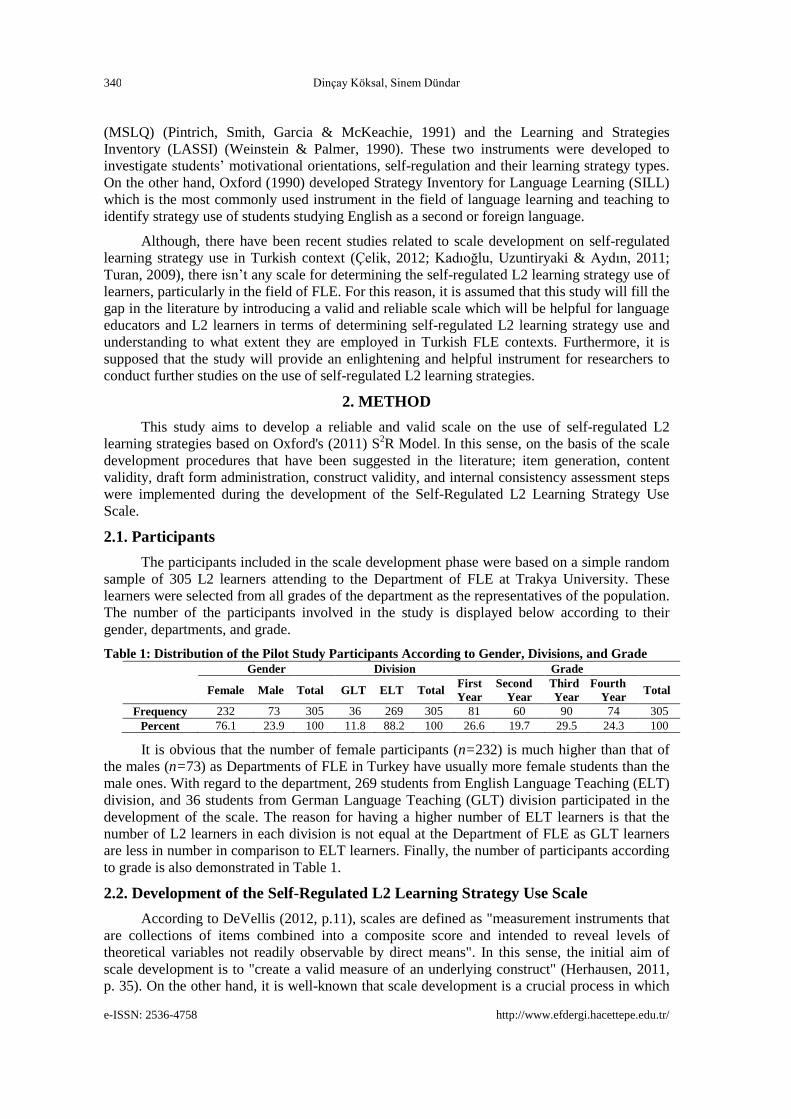
Table 1: Distribution of the Pilot Study Participants According to Gender, Divisions, and Grade
Gender Division Grade
Female Male Total GLT ELT Total First
Year
Second
Year
Third
Year
Fourth
Year Total
Frequency 232 73 305 36 269 305 81 60 90 74 305
Percent 76.1 23.9 100 11.8 88.2 100 26.6 19.7 29.5 24.3 100
It is obvious that the number of female participants (n=232) is much higher than that of
the males (n=73) as Departments of FLE in Turkey have usually more female students than the
male ones. With regard to the department, 269 students from English Language Teaching (ELT)
division, and 36 students from German Language Teaching (GLT) division participated in the
development of the scale. The reason for having a higher number of ELT learners is that the
number of L2 learners in each division is not equal at the Department of FLE as GLT learners
are less in number in comparison to ELT learners. Finally, the number of participants according
to grade is also demonstrated in Table 1.
2.2. Development of the Self-Regulated L2 Learning Strategy Use Scale
According to DeVellis (2012, p.11), scales are defined as "measurement instruments that
are collections of items combined into a composite score and intended to reveal levels of
theoretical variables not readily observable by direct means". In this sense, the initial aim of
scale development is to "create a valid measure of an underlying construct" (Herhausen, 2011,
p. 35). On the other hand, it is well-known that scale development is a crucial process in which

Developing a Scale for Self-Regulated L2 Learning Strategy Use 341
e-ISSN: 2536-4758 http://www.efdergi.hacettepe.edu.tr/
certain stages are required to be followed in order to complete the development. In this context,
there are various guidelines for scale development process in the literature that suggest how to
generate a practical and useful scale. (Churchill, 1979; Clark & Watson, 1995; DeVellis, 2012;
Hinkin, 1998; Nunnally & Bernstein, 1994). In this study, the items of this scale were generated
based upon Oxford's (2011) the S2R Model of Language Learning during item generation
process. Additionally, previous research related to LLS and self-regulated learning were
examined (Cohen & Chi, 2002; Kadıoğlu et. al, 2011; Kocaman & Cumaoğlu, 2014; Nambiar,
2008; Oxford, 1989; O'Neil & Herl, 1998; Pintrich et. al, 1991; Tseng, Dörnyei & Schmidt,
2006). In the light of strategies proposed by Oxford's (2011) Model, 53 items were generated by
the researcher. The statements of the scale were prepared in Turkish, namely the native
language of the learners so that it would be easier for learners studying in the department of
GLT to comprehend the statements. The draft form that consists of selected statements from the
item pool was presented to a group of ten people who are experts on education, measurement
and evaluation, and language in order to discuss the content validity and linguistic
comprehensibility of the statements. Through the feedback provided by the experts, there was
no need to delete any items from the scale; however certain revisions were required to be made
linguistically with reference to the statements. After the revisions, the scale was presented to a
group of 15 students for evaluation of comprehensibility, expediency, and responsiveness.
Subsequently, the scale was ready for implementation after the feedback provided by this group.
The instrument was designed as a 4 point Likert-type scale which consisted of “never (1),
sometimes (2), usually (3), and always (4)" options. Each item of the scale has 1- 4 points.
There were no negative statements involved in the instrument. At the end, the scale was
constructed with 53 items which was then used for analysis. Eventually, final draft form of the
scale was administered to 305 participants. It is stated in the literature that minimum number of
300 is regarded as a sufficient sample size in conducting factor analysis (FA) (Çokluk,
Şekercioğlu & Büyüköztürk, 2014). Comrey & Lee (1992) also indicate that the sample size up
to 100 entities is regarded as poor, up to 200 entities fair, up to 300 entities good, up to 500
entities very good, and up to 1000 entities excellent. Hence, the number of participants, which
the draft of this scale is implemented to, is considered as "good" with regard to sample size.
Factor Analysis (FA) is commonly used in the fields of psychology and education by
researchers for the development and evaluation of test and scales. In the analyzing process, the
researcher generates a large number of individual scale items and questions. By employing
factor analytic techniques, these items can be refined or deduced in order to construct a smaller
number of coherent subscales. FA can be used for reducing a large number of related variables
to a more convenient number, before using them in other analyses such as multiple regression or
multivariate analysis of variance as well (Anderson & Gerbing, 1984; Hu & Bentler 1999;
Jöreskog & Sörbom, 1993).
There are two major approaches to FA; exploratory and confirmatory. EFA tries to
discover the nature of the constructs that affect a set of responses; whereas CFA examines
whether a specified a set of constructs is influencing responses in a predicted way. In this sense,
the main aim of EFA is to figure out the number of common factors influencing a set of
measures and the strength of the relationship between each factor and each observed measure.
On the other hand, CFA aims to find out the ability of a predefined factor model to fit an
observed set of data (DeCoster, 1998). EFA is regarded as an efficient approach specifically at
the first stages of scale development process as it enables to seek and reveal potential sources of
variance and covariance of the observed measure. Information with regard to the nature of
social and psychological measurement can be increased through EFAs; however these analyses
can be insufficient or impractical for providing detailed information. Hence, it is also
recommended to examine the model by means of CFA after conducting exploratory techniques
for revealing factor design with regard to instrument that is planned to be administered (Çokluk
Dinçay Köksal, Sinem Dündar
e-ISSN: 2536-4758 http://www.efdergi.hacettepe.edu.tr/
342
et al., 2014). In this study, factor loadings of items were regarded as .32 and above, and eigen
value was regarded as 1 and above as well. According to Tabachnick & Fidell (2007), .32 is a
good rule of thumb for the minimum loading of an item. Moreover, it is important for items to
be loaded in a single factor, and there is at least .10 point difference between the factor loadings
of the items that are embedded in two factors (Büyüköztürk, 2006; Tavşancıl, 2005).
As a result of the CFA of the Self-Regulated L2 Learning Strategy Use Scale, χ2/ df ratio
was evaluated by taking the Goodness of Fit Index (GFI), Adjusted Goodness of Fit Index
(AGFI), the Root Mean of Square of Error Approximation (RMSEA), Root Mean Square
Residual (RMR), Standardized Root Mean Square Residual (SRMR), the Comparative Fit Index
(CFI), the Normed Fit Index (NFI), the Non-Normed Fit Index (NNFI) and Parsimony
Goodness of Fit Index (PGFI) into account. The corrected item-total correlations were
calculated in order to determine the effectiveness of the items in the scale in terms of their
features which they measure. For conducting CFA, LISREL 8.71 was used. Subsequently,
Cronbach's alfa reliability coefficient, independent t-test between bottom-top 27% groups and
item mean scores, and corrected item total correlations are examined for the purpose of
assessing internal consistency reliability of the scale.
3. FINDINGS
In this study, Kaiser-Meyer-Olkin (KMO) and Barlett Test of Sphericity were performed
primarily in an attempt to find out the appropriateness of performing FA on data. The KMO
Measure of Sampling Adequacy is defined as "a ratio of the sum of squared correlations to the
sum of squared correlations plus the sum of squared partial correlations (Tabachnick & Fidell,
2001, p. 589). Thus, it enables to assess sampling adequacy for conducting EFA. Kaiser (1974)
indicates that an item having near 1.0 value supports a FA, and that anything less than .5 is
probably not amenable to useful factor analysis (an item having the value of .90s is 'marvelous',
.80s 'meritorious', .70s 'middling', .60s 'mediocre', .50s 'miserable', and below .5 'unacceptable')
(Tavşancıl, 2005). KMO value of this scale was identified as .79 in this study which means that
data gathered by the scale fit for FA. Barlett Test of Sphericity was employed so as to find out
whether there was a relationship between the variables. By means of the results obtained from
Barlett Test of Sphericity, data set of this study was found to have a multivariate normal
distribution as the chi-square test statistics was determined as significant (χ2=2558,673 p<0.01).
Findings of KMO and Barlett Test of Sphericity reveal that data of the scale have the
adequacy for FA.
3.1. EFA Results of the Self-Regulated L2 Learning Strategy Use Scale
Regarding the items in this scale, raw scores were converted to standard z values to
determine how many standard deviations lie above or below the mean. Considering a normal
distribution, participants getting z values higher than +3 and lower than -3 are regarded as
extreme values (Çokluk et al., 2014). In this study, 15 participants had extreme values. Thus,
they were excluded from the study, and 290 participants were taken into account for the
analysis.
In this study, factor loadings of items are regarded as .32 and above, and eigen value is
considered as 1 and above. Moreover, it is important for items to be loaded in a single factor,
and there is at least .10 point difference between the factor loadings of the items that are
embedded in two factors (Büyüköztürk, 2006; Tavşancıl, 2005). According to Tabachnick &
Fidell (2007), .32 is a good rule of thumb for the minimum loading of an item. For EFA,
Statistical Package for the Social Sciences (SPSS) 21.0 was employed. The results of the
analysis indicate that there are six domains/factors in the scale. EFA Results of Self-Regulated
L2 Learning Strategy Use Scale are presented in Table 2 below.

Developing a Scale for Self-Regulated L2 Learning Strategy Use 343
e-ISSN: 2536-4758 http://www.efdergi.hacettepe.edu.tr/
Table 2: EFA Results of the Self-Regulated L2 Learning Strategy Use Scale
Rotated Component Matrix
Items
Factor 1 Factor 2 Factor 3 Factor 4 Factor5 Factor 6 Common
Factor
Variance
Meta-
affective
Strategies
Metacognitive
Strategies
Meta-SI
Strategies
SI
Strategies
Affective
Strategies
Cognitive
Strategies
50 .59 .47
43 .57 .43
42 .55 .37
53 .55 .34 .48
48 .55 .36
33 .53 .38
40 .51 .43
37 .45 .25
27 .44 .36
52 .44 .41
5 .65 .52
10 .64 .56
34 .58 .40
29 .53 .52
4 .50 .28
16 .50 .34 .47
21 .47 .33
24 .47 .33
12 .35 .19
38 .66 .50
41 .34 .61 .58
14 .40 .51 .47
36 .45 .42
49 .45 .41
15 .68 .50
19 .67 .57
31 .58 .44
6 .55 .32
28 .47 .27
35 .80 .69
22 .74 .61
23 .36 .48 .44
18 .71 .55
1 .65 .48
25 .39 .60 .55
Eigen value (Total: 15.31) Total Variance Explained (Total: 41.625%)
KMO: .79 Barlett Test of Sphericity: (χ2=2558.673 p<0.01)
*Factor Loadings below .32 are not displayed in the table.
Before performing EFA, there were totally 53 items in the instrument. After examining
the initial results of EFA, it was found out that factor loadings of certain items were below .32
value. Moreover, it was observed that more than one item had higher factor loadings value. Due
to this reason, 18 items were excluded from the draft form of the scale. As a result of EFA,
factor construct and rotated factor loadings determined by the Varimax vertical rotation method
related to the items are presented in Table 2. Regarding the fact that factors constructing the
scale are independent, the Varimax technique was used in the study as it is one of the most
preferred orthogonal rotation methods which results in solutions that are easier to interpret and
report in statistics (Akbulut, 2010; Özdamar, 1999; Tabachnick & Fidell, 2007; Tavşancıl,
2005).

Dinçay Köksal, Sinem Dündar
e-ISSN: 2536-4758 http://www.efdergi.hacettepe.edu.tr/
344
Depending the results of EFA, the scale is composed of 35 items embedded in 6 factors.
The total variance explained is 41.625%. Factor loadings of 35 items vary from .80 to .35.
The first sub-dimension of the scale that is "Meta-affective Strategies" involves 10 items,
and their rotated factor loadings vary between .59 and .44. The eigen value of this factor is 6.41,
and its individual variance explained value is 18.31 %.
The second sub-dimension, "Metacognitive Strategies" incorporates 9 items, and rotated
factor loadings are between .65 and .35. Iın this sub-dimension, the eigen value is 2.13, and its
individual variance explained value is 6.08 %.
Meta-SI Strategies, which is the third sub-dimension of the scale, encompasses 5 items,
and rotated factor loadings vary in a range of .66 and .45. The eigen value of this factor is 1.95,
and its individual variance explained value is 5.58 %.
The fourth sub-dimension of the scale, "Sociocultural-Interactive Strategies" consists of 5
items, and rotated factor loadings vary between .68 and .47. The eigen value of this factor is
1.73, and its individual variance explained value is 4.93 %.
"Affective Strategies" factor, which is the fifth sub-dimension of the scale comprises 3
items, and rotated factor loadings range between .80 and .48. The eigen value of this factor is
1.70, and its individual variance explained value is 4.84 %.
The last sub-dimension is "Cognitive Strategies" which forms the sixth factor of the scale.
There are 3 items related to this factor, and rotated factor loadings vary between the values .71
and .60. The eigen value of this factor is 1.40, and its individual variance explained value is 4.00
%.
3.2. CFA Results of the Self-Regulated L2 Learning Strategy Scale
For the Self-Regulated L2 Learning Strategy Use Scale, CFA was performed for the
purpose of confirming the results of EFA, which have revealed that there are 35 items grouped
into six factors in the scale. As a consequence of CFA, it was out that χ2/ df ratio of the model is
2.38 (χ2/ df=1298.61/545). In larger samples, a model is regarded as "perfect" when χ2/ df ratio
is below 3, and "middling" when this ratio is below 5 (Kline, 2005; Sümer, 2000).
In this respect, the scale has perfect fit in terms of CFA results. On the other hand, GFI
and AGFI are hypothesis testing approaches employed for fitting assessment of overidentified
CFA, and more general structural equation models in order to determine the quantity of
observed variance/covariance knowledge which can be constituted as a result of the
hypothesized model (Mueller, 1996). GFI and AGFI range between 0 and 1, and it is generally
recognized that values of .90 or greater point out well-fitting models (Hooper, Coughlan &
Mullen, 2008). This study reveals findings as GFI = .80 and AGFI = .76 which mean that the
model has an acceptable fit. RMSEA, which determines "how well the model would, with
unknown but optimally chosen parameter values, fit the population covariance matrix if it were
available" (Brown & Cudeck, 1993, p. 137-138), refers to having 'good fit' on the condition that
values are less than .50; and values as high as .80 is considered as bearing reasonable errors of
approximation in the population. Furthermore, according to MacCallum, Browne & Sugawara
(1996), values varying between .8 and 1.0 represent 'mediocre' fit; whereas those higher than .10
indicate 'poor' fit. On the other hand, Sümer (2000) points out that RMSEA value as ≤ .08 is
considered as bearing 'good fit.' This study reveals findings as RMSEA= 0.069, and this value is
regarded as reasonable for the analysis. RMR refers to the square root of the average of the
squared residuals. RMR values less than .80 are identified as acceptable (Browne & Cudeck,
1993), and values less than .05 are considered as ideal (Stieger, 1990). In this study, RMR has
.048 value, which is interpreted as 'perfect fit' (Brown, 2006). Another criterion for assessing the
fitness of the scale is SRMR, which refers to "the square root of the average squared residual in

Developing a Scale for Self-Regulated L2 Learning Strategy Use 345
e-ISSN: 2536-4758 http://www.efdergi.hacettepe.edu.tr/
standardized metric", and provides "a measure of lack of fit in the standardized metric" (Ryu,
2008, p. 21). SRMR value of .80 or less indicates a good fit (Brown, 2006). In this study,
SRMR has .073 value which represents that the model fits in a good index. CFI, NFI, and NNFI
are other indeces that compare the target and null models. According to Hoyle (1995), The CFI,
NFI, and NNFI values can vary from 0 to 1, with higher values representing appropriate fitness.
Values above .90 are generally regarded as satisfactory. This study reveals findings as CFI=.86,
NFI=.78, NNFI=.84, which indicate the model has a satisfactory fit. Another index type, PGFI
"makes a different type of adjustment to take into account model complexity" (Diamantopoulos
& Siguaw, 2000, p. 87). Sümer (2000) asserts that a PGFI value closer to 1 indicates good fit,
whereas value 1 refers to a perfect fit. In this study, findings reveal PGFI= .69 value, which is
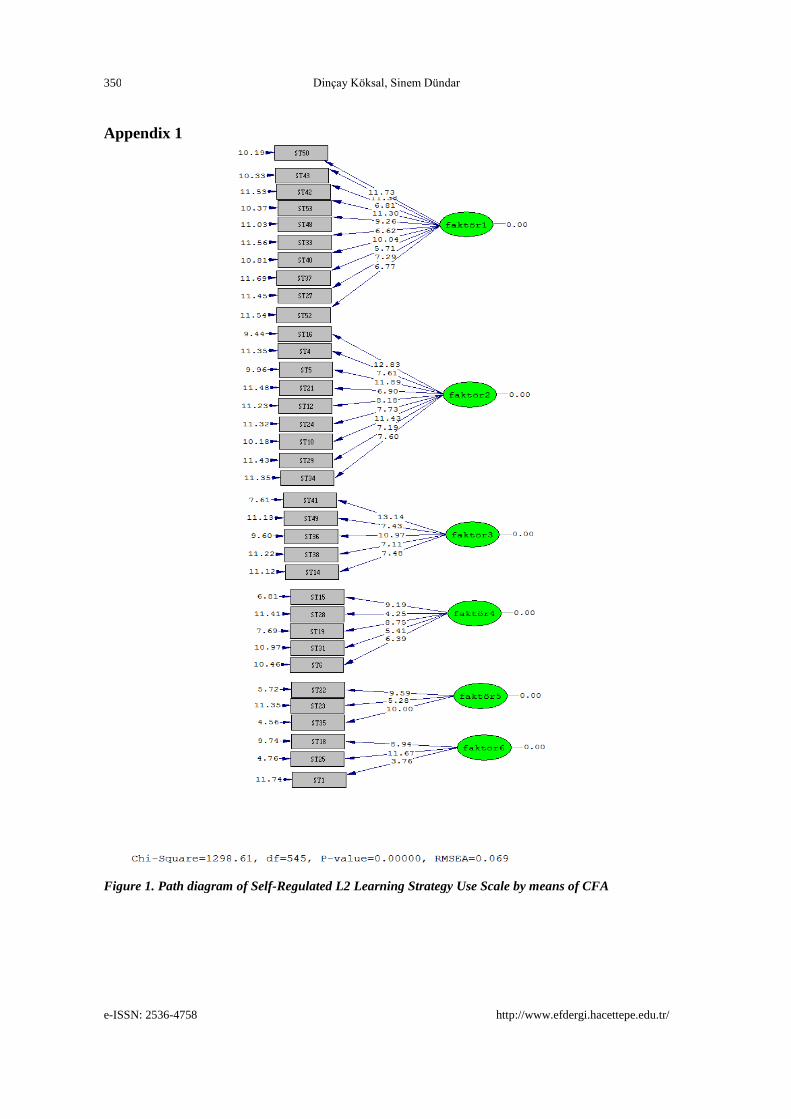
regarded as adequate for the model. Path diagram of Self-Regulated L2 Learning Strategy Use
Scale, which is derived from CFA, is presented in Appendix 1.
Item analysis was performed for the calculation of independent t-test values with regard
to bottom 27% and top 27% groups. Item analysis is carried out to provide the dimensionality
aspect of Likert scaling technique, and to make an inference about construct validity of the
scale. It also enables to distinguish whether items of the scale assess the intended traits without
including unintended ones (Tavşancıl, 2005). t-test results of the items in the scale with regard
to the significance between corrected item total correlations and the item mean scores of bottom
27% and top 27% groups assessed in terms of total scores are represented in Table 3. The table
presents that corrected item total correlation values of items in the scale range from .44 to .76.
The results of t-test with bottom 27% and top 27% groups assessed in terms of total scores
reveal that the differences are significant (p<.05) in relation to items and factors of the scale. As
a consequence of this finding, it was found that the items and factors of the Self-Regulated L2
Learning Strategy Use Scale are distinctive.
Table 3: Results of Correction Item Total Correlation and Independent t-test between Bottom 27%
and Top 27% groups of the Self-Regulated L2 Learning Strategy Use Scale
Factors Item No
Bottom 27 %
Group (n=78)
Top 27 % Group
(n=78) t*
Corrected Item
Total
Correlation
Factor 1
50 2.09 3.32 12.60 .69
43 2.28 3.47 11.27 .67
42 1.97 3.03 9.75 .57
53 2.03 3.32 11.75 .66
48 2.14 3.29 10.87 .62
33 1.95 2.87 8.29 .52
40 2.05 3.33 11.17 .63
37 3.19 2.19 8.65 .48
27 2.21 3.54 11.40 .64
52 2.28 3.36 9.60 .56
Factor 2
5 2.68 3.71 11.82 .68
10 2.09 3.47 13.23 .68
34 2.45 3.49 9.85 .60
29 2.42 3.77 10.29 .56
4 2.91 3.67 8.32 .49
16 2.32 3.47 10.97 .60
21 3.21 3.88 9.21 .51
24 2.22 3.32 10.05 .62
12 2.27 3.28 9.31 .51
Factor 3
38 2.19 3.85 16.80 .68
41 1.82 3.41 15.86 .68
14 2.65 3.74 10.51 .53
36 2.60 3.56 9.18 .52
49 1.64 3.00 10.23 .53

Dinçay Köksal, Sinem Dündar
e-ISSN: 2536-4758 http://www.efdergi.hacettepe.edu.tr/
346
Factor 4
15 2.10 3.45 14.40 .67
19 2.37 3.59 13.47 .60
31 2.67 1.49 10.57 .53
6 1.73 2.96 10.52 .51
28 1.83 3.08 9.53 .44
Factor 5
35 2.62 3.94 19.65 .76
22 2.58 3.87 18.40 .72
23 2.58 3.78 14.36 .59
Factor 6
18 1.65 3.53 19.20 .63
1 2.00 2.99 10.51 .46
25 1.7 3.37 15.22 .62
3.3. Results of Reliability Findings of the Self-Regulated L2 Learning Strategy Use
Scale
In this study, the Cronbach's Alfa coefficient was determined to find out the reliability
regarding the scale. The internal consistency coefficients of the scale are displayed in Table 4.
Table 4: Internal Consistency Coefficients of the Self-Regulated L2 Learning Strategy Use Scale Self-Regulated L2 Learning Strategy Use
Scale
Cronbach's Alfa
1. Meta-affective Strategies .88
2. Metacognitive Strategies .85
3. Meta-SI Strategies .80
4. SI Strategies .77
5. Affective Strategies .83
6. Cognitive Strategies .73
Overall Values of the Scale .85
Reliability coefficient .70 and above is generally regarded as adequate for the reliability
of test scores (Büyüköztürk, 2006). In this study, the Cronbach's Alpha internal consistency
coefficient of the first sub-dimension "Meta-affective Strategies" is .88. The coefficient value of
the second sub-dimension "Metacognitive Strategies" is .85, .80 for the third sub-dimension
"Meta- SI Strategies", .77 for the fourth sub-dimension, .83 for the fifth sub-dimension
"Affective Strategies", and .73 for the last sub-dimension "Cognitive Strategies". The overall
reliability of the measurement model is established by having a Cronbach’s alpha statistic of
.85, which means that the model is at an acceptable level. Hence, the calculated internal
consistency coefficients reveal that the scale is at a good level in terms of reliability.
As a result of conducting scale development procedure, Self-Regulated L2 Learning
Strategy Use Scale was composed of 35 items grouped into 6 factors as Cognitive Strategies,
Affective Strategies, SI Strategies, Metacognitive Strategies, Meta-affective Strategies, Meta-SI
Strategies, which are proposed by the S2R Model. As each item of the scale has 1-4 points, the
total score that can be obtained from the scale is 140; 35 is considered as the lowest score, 70 as
the medium score, and 140 as the highest one.
4. DISCUSSION & CONCLUSION
This study aims to develop a valid and reliable scale that can be used to determine self-
regulated L2 learning strategies of L2 learners. In this sense, 53 items were generated by the
researcher in the light of strategies proposed by Oxford's (2011) S2R Model and administered to
305 L2 learners studying at the department of FLE. Subsequently, validity and reliability
analyses of the scale were carried out on the collected data. As a consequence of EFA, the scale
was embedded in 6 factors which were based on Cognitive Strategies, Affective Strategies, SI
Strategies, Metacognitive Strategies, Meta-affective Strategies, and Meta-SI Strategies
dimensions. 18 items were excluded from the draft form of the scale as factor loadings of these
items were lower or they had high factor loadings in multiple factors. After excluding 18 items,
EFA was performed to the rest 35 items of the scale, and the total variance explained is
Developing a Scale for Self-Regulated L2 Learning Strategy Use 347
e-ISSN: 2536-4758 http://www.efdergi.hacettepe.edu.tr/
41.625%. Moreover, the total eigen value was found to be 15,31. Factor loadings of 35 items
vary from .80 to .35. CFA was performed for the purpose of confirming the results of EFA.
Although findings of χ2/ df ratio, GFI, AGFI, CFI, NFI, NNFI, SRMR, RMR, RMSEA, and
PGFI indexes which were gathered through CFA do not have the perfect fit of the whole fit
indexes used in assessing the model, they are considered as adequate in terms of the acceptance
of the model. The corrected item total correlation values of items in the scale range from .44 to
.76. The results of t-test of bottom 27% and top 27% groups assessed in terms of total scores
reveal that the differences are significant (p<.05) in relation to items and factors of the scale.
The Cronbach's Alfa coefficient was calculated to determine the reliability of the scale. The
model is found to be at an acceptable level as the overall reliability of the measurement model is
established by having a Cronbach’s alpha statistic of .85. As a result of validity and reliability
analyses of the scale, the final form of the instrument was composed of a total of 35 items and
designed as a 4 point Likert-type scale having “never (1), sometimes (2), usually (3), and always
(4)" options. There were no negative statements involved in the instrument. The Self-Regulated
L2 Learning Strategy Use Scale is a valid and reliable measuring instrument for finding out the
self regulated L2 learning strategy use of language learners based on their own responses. Items
of the scale aims to determine the extent of strategy categories employed by L2 learners. As the
total score that can be obtained from the scale is 140; participants getting scores higher than 70
is considered as high strategy users; whereas below 70 is regarded as low strategy users.
Moreover, findings related to the reliability and validity results reveal that the scale has a
satisfactory structure to find out L2 learners' preferences about strategies. Self-regulated L2
Learning Strategy Use Scale can be used to conduct studies in relation to determining the level
of L2 learners' preferences for self-regulated strategies and revealing to what extent they use
them in language education contexts. Consequently, understanding the strategy use of L2
learners can make language educators become aware of their learners' way of dealing with the
target language, and language education programs can be designed according to learners' need
on this issue.
5. REFERENCES
Akbulut, Y. (2010). Sosyal bilimlerde SPSS uygulamaları. İstanbul: İdeal Kültür Yayıncılık.
Anderson, J. C, & Gerbing, D. W. (1984). The effect of sampling error on convergence, improper solutions, and
goodness-of-fit indices for maximum likelihood confirmatory factor analysis. Psychametrika, 49, 155-173.
Brown, T. A. (2006). Confirmatory Factor Analysis for Applied Research, First Edition. NY: Guilford Publications,
Inc.
Browne, M. W. & Cudeck, R. (1993). Alternative ways of assessing model fit. In K. A. Bollen & J. S. Long (Eds.),
Testing structural equation models (pp. 136-162). Beverly Hills, CA: Sage.
Büyüköztürk, Ş. (2006). Sosyal bilimler için veri analizi el kitabı. Ankara: Pegem A Yayıncılık.
Churchill, G. (1979). A paradigm for developing better measures of marketing constructs. Journal of Marketing
Research, 16 (February), 64-73.
Clark, L. A., & Watson, D. (1995). Constructing validity: Basic issues in scale development. Psychological
Assessment, 7, 309-319.
Cohen, A. D. & Chi, J. C. (2002). Language Strategy Use Inventory and Index. In R. M. Paige, A. D. Cohen, B.,
Kappler, J. C., Chi & J. P., Lassegard (Eds). Maximizing study abroad, 16-28. Minneapolis, Center for
Advanced Research for Language Acquisition, University of Minnesota.
Comrey, A. L., & Lee, H. B. (1992). A first course in factor analysis. Hillsdale, NJ: Lawrence Erlbaum Associates.
Çelik, N. (2012). Investigation of Self-regulation Skills and Self-efficacy Perceptions of Prospective Mathematics
Teachers and Teachers. Unpublished Master Thesis, Erzurum: University of Atatürk.
Çokluk, Ö., Şekercioğlu, G. & Büyüköztürk, Ş. (2014). Sosyal Bilimler için Çok Değişkenli İstatistik: SPSS ve
LISREL Uygulamaları. Ankara: Pegem Akademi.

Dinçay Köksal, Sinem Dündar
e-ISSN: 2536-4758 http://www.efdergi.hacettepe.edu.tr/
348
DeCoster, J. (1998). Overview of Factor Analysis. [Available online at http://www.stat-help.com/notes.html],
Retrieved on November, 2, 2015.
DeVellis, R. F. (2012). Scale Development: Theory and Applications. Thousand Oaks,California: Sage Publications.
Diamantopoulos, A. & Siguaw, J. A. (2000). Introducing LISREL: A Guide for the Uninitiated. London: Sage
Publications.
Dörnyei, Z. (2005). The psychology of the language learner: Individual differences in second language acquisition.
Mahwah, NJ: Lawrence Erlbaum.
Griffiths, C. (2013). The strategy factor in successful language learning. Bristol: Multilingual Matters.
Herhausen, D. (2011). Understanding Proactive Customer Orientation: Construct Development and Managerial
Implications. Published PhD Thesis. Universty of St. Gallen. Wiesbaden: Gabler Verlag.
Hinkin, T. R. (1998). A brief tutorial on the development of measures for use in survey questionnaires.
Organizational Research Methods, 1: 104-121.
Hooper, D., Coughlan, J. & Mullen, M. R. (2008). Structural Equation Modelling: Guidelines for Determining Model
Fit. The Electronic Journal of Business Research Methods. Volume 6 Issue 1 2008, pp. 53 - 60. [Available at
www.ejbrm.com], Retrieved on December, 1, 2015.
Hoyle, R. H. (1995). The structural equation modeling approach: Basic concepts and fundamental issues. In
Structural equation modeling: Concepts, issues, and applications, R. H. Hoyle (editor). Thousand Oaks, CA:
Sage Publications, Inc., pp. 1-15.
Hu, L.T. & Bentler, P.M. (1999), Cutoff Criteria for Fit Indexes in Covariance Structure Analysis: Conventional
Criteria Versus New Alternatives, Structural Equation Modeling, 6 (1), 1-55.
Jöreskog, K. & Sörbom, D. (1993), LISREL 8: Structural Equation Modeling with the SIMPLIS Command Language.
Chicago, IL: Scientific Software International Inc.
Kadıoğlu, C. , Uzuntiryaki, E., & Aydın, Ç. Y. (2011). Development of Self-Regulatory Strategies Scale (SRSS):
Özdüzenleyici Öğrenme Stratejileri Ölçeğinin (ÖÖSÖ) Geliştirilmesi, Eğitim ve Bilim 2011, Cilt 36, Sayı 160.
Kaiser, H. F. (1974). An index of factorial simplicity. Psychometrika, 39, 31-36.
Kline, R. B. (2005). Principles and Practice of Structural Equation Modeling: A Researcher's Guide. London: Sage.
Kocaman, O. & Cumaoğlu, K. G. (2014). Developing a Scale for Vocabulary Learning Strategies in Foreign
Languages. Education & Science / Egitim ve Bilim . 2014, Vol. 39 Issue 176, p293-303. 11p.
MacCallum R. C., Browne M.W., & Sugawara H. M. (1996). Power Analysis and Determination of Sample Size for
Covariance Structure Modeling. Psychological Methods. 1:130–49.
Mueller, R. O. (1996). Basic Principles of Structural Equation Modeling: An Introduction to LISREL and EQS. New
York: Springer.
Nambiar, R. (2008). Towards A Descript.ve Language Learning Strategy Inventory, The DELLSI. The Buckingham
Journal of Language and Llinguistics, Vol. 1.
Nunnally, J. C., & Bernstein, I. H. (1994) Psychometric theory (3rd ed.). New York, NY: McGraw-Hill, Inc.
O'Neil Jr, H. F. & Herl, H. E. (1998). Reliability and validity of a trait measure of self-regulation. Annual meeting of
the American Educational Research Association, Diego, CA.
Oxford, R. L. (1989). Use of language learning strategies: A synthesis of studies with implication for strategy
training. System, 17, 235-247.
Oxford, R. (1990). Language Learning Strategies: What Every Teacher Should Know. NY: Newbury House
Publisher.
Oxford, R. (2011). Teaching and Researching Language Learning Strategies. Harlow: Pearson Education Limited.
Özdamar, K. (1999). Paket programlar ile istatistiksel veri analizi. Eskişehir: Kaan Kitabevi.
Pintrich, P. R., Smith D., Garcia T., & McKeachie W. J. (1991) . A Manual for the Use of the Motivated Strategies
for Learning Questionnaire. National Center for Research to Improve Postsecondary Teaching and Learning,
University of Michigan, Ann Arbor, Mich, USA.

Developing a Scale for Self-Regulated L2 Learning Strategy Use 349
e-ISSN: 2536-4758 http://www.efdergi.hacettepe.edu.tr/
Ryu, E. (2008). Evaluation of Model Fit in Multilevel Structural Equation Modeling: Level-Specific Model Fit
Evaluation and The Robustness to Non-normality. Unpublished PhD Thesis, Tucson. Arizona: Arizona
University.
Schunk, D. H. & Zimmerman, B. J. (2008). Motivation and Self-Regulated Learning. New York: Lawrence Erlbaum
Associates
Steiger, J. H. (1990). Structural model evaluation and modification: An interval estimation approach. Multivariate
Behavioural Research, 25, 173-180.
Sümer, N. (2000). Yapısal Eşitlik Modelleri. Türk Psikoloji Yazıları., 3 (6), 49-74.
Tabachnick, B. G. & Fidell, L. S. (2001). Using multivariate statistics (4th ed.). New York: Allyn and Bacon.
Tabachnick, B. G. & Fidell, L. S. (2007). Using multivariate statistics (5th ed.). New York: Allyn and Bacon.
Tavşancıl, E. (2005). Tutumların ölçülmesi ve SPSS ile veri analizi. Ankara: Nobel Yayıncılık.
Turan, S. (2009). Probleme dayali öğrenmeye iliskin tutumlar, ogrenme becerileri ve basari arasindaki ilişkiler
(Unpublished doctoral dissertation). Hacettepe Universitesi, Ankara, Turkey.
Tseng, W. T., Dörnyei, Z. & Schmidt, N. (2006). A New Approach to Assessing Strategic Learning: The Case of
Self-Regulation in Vocabulary Acquisition. Applied Linguistics. March, 27 (1): 78-102.
Weinstein, C. E., & Palmer, D. (1990). LASSI-HS user's manual. Clearwater, FL: H & H Publishing
Zimmerman, B. J. & Risemberg, R. (1997). Self-regulatory dimensions of academic learning and motivation. In G.D.
Phye (Ed.), Handbook of academic learning (pp, 105-125). San Diego: Academic Press.
Zimmerman, B. J. (2001). Theories of Self-regulated Learning and Academic Achievement: An Overview and
Analysis. In B. J. Zimmerman & D. H. Schunk (Eds.) Self-regulated Learning and Academic Achievement:
Theoretical Perspectives (pp, 1-35). New Jersey: Lawrence Erlbaum Associates.
Dinçay Köksal, Sinem Dündar
e-ISSN: 2536-4758 http://www.efdergi.hacettepe.edu.tr/
350
Appendix 1
Figure 1. Path diagram of Self-Regulated L2 Learning Strategy Use Scale by means of CFA
Developing a Scale for Self-Regulated L2 Learning Strategy Use 351
e-ISSN: 2536-4758 http://www.efdergi.hacettepe.edu.tr/
Uzun Özet
Bu çalışmanın amacı, Oxford (2011) tarafından geliştirilen Stratejik Öz-Düzenleme Modeli'ne
dayanarak öz-düzenlemeli yabancı dil öğrenme stratejisi kullanımına ilişkin bir ölçek geliştirmektir.
Çalışma, basit rastgele örnekleme yöntemiyle Trakya Üniversitesi Yabancı Diller Eğitimi Bölümü Alman
Dili ve İngiliz Dili Eğitimi Anabilim dalında öğrenim gören 305 (232 kız, 73 erkek) öğrencinin
katılımıyla gerçekleşmiştir. Ölçeğin maddeleri Oxford'un 2011 yılında geliştirdiği Yabancı Dil
Öğreniminde Stratejik Öz-Düzenleme Modeli'ne dayanılarak belirlenmiştir.
Oxford (1990) yabancı dil öğrenme stratejilerini dolaysız (direkt) ve dolaylı (indirect) olarak iki
bölümde incelemişti. Oxford'a göre (1990) dolaysız stratejiler; doğrudan öğrenmeyi etkileyen hafıza
(memory), bilişsel (cognitive) ve telafi (compensation) stratejilerinden oluşmaktadır. Dolaylı stratejiler
ise doğrudan öğrenmeyle ilgisi olmayan, ancak öğrenme sürecini etkileyen üstbilişsel (metacognitive),
sosyal (social) ve duyuşsal (affective) stratejileri içermektedir. Oxford (2011) geliştirdiği Yabancı Dil
Öğreniminde Stratejik Öz-Düzenleme Modeliyle dil öğrenme stratejilerine yeni bir boyut getirmiştir.
Oxford'un güncellemiş olduğu bu modelle, stratejiler bilişsel (cognitive), duyuşsal (affective) ve sosyo
kültürel etkileşimli (socio-cultural interactive) olmak üzere üç ana bölümden oluşmaktadır. Belirtilen üç
ana bölümün yanı sıra modele üst bilişsel (metacognitve), üst duyuşsal (meta-affective) ve üst sosyo
kültürel etkileşimli (meta socio-cultural interactive) metastratejiler eklenmiştir. Dolayısıyla model, üç
temel öğrenme kuramı olan psikolojik, sosyo-bilişsel ve sosyo-kültürel alanı sistemli bir biçimde ele
almaktadır.
Çalışmada, Oxford'un (2011) önermiş olduğu modele dayanarak araştırmacı tarafından 53 madde
oluşturulmuştur. Alman Dili Eğitimi anabilim dalında öğrenim gören öğrencilerin ölçekteki ifadeleri
kolay anlamalarını sağlamak için maddeler öğrencilerin ana dili olan Türkçe olarak hazırlanmıştır.
Ölçeğin taslak hali kapsam geçerliği ve maddelerin dilbilimsel anlaşılabilirliğini tartışmak için eğitim,
ölçme ve değerlendirme, dil alanında uzman 10 kişiye sunulmuş ve uzmanlardan alınan görüşler
sonucunda ölçekten hiçbir madde çıkartılmamış, ancak maddelerin bazı ifade biçimlerinde değişiklikler
yapılmıştır. Yapılan düzeltmelerden sonra, ölçeğin anlaşılabilirliliği, amacına uygunluğu ve
cevaplanabilirliliğin değerlendirilmesi için ölçek 15 öğrenciye sunulmuştur. Elde edilen dönütlerden
sonra ölçek uygulanmak için hazır hale gelmiştir. Sonuç olarak, 53 madde ve "hiçbir zaman", "bazen",
"genellikle" ve "her zaman" seçeneklerinden oluşan dörtlü Likert tipi bir ölçek hazırlanmış ve 305
öğrenciye uygulanmıştır. Çokluk, Şekercioğlu ve Büyüköztürk'e göre (2014) faktör analizi uygulamak
için minimum 300 katılımcı sayısı yeterli olmaktadır. Uygulamanın sonucunda, ölçme araçlarının
geliştirilmesi için yapı geçerliliğini test etmek ve faktör gruplarını belirlemek amacıyla açımlayıcı faktör
analizi kullanılmıştır. Faktör analizi yapılmadan önce verilerde uç değerler olup olmadığını belirlemek
için bütün maddelere verilen puanlar z puanına çevrilmiş ve Öz-düzenlemeli Yabancı Dil Öğrenme
Stratejileri Kullanımı Ölçeğinde 15 verinin uç değerde olduğu tespit edilerek uç değerdeki bireyler
analizden çıkartılmıştır. Böylece, çalışmaya geriye kalan 290 katılımcıyla devam edilmiştir. Daha sonra
verilerin ve örneklem büyüklüğünün açımlayıcı faktör analizine uygun olup olmadığını tespit etmek için
Kaiser-Meyer-Olkin (KMO) testi yapılmıştır. Verilerin çok değişkenli normal dağılımdan gelip
gelmediğini belirlemek için Barlett Sphericity testi uygulanmıştır. Analiz sonucunda, ki kare test sonucu
anlamlı bulunduğundan, çalışmanın veri setinin çok değişkenli normal dağılımdan geldiği belirlenmiştir
(χ2=2558.673 p<0.01). Ölçeklerin geçerliliğini belirlemek için varimax döndürme ile açımlayıcı faktör
analizi (AFA) kullanılmıştır. Çalışmada, maddelerin faktör yükleri .32 ve üstü, öz değer ise 1 ve üstü
olarak kabul edilmiştir. AFA için SPSS 21.0 kullanılmıştır. Tabachnick ve Fidell (2007), madde için yük
değerinin .32 olmasının genel bir kural olduğunu belirtmiştir. AFA sonuçlarına göre, ölçekteki 18
maddenin .32 değerinin altında olduğu tespit edilmiş ve bu maddeler ölçekten çıkartılmıştır. Elde edilen
sonuçlara göre öz-düzenlemeli yabancı dil öğrenme stratejileri kullanımı için 6 alt boyut ve 35 maddeden
oluşan bir ölçek elde edilmiştir. AFA' dan sonra ölçeklerin boyutları doğrulayıcı faktör analizi (DFA) ile
test edilmiştir. DFA sonucuna göre, modelin uyum değeri 2.38 (χ2/ sd=1298.61/545) olarak bulunmuştur.
Büyük örneklemlerde χ2/sd oranı 3 ün altında olduğunda model "mükemmel", 5 in altında olduğunda ise
"orta" olarak kabul edilmektedir (Kline, 2005; Sümer, 2000). Elde edilen sonuç, modelin kabul
edilebilirliliği açısından mükemmel olduğunu ortaya koymuştur. Çalışmada, DFA için LISREL 8.71
kullanılmıştır. Ölçeğin madde kalan ve düzeltilmiş madde toplam korelasyonları belirlenmiştir. Bunun
yanı sıra, t-test uygulanarak üst %27 ve alt %27’lik grupların, madde ortalama puanları arasında anlamlı
bir fark olup olmadığını hesaplanmıştır. Sonuçlar, farkların tüm madde ve faktörler için anlamlı olduğunu
ortaya koymuştur (p<.05).
Dinçay Köksal, Sinem Dündar
e-ISSN: 2536-4758 http://www.efdergi.hacettepe.edu.tr/
352
Ölçme araçlarının güvenirliliğini belirlemek için iç tutarlılık güvenirlilik katsayılarından Cronbach
Alfa formülü kullanılmıştır. Büyüköztürk (2006), güvenirlilik katsayısının .70 ve üstü olmasının ölçeğin
güvenilir olduğunu gösterdiğini ifade etmiştir. Bu çalışmada, Cronbach Alfa iç tutarlılık katsayısı 0.85
olarak belirlenmiştir. Elde edilen değerler sonucu ölçeğin güvenilir bir ölçme aracı olduğunu
belirlenmiştir.
Sonuç olarak, öğrenenlerin hedef dilli nasıl öğrendiklerini ve strateji kullanımının başarılı bir
yabancı dil öğrenme sürecine etkisini anlamak için öz-düzenlemeli yabancı dil öğrenme stratejilerinin
belirlenmesi yabancı dil eğitimi açısından önem taşımaktadır. Alanyazına baktığımızda, özellikle
Türkiye'de bu stratejilerin belirlenmesini sağlayacak ölçek sayısı azdır. Bu nedenle, bu çalışmayla geçerli
ve güvenilir bir ölçme aracı sunularak alanyazındaki boşluğun doldurulacağı düşünülmektedir. Yabancı
Dil Öğrenme Stratejileri Kullanımı Ölçeği, strateji tercihlerini belirlemede ve bu stratejilerin yabancı dil
eğitimi bağlamında ne derecede kullanıldığının tespit edilmesinde eğitimciler ve yabancı dil öğrenenleri
tarafından kullanılabilir. Aynı zamanda, bu çalışmanın öz-düzenlemeli yabancı dil strateji kullanımı
konusunda çalışma yapan araştırmacılar için aydınlatıcı ve yararlı olacağı düşünülmektedir.