developing a patient data mining system for the …
TRANSCRIPT

University of Ghana Business School, Legon
DEVELOPING A PATIENT DATA MINING
SYSTEM FOR THE UNIVERSITY OF GHANA
HOSPITAL
By
AFARI-KUMAH, EBENEZER
A Dissertation presented to the University of Ghana Business School, Legon in PartialFulfillment for the award of a Master of Business Administration (Management
Information Systems Option) Degree.
July 2005UGBSUniversity of GhanaLegon.
DECLARATION
I hereby declare that this study is my original piece of research conducted between August 2004 and
May 2005 under the supervision of Mr. John Effah, University of Ghana Business School (UGBS),
Legon
In places where references of other people’s work have been cited or their view adopted, full
acknowledgements have been given. I therefore accept full responsibility for any mistake contained
therein. No part of this project work has either been presented in whole or in part to any other
institution for any award.
……………………………… ……………………………..
AFARI-KUMAH, EBENEZER MR. JOHN EFFAH
(STUDENT) (SUPERVISOR)

DEDICATION
To
My parents,
Emmanuel Frank Afari-Kumah and Comfort Yawa Afari-Kumah (1932-1992)
and Siblings,
whose love is the bedrock upon which my life is built.

ABSTRACT
Patient medical data are collected at the University of Ghana Hospital but they are not processed
electronically. In the current medical record management system, the majority of out-patients do not
have a full medical record. Thus, physician’s time is wasted by having to collect all the information
again. In addition, it becomes very difficult to keep track of the patients and to review a patient’s
medical record.
A Data Mart was designed and built using Microsoft Access 2000 Database Management Systems
(DBMS) to collect, store, organize and retrieve medical information of patients at the Medical Records
Unit of the University of Ghana Hospital. The Data Mart was mined to provide timely, accurate and
reliable reports adequate for clinical research and improving health care continuity.
The Data Mart interfaces are intuitive and easy to use. The queries are flexible and the reports well
labeled.

ACKNOWLEDGEMENTS
The successful completion of this study would not have been accomplished without the guidance, co-
operation and support of some people.
First and foremost, I wish to thank the Almighty God for seeing me through this project successfully.
My profound gratitude goes to my supervisor, Mr. John Effah for availing his expertise, suggestions,
advice, comments and constructive criticisms to the completion of this write-up, and also to the Head
of Management Information Systems Department, UGBS, Dr. F. K Banuro for his constructive
criticisms and comments.
A special note of appreciation also goes to the Director-General of Council for Scientific and Industrial
Research (CSIR), and the Management and Staff of the Institute for Scientific and Technological
Information (INSTI) for granting me the study leave to pursue the post-graduate course. To the
management and staff of the University of Ghana Hospital especially Messrs Gaisie and Offei, I say
thank you for granting me opportunity to use the data at your outfit for this study.
Mention must also be made of these people for their support, encouragement and pieces of advice that
spurred me on to go through this master’s programme successfully, Mr. C. Entsua-Mensah, Director,
INSTI-CSIR, Mrs. Marjorie Ethel Danso-Manu, Head, Department of Statistics, UG and Mr. Kwabena
Sarpong-Boateng, Tennessee USA.
I owe special gratitude to Mr. Martin Egblewogbe, Physics Department for reading the manuscript and
making useful suggestions towards this work, Messrs J.O Tackie-Yarboi and George Edward Neizer,
all of AQ Solutions for their Technical input and Prof. Jeffrey D. Ullman, Department of Computer
Science, Stanford University for his thought provoking questions and suggestions.

To the Church Board and the Youth Ministry of Global House of Help (Ebenezer Assembly of God
Church, Kotobaabi) for their prayers; my siblings for being there for me; Prisca, Power, Herty, and my
course mates for their encouragements.
Finally, to all who assisted me in diverse ways, I say thanks and may God bless you.

TABLE OF CONTENTS
DECLARATION i
DEDICATION ii
ABSTRACT iii
ACKNOWLEDGEMENT iv
TABLE OF CONTENTS vi
LIST OF FIGURES ix
CHAPTER ONE INTRODUCTION TO THE STUDY 1
1.0 Background to the study 1
1.1 Brief History of the University of Ghana Hospital 6
1.1.1 Medical Records Unit 7
1.2 Statement of the problem 8
1.3 Objectives of the Study 10
1.4 Scope 10
1.5 Justification 10
1.6 Methodology 12
1.7 Significance of the Study 13
1.8 Conclusion 14
CHAPTER TWO DATA WAREHOUSING, DATA MART AND 15
DATA MINING CONCEPTS
2.0 Introduction 15
2.1 Information systems 142.2 Data Warehousing 17
2.2.1 Data warehousing and OLTP systems 202.2.2 Problems with datawarehousing 202.2.3 Benefits of Data Warehousing 21
2.3 Data Marts 21

2.3.3 Users of Data Warehouse and Marts 22
2.4 Data Mining 22
2.4.1 Data Mining Process 25
2.4.2 Data Mining Techniques and Models 25
2.4.3 Data Mining Functions 26
2.4.4 Data mining problems/issues 26
2.5 Current Data Mining Research Efforts 27
2.5.1 Data Warehousing and Data Mining In Healthcare 30
2.5.2 Benefits of data warehousing and data mining in Healthcare 30
2.5.3 Problems of data warehousing and data mining in Healthcare 34
2.5.4 Health Data Mining Software 36
2.6 Conclusion 37
CHAPTER THREE THE EXISTING PATIENTS’ RECORDS 38 MANAGEMENT SYSTEM 3.0 Introduction 38
3.1 Description of the existing system 38
3.1.1 The Process 38
3.1.2 Databases and Records Storage 41
3.1.3 Hardware 41
3.1.4 Software 41
3.1.5 Human ware 41
3.1.6 SWOT Analysis 42
3.1.6.1 Strengths 42
3.1.6.2 Weaknesses 42
3.1.6.3 Opportunities 43
3.1.6.4 Threats 43
3.2 Conclusion 44

CHAPTER FOUR INFORMATION REQUIREMENTS 45
OF DECISION MAKERS
4.0 Introduction 45
4.1 Monthly Statistical Report 45
4.2 Financial Statistical Report 46
4.3 Patient Status Report 46
4.4 Pharmaceutical report 47
4.5 Conclusion 47
CHAPTER FIVE DESIGN AND DEVELOPMENT OF THE PATIENTS’ DATA MINING SYSTEM 48
5.0 Introduction 48
5.1 Database Design for Data Mart 48
5.1.1 Data Dictionary of the Database of the Data Mart 50
5.2 The Star Schema Model 59
5.2.1 Data Dictionary for the Star Schema of Data Mart 61
5.3 Development Tool 66
5.4 Input design 66
5.5 Preparing the Data Mart for Mining 77
5.6 Queries 81
5.7 Reports 83
5.8 Conclusion 86
CHAPTER SIX PATIENT DATA MINING AND RESULTS 87
6.0 Introduction 87
6.1 Reports 87
6.2 Monthly Statistical report 87
6.3 Financial Statistical Report 97
6.4 Patient Status Report 98
6.5 Pharmaceutical Report 108
6.6 Conclusion 117

CHAPTER SEVEN RECOMMENDATIONS AND CONCLUSIONS 118
7.0 Recommendations 118
7.1 Conclusion 120
REFERENCES 122

LIST OF FIGURES
Fig. 1.1 Organisational chart of records unit
Fig. 3.1 Data Flow Diagram of Patient Record Management System
Fig. 5-1 Entity Relationship (ER) Diagram
Fig. 5-2 Logical Data Model of Data Mart (Star Schema)
Fig. 5.3 The Main switchboard
Fig. 5.4 The Patient Information Form
Fig. 5.5 The Treatment Form
Fig. 5.6 The Diagnosis Form
Fig. 5.7 The Visit Form
Fig. 5.8 The Outcome Form
Fig. 5.9 The Drug Form
Fig. 5.10 The Admission Form
Fig. 5.11 The Purpose of Visit form
Fig. 5.12 The Physician Form
Fig. 5.13 Extract and Load Data Mart form
Fig 5.14 Extract and Load Data Mart Message Box One
Fig. 5.15 Extract and Load Data Mart Message Box Two
Fig. 5.16 Extract and Load Data Mart Message Box Three
Fig. 5.17 Queries Interface
Fig. 5.18 Reports Interface
Fig. 5.19 Patients’ Data Mining System
Fig. 6.1 Top ten causes of Hospital Attendance
Fig. 6.2 Total Treatment and Maintenance Incomes
Fig. 6.3 Main Causes of Hospital Attendance
Fig. 6.4 Number of Patients Admitted By Status
Fig. 6.5 Outcomes of Patients Attendance
Fig. 6.6 Gender of Admitted Patients
Fig. 6.7 Wards of Admitted Patients
Fig. 6.8 Status of Admitted Patients
Fig. 6.9 Patient Diagnosis and Prescription
Fig. 6.10 Total Treatment and Maintenance Incomes
Fig. 6.11 Number of Patients by status
Fig. 6.12 Patient Attendance by Gender
Fig. 6.13 Number of Patients According to Diagnosis
Fig. 6.14 Number of Patients According Address
Fig. 6.15 Patient Attendance by Age
Fig. 6.16 Patients Diagnosis
Fig. 6.17 Prescriptions by Gender of Patients
Fig. 6.18 Drugs Consumed By Patients
Fig. 6.19 Prescribed Drugs and Age of Patients
Fig. 6.20 Diagnosis and Drugs Prescribed Per Patients
Fig. 6.21 Top Ten Causes of Hospital Attendance
Fig. 6.22 Status of Patients and Drugs Prescribed

CHAPTER ONEINTRODUCTION TO THE STUDY
1.0 Background
The past two decades have seen a dramatic increase in the amount of data being stored in electronic
format. This accumulation of data has taken place at an explosive rate. It has been estimated that the
amount of information in the world doubles every 20 months and the size and number of databases are
increasing even faster (Dilly 1995:1). According to Marakas (1998:5), during the 1980s, businesses
and industries all over the globe participated in a “frenzy” of automation. Almost literally, “if it moved,
it was computerised”. In this regard, the office became the new frontier for analysts and software
engineers much as the factory floor had been in the prior decade. This overwhelming concentration on
the automation of business processes appeared to offer organisations the opportunity to improve from
within and realise benefits such as increased profits and reduced costs.
Although many mission-critical business processes were improved during this period, the support of
decision making throughout the organisation remained focused on the operational and functional levels
of the organisation. Basic stock reports gushed out of the organisation’s information systems at an
alarming rate on a daily, weekly, and monthly basis.
Often, the data used to construct these recurrent emanations were too old, too detailed, or too
aggregated. In some cases, the use of such reports led to negative consequences seemingly greater than
if no information had been used.
By the end of the 1980s, it became clear to most organisations that if they were to identify a single key
to survival in the 1990s and beyond, it would be the ability to analyse, plan, and react to changing
business conditions in a much more rapid fashion. To accomplish this, management at all levels of the
organisation would need more and better information.
Database Management Systems gave access to the data stored but this was only a small part of what
could be gained from the data. Traditional On-Line Transaction Processing Systems (OLTPs), are good
at putting data into databases quickly, safely and efficiently but are not good at delivering meaningful
analysis in return.
In the view of Marakas (1999), for most part, these data were literally “locked up” in a thousand
computer systems and were, metaphorically speaking, “data in jail”. It is estimated that only a small
fraction of the data that are captured, processed, and stored in the enterprise is ever actually made
available to executives and decision makers.
The concept of a data warehouse or a data mart is part of the response by information technology to
meet this identified need. It is an elegantly simple concept that, over time, has the potential to evolve
into a significant contributor to the success and stability of an organisation in the global marketplace.
The data mart provides a facility for integrating the data generated in a world of unintegrated
information systems. A functional data mart organizes and stores all of the available data needed for
informational and analytical processing over a historical time perspective.
Data storage became easier as the availability of large amounts of computing power at low cost became

available i.e. the cost of processing power and storage has fallen and has made data cheap. There was
also the introduction of new machine learning methods for knowledge representation based on logic
programming in addition to traditional statistical analysis of data.
The new methods tend to be computationally intensive hence a demand for more processing power.
Improved data and information handling capabilities have contributed to the rapid development of new
opportunities for knowledge discovery. Interdisciplinary research on Knowledge Discovery in
Databases (KDD) has emerged in the present decade (Dilly, 1995:4).
Data mining as automated pattern recognition, is a set of methods applied to KDD that attempts to
uncover patterns that are difficult to detect with traditional statistical methods. Patterns are evaluated
for how well they hold on unseen cases. Databases, data warehouses, and data repositories are
becoming ubiquitous, but the knowledge and skills required to capitalize on these collections of data
are not yet widespread. The use of traditional verification-based approaches to analysis is difficult
when the data is massive, highly dimensional, distributed, and uncertain. Data Mining is the process of
discovering unexpected patterns and trends in data. Yet this process is often misunderstood and
undervalued (Abbott et al, 1999:2).
Data mining claims a novel kind of data exploitation - it is not simply the hypothesis confirmation of
statistics; nor is it simply the data visualization of graphs and plots. Data mining is becoming a force to
be reckoned with, because of the way it can generate new ideas.
It is one of the most efficient and effective ways to add value to data - and the kind of investments
many companies are making in data accumulation and storage right now may be hard to justify without
it.
Theus (2003: 298) identified two factors which basically triggered the momentum of data mining in the
last 10 years. One factor is the fact that more and more organisations were able to gather large amounts
of data on their customers and their transactions.
With modern database systems, these data were accessible to analysts in Research and Development
(R&D) and Marketing in an unprecedented easy and convenient way. The second factor is that software
companies started to develop “out of the box, off the shelf” applications, which apparently would serve
the data analysis needs of those companies.
The health sector in recent times has seen an increasing use of information and communication
technology in almost all facets of health service delivery. These developments are taking place largely
in an environment in which the infrastructure for the deployment and use of Information Technology
remain either weak or uncertain. Among the many weaknesses in infrastructure are the unreliable
domestic electricity supply and the lack of well-developed national technology infrastructures; an
inadequate level of computer literacy, computer density and an underdeveloped telecommunications
infrastructure. These limitations are especially pronounced in the rural areas where the need for health
services is strongest (Ghana Health Policy Document, 2000:1).
It is an acknowledged fact that information and communications technology can provide direct benefits
to health care delivery primarily by increasing access to medical and health care. This role of
technology in health care has been summed up in the Alma-Ata declaration of 1978 which state that
“Primary health care is essential health care based on practical, scientifically sound and socially
acceptable methods and technology made universally accessible and at a cost that the community and
country can afford”.

According to Hersh (2003), we are in an era of uncontrolled health care costs, compromised patient
safety, and a lack of utilization of Information Technology applications that have the potential to
improve the situation. We are also on threshold of great new scientific advances in genomics and
related disciplines. The discipline that focuses on the acquisition, storage, and use of information in
health and biomedicine is called Medical Informatics. Hersh defined Medical Informatics as the
integrative discipline that arises from the synergistic application of computational, informational,
cognitive, organisational, and other sciences whose primary focus is the acquisition, storage, and use of
information in the health/biomedical domain.
1.1 Brief History of the University of Ghana Hospital
The University Hospital was commissioned in 1957 as a department of the University of Ghana (UG)
to provide medical care to the university community comprising staff and their dependents, and
students. In 1976, the services of the hospital were extended to the general public to cater for the rapid
growth in population of the surrounding communities. In recognition of this extended responsibility,
the Ministry of Health (MOH) provided assistance annually in the form of drug supplies, equipment
and instruments until 1986 when the cash and carry system was introduced. Currently classified as a
district hospital by the MOH, it provides general and specialist care.
The hospital is governed by the statutes of the University and is funded from the university’s annual
subvention allocation (PriceWaterHouseCoopers, 2000:19).
The hospital is an 80 bed hospital located behind the Legon Police station opposite the UG main
entrance. The Hospital also receives referral cases from the Student Clinic located on the UG campus,
private hospitals and clinics within its catchment area (Annual Report, 2000:8).

1.1.1 Medical Records Unit
Of particular interest in this study is the records unit. The records unit is controlled by a Biostatistician
who is in charge of the general administration and management of the unit.
He reports directly to the Director of University Health services as well as the Administrator of the
Hospital. There are other staff that report directly to the Biostatistician and assist in data collection from
patients and management of records.
The unit has two divisions under it. One handles records of Senior members and staff, as well as their
dependents while the other department deals with the records of Junior staff, and their dependents,
private patients, public institutions, students, and guests of the University.
Figure 1.1
Organisational Chart of the records unit
1.2 Statement of the Problem
The Medical Records Unit of the University Hospital keeps records on patients. Such records include
in-patients, out-patients, out-patients’ and in-patients’ morbidities, and mortality returns, monthly
returns on deliveries, clinical procedures, outcomes and costs, diagnosis, medical practitioners, and bed
occupancy. This record keeping is not automated. Due to the current medical record management
system, the majority of out-patients do not have a full medical record. With this situation, physician’s
time is wasted by having to collect all this information again.
In addition, it becomes difficult to keep track of the patients and also almost impossible for physician to
review this kind of medical record. This reduces the ability to carry out high quality clinical research.
Poor medical record management not only compromises the continuity of healthcare, but also the
quality of healthcare delivery in the hospital.

The patient’s age instead of date of birth is captured. Thus, when the current age of a patient who
visited the hospital say, five years ago is required, it has to be calculated. In addition, the same medical
record number of a staff is assigned to his or her dependents and this situation does not help in further
clinical research on an individual patient. Therefore, it is necessary to find a tool for managing and
organizing patients’ medical records. In the current records management system, it is difficult for the
staff to determine the relationships in these data with traditional statistical methods to provide
information, which are critical for a wide variety of problems that confront management of the
hospital. Calculators as well as manual methods – pen and paper – are used to calculate frequencies,
means, as part of the data analysis at the unit. Moreover, for a hospital in an academic environment,
collecting and organizing patients’ medical information is very important for clinical research and high
quality health care delivery.
A more comprehensive way of organising the data collected such that information can be retrieved on
time to satisfy decision makers and for the effective management of the hospital is important. This is
why this patients’ data mining system is being developed for the University of Ghana hospital.
1.3 Objectives of the Study
The main objective of the study is to develop a Patient’s Data Mart and use data mining techniques to
analyze it for relevant information. The project work specifically attempts to:
i. Capture comprehensive data on patient for clinical research
ii. Provide an insight into the disease patterns among patients of thehospital
iii. Review patients’ overall medical information
iv. Provide the Hospital Authority with data mining solutions andservices to allow them understand health related behaviours and the pathologiesencountered.

1.4 Scope
The study covered the Medical Records Unit of the University Hospital where records on patients and
the various clinical procedures used; costs and the outcomes are kept. A three stage Data Mart
Development Life Cycle was adopted. These were Planning, Development and Deployment. Planning
resulted in the delivery of a project definition document and a detailed project plan. The two documents
detail a clearly defined scope, an overall schedule of the project activities, the project organisation and
clearly defined project control. Development delivers a Data Mart prototype and a revised plan for
executing the Deployment stage. The Data Mart deliverables include a data base loaded with live
operational data, extract and load scripts; installations and configuration of the query environment; and
design documents.
Deployment delivered a production Data Mart and documentation. Deliverables for the production Data
Mart include a fully populated database optimised for performance, production extract and load scripts,
a production end-user query environment and production reports. The documentation deliverables
include system documentation and initial training of users and support staff. Clustering and
classification data mining tools were used to mine the data mart.
1.5 Justifications
Lack of access to relevant and timely information poses a threat to health care delivery in Ghana. Some
of the data collected is of poor quality due to low capacity, lack of appreciation of the information
generated from them and inappropriate data collection tools.
Although the Hospital has been managed over the years with the available data, it could have been
better managed if the large operational database had been analyzed to reveal some of the trends in it.
With the passage of the Health Insurance bill into law, the University Hospital will be required to
organize its internal systems to provide services as prescribed by the law. This would require extensive
restructuring of both outpatients and inpatient services.

The results of the study would help to analyze the available dataset and provide management with
timely and accurate information for effective decision-making.
1.6 Methodology
Primary data was collected using personal observation methods as well as interviewing decision makers
in the hospital. The decision makers were the Hospital Administrator, Director of Health Services,
Pharmacist, Chief Nursing Officer, and Accountant. Secondary data was also obtained from
administrative documents and the patient’s files available at the records unit. Other secondary data was
obtained from books, journals, papers and the Internet on the subject.
A Strengths, Weaknesses, Opportunities and Threats (SWOT) analysis was carried on the existing
system to determine why the current methods are used and points out its shortcomings. It also
determined whether it was feasible to improve upon the current system or to develop a new one. A Data
Flow Diagram (DFD) was used to model the day-to-day transactional processes within the existing
system.
An Entity-Relationship Diagram (ERD) was used to develop a conceptual model for an on-line
transaction processing system (OLTP) database management system (DBMS) to serve as a source
system for the Data Mart. Microsoft Access, a Relational Database Management System was used to
develop this database system and it captured the day-to-day transactional processes of the Records Unit
since there was no computerised database currently available at the Unit.
Afterwards, a Star Schema Model was created for the data mart to be used for the data mining process.
Microsoft Access was again used to build the data mart based on the star schema model. Queries were
developed using Microsoft Access to Extract, Transform and Load (ETL) data into the data mart.
Microsoft Access Queries and Reports were developed for the data mining process. The programme
was tested and an overview of the necessary control and security measures for implementation was
considered.

1.7 Significance of the Study
For those in Academia and Research, the study would among others (i) Provide good grounding in data
mining and its related concepts, like data warehousing, data marts and so on. (ii) Enable research by
organisations involved in Marketing, Telecoms, Insurance and Banks into using data mining techniques
to increase Returns on Investment (ROI).
In the case of practitioners, the results of the study would (i) Enable medical practitioners discharge
their duties efficiently and effectively, (ii) Assist the hospital authorities to better manage their facilities
and Staff (iii) Assist the hospital authorities to contribute effectively to the efficient and smooth
running of the various insurance schemes that are being implemented, (iv) Provide an easy to use
interface with the capability of quickly drilling down to increasingly detailed patient information, (v)
Improve quality of patient care through the use of data, trend and comparative analysis of clinical data,
(vi) Provide detailed clinical information to any Health Research Data warehouse, which will be used
to analyze large amounts of data in long-term research projects, (vii) Provide health services research
through data management and analysis for better Policy Support.
The result will be useful to the government health managers, nongovernmental healthcare providers and
their managers, and policy makers in health and related sectors of the economy.
Finally, the Ministry of Health would benefit immensely since as part of its management information
and performance monitoring, it hopes to improve upon the application of appropriate technology for
data collection, storage, analysis and dissemination of health information.

1.8 Conclusion
This chapter examined the background of the study and the methodologies adopted in the study as well
as the advantages to be derived from the study. The next chapter reviews the available literature on the
concepts used in the study.
CHAPTER TWO
LITERATURE REVIEW
2.0 Introduction
This chapter reviews the concepts and literature relevant to the study. Section 2.1 opens with review on
Information Systems, followed by section 2.2 on Data warehousing and section 2.3 on Data Marts and
users of it. Section 2.4 deals with data mining, and related researches and Section 2.5 focuses on
current research work on data mining , benefits, problems and software being used. Section 2.6
concludes the chapter.
2.1 Information Systems
An information system according to Laudon and Laudon (2000:7), is a set of interrelated components
working together to collect, process, store, and disseminate information to support decision making,
coordination, control, analysis, and visualization in an organisation. Four main kinds of information
systems were identified that serve different organisational levels. These are operational-level systems,
knowledge-level systems, management–level systems and strategic level systems. Information systems
are built to serve each of the four levels of an organisation. According to Laudon and Laudon (2000),
there are six major types of information systems in contemporary organisations that are designed for
different purposes and different audiences. Operational level systems are Transaction Processing
Systems (TPS), such as payroll or order processing, that track the flow of the daily routine transactions
necessary to conduct business. Knowledge-level systems support clerical, managerial, and professional
workers.
They consist of office automation systems (OAS) for increasing the productivity of data workers and
knowledge work systems (KWS) for enhancing the productivity of knowledge workers. Management
level systems i.e. Decision support systems (DSS) and Management Information systems (MIS) provide
the management control level with reports and access to the organisation’s current performance and
historical records. Most MIS reports condense information from a TPS and are not highly analytical.
Decision support systems (DSS) support management decisions when these decisions are unique,
rapidly changing, and not specified easily in advance. DSS have more advanced analytical models and
data analysis capabilities than MIS and often draw on information from external as well as internal
sources.
Executive support systems (ESS) support the strategic level by providing a generalized computing and
communications environment to assist senior management’s decision making. Laudon and Laudon
(2000:37) indicated that the various types of systems in the organisation exchange data with one
another. Transaction processing systems are a major source of data for other systems, especially MIS
and DSS. The information needs of the various functional areas and organisational levels are too
specialized to be served by a single system. With the increasing amount of Data from these systems,
there is the need to organize it in such a way that Information and Knowledge can readily be made
available for decision making purposes.
2.2 Data Warehousing

A data warehouse is a relational database management system (RDMS) designed specifically to meet
the needs of transaction processing systems. It can be loosely defined as any centralized data repository,
which can be queried for business benefit. Data mining potential can be enhanced if the appropriate
data has been collected and stored in a data warehouse.
Data warehousing is a new powerful technique making it possible to extract archived operational data
and overcome inconsistencies between different legacy data formats. As well as integrating data
throughout an organisation, regardless of location, format, or communication requirements, it is
possible to incorporate additional or expert information.
According to John McIntyre of SAS Institute Inc, it is the logical link between what the managers see in
their decision support i.e. ESS applications and the company's operational activities. In other words the
data warehouse provides data that is already transformed and summarized, therefore making it an
appropriate environment for more efficient DSS and ESS applications.
In the view of Inmon (1993:48), data warehousing is a subject-oriented, integrated, time-variant, and
non-volatile collection of data in support of management’s decision making process.
The first phase in data warehousing is to "insulate" an organisation’s current operational information,
i.e. to preserve the security and integrity of mission-critical On-line Transaction Processing (OLTP)
applications, while giving one access to the broadest possible base of data.
The resulting database or data warehouse may consume hundreds of gigabytes - or even terabytes - of
disk space. What is required then are efficient techniques for storing and retrieving massive amounts of
information. Increasingly, large organisations have found that only parallel processing systems offer
sufficient bandwidth.
The data warehouse thus retrieves data from a variety of heterogeneous operational databases. The data

is then transformed and delivered to the data warehouse/store based on a selected model (or mapping
definition).
The data transformation and movement processes are executed whenever an update to the warehouse
data is required so there should some form of automation to manage and execute these functions. The
information that describes the model and definition of the source data elements is called "metadata".
The metadata is the means by which the end-user finds and understands the data in the warehouse and
is an important part of the warehouse.
Data cleansing is an important aspect of creating an efficient data warehouse in that it is the removal of
certain aspects of operational data, such as low-level transaction information, which slow down the
query times.
The cleansing stage has to be as dynamic as possible to accommodate all types of queries even those,
which may require low-level information. Data should be extracted from production sources at regular
intervals and pooled centrally but the cleansing process has to remove duplication and reconcile
differences between various styles of data collection.
A data warehouse can be used in different ways for example it can be used as a central store against
which the queries are run or it can be used to like a data mart. Data marts, which are small warehouses,
can be established to provide subsets of the main store and summarized information depending on the
requirements of a specific group/department. The central store approach generally uses very simple data
structures with very little assumptions about the relationships between data whereas marts often use
multidimensional databases which can speed up query processing as they can have data structures
which are reflect the most likely questions. Another approach to data warehousing is the Parsaye's
Sandwich Paradigm (Dilly, 1995:5).
This paradigm encourages acceptance of the probability that the first iteration of a data warehousing
effort will require considerable revision. The Sandwich Paradigm advocates the following approach: (i)
Pre-mine the data to determine what formats and data are needed to support a data-mining application;

(ii) Build a prototype mini-data warehouse i.e. the meat of the sandwich, with most of the features
envisaged for the end product; (iii) Revise the strategies as necessary; and (iv) Build the final
warehouse.
2.2.1 Data Warehousing and OLTP Systems
A database which is built for OLTP is generally regarded as unsuitable for data warehousing as they
have been designed with a different set of needs in mind i.e. maximizing transaction capacity and
typically having hundreds of tables in order not to lock out users etc. Data warehouses are interested in
query processing as opposed to transaction processing.
OLTP systems cannot be repositories of facts and historical data for business analysis. They cannot
quickly answer ad hoc queries and rapid retrieval is almost impossible. The data is inconsistent and
changing, duplicate entries exist, entries can be missing and there is an absence of historical data, which
is necessary to analyze trends. Basically OLTP offers large amounts of raw data, which is not easily
understood. The data warehouse offers the potential to retrieve and analyse information quickly and
easily. The data warehouse serves a different purpose from that of OLTP systems by allowing business
analysis queries to be answered as opposed to "simple aggregations" such as `what is the current
account balance for this customer?’.
2.2.2 Problems with Data Warehousing
The problems associated with developing and managing a data warehouse as identified by
(Greenfield, 1996:55) include underestimation of resources for data loading, hidden problems with
source systems, required data not captured, increased end-user demands, data homogenization, high
demand for resources, Data Ownership, high maintenance, long-duration projects, and complexity of
integration.
2.2.3 Benefits of Data Warehousing

The primary purpose of data warehousing is to provide information to business users for strategic
decision making. According to Connolly and Begg (2005:1152), the successful implementation of a
data ware house can bring major benefits to an organisation including potential high returns on
investment, competitive advantage and increased productivity of corporate decision-makers.
2.3 Data Marts
A related concept to a data warehouse is a Data Mart. Mallach (2000:469) indicated that it is a smaller
version of a data warehouse, typically containing data related to a single functional area of an
organisation or having limited scope in some other way. A data mart holds a subset of the data in a
data warehouse normally in the form of a summary data relating to a particular department or business
function. The data mart can be a standalone or linked centrally to the corporate data warehouse. As a
data warehouse grows larger, the ability to serve the various needs of the organisation may be
compromised.
In the view of Connolly and Begg (2005:1173), the popularity of data marts stems from the fact that
corporate-wide data ware houses are proving difficult to build and use. Other reasons identified for the
increasing popularity include (i) to give users access to the data they need to analyze most often, (ii) to
provide data in a form that matches the collective view of the data by a group of users in a department
or business function,
(iii) to improve end-user response time due to the reduction in the volume of data to be accessed and
(iv) to provide appropriately structured data as dictated by the requirements of end-user access tools
such as OLAP and data mining tools, which may require their own internal data base structures. In
practice these tools often create their own data mart designed to support their specific functionality.
2.3.1 Users of Data Warehouse and Marts
Mallach (2000:470) identified the ideal data warehouse or data mart user as (i) A person whose job
involves drawing conclusions from and making decisions based on, large masses of data , (ii) A person
who does not want to (or cannot) get involved with finding and organizing the data for this purpose,
(iii) The person who does not want to (or cannot) access a database in a highly technical fashion and
(iv) Any person or group of people whose decisions have enough value to the organisation to justify the
data warehousing effort. This is because building a data warehouse is at a cost.
2.4 Data Mining
The term data mining has been stretched beyond its limits to apply to any form of data analysis. Some
of the numerous definitions of Data Mining, or Knowledge Discovery in Databases are: Data Mining,
or Knowledge Discovery in Databases (KDD) as it is also known, is the nontrivial extraction of
implicit, previously unknown, and potentially useful information from data.
This encompasses a number of different technical approaches, such as clustering, data summarization,
learning classification rules, finding dependency net works, analysing changes, and detecting anomalies
(Frawley et al, 1995:1).
Data mining is the search for relationships and global patterns that exist in large databases but are
`hidden' among the vast amount of data, such as a relationship between patient data and their medical
diagnosis. These relationships represent valuable knowledge about the database and the objects in the
database and, if the database is a faithful mirror, of the real world registered by the database.
(Holshemier and Siebes, 1994:4). Other definitions for data mining are given by (Theus, 2003:298),
(Raghu, and Gehrke, 2000), (Berry and Linoff, 2000:136), (Gϋrsakal and Acar, 1999:136), (Bicen and
Oktay Firat, 2003:136), (Marakas, 1999:356), (Frand, 2004:1), (Grossman et al, 1998:2) and (Bicen,
2002:15).
The analogy with the mining process is described as Data mining refers to "using a variety of
techniques to identify nuggets of information or decision-making knowledge in bodies of data, and
extracting these in such a way that they can be put to use in the areas such as decision support,
prediction, forecasting and estimation. The data is often voluminous, but as it stands of low value as no
direct use can be made of it; it is the hidden information in the data that is useful"(Clementine User
Guide, 2004:1).
Basically data mining is concerned with the analysis of data and the use of software techniques for
finding patterns and regularities in sets of data. The computer is responsible for finding the patterns by
identifying the underlying rules and features in the data.
The idea is that it is possible to strike gold in unexpected places as the data mining software extracts
patterns not previously discernable or so obvious that no one has noticed them before. Data mining
analysis tends to work from the data up and the best techniques are those developed with an orientation
towards large volumes of data, making use of as much of the collected data as possible to arrive at
reliable conclusions and decisions. The analysis process starts with a set of data, uses a methodology to
develop an optimal representation of the structure of the data during which time knowledge is
acquired.
Once knowledge has been acquired this can be extended to larger sets of data working on the
assumption that the larger data set has a structure similar to the sample data. Again this is analogous to
a mining operation where large amounts of low-grade materials are sifted through in order to find
something of value. While Data mining and knowledge discovery in databases (or KDD) are frequently

treated as synonyms, data mining is actually part of the knowledge discovery process.
2.4.1 Data Mining Process
An approach which could be used is the Cross Industry Standard Process for Data Mining
(CRISP-DM) data mining process model, which is not specific to any particular industry or tool
(Connolly and Begg, 2005:1239).
Zaïane (1999:4) however stated that the knowledge discovery in Databases process comprises of a
few steps leading from raw data collections to some form of new knowledge. The iterative process,
Zaïane (1999:3) indicated consists of these steps: Data cleaning, Data integration, Data Selection, Data
Transformation, Data Mining, Pattern evaluation, and Knowledge representation. He indicated that it is
common to combine some of these steps together. For instance, data cleaning and data integration can
be performed together as pre-processing phase to generate a data warehouse or data mart. Data
selection and data transformation can also be combined where the consolidation of the data is the result
of the selection, or, as for the case of data warehouses, the selection is done on transformed data.
2.4.2 Data Mining Techniques and Models
Different levels of analysis available include artificial neural networks, Genetic algorithms, Decision
trees, nearest neighbour method, Rule induction, and Data visualization. IBM has identified two types
of model or modes of operation, which may be used to unearth information of interest to the user.
These are Verification Model and Discovery Model.
2.4.3 Data Mining Functions
Data mining methods may be classified by the function they perform or according to the class of
application they can be used in. Karuna (1997:2) identified three algorithms, namely, Clustering or
Classification, Association rule, and Sequential analysis while in addition to these three; Edelstein

(1996:469) added forecasting. According to Karuna (1997:2), in clustering/classification, a set of data
is analyzed and a set of grouping rules are generated which can be used to classify future data.
2.4.4 Data Mining Problems/Issues
Data mining systems rely on databases to supply the raw data for input and this raises problems in that
databases tend be dynamic, incomplete, noisy, and large. Other problems arise as a result of the
adequacy and relevance of the information stored.
In the view of Zaïane (1999:13), while data mining is still in its infancy, it is becoming a trend and
ubiquitous. He believes that before data mining develops into a conventional, mature and trusted
discipline, many still pending issues have to be addressed. Some of the issues he identified are Limited
Information, Noise and missing values, uncertainty, size, updates, and irrelevant fields, confidentiality,
cost of software and Technological infrastructure requirement such as size of the database and query
complexity.
2.5 Current Data Mining Research Efforts
The comments by Makulowich (1999:1), Erdelstein (1999:2), ANGOSS Systems as well as by the
personalities mentioned in their articles indicate that most researchers are still not clear as to what data
mining is.
Writing for the Washington Technology Online Journal, Makulowich (1999:1) indicated, “In the best of
all possible digital worlds, information is king. The universe, nothing but an expanding data
warehouse, is completely catalogued by omniscient reference librarians and continuously updated by IT
professionals who require no sleep”.
The ultimate goal is mass customization. Every meaningful relationship in the data is uncovered with

sophisticated analytical tools. Every end user interaction is captured. Every transaction between buyer
and seller is completely transparent. This grand vision of data mining suddenly narrows. The data is
dirty, that is, it can't be used without extensive "cleaning." The end user lacks the numeracy to work
intelligently with the tools, the IT department wars with statisticians over access to the data, and the
field lacks international standards.
According to Makulowich (1999:1), it is all part and parcel of any growing computer area, whether IP
telephony, wireless telecommunication or data mining. In the case of data mining, according to experts,
“it is a field that holds great promise”.
Erdelstein (1999:1) believes “Data mining is the application of these and other [artificial intelligence]
and statistical techniques to common business problems in a fashion that makes these techniques
available to the skilled knowledge worker, as well as the trained statistics professional.
What one really needs to know to do data mining effectively is the line of business in which they are in
and their data. More important is data and not mining. The standing joke is that “Data mining is what
IS people call statistics".
The difficulty in defining the field is echoed by another expert, Christopher Westphal, president and
founder of Bethesda, Md.-based Visual Analytics and co-author of "Data Mining Solution: Methods
and Tools for Solving Real-World Problems. “He admits early on that even though data mining has
been part of the IT vernacular for several years, people still view the process as magic. "This is partly
because no established road maps or procedures have been formally identified for guiding analysts to
profitable outcomes” (Erdelstein ,1999:2).
For Erick Brethenoux, vice president of Lazard Freres & Co. LLC, New York, and a data warehouse
and data mining analyst, the field is moving in at least two major directions: one aligned with
knowledge management and the other with greater data visualization techniques.

He divided the data mining aspect of knowledge management into categorization and filtering. In the
first case, it amounts to finding interesting trends and business intelligence in business data. For
example, in launching a new product, the organisation might want to determine if there are existing
patents on the product or process and, if there are, whether or not to buy them. Filtering can be combing
through information for use in knowledge management (Erdelstein, 1999:2).
Erdelstein (1999:1) again quoted Brethenoux to have said that , "With the trend of increasing use of the
World Wide Web, data mining opens the whole area of such things as pattern analysis of traffic,
allowing you to see who has access to what information”.
Makulowich (1999:2) concluded that the critical issues for data mining on which all agree is to
correctly define the business problem.
Another area that Data mining is applied is agriculture where a lot of activities have taken place.
Christensen and Di Cook (1998:1) describe simple numerical methods to establish the relationship
between 10 soil characteristics variables and corn yield. Nunyen et al (2001:1) demonstrates use of
data mining techniques on images to identify trash in ginned corn while Abdullah et al (2003:1)
studied about learning dynamics of pesticide abuse through data mining. The Australia’s
Commonwealth Scientific and Industrial Research Organisation (CSIRO) is involved in both research
and consulting in Data Mining for all sectors, especially Health.
2.5.1 Data Warehousing and Data Mining in Healthcare
Data warehousing and data mining applications have found their way into health research and a lot of
activities and documented reports can be seen in this area: - Bramson (2000:1-2), Hagland (2004:1-2),
Baylis (1999:1-10), Berndt et al (2000:2), and Sokol et al. (2001:1).
2.5.2 Benefits of Data Warehousing and Data Mining in Healthcare
Baylis (1999:1) indicated, “Health care generates mountains of administrative data about patients,

hospitals, bed costs, claims, etc. Clinical trials, electronic patient records and computer supported
disease management will increasingly produce mountains of clinical data. This data is a strategic
resource for health care institutions.
With the advent of data warehousing techniques, Baylis (1999:2) noted that specific areas of interest
may be investigated more thoroughly. Products such as INFoCOM from SMS, which is a clinically
based data warehouse product designed for use throughout a hospital, bring the potential for specialized
information production to the clinicians and managers desktop through the use of clinical workstations
and Executive Information Systems (EIS).
He continued by saying that “Data mining products are designed to take this one stage further. It brings
the facility to discover patterns and correlation hidden within the data repository and assists
professionals to uncover these patterns and put them to work. Therefore decisions rest with healthcare
professionals, not the Information systems experts.”
Schonlau et al (2003:294) used the techniques of data mining to explore the characteristics of diabetes
patients from the U.S medical expenditure panel survey (MEPS) by constructing patient profiles. The
profile consists of the variables total expenditure, number of ambulatory (office based visits, number of
visits to the emergency room, number of hospital (inpatient)) visits, number of home health visits and
physical and mental health status. They found out that hospital and home health visits are negatively
correlated; self –reported mental and physical health correlate well.
Eric Bremer, PhD., a Director of the Pediatric Brain Tumor Research Program at the Children’s
Memorial Hospital in Chicago is reported by Haglard (2004:2) as one doctor who knows well the
tremendous potential of data mining, which is using software programs for pattern recognition and
predictive analysis. He is steering a project that demonstrates the future of data mining in medical
research.
Bramson (2000:1), notes that “historically, healthcare providers have received a considerable amount of
data from third-party payors, but we have not always known what use to make of the information. Data

mining is an attempt to extract from the available data valuable nuggets of information that can create
change in health delivery. It also represents an opportunity to shape the way in which medicine will be
practiced in the 21st century. As physicians, we should be excited about being able to participate”.
Kantor (2001:2) noted that “the need to turn massive amounts of data into meaningful information is
especially profound within the healthcare industry, where the well-being, recovery and even lives of
patients may depend upon the result.
Data mining helps healthcare organisations recognize certain patterns within their patient data that are
often difficult to detect with traditional statistical methods. It can help a hospital or clinic answer such
daily business questions as what are our top ten paid procedures?”, can we identify the diagnosis-
related groups (DRGs) that receive the lowest amounts of reimbursement from Medicare or Medicaid? ,
how can we determine if we are receiving all the timely and accurate reports we need to make our
analyses, and how can we use our legacy system more effectively to identify patterns that will
maximize the output and efficiency of our operations.” Kantor (2001:2) continued by saying that,
having centralized and consolidated its data warehouse, implementing a Microsoft database,
middleware, and applications on Intel® Xeon™ and Itanium® servers, Clalit Health Services, today
can answer these questions and does so on a daily basis.
Baylis (1999:2) again indicated that findings from any data mining exercise could bring patterns to
surface (that might otherwise remain undiscovered), which may suggest alternative ways for treating
patients making better use of resources.
He concluded by noting that, the use of data mining has focused on evidence-based patterns from
previous patients treatment. In all likelihood, the absence of automated discovery of patterns would
leave many questions unasked. These questions, if asked, would benefit not only the resource
utilization for patient treatment, but also the health of the patient. Data mining according to him helps
professionals discover there patterns and put them to work. As models are based directly on history,
they represent the ultimate in evidence-based care. But technology is no panacea; professional, ethical

and practical issues must be addressed.
Oracle’s Berger has been quoted (Hagland, 2004:1) as saying that the potential of data mining is great
for health plans and providers to use data mining tools to improve patient care and plan member
service. Public health, medical research, patient care, health plan member segmentation, population
health management and individual customer services can all benefit from data mining.
Biritwum et al (2000:198) conducted a study to determine the pattern of disease or conditions leading
to hospitalization at Korle Bu Teaching Hospital, Ghana in 1996. They concluded among others that the
hospital managed a wide range of diseases over 1560 different (ICD-10) disease/conditions/injuries.
Pregnancy and child birth conditions formed 43%, infectious and parasitic diseases formed 8%, injuries
and poisoning formed 7% and perinatal period conditions formed 6 %. Malaria was still the major
cause of hospitalization and there was a high prevalence of HIV/AIDS, Tuberculosis and non-
communicable disease such as injuries, circulatory disease and malignancies.
A dbase IV programme was used for data capture and SPSS package was used in data analysis. From
their findings, they concluded that there is the need for institutionalization of the management system
and further extension of this approach to other facilities in Ghana. Bamgboye, and Familusi
(1990:128) carried out studies to examine pattern of pediatric deaths in the children’s emergency room
(CHER) of the University College Hospital, Ibadan between 1978 and 1986, and relates this to the
admission diagnosis. Data was collected from admission registers and case fatality and proportional
death rates calculated.
In another study by Bamgboye, and Familusi (1990:50) they looked at the pattern of diseases of
emergency admissions at the children’s emergency room of the University College Hospital.
The information extracted from the admission registers includes age, sex, residence, principal
diagnosis and outcome of admission. The extracted data were later processed, with an IBM PC micro-
computer using statistical software SURVEY MATE, for data entry, frequencies, and cross-
tabulations. Their studies may be classified as data mining based on the definition given earlier of data

mining.
According to Bresnahan (1997:3), one way data mining is helping health care providers cut costs and
improves care is by showing which treatments statistically have been most effective. Other areas she
identified include, helps health care management organisations to evaluate their doctors and facilities,
hospitals benefit from knowing how they compare with their peers, lets care givers identify people
statistically at risk for certain ailments so that they can be treated before the condition escalates into
something expensive and potentially fatal and fraud detection.
2.5.3 Problems of Data Warehousing and Data Mining in Healthcare
Hagland (2004:1) quoted Fran Turisco, a consultant in the Boston Office of first Consulting Group to
have said that, “A gradual but fundamental shift is taking place. Organisations used to mine claims
information and financial data, now they need to mine clinical information”.
Hospitals have lab and medication centres but sometimes do not have a lot of electronic information
with clinical documentation. “So they are putting in some of the advanced clinical information systems
needed for data mining”.
He again quoted Charles Berger, a senior director of product management for life sciences and data
mining at Boston-based Oracle Corporation as saying that “Health plans that already use data mining
have reasons to employ better data mining.
Deeper analysis of member populations and better assessment of at risk populations can reduce risk and
better serve their member’s needs, particularly as consumer-driven health plans become a force, experts
say, Soaring medical costs are driving such improvements”. Berger described a typical first-generation
use of data mining in which a payer client used Oracle’s data mining software to uncover billing
anomalies. “Certain patients repeatedly would go from doctor to doctor for procedures and certain
Doctors were routinely running up the biggest bills with those procedures.
According to Berger the next frontier for Oracle Corporation is Medical Research and thus it is
currently working on complex data mining in genomics, including projects at the national Institutes of
Health, Bethesda, Md. With data mining, he notes “we can handle hundreds, even thousands, of
variables.”
Bramson (2000:2) lamented in his paper about the fact that most of the data they obtain from third-
party payors are not adjusted beyond the fact that there is a commercial population and a Medicare
population. Since they knew that a difference exists between the two groups, they have adjusted the
data and classified patient’s age within 1-year, 5-year, or 10-year spans, as well as by gender. Such data
he noted comes largely from the insurance industry and are based on insurance claims.
Data-collection systems on which this information is based were not inept, but systems were designed
for bill payment, not medical management. He believes data mining is an iterative process that takes a
great deal of time with the intent to change physician behaviour to what we want it to become, through
the use of data.
Biritwum et al (2000:204) identified the lack of comprehensive map of data storage for Hospitals in the
past which meant that most reports have been made on incomplete data.
2.5.4 Health Data Mining Software
The potential for patient care and public health has encouraged a few pioneering organisations to
develop their own software programs. Medical researchers at Children’s Hospital, Boston developed an
analytical system called AEGIS (Automated Epidemiologic Geotemporal Integrated Surveillance). It
gathers and analyses data from various emergency departments, looking for patterns such as potential
infectious disease outbreaks, unexplained rapid increases in paediatric asthma and even lead poisoning
in children. (Hagland, 2004:2).
Health Data Desk is also another software tools to help government regulatory agencies, insurance
companies, HMOs, and healthcare providers find and explore patterns and exceptions in hospital

electronic billing claims record. Using both public and private databases, the top-level displays identify
hospitals with anomalous medical records, coding/billing patterns, inefficient and/or clinically
inappropriate treatment patterns by clinical product/service lines. According to (Hagland, 2004:1), Data
Description Inc, reported that analysis of Medicare public data using Health Data Desk is leading to the
recovery of hundreds of millions of dollars by HCFA and the Department of Justice from selected
hospitals throughout the USA.
Some Software developed for use in mining any data include SPSS Clementine, SAS Enterprise Miner,
S-Plus, MATLAB, Business Objects Business Miner, Cognos Scenario, Oracle Darwin, SGI MineSet,
WEKA and IBM Intelligent Miner.
2.6 Conclusion
The available literature on data mining, data warehousing and its related concepts and their application
in health care have been reviewed. It was realised that there is difficulty among researchers in defining
the term data mining. Although data mining is still in its infancy, it is becoming a trend and ubiquitous.
The problems of data mining as well as current data mining researches, especially in the health sector
were identified. The next chapter will take a critical look at the system under study.
CHAPTER THREE
THE EXISTING PATIENT’S RECORDS MANAGEMENT SYSTEM
3.0 Introduction
This chapter provides an overview and spells out the aims and objectives of the Medical Records Unit.
It also describes the existing patient records management system using Data Flow Diagram (DFD) and
SWOT analysis.
3.1 Description of the Existing System
To be able to know the requirements of an organisation, it is essential to describe the existing system.

The existing system of keeping medical records is outlined in this section.
3.1.1 The Process
The purpose of a patient’s visit to the hospital may be for review, or for treatment. When a patient
comes to the hospital for treatment for the first time, the medical records unit assigns a unique
Identification Number and a patient ID card labelled with the patient’s name and patient ID given. In
the meantime, general information such as the name of patient, address, age, gender, and status are
recorded on the card, which is given to the patient. When the patient sees the Physician, he or she
shows this card to the Physician. The patient may next go for a laboratory test or an x-ray and then go
straight to pharmacy with the prescription.
In the meantime, the Physician writes detailed information about the patient’s visit on his or her
treatment card and the card sent to the records unit at the end of the day.
The prescription is the Physician’s written instruction stating what drugs a patient should be issued
with. The pharmacist dispenses the drug and the patient makes payment at the accounts office. The
Pharmacist packages the drugs and gives them to the patients once they show receipt of payment from
the Accounts Office.
The patient may be discharged, admitted or referred after the visit. The medical record cards of all those
who are either discharged or referred are sent to the records unit for storage. For those who are
admitted, the medical record cards are kept with the patient in the ward. It is after the outcome of
admission that their medical records cards are returned to the records unit. The outcomes of admission
include discharged, referred, absconded, or died.
Return patients come to the hospital with their patient ID cards and their medical record cards are sent

to the Physician. The procedure is the same procedure as for a new patient. No new information is
recorded for return patients except data related to that particular visit.
For patients reporting at the emergency unit, they are issued with a new treatment card. Next, their
cards are sent to the medical records unit for ID numbers to be assigned and data recorded. Review
patients are treated as return patients.

Figure 3.1 Data Flow Diagram of Patient Record Management System
3.1.2 Databases and Records Storage
The Medical Records Unit of the University Hospital has no computerised medical records database.
Records of all consultancies, diagnoses and outcome of visit at the time of discharge are kept on
physical cards, which have unique identification numbers.
Each patient’s cards is kept at the records unit of the Hospital. Although a great deal of effort is
invested in maintaining this system, it has several draw backs. First, the patient‘s information is not

readily accessible to medical staff and researchers. The folders and all the information in them are
vulnerable to considerable loss or damage as a result of exposure to dust and from shortage of space.
The integrity of files and folders cannot be assured over time because there is no simple and effective
check of folders borrowed or taken away by patients.
3.1.3 Hardware
There are no computers and their accessories in the Records Management Unit.
3.1.4 Software
No computer software is being used currently at the Records Management Unit.
3.1.5 Human ware
The categories of staff at the Records unit are: One Research Grade Staff, Two Administrative
Assistants, Three clerks and a cleaner.
3.1.6 Strengths, Weaknesses , Opportunities and Threats ( SWOT) Analysis
There is the need to review the internal environment of the Medical records unit in order to access its
strengths and weaknesses, and also review the external environment to find out what opportunities
exist, and to identify the existing threats that are likely to impinge upon the operations of the Unit.
3.1.6.1 Strengths
§ High caliber of staff in the unit
§ Large volumes of patient data are available at the Unit.
3.1.6.2 Weaknesses
§ The patient‘s information is not readily accessible to medical

staff and researchers.
§ Patient’s age instead of Date of Birth is captured
§ Each University of Ghana member of staff and his/her
dependents use the same Medical Records Number.
§ The files are vulnerable to considerable loss or damage as a
result of exposure to dust and from shortage of space.
§ The integrity of files cannot be assured over time because there
is no simple and effective check of files borrowed or taken away by Doctors,
Researchers and some patients.
§ Retrieving patient’s records at times is very cumbersome due tooccasional mis-filing and the increasing number of patients.
§ Lack of appreciation of the data collected and the absence of data
collection tools such as computers and hand gloves.
§ Due to the current medical record management system, the
majority of out-patients do not have full medical records. With this situation, physician’s
time is wasted by collecting all information again.
§ It becomes difficult to keep track of the patients and also almost
impossible for the physician to review this kind of medical record. This threatens the
ability of clinicians to carry out high quality clinical research.
§ Inadequate staff and lack of motivation of the few staff at post.
§ Lack of computers (Every thing in the department is being donemanually)
3.1.6.3 Opportunities
§ To use Data Mining techniques to process the large volume
of patient
data at the unit.
§ To computerise the activities of the unit to generate timely

and reliable
information which would assist in the process of arriving at decisions by management at
the Hospital. This to a larger extent would have a positive impact on the Health
Insurance Scheme, which has been introduced. This is because information is valuable
in health care delivery.
3.1.6.4 Threats
§ Competition from adjoining Hospitals and clinics that have
been
registered under the health insurance scheme and are operating their health
facilities on purely business lines would require that accurate, timely,
relevant and detailed information is provided to the management of the
University Hospital by the Medical Record Unit.
3.2 Conclusion
It has been deduced from the analysis that the Medical Records Unit has problems, which requires a
new system to solve them. The next chapter identifies the information requirements of the decision
makers in the hospital.

CHAPTER FOUR
INFORMATION REQUIREMENTS OF DECISION MAKERS
4.0 Introduction
This section looks at the information required by the various decision makers in the hospital. The
records unit is supposed to provide the required information as reports to the Administrator and/
Director and the various decision makers i.e. Heads of Nursing, Pharmacy, and Finance Departments.
These reports are Monthly Statistical Report, Financial Statistical Report, Patient Status Report, and
Pharmaceutical report
4.1 Monthly Statistical Report
They are supposed to submit this report to the administrator at the end of each month. The main
components of this report include Top Ten Causes of Out-patient department attendance, Main causes
of hospital attendance, State of the wards - Number Admitted, Status of patients, Outcomes of
Admission, Drugs consumed per month, and Incomes for the month by general services.
The purpose of this report is to enable management identify pattern of diagnosis, determine patterns in

drug consumption, determine total cost per diagnosis, determine total income for the month, plan for
the wards and plan for staff and day-to-day administrative duties.
4.2 Financial Statistical Report
The report for the finance department is titled the Financial Statistical Report. The main components of
this report include the number of people who visited the Hospital and Income for the month by general
services. At the moment, this report is not being generated for the Head of Finance.
This report would assist management to reconcile the data collected by accounts clerks, be able to bill
clients especially institutions at the end of the month on time, to prepare annual and monthly budgets
for the hospital, to determine monthly revenue and expenditure, and to determine charges per patient in
the various units.
4.3 Patient Status Report
A report on patient’s status is supposed to be generated for the Chief Nursing officer. The Patient
Status Report must contain the following information on number of patient by breakdown of diagnosis
by month, by age, gender, address and status. Currently, the Chief Nursing Officer is not receiving
these reports.
The purpose of patient status report is to enable the chief nursing officer allocate Nurses to wards and
Know the localities where communicable diseases are endemic and inform the public health nurses to
carry out their outreach programme in those localities.

4.4 Pharmaceutical report
The Pharmaceutical report must contain information on hospital attendance of patient. It should be
according to the number of patient by status, age, gender, drugs prescribed, and diagnosis as well as
report on Top-ten diseases per month. The Head of Pharmacy currently, does not receive this report
from the records unit.
This report would enable the chief pharmacist to determine the types of drugs to order, to ascertain the
re-order level of drugs for specific diagnosis, to determine the amount of drugs dispensed to old-age
patients as well as children under age 5 years and to plan for suppliers of drugs.
The only report which is currently generated by the unit and submitted is the monthly statistical report
but not all the required information is included. The components of the incomplete monthly statistical
report include, top ten causes of out-patient department attendance, main causes of admission to the
hospital, and State of the wards - Number Admitted, Status of patients, Outcomes of Admissions.
4.5 Conclusion
It has been deduced from the information requirement analysis that the medical records unit requires a
system that would assist them to generate the required reports for decision makers. The next chapter
takes us through the necessary steps to follow when developing a system to solve these problems.
CHAPTER FIVE
DESIGN AND DEVELOPMENT OF THE PATIENTS’ DATA MINING SYSTEM
5.0 Introduction

This chapter looks at the steps that must be taken to develop a new system to solve the problems in the
existing system as enumerated in Chapters Three and Four.
5.1 Database Design for Data Mart
The processes identified in the existing system include records processing, issuing prescription,
receiving laboratory request, receiving prescription and receiving payments. The data requirements
associated with these processes are shown in the normalised Entity Relationship (ER) diagram of
Figure 5.1. The ER diagram forms part of the design documentation, which describes the Online
Transaction Processing (OLTP) system required to support the business processes of the hospital since
there is no computerised database available currently at the records unit. The entities identified in the
existing system which are being used to develop the database for the data mart include: “Physician”,
“Outcome”,” Diagnosis”, “Treatment”, “Drug”, “Visit”, “Admission”, “Patient” and “Purpose
”.

Figure 5-1: Entity Relationship(ER) Diagram
5.1.1 Data Dictionary of the Database of the Data Mart

To understand the entities in the database, it is necessary to describe the data in it so that the user is
aware of the content and make-up of the data fields. The data dictionary provides description of the
entity tables in the data base. The data dictionary for the relational database is shown below.
Physician Entity
Description: Details of Doctors working at the Hospital
Primary key: Physician_ID
Attributes Description Data type(length)Physician ID
Physician Name
Physician Type
A unique number for eachphysician
The name of the physician
The status of physician,either a Consultant orResident
Text (8)
Text(20)
Text (12)
Patient Entity
Description: Contains details of patients who visited the hospital

Primary Key: Patient_ID
Foreign Key: Treatment_ID references Treatment (Treatment_ID)
Foreign Key: Physician_ID references Physician (Physician_ID)
Foreign Key: Date_of_Visit references Physician_Diagnosis (Date_of_Visit)
Attributes Description Data type ( length)
Medical RecordNumberPatient_ID
Patient Name
Address
Date of Birth
Gender
Status
Treatment_ID
Physician_ID
Date_of_Visit
A number used to identify each patient
A unique alphanumeric value for eachpatient assigned by the researcher to ensureconfidentiality.
The name of each of the patients that visitedthe Hospital
Department which patient belongs to /or where they reside
Date of birth of a patient
Gender of patient
Status of patient (Senior, Junior and staffdependents, or private Patient)
A unique number for each treatment
A unique number for each physician
Date patient visited the hospital
Text (8)
Text(5)
Text(25)
Memo(35)
Date (12)
Text(2)
Text (15)
Text (8)
Text (8)
Date (12)

Drug Entity
Description: Describes the drugs prescribed for a patient
Primary Key: Drug_ID
Foreign Key: Patient_ID references Patient (Patient_ID)
Foreign Key: Treatment_ID references Treatment (Treatment_ID)
Foreign Key: Physician_ID references Physician (Physician_ID)
Foreign Key: Date_of_Visit references Physician_Diagnosis (Date_of_Visit)
Attributes Description Data type(length)
Drug_ID
Drug Name
Patient_ID
Treatment_ID
Date_of_Visit
Physician_ID
A unique number for each drug
The name of the drugs prescribed
A unique alphanumeric value for eachpatient assigned by the researcher toensure confidentiality.
A unique number for each treatment
Date patient visited the hospital
A unique number for each physician
Text (8)
Text (50)
Text(5)
Text(8)
Date(12)
Text(8)

Treatment_Notes Entity
Description: Describes the treatment Notes given to a patient
Primary Key: Treatment_ID
Foreign Key: Date_of_Visit references Physician_Diagnosis (Date_of_Visit)
Foreign Key: Physician_ID references Physician (Physician_ID)
Attributes Description Data type(length)
Treatment_ID
Date_of_Visit
Physician_ID
Treatment Notes
A unique number for eachtreatment
Date patient visited the hospital
A unique number for eachphysician
Notes about the treatment
Text (8)
Date(12)
Text(5)
Text(150)

Admission Entity
Description: Records details of the patient when admitted
Primary Key: Start Date
Foreign Key: Patient_ID references Patient (Patient_ID)
Foreign Key: Date_of_Visit references Physician_Diagnosis (Date_of_Visit)
Foreign Key: Physician_ID references Physician (Physician_ID)
Attributes Description Data type(length)

Patient_ID
Ward Name
End Date
Maintenance Cost
Start Date
Date_of_Visit
Physician_ID
A unique alphanumeric value foreach patient assigned by theresearcher to ensure confidentiality.
Ward to which patient was admitted
Date the outcome occurred
Total amount spent for eachadmission
Date patient was admitted
Date patient visited the hospital
A unique number for each physician
Text (5)
Text (15)
Date (12)
Currency (10)
Date (12)
Date(12)
Text(5)
Diagnosis Entity
Description: Describes the diagnosis for a patient
Primary Key: Diagnosis_ID
Foreign Key: Patient_ID references Patient (Patient_ID)
Foreign Key: Treatment_ID references Treatment (Treatment_ID)

Foreign Key: Physician_ID references Physician (Physician_ID)
Foreign Key: Date_of_Visit references Physician_Diagnosis (Date_of_Visit)
Attributes Description Data type(length)
Diagnosis_ID
Diagnosis Name
Patient_ID
Date_of_Visit
Physician_ID
Treatment_ID
A unique number for each diagnosis
The diagnosis that caused the physician toprescribe the treatment.
A unique alphanumeric value for eachpatient
Date patient visited the hospital
A unique number for each physician
A unique number for each treatment
Text (8)
Text (50)
Text(5)
Date(12)
Text(8)
Text(8)

Visit Entity
Description: Describes the visit made by each patient
Foreign Key: Patient_ID references Patient (Patient_ID)
Foreign Key: Purpose_ID references Purpose (Purpose_ID)
Foreign Key: Physician_ID references Physician (Physician_ID)
Foreign Key: Date_of_Visit references Physician_Diagnosis (Date_of_Visit)
Foreign Key: Outcome_ID references Outcome (Outcome_ID)
Attributes Description Data type(length)
Patient_ID
Date_of_Visit
Treatment Cost
Outcome_ID
Purpose_ID
Physician_ID
A unique alphanumeric value for eachpatient assigned by the researcher toensure confidentiality.
Date on which patient made the visit
Total cost of each treatment
A unique number for each outcome ofvisit
A unique number for each purpose ofvisit
A unique number for each physician
Text (5)
Date (12)
Currency(10)
Text (8)
Text (8)
Text(8)

Outcome Entity
Description: Describes the outcome of each visit by a patient
Primary Key: Outcome_ID
Foreign Key: Patient_ID references Patient (Patient_ID)
Foreign Key: Date_of_Visit references Physician_Diagnosis (Date_of_Visit)
Foreign Key: Treatment_ID references Treatment (Treatment_ID)
Foreign Key: Physician_ID references Physician (Physician_ID)
Foreign Key: Start Date references Admission (Start Date)
Attributes Description Data type(length)

Outcome_ID
Patient_ID
Date_of_Visit
Physician_ID
Treatment_ID
Start Date
Outcome Name
Outcome Type
A unique number for each outcome
A unique alphanumeric value foreach patient
Date patient visited the hospital
A unique number for each physician
A unique number for each treatment
Date patient was admitted
The outcome of the treatment-admitted, discharged, referred ordied.
Specifies the type of outcome,whether it is the result of a visit oradmission
Text (8)
Text(5)
Date(12)
Text(8)
Text(8)
Date (12)
Text (10)
Text (15)
Purpose Entity
Description: Describes the purpose of visit by patient to the hospital
Primary Key: Purpose_ID
Foreign Key: Patient_ID references Patient (Patient_ID)
Foreign Key: Physician_ID references Physician (Physician_ID)
Foreign Key: Date_of_Visit references Physician_Diagnosis (Date_of_Visit)

Attributes Description Data type(length)
Purpose_ID
Purpose_of_Visit
Physician_ID
Patient_ID
Date_of_Visit
A unique number for each purpose ofvisit
Purpose of each visit by patient
A unique number for each physician
A unique alphanumeric value foreach patient assigned by theresearcher to ensure confidentiality.
Date patient visited the hospital
Text (8)
Text(15)
Text (8)
Text (5)
Date(12)
5.2 The Star Schema Model
It is necessary to identify the grains of the fact table which means deciding exactly what a fact table
record represents. For this study, the fact table has been identified as “Summary” and the grain is
Income. Dimensions set the context for asking questions about the facts in the fact table. Dimension
tables in the study are “DM_Physician”, “DM_Diagnosis”, “DM_Treatment”, “DM_Outcome”,

“DM_Patient”, DM_Purpose, DM_Drug, and “DM_Time”. Each of these dimensions and fact
tables has attributes. An attribute is a property of an entity that is of interest to the organisation. For
example, attributes of the entity --- DM_Diagnosis --- are Diagnosis_ID and Diagnosis Name.
The star schema model for the study is shown as Fig. 5-2. A star schema model gives a detailed logical
representation of the data for an organisation or for a business area. The Star schema model is
expressed in terms of dimensions tables and a fact table, the relationship among them and their
attributes. This schema has been optimized for reporting and analysis.

Figure 5-2: Logical Data Model of Data Mart (Star Schema)
5.2.1 Data Dictionary for the Star Schema of Data Mart
Often a large number of data and information may be involved in a data mart. It is possible to have

hundred or more data fields or attributes in any given data mart. No one is capable of keeping track or
remembering the names and definitions of all these fields.
Additionally, there can be numerous dimensions and a fact table, each with its own attributes. To use
all these data prudentially, it is necessary to describe the data so that the user is aware of the content
and make-up of the data fields. The data dictionary provides description of the fact and every
dimension tables in the star schema of the data mart as well as their attributes and any special features
associated with them. The data dictionary for the Patient star schema is shown below.
Physician Dimension
Description: Details of Doctors working at the Hospital
Primary Key: Physician_ID
Attributes Description Data type(length)Physician_ID
Physician Name
Physician Type
A unique number for each physician
The name of the physician
The status of physician, either aConsultant or Resident
Text (8)
Text(20)
Text (12)
Patient Dimension
Description: Contains details of patients who visited the hospital
Primary Key: Patient_ID

Attributes Description Data type ( length)
Medical Record Number
Patient_ID
Address
Date of Birth
Gender
Status
A number used to identify eachpatient
A unique alphanumeric valuefor each patient assigned by theresearcher to ensureconfidentiality.
Department which patientbelongs to /or where theyreside
Date of birth of a patient
Gender of patient
Status of patient (Senior, Juniorand staff dependents, or privatePatient)
Text (8)
Text(5)
Memo(35)
Date (12)
Text(2)
Text (15)
Diagnosis Dimension
Description: Describes the diagnosis for a patient
Primary Key: Diagnosis_ID
Attributes Description Data type(length)Diagnosis_ID
Diagnosis Name
A unique number for each diagnosis
The diagnosis that caused the physicianto prescribe the treatment.
Text (8)
Text (50)
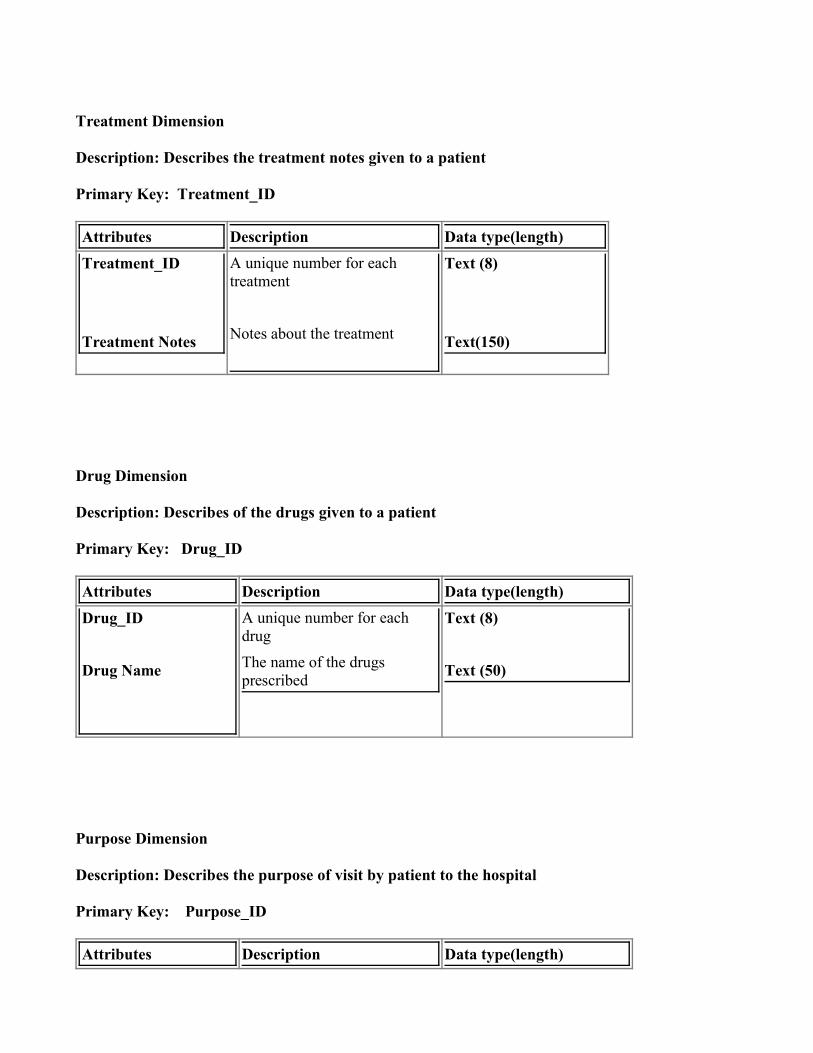
Treatment Dimension
Description: Describes the treatment notes given to a patient
Primary Key: Treatment_ID
Attributes Description Data type(length)Treatment_ID
Treatment Notes
A unique number for eachtreatment
Notes about the treatment
Text (8)
Text(150)
Drug Dimension
Description: Describes of the drugs given to a patient
Primary Key: Drug_ID
Attributes Description Data type(length)Drug_ID
Drug Name
A unique number for eachdrug
The name of the drugsprescribed
Text (8)
Text (50)
Purpose Dimension
Description: Describes the purpose of visit by patient to the hospital
Primary Key: Purpose_ID
Attributes Description Data type(length)

Purpose_ID
Purpose_of_Visit
A unique number for eachpurpose of visit
Purpose of each visit bypatient
Text (8)
Text(15)
Outcome Dimension
Description: Describes the outcome of each visit by a patient
Primary Key: Outcome_ID
Attributes Description Data type(length)Outcome_ID
Outcome Name
Outcome Type
A unique number for each outcome
The outcome of the treatment-admitted, discharged, referred ordied.
Specifies the type of outcome,whether it is the result of a visit oradmission
Text (8)
Text (15)
Text (10)
Time Dimension
Description: Describes the time each visit was made by patient
Primary Key: Time_ID
Attributes Description Data type(length)

Time_ID
DayWeek
Month
Quarter
Year
A unique identifier for the timeof visit
The day patient made the visit
The week patient made the visit
The month patient made thevisit
The quarter patient made thevisit
The year patient made the visit
Number (8)
Number (2)Number (2)
Number (2)
Number (2)
Number (4)
Summary Fact Table
Description: Describes the fact in the data mart
Foreign Key: Physician_ID references DM_Physician (Physician_ID)
Foreign Key: Patient_ID references DM_Patient (Patient_ID)
Foreign Key: Diagnosis_ID references DM_Diagnosis (Diagnosis_ID)
Foreign Key: Treatment_ID references DM_Treatment (Treatment_ID)
Foreign Key: Outcome_ID references DM_Outcome (Outcome_ID)
Foreign Key: Purpose_ID references DM_Purpose (Purpose_ID)
Foreign Key: Time_ID references DM_Time (Time_ID)

Foreign Key: Drug_ID references DM_Drug (Drug_ID)
Attributes Description Data type(length)
Physician_ID
Patient_ID
Diagnosis_ID
Treatment_ID
Outcome_ID
Purpose_ID
Time_ID
Drug_ID
Treatment_Cost
Maintenance_Cost
A unique number for each physician
A unique identifier for each patient
A unique number for each diagnosis
A unique number for each treatmentnotes
A unique number for each outcome
A unique number for the purpose of each visit made by patient
A unique number for the time the patient made the visit
A unique number for each outcome
Cost of treating a patient per visit
Cost of admission incurred by eachpatient
Text (8)
Text (5)
Text (8)
Text (8)
Text (8)
Text (8)
Text (8)
Text (8)
Currency (15)
Currency (15)
5.3 Development Tool

Microsoft Access 2000 was used to develop the new system. Microsoft Access is a database
management system (DBMS) that provides a means of storing and managing data and information. MS
Access can also support the size of the data mart and it is also cheaper when compared to other
software products such as Oracle, Sybase and Microsoft SQL.
5.4 Input Design
Once the data fields have been adequately described, data entry can commence. Two different formats
for data entry are generally available, namely Default format and customized format.
Default data entry screens are adequate if the person inputting data is the same person who generated
the data description. The customized format is used for the patient data mining system application. This
was to achieve the following:
§ Offer a more attractive appearance
§ Assist the data entry persons with hard to remember details
§ Use more descriptive phrase for fields
§ Provide instructions on what to enter for several of the fields
A means of catching inadvertent errors has been devised. Edit checks have been built into the screens
as a way of alerting the data entry person that an error has occurred.
The main switch board shown in Figure 5.3 lists the functions the data mining system has and is the
main guide of the data mart navigation. When the data mining system application is opened, the main
switchboard is shown on the screen. From it, the user can go to the” data entry” form to enter data about
each Patient, Treatment, Diagnosis, Visit, Admission, Outcome and Drug. The data mart can be
searched to get the needed information by selecting “queries” or “reports” which summarise medical
information by patients.

Figure 5-3: The Main switchboard form
The “Main switchboard” form opens first when the patients’ data mining application is launched. It
enables users to locate quickly the forms they will need for data entry or the reports they need to view
or print. It can also be used to control the objects in a database you will allow users to access. Some of
the menus on it include: Patient Data Entry, Extract and Load Data Mart, Queries, Reports and Exit.
Figure 5-4: The Patient Information form
This form is used by the data entry clerk to enter patient data into the data mart. Patients data captured
include Medical record number, Patient Identification Number (Patient_ID), Address, Date of Birth,
Gender, Treatment Identification Number (Treatment_ID), Physician Identification Number
(Physician_ID), Date of Visit, and Status. The Patients table would be updated. It also provides menus
for capturing data on Diagnosis, Treatment, Outcome, Visit, Admission, Purpose of Visit, and Drug for
each patient.

Figure 5-5: The Treatment Notes Form
This form serves as an interface for entering patient’s Treatment notes data into the data mart by Data
Entry clerk. The data goes to update the Treatment table. The treatment data captured include
Treatment Identification number (Treatment_ID), Treatment notes given by the Physician, Physician
Identification Number (Physician_ID), and Date of Visit.

Figure 5-6: The Diagnosis Form
This form serves as a user interface for entering patient’s diagnosis data into the data mart by the Data
Entry clerk. Diagnosis data captured for each patient include Diagnosis Identification number
(Diagnosis_ID), Physician Identification Number (Physician_ID), Date of Visit, Treatment
Identification Number (Treatment_ID), Diagnosis Name and Patient Identification Number
(Patient_ID). The diagnosis table is updated.

Figure 5-7: The Visit Form
The visit form serves as an interface for capturing visit and its related data into the data mart by the
Data Entry clerk. Visit data captured to update the visit table include Date of visit, Patient
Identification Number (Patient_ID), Treatment Cost, Outcome Identification Number (Outcome_ID),
Purpose Identification Number (Purpose_ID), and Physician Identification Number (Physician_ID).

Figure 5-8: The Outcome Form
This form serves as an interface for capturing the outcome data of each patient treatment into the data
mart by the Data Entry clerk. The outcome data captured to update the outcome table include Outcome
Identification Number (Outcome_ID), Physician Identification Number (Physician_ID), Date of Visit,
Treatment Identification Number (Treatment_ID), Patient Identification Number (Patient_ID), Start
Date, Outcome name, and Outcome type. Outcome type captures the type of outcome, i.e. either a
Visit Outcome or Admission Outcome.

Figure 5-9: The Drug Form
This form serves as an interface for capturing drug data into the data mart by Data Entry clerk The drug
data captured to update the Drug table include Drug Identification Number (Drug_ID), Patient
Identification Number (Patient_ID), and Drug Name(s). Physician Identification Number
(Physician_ID), Date of Visit, and Treatment Identification Number (Treatment_ID) are also captured.

Figure 5-10: The Admission form
This form serves as an interface for capturing the admission data of each patient admitted into the data
mart by Data Entry clerk. The data captured to update the Admissions table are Patient Identification
Number (Patient_ID), Date of Admission (Start Date), Date of Outcome of Admission (End Date),
Maintenance Cost, Ward Name and Outcome Identification Number (Outcome_ID). Treatment
Identification Number (Treatment_ID), Physician Identification Number (Physician_ID), and Date of
Visit were also captured.

Figure 5-11: Purpose of Visit
This form captures data to update the purpose of visit table. Some of the data it captures include
Physician Identification Number (Physician_ID), Date of Visit, Purpose Identification Number
(Purpose_ID), Patient Identification Number (Patient_ID) and purpose of visit. The purpose of Visit
can be for review, see a consultant or for treatment.

Figure 5-12: Physician Form
This form captures data to update the physician table of the database. Data captured on each physician
include Physician Identification Number (Physician_ID), Physician Type and Physician Name.
5.5 Preparing the Data Mart for Mining

The transactional data which has just been entered must be loaded into the data mart. The user must
select Extract and Load Data Mart from the main switchboard.
Figure 5-13: Extract and Load Data Mart form
Step 1: Double click on the Extract and Load Data button to load data from the
transactional data base tables into the fact table and dimensions of the data mart.
As shown in Figure 5-14, a message box come up to notify you that you are about to run an append
query that will modify data in your table.

Step 2: Click yes
Figure 5-14: Extract and Load Data Mart Message Box One
The message box below tells you that once you click yes, you cannot use Undo command to reverse the
changes.
Step 3: Click yes.

Figure 5-15: Extract and Load Data Mart Message Box Two
Steps 1 and 2 are repeated for all the dimensions and fact table of your data mart.
You would receive the message above, to confirm that you have successfully loaded the data mart.
Step 4: click Ok.

Figure 5-16: Extract and Load Data Mart Message Box Three
The code for executing the extraction and loading of data mart is shown below:
Private Sub Extract_and_Load_DM_Click ()
DoCmd.OpenQuery "Load_DM_Diagnosis", acViewNormal, acEdit DoCmd.OpenQuery "Load_DM_Outcome", acViewNormal, acEdit
DoCmd.OpenQuery "Load_DM_Patient", acViewNormal, acEdit
DoCmd.OpenQuery "Load_DM_Physician", acViewNormal, acEdit
DoCmd.OpenQuery "Load_Time_Dim", acViewNormal, acEdit
DoCmd.OpenQuery "load_DM_purpose", acViewNormal, acEdit DoCmd.OpenQuery "Load_DM_Treatment", acViewNormal, acEdit

DoCmd.OpenQuery "Load_DM_Drug", acViewNormal, acEdit DoCmd.OpenQuery "Load_DM_Summary", acViewNormal, acEdit
MsgBox "You have successfully loaded the fact table"
End Sub
5.6 Queries
The “Queries” button on the main switchboard leads the user to the queries built into the data mart (Fig.
5-17, page 83). These queries were developed trying to provide information for the report needed by
decision makers in the hospital and the most frequently asked questions from clinical researchers.
Some of the queries of the queries are (The italic part can be replaced):
i. Patients with a diagnosis
For example: “How many patients were diagnosed with malaria”?
ii. Patient with a diagnosis (detailed information that physicians can use to
recruit patients into a clinical trail or to contact with patient if necessary)
For example: “What is the general information of patients with the diagnosis malaria”?
iii. Patient have a diagnosis in a certain period
For example: How many patients were diagnosed with Malaria in December, 2004”?
iv. Patients with a diagnosis in a certain age
For example: “How many patients who were diagnosed with Malaria are older than 30”?
v. How many patients were attended to by a Physician
For example: “How many patients were attended to by Physician D004”?
vi. How many patients were admitted in December, 2004 and their diagnosis
vii. How many Patients were Admitted and what were outcomes of admission

viii. How much did each admitted patient pay?
ix. “What medications were given to each malaria patient by a physician”?
x. “Based upon what treatment notes did each physician diagnose a patient of malaria”?
Figure 5-17: Queries Interface
5.7 Reports
Reports are other important components of the data mart. The “Reports” button on the main
switchboard leads the user to the reports built into the data mart (Figure 5-18, page 84). This data mart
not only contains reports that summarise some of the medical information such as diagnosis, treatments

notes, outcomes but the information such as gender of patients, status of patients, address of patients,
treatment and maintenance costs for those who have been admitted.
Figure 5-18: Reports Interface

A VIEW OF THE PATIENT DATA MINING SYSTEM
Figure 5-19: Patients’ Data Mining System
The operational data A, B and C i.e. Patient data, physicians data, Drug data, etc has been summarized
into a Patient data mart using Microsoft Access 2000, a relational database software. The data mart is
now ready to be mined by the End-users.
5.8 Conclusion
This chapter was devoted to the designing of the data mart and in particular, its input forms and
description of what data are captured by each of the forms. The queries and reports needed by decision
makers as well as researchers were also developed in this chapter. The next chapter presents the results
of the patient data mining as reports.
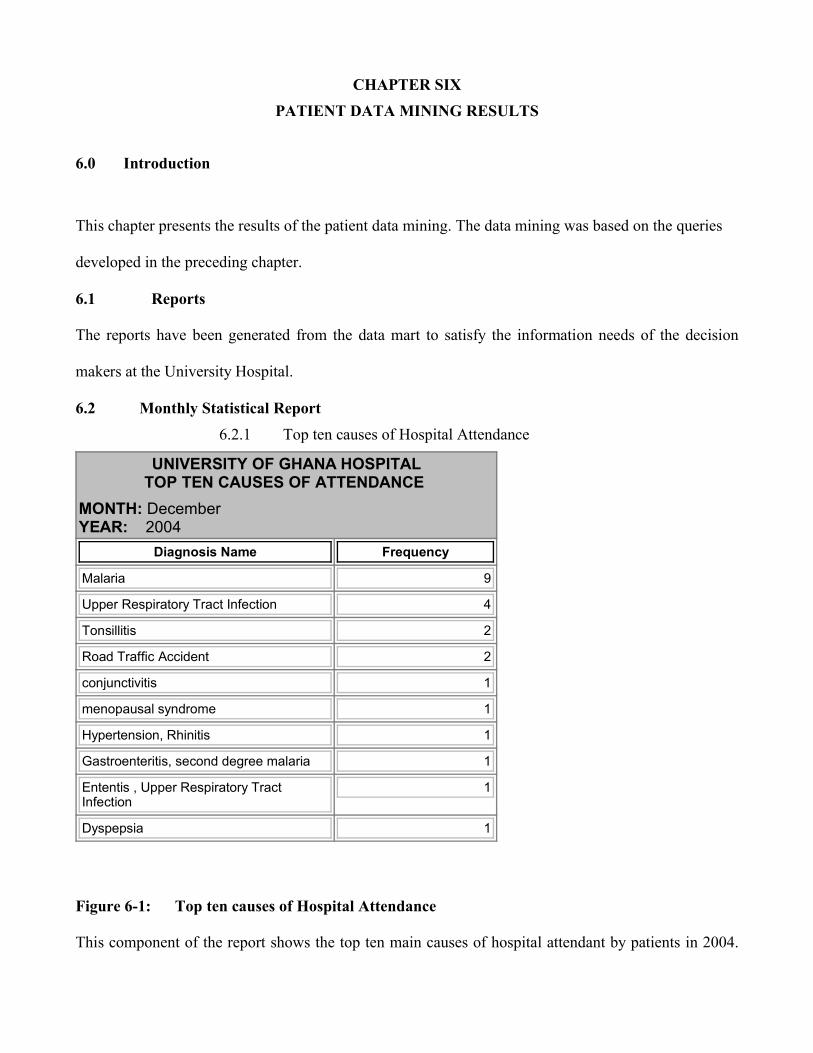
CHAPTER SIXPATIENT DATA MINING RESULTS
6.0 Introduction
This chapter presents the results of the patient data mining. The data mining was based on the queries
developed in the preceding chapter.
6.1 Reports
The reports have been generated from the data mart to satisfy the information needs of the decision
makers at the University Hospital.
6.2 Monthly Statistical Report6.2.1 Top ten causes of Hospital Attendance
UNIVERSITY OF GHANA HOSPITALTOP TEN CAUSES OF ATTENDANCE
MONTH: DecemberYEAR: 2004
Diagnosis Name Frequency
Malaria 9
Upper Respiratory Tract Infection 4
Tonsillitis 2
Road Traffic Accident 2
conjunctivitis 1
menopausal syndrome 1
Hypertension, Rhinitis 1
Gastroenteritis, second degree malaria 1
Ententis , Upper Respiratory TractInfection
1
Dyspepsia 1
Figure 6-1: Top ten causes of Hospital Attendance
This component of the report shows the top ten main causes of hospital attendant by patients in 2004.

Most of the patients, 9 were diagnose of Malaria. Other results are Upper respiratory tract infection (4),
Tonsillitis (2), and Road traffic Accident (2).
One each of the patient were diagnoses of Conjunctivitis, menopausal syndrome, Hypertension &
Rhinitis, Gastroenteritis & Second degree Malaria, Ententis and Upper respiratory tract infection and
Dyspepsia respectively. The syntax of the query used to generate this report is as shown below:
SELECT TOP 10 Top_Ten_Best.[Diagnosis Name],
Main_causes_of_admission.Frequency, DM_TIME.Month,DM_TIME.Year
FROM DM_TIME, Top_Ten_Best INNER JOIN Main_causes_of_admissionON Top_Ten_Best.[Diagnosis Name] = Main_causes_of_admission.[Diagnosis Name];
6.2.2 Total Treatment and Maintenance Incomes
UNIVERSITY OF GHANA HOSPITALTOTAL INCOME
MONTH: DecemberYEAR: 2004
Number ofPatients
Total TreatmentIncome
Total MaintenanceIncome
TotalIncome
48 ¢1,770,930.00 ¢1,504,000.00 ¢3,274,930.00
Figure 6-2: Total Treatment and Maintenance Incomes
The total treatment and maintenance incomes for the month of December, 2004 are shown in the figure
2. A total of 48 patients attended the hospital and an amount of ¢1,770,930.00 and ¢ 1,504,000.00
respectively were realize as treatment and maintenance incomes. The total amount realised was ¢
3,274,930.00. The syntax for the query used to generate this report is shown below:
SELECT Count (DM_Summary.Patient_ID) AS [Number of Patients], Sum (DM_Summary.Treatment_Cost) AS [Total Treatment Income], Sum

(DM_Summary.Maintenance_Cost) AS [Total Maintenance Income], SumDM_Summary.Treatment_Cost+DM_Summary.Maintenance_Cost) AS [Total Income],DM_TIME.Month, DM_TIME.Year
FROM DM_TIME INNER JOIN DM_Summary ON DM_TIME.Time_ID =DM_Summary.Time_ID;
6.2.3 Main Causes of Hospital Attendance

Figure 6-3: Main Causesof Hospital Attendance
This component of the report
shows the top ten main causes
of hospital attendant by
patients in 2004. Most of the
patients, 9 were diagnose of
Malaria. Other results are
Upper respiratory tract
infection (4), Tonsillitis (2),
and Road traffic Accident (2).
One each of the patient was
diagnosis of the disease as
shown. The syntax for the
query used to generate this
UNIVERSITY OF GHANA HOSPITALMAIN CAUSES OF HOSPITAL ATTENDANCE
MONTH: DecemberYEAR: 2004
Diagnosis Name Number of Patients
Malaria 9
Upper Respiratory Tract Infection 4
Allergy Conjuctivitis 2
Tonsilitis 2
Road Traffic Accident 2
conjunctivitis 1
Hypetension, Rhinitis 1
Gastroenterotis, second degree malaria 1
Ententis , Upper Respiratory Tract Infection 1
Dyspepsia 1
menopausal syndrome 1
conjuvititis 1
Old age 1
Candidiasis 1
Assaulted 1
Assault 1
Acute Tonsillitis 1
Cut 1
See eye specialist 1
Urinary Tract Infection, Candidiasis 1
Urinary Tract Infection 1
Upper Respiratory Tract Infecton, No malaria 1
Upper Respiratory Tract Infection 1
Swelling 1
Mild Bronchititis 1
Sore, bacterial Infection and scalp 1
Accident 1
Pregnacy 1
Phanguvitis 1
Pain 1

report is:
SELECT DM_Diagnosis. [Diagnosis Name], Count
(DM_Summary.Diagnosis_ID) AS Number of Patients
FROM DM_Diagnosis INNER JOIN DM_Summary ON
DM_Diagnosis.Diagnosis_ID=DM_Summary.Diagnosis_ID
GROUP BY DM_Diagnosis.[Diagnosis Name]
ORDER BY Count (DM_Summary.Diagnosis_ID) DESC;
6.2.4 Number of Patients Admitted By Status
UNIVERSITY OF GHANA HOSPITALNUMBER OF PATIENTS ADMITTED BY STATUS
MONTH: DecemberYEAR: 2004
Status Number of Patients
Private patient 6
Senior member dependent 2
Junior staff 1
Figure 6-4: Number of Patients Admitted By Status
This figure shows the status of patients who were admitted in December, 2004. Whilst 6 of them were
private patients, 2 were senior member dependents.
Only one of them was a junior staff. The syntax of the query for generating this report is as shown on

the next page:
SELECT DM_Patient.Status, Count (DM_Patient.Status) AS [Number of
Patients],
FROM DM_Patient INNER JOIN (DM_TIME INNER JOIN
DM_Summary ON
DM_TIME.Time_ID=DM_Summary.Time_ID) ON
DM_Patient.Patient_ID=DM_Summary.Patient_ID
WHERE (((DM_Summary.Maintenance_Cost)>0))
GROUP BY DM_Patient.Status;
6.2.5 Outcomes of Patients Attendance
UNIVERSITY OF GHANA HOSPITALOUTCOMES OF PATIENTS ATTENDANCE
MONTH: DecemberYEAR: 2004
Number ofPatients Outcome Name
31 Discharged after visit
9 Admitted
6 Refereed after visit
1 Discharged against medicaladvice
1 Detained for Observation
Figure 6-5: Outcomes of Patients Attendance

This component of the report shows the outcomes of hospital attendance in December, 2004. 31 of the
patients were discharged after visiting the hospital whilst 9 patients were admitted after their visit to the
hospital.
Whereas six patients were refereed after their visit to the hospital, one each of the patients was
discharged against medical advice and Detained for observation respectively. The syntax of the query
used to generate this report is as shown on the next page.
SELECT Count (DM_Patient.Patient_ID) AS [Number of Patients], DM_Outcome.[Outcome
Name], DM_TIME.Month, DM_TIME.Year
FROM DM_TIME INNER JOIN (DM_Patient INNER JOIN (DM_Outcome INNER JOIN
DM_Summary ON DM_Outcome.Outcome_ID = DM_Summary.Outcome_ID) ON
DM_Patient.Patient_ID = DM_Summary.Patient_ID) ON DM_TIME.Time_ID =
DM_Summary.Time_ID
GROUP BY DM_Outcome.[Outcome Name], DM_TIME.Month, DM_TIME.Year;
6.2.6 Gender of Admitted Patients
UNIVERSITY OF GHANA HOSPITALGENDER OF ADMITTED PATIENTS
MONTH: DecemberYEAR: 2004
Gender Number of Patients
Female 6
Male 4

Figure 6-6: Gender of Admitted Patients
This report shows the gender of the patients who were admitted to the hospital in December, 2004.
Whilst 6 of them were females, only 4 were males. The syntax of the query used to generate this report
is as shown below:
SELECT DM_Patient.Gender, Count (DM_Patient.Gender) AS [Number of Patients]
FROM DM_Patient INNER JOIN (DM_TIME INNER JOIN DM_Summary ON
DM_TIME.Time_ID = DM_Summary.Time_ID) ON DM_Patient.Patient_ID =
DM_Summary.Patient_ID
WHERE (((DM_Summary.Maintenance_Cost)>0))
GROUP BY DM_Patient.Gender;
6.2.7 Wards of Admitted Patients
UNIVERSITY OF GHANA HOSPITAL WARDS OF ADMITTED PATIENTS
MONTH: December YEAR: 2004
Ward Name Number of Patients
Children 5
Female Ward B 2
Male Ward A 1
Female Ward A 1
Figure 6-7: Wards of Admitted Patients

This component of the report shows the wards in which patients were admitted into at the hospital.
Majority of the patients, 5 were in the Children’s ward whilst 2 patients were admitted into the Female
ward B. One each of the patients was in the Male ward A and Female Ward A respectively. The
syntax for the query used to generate this report is as shown below:
SELECT Count (DM_Patient.Patient_ID) AS [Number of Patients], DM_Summary. [Ward
Name]
FROM DM_Patient INNER JOIN ((DM_TIME INNER JOIN DM_Summary ON
DM_TIME.Time_ID=DM_Summary.Time_ID))
WHERE (((DM_Summary.Maintenance_Cost)>0))
GROUP BY DM_Summary. [Ward Name];
6.2.8 Status of Admitted Patients
UNIVERSITY OF GHANA HOSPITALSTATUS OF ADMITTED PATIENTS
MONTH: DecemberYEAR: 2004
Status Number of Patients
Private patient 6
Senior staff dependent 2
Senior member dependent 1
Junior staff 1
Figure 6-8: Status of Admitted Patients
This report shows the status of patients who were admitted to the hospital in December, 2004. Whilst 6
of them were Private patients, only 2 were senior staff dependents. One each of the patients was a
senior member dependent and junior staff respectively. The syntax of the query used to generate this
report is as shown below:

SELECT DM_Patient.Status, Count (DM_Patient.Status) AS [Number of Patients]
FROM DM_Patient INNER JOIN (DM_TIME INNER JOIN DM_Summary ONDM_TIME.Time_ID=DM_Summary.Time_ID) ONDM_Patient.Patient_ID=DM_Summary.Patient_ID
WHERE (((DM_Summary.Maintenance_Cost)>0))
GROUP BY DM_Patient.Status;
6.2.9 Patient Diagnosis and Prescription
UNIVERSITY OF GHANA HOSPITALPATIENT DIAGNOSIS AND PRESCRIPTION
MONTH: DecemberYEAR: 2004
Patient Name Drug Name Diagnosis Name
BenjaminBourkum
Urine catteter Dyspepsia
Bernand Don-Bortey
Alaxin, Paracetamol Accident
Cedric Dorlu Malox Pain
Chien Tin Gum Artesunuate course, Paracetamol, WidalSTO, STH, Cipro 500mg
Swelling
Cynthia Nzolezo Dil saline IVF , Chloroquine, Phenegen Cut
Eric Ramaphosa Gvitter, Maxitrol, Gvitter Naphcos A Upper Respiratory TractInfecton, No malaria
Ezekiel Alammu Paracetamol, Amoxyl, cough Mixture,Alaxin
Malaria
Faustina Sonnel liberal oral fluids, steam inhalation,paracetamol syrup
Mild Bronchititis
Felix Hayna Chloroquine, Vit C, paracetamol,Workadine Antiseptic mouth wash
Acute Tonsillitis
Gladys Pains Tetanol injection vaginal candidiasis
Grace D'Or Paracetamol, Diaraprine 10mg Upper Respiratory TractInfection
Harriet Tagoe Clotrimazole, vaginal creame, apply 2times daily
refered to surgical specialist

UNIVERSITY OF GHANA HOSPITALPATIENT DIAGNOSIS AND PRESCRIPTION
MONTH: DecemberYEAR: 2004HarrisonKoomson
Alaxin tablets, Vit B'Co, Diclofenac Gastroenterotis, seconddegree malaria
Isaac Odoom Chloroquine Road Traffic Accident
Jeffery Archer Paracetamol Malaria
Kenneth Haggin Camoquine, Paracetamol, MistMagnessium, Trisilicate
Malaria
Kesiwaa Titus Suspension Amoxyl 7.5l, SyrupParacetamol 7.5l, Antibiotic eye drops
Allergy Conjuctivitis
Kinsley Adiepena Amosikklav 625mg, Decatylen Lozenges,paracetamol, Vit C, Histacet
Malaria
Krofa Okronipa Amoxyl 125mg, Cough Mixture Upper Respiratory TractInfection
Leornard Kuffuor Gvitter 160mg,Alaxin 60mg, Paracetamol Urinary Tract Infection
Mary-Anne Issifu Soluble Aspirin, Celinfine T Upper Respiratory TractInfection
Micheal Farady Beverage eye ointment conjuvititis
Monica Coffie cough mixture, paracetamol See eye specialist
Monica Coffie Ephedine nasal drops(0.5%), Sys. Actified2.5mls tabs, suspension Zitronax 80mg
Candidiasis
Nana Yaw Akyiah Amoxyl, Diclofenac, Mercurochromepaintings, leopard balme
Malaria
Panford Andrews Amosiklav 625mg, wokadine anticepticsyrup,Decatylen lozenges
Tonsilitis
Panie Agnes Paracetamol Stomach ulcer
Parnorld Dogbe Phenegen, gvitter, artesunuate,paracetamol, flagyl,cough mixture
Malaria
Patience Amos Chloramphenicol, ORS, Breastfeedfrequently, Baby cough mixture
Ententis , Upper RespiratoryTract Infection
Paulina Amah Flucloxaccilkine, acyclovine cream,tetanol, Dichlophenac, flagyl
Assaulted
Penni Angela refered to gynaecologist Myomas
Penni Angela Tylenol,Paracetamol, IVF, D/L, Phenegan Urinary Tract Infection,Candidiasis
Pernest Nguiema Diclofenac, Leopard Ointment malaria

UNIVERSITY OF GHANA HOSPITALPATIENT DIAGNOSIS AND PRESCRIPTION
MONTH: DecemberYEAR: 2004PhilominaKpitinge
Gvitter 80mg, Alaxin 60mg andParacetamol
Road Traffic Accident
Phylis Zuma Plasmodium course, Paracetamol, Vit C,Folic Acid
Upper Respiratory TractInfection
Porshia Ansah Penicillium V, wokadine anticeptic gargle,decatylen lozenges
Tonsilitis
Regina BinLadden
paracetamol, Valium, Vit C menopausal syndrome
Richard Asuma Inj. Diclofenac 75mg, Inj. Tetanus 0.5mg,Paracetamol tables
Phanguvitis
Rosemary Sonko Flueconazole tablets Assault
Ruby Bienta Syrup paracetamol 5ml, Ephedine (0.5%),Syrup enythromycin, cough mixture
Upper Respiratory TractInfection
Salifu Mumuni Aspirin tabs, Amoxyl 500mg Hypetension, Rhinitis
Siaw Nsafoa Diclofenac, Vit C, Valium, Crepe Bomdage Malaria
Stella Dugan Chloranphenicol eye drop, Amoxyl 500mg,Paracetamol
conjunctivitis
Victoriayaoborteley
Chloroquine 3cc, phenegen, Amoxyl250mg
Malaria
Figure 6-9: Patient Diagnosis and Prescription
This figure shows the diagnosis and the prescriptions for each patient that visited the hospital inDecember, 2004. The syntax of the query used to generate this report is shown below:
SELECT DISTINCT DM_Patient.Patient_Name, DM_Drug.Drug_Name, DM_Diagnosis.
[Diagnosis Name]
FROM DM_TIME INNER JOIN (DM_Patient INNER JOIN (DM_Drug INNER JOIN
(DM_Diagnosis INNER JOIN DM_Summary ON DM_Diagnosis.Diagnosis_ID =
DM_Summary.Diagnosis_ID) ON DM_Drug.Drug_ID = DM_Summary.Drug_ID) ON
DM_Patient.Patient_ID = DM_Summary.Patient_ID) ON DM_TIME.Time_ID =

DM_Summary.Time_ID
GROUP BY DM_Patient.Patient_Name, DM_Drug.Drug_Name,
DM_Diagnosis.[Diagnosis Name];
6.3 Financial Statistical Report
6.3.1 Total Treatment and Maintenance Incomes
UNIVERSITY OF GHANA HOSPITALTOTAL INCOME FROM TREATMENT AND MAINTENACE
MONTH: December
YEAR: 2004Number of Patients Total Treatment Income Total Maintenance Income Total Income
48 ¢1,770,930.00 ¢1,504,000.00 ¢3,274,930.00
Figure 6-10: Total Treatment and Maintenance Incomes
The total treatment and maintenance incomes for the month of December, 2004 are shown in the figure
6-10. A total of 48 patients attended the hospital and an amount of ¢1,770,930.00 and ¢ 1,504,000.00
respectively were realise as treatment and maintenance incomes. The total amount realised was ¢
3,274,930.00. The syntax for the query used to generate this report is shown below:
SELECT Count (DM_Summary.Patient_ID) AS [Number of Patients], Sum
(DM_Summary.Treatment_Cost) AS [Total Treatment Income], Sum
(DM_Summary.Maintenance_Cost) AS [Total Maintenance Income], Sum
DM_Summary.Treatment_Cost+DM_Summary.Maintenance_Cost) AS [Total Income]
FROM DM_TIME INNER JOIN DM_Summary ON DM_TIME.Time_ID =
DM_Summary.Time_ID;
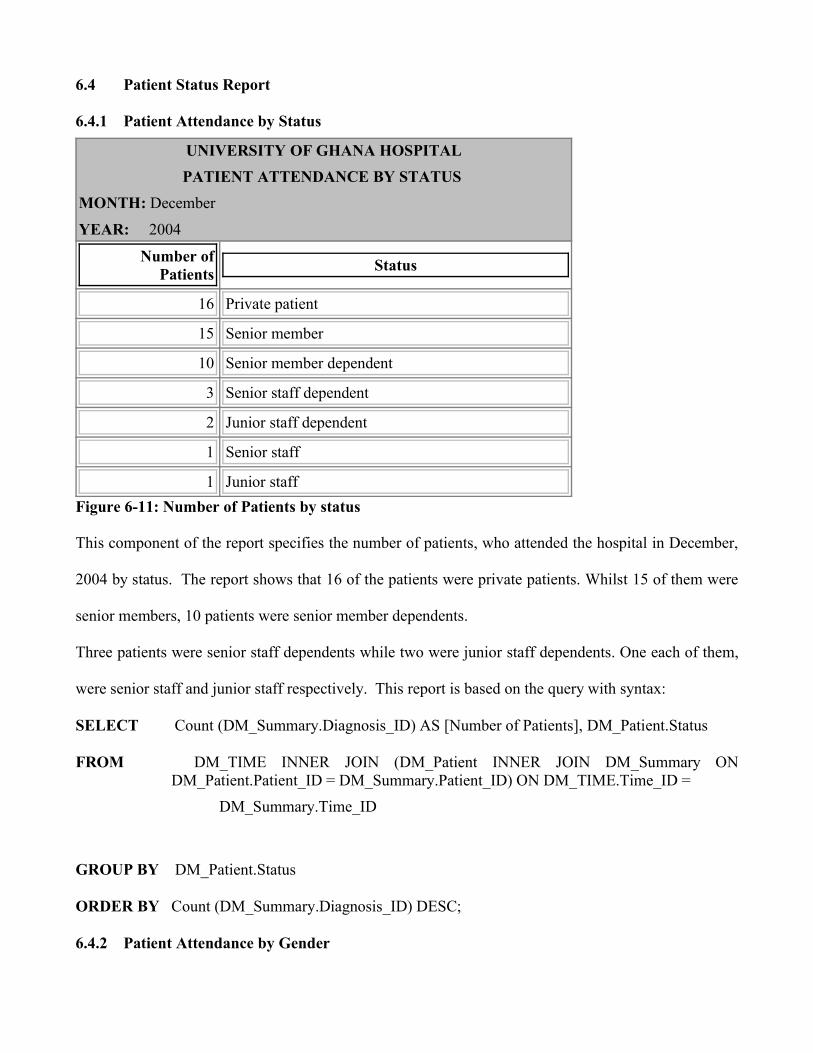
6.4 Patient Status Report
6.4.1 Patient Attendance by Status
UNIVERSITY OF GHANA HOSPITALPATIENT ATTENDANCE BY STATUS
MONTH: December
YEAR: 2004
Number ofPatients Status
16 Private patient
15 Senior member
10 Senior member dependent
3 Senior staff dependent
2 Junior staff dependent
1 Senior staff
1 Junior staffFigure 6-11: Number of Patients by status
This component of the report specifies the number of patients, who attended the hospital in December,
2004 by status. The report shows that 16 of the patients were private patients. Whilst 15 of them were
senior members, 10 patients were senior member dependents.
Three patients were senior staff dependents while two were junior staff dependents. One each of them,
were senior staff and junior staff respectively. This report is based on the query with syntax:
SELECT Count (DM_Summary.Diagnosis_ID) AS [Number of Patients], DM_Patient.Status
FROM DM_TIME INNER JOIN (DM_Patient INNER JOIN DM_Summary ONDM_Patient.Patient_ID = DM_Summary.Patient_ID) ON DM_TIME.Time_ID =
DM_Summary.Time_ID
GROUP BY DM_Patient.Status
ORDER BY Count (DM_Summary.Diagnosis_ID) DESC;
6.4.2 Patient Attendance by Gender

UNIVERSITY OF GHANA HOSPITALPATIENT ATTENDANCE BY GENDER
MONTH: December
YEAR: 2004
Gender Number of Patients
Male 24
Female 24
Figure 6-12: Patient Attendance by Gender
Figure 6-12 depicts the number of patients by gender. Twenty-four each of the patients are males and
females respectively. The syntax of the query used to generate this component of the patient status
report is:
SELECT DM_Patient.Gender, Count (DM_Summary.Diagnosis_ID) AS [Number of Patients]
FROM DM_Patient INNER JOIN (DM_Diagnosis INNER JOIN (DM_TIME INNER JOIN
DM_Summary ON DM_TIME.Time_ID = DM_Summary.Time_ID) ON
DM_Diagnosis.Diagnosis_ID = DM_Summary.Diagnosis_ID) ON
DM_Patient.Patient_ID = DM_Summary.Patient_ID
GROUP BY DM_Patient.Gender
ORDER BY Count (DM_Summary.Diagnosis_ID) DESC;
6.4.3 Number of Patients According To Diagnosis
UNIVERSITY OF GHANA HOSPITAL
NUMBER OF PATIENTS ACCORDING TO DIAGNOSIS
MONTH: December
YEAR: 2004
Number of Patients Diagnosis Name
9 Malaria
4 Upper Respiratory Tract Infection

UNIVERSITY OF GHANA HOSPITAL
NUMBER OF PATIENTS ACCORDING TO DIAGNOSIS
MONTH: December
YEAR: 2004
2 Tonsillitis
2 Road Traffic Accident
1 Candidiasis
1 menopausal syndrome
1 Hypertension, Rhinitis
1 Gastroenteritis, second degree malaria
1 Ententis , Upper Respiratory Tract Infection
1 Dyspepsia
1 Cut
1 Mild Bronchitis’s
1 Conjunctivitis
1 Phanguvitis
1 Assaulted
1 Assault
1 Allergy Conjuctivitis
1 Acute Tonsillitis
1 conjuvititis
1 Sore, bacterial Infection and scalp
1 vaginal candidiasis
1 Urinary Tract Infection, Candidiasis
1 Urinary Tract Infection
1 Upper Respiratory Tract Infecton, No malaria
1 Upper Respiratory Tract Infection
1 Old age
1 Stomach ulcer
1 Myomas

UNIVERSITY OF GHANA HOSPITAL
NUMBER OF PATIENTS ACCORDING TO DIAGNOSIS
MONTH: December
YEAR: 2004
1 See eye specialist
1 refered to surgical specialist
1 Refered
1 Pregnancy
1 Pain
1 Accident
1 SwellingFigure 6-13: Number of Patients According to Diagnosis
Figure 6-13 shows the diagnosis for all the patients that attended the hospital in December 2004. It
shows that majority of the patients, 9 were diagnosed of Malaria. Upper Respiratory Tract Infection was
recorded 4 patients. Two patients each were diagnoses of Tonsillitis and Road Traffic Accident
respectively. The rest of the diagnosis is for a patient each. The syntax of the query used to generate
this report is:
SELECT DISTINCT Count (DM_Patient.Patient_ID) AS [Number of patients],
DM_Diagnosis.[Diagnosis Name]
FROM DM_TIME INNER JOIN (DM_Patient INNER JOIN (DM_Drug
INNER JOIN (DM_Diagnosis INNER JOIN DM_Summary ON
DM_Diagnosis.Diagnosis_ID = DM_Summary.Diagnosis_ID)
ON DM_Drug.Drug_ID = DM_Summary.Drug_ID) ON
DM_Patient.Patient_ID = DM_Summary.Patient_ID) ON
DM_TIME.Time_ID = DM_Summary.Time_ID
GROUP BY DM_Diagnosis.[Diagnosis Name];

6.4.4 Number of Patients According Address
UNIVERSITY OF GHANA HOSPITALNUMBER OF PATIENTS ACCORDING ADDRESS
MONTH: December
YEAR: 2004
Address Number of Patients
Home Science 5
Adenta 4
east legon 2
Isser 2
Music Department 2
Nogouchi 2
Economics 2
Dansoman 1
Kwabenya 1
Crop Science 1
Achimota 1
computer science 1
Botany 1
Frafraha 1
Haatso 1
Bawalashie 1
Islamic University College 1
ARS 1
English 1
Parakuo Estates 1
UGMS 1
Statistics 1
Sociology 1
Social studies 1

UNIVERSITY OF GHANA HOSPITALNUMBER OF PATIENTS ACCORDING ADDRESS
MONTH: December
YEAR: 2004
Shiashie 1
Religion 1
KIA 1
Psychology 1
Kisseman 1
Nutrition and food science 1
Madina Estates 1
Linguistics 1
Language centre 1
La-bawaleshie 1
Univ. Hospital 1
Registrar's Office 1
Figure 6-14: Number of Patients According Address
The number of patients by address is depicted in Figure 19. Most of the patients who visited the
hospital, 5 are from the Home science department or related to a staff at that department.
4 patients are from Adenta whereas 2 each of the patients are from or related to someone from East
Legon, ISSER, Music, Nugouchi and Economics Departments. One each of the patients is from
localities or departments as shown in the report. The syntax of the query used to generate the report is:
SELECT DM_Patient.Address, Count (DM_Summary.Diagnosis_ID) AS [Number of Patients]
FROM DM_Patient INNER JOIN (DM_TIME INNER JOIN DM_Summary ON
DM_TIME.Time_ID=DM_Summary.Time_ID) ON
DM_Patient.Patient_ID=DM_Summary.Patient_ID
GROUP BY DM_Patient.Address

ORDER BY Count (DM_Summary.Diagnosis_ID) DESC;
6.4.5 Patient Attendance by Age
UNIVERSITY OF GHANA HOSPITAL
PATIENT ATTENDANCE BY AGE MONTH: December
YEAR: 2004
Patient Name AGE
Benjamin Bourkum 45
Bernand Don-Bortey 33
Cedric Dorlu 51
Chien Tin Gum 4
Cynthia Nzolezo 35
Eric Ramaphosa 30
Ezekiel Alammu 38
Faustina Sonnel 27
Felix Hayna 31
Gladys Pains 7
Grace D'Or 39
Harriet Tagoe 5
Harrison Koomson 45
Isaac Odoom 37
Jeffery Archer 3
Kenneth Haggin 3
Kesiwaa Titus 33
Kinsley Adiepena 12
Krofa Okronipa 65
Leornard Kuffuor 35
Mary-Anne Issifu 54
Micheal Farady 39

UNIVERSITY OF GHANA HOSPITAL PATIENT ATTENDANCE BY AGE
MONTH: December
YEAR: 2004
Monica Coffie 16
Nana Yaw Akyiah 2
Panford Andrews 5
Panie Agnes 32
Parnorld Dogbe 11
Patience Amos 28
Paulina Amah 15
Penni Angela 35
Pernest Nguiema 45
Philomina Kpitinge 24
Phylis Zuma 24
Porshia Ansah 49
Regina Bin Ladden 55
Reginald Valery King 67
Rexford Asiama 62
Richard Asuma 11
Rosemary Sonko 22
Stella Dugan 3
Victoria yaoborteley 37
Yvette Listowels 27
Figure 6-15: Patient Attendance by Age
Figure 6-15 gives the number of patients by age, who attended the hospital in
December, 2004. Three each of the patients are aged 3, 35 and 45 years respectively whilst two each of
them are aged 5, 11, 22, 24, 27, 33, 37, and 39 years respectively. However each of the remaining
patients is aged between 2 and 67 years. It was generated based on the query with syntax shown below:

SELECT DISTINCT DM_Patient.Patient_Name, DateDiff ('yyyy', DM_Patient![Date
of Birth],Now()) AS AGE, Month, Year
FROM DM_TIME INNER JOIN (DM_Patient INNER JOIN
DM_Summary ON DM_Patient.Patient_ID =
DM_Summary.Patient_ID) ON DM_TIME.Time_ID =
DM_Summary.Time_ID
GROUP BY DM_Patient.Patient_Name;
6.4.6 Patients Diagnosis
UNIVERSITY OF GHANA HOSPITALPATIENTS DIAGNOSIS
MONTH: DECEMBER
YEAR: 2004
PatientName
MedicalRecordNumber
Address Age
Gender Status Diagnosis Name
PatienceAmos
6519 Adenta 28 Male privatepatient
Ententis , UpperRespiratory TractInfection
EzekielAlammu
5588 Statistics 38 Male Seniormember
Malaria
RosemarySonko
6492 La-bawaleshie
22 Female privatepatient
Assault
Victoriayaoborteley
6516 MadinaEstates
37 Female privatepatient
Malaria
PanieAgnes
5557 Nutritionand foodscience
32 Female seniormemberdependent
Stomach ulcer
PanfordAndrews
5327 CropScience
5 Male seniormemberdependent
Tonsilitis

UNIVERSITY OF GHANA HOSPITALPATIENTS DIAGNOSIS
MONTH: DECEMBER
YEAR: 2004
PenniAngela
5561 Homescience
35 Female Seniormember
Myomas
PenniAngela
5561 Homescience
35 Female Seniormember
Pregnacy
BenjaminBourkum
5578 Nogouchi 45 Male Seniormember
Dyspepsia
CynthiaNzolezo
5553 Homescience
35 Female Seniormember
Cut
FelixHayna
6517 Kwabenya 31 Male privatepatient
Acute Tonsillitis
Figure 6-16: Patients Diagnosis
This component of the report shows the diagnosis for all patients that attended the Hospital in
December, 2004. The syntax of the query used to generate this report is shown below:
SELECT DM_Patient.Patient_Name, DM_Patient.MedRecordNo, DM_Patient.Address, DateDiff
("yyyy", DM_Patient! [Date of Birth], Date ()) AS Age, DM_Patient.Gender,
DM_Patient.Status, DM_Diagnosis.[Diagnosis Name]
FROM DM_TIME INNER JOIN (DM_Patient INNER JOIN (DM_Diagnosis INNER JOIN
DM_Summary ON DM_Diagnosis.Diagnosis_ID = DM_Summary.Diagnosis_ID) ON
DM_Patient.Patient_ID = DM_Summary.Patient_ID) ON DM_TIME.Time_ID =
DM_Summary.Time_ID;
6.5 Pharmaceutical Report
6.5.1 Prescriptions by Gender of Patients

UNIVERSITY OF GHANA HOSPITALPRESCRIPTIONS BY GENDER OF PATIENTS
MONTH: December
YEAR: 2004
Gender Drug Name
Female Artesunuate course, Paracetamol, Widal STO, STH, Cipro 500mg
Female Chloranphenicol eye drop, Amoxyl 500mg, Paracetamol
Female Chloroquine 3cc, phenegen, Amoxyl 250mg
Female Clotrimazole, vaginal creame, apply 2 times daily
Female Dichlorophenac, Tetanus, Amoxyl, flagyl
Female Dil saline IVF , Chloroquine, Phenegen
Female Ephedine nasal drops(0.5%), Sys. Actified 2.5mls tabs, suspensionZitronax 80mg
Female Flucloxaccilkine, acyclovine cream, tetanol, Dichlophenac, flagyl
female liberal oral fluids, steam inhalation, paracetamol syrup
Female Tylenol,Paracetamol, IVF, D/L, Phenegan
Male Alaxin tablets, Vit B'Co, Diclofenac
Male Alaxin, Paracetamol
Male Amosikklav 625mg, Decatylen Lozenges, paracetamol, Vit C, Histacet
Male Amosiklav 625mg, wokadine anticeptic syrup,Decatylen lozenges
Male Amoxyl 125mg, Cough Mixture
Male Amoxyl, Diclofenac, Mercurochrome paintings, leopard balme
Male Aspirin tabs, Amoxyl 500mg
Male Beverage eye ointment
Male Camoquine, Paracetamol, Mist Magnessium, Trisilicate
Male Chloramphenicol, ORS, Breastfeed frequently, Baby cough mixture
Figure 6-17: Prescriptions by Gender of Patients
This report shows the gender of patients and the prescriptions they were each given. The syntax of the
query used to generate this report is as shown below:
SELECT DISTINCT DM_Patient.Gender, DM_Drug.Drug_Name

FROM DM_TIME INNER JOIN (DM_Patient INNER JOIN (DM_Drug INNER JOIN
DM_Summary ON DM_Drug.Drug_ID = DM_Summary.Drug_ID) ON
DM_Patient.Patient_ID = DM_Summary.Patient_ID) ON DM_TIME.Time_ID =
DM_Summary.Time_ID
GROUP BY DM_Patient.Gender, DM_Drug.Drug_Name;
6.5.2 Drugs Consumed By Patients
UNIVERSITY OF GHANA HOSPITALDRUGS CONSUMED BY PATIENTS
MONTH: December
YEAR: 2004
Drug Name Number of Patient
Alaxin tablets, Vit B'Co, Diclofenac 1
Alaxin, Paracetamol 1
Amosikklav 625mg, Decatylen Lozenges, paracetamol,Vit C, Histacet
1
Amosiklav 625mg, wokadine anticeptic syrup,Decatylenlozenges
1
Amoxyl 125mg, Cough Mixture 1
Amoxyl, Diclofenac, Mercurochrome paintings, leopardbalme
1
Artesunuate course, Paracetamol, Widal STO, STH,Cipro 500mg
1
Beverage eye ointment 1
Camoquine, Paracetamol, Mist Magnessium, Trisilicate 1
Chloramphenicol, ORS, Breastfeed frequently, Babycough mixture
1

UNIVERSITY OF GHANA HOSPITALDRUGS CONSUMED BY PATIENTS
MONTH: December
YEAR: 2004
Chloranphenicol eye drop, Amoxyl 500mg, Paracetamol 1
Chloroquine 1
Chloroquine 3cc, phenegen, Amoxyl 250mg 1
Chloroquine, Vit C, paracetamol, Workadine Antisepticmouth wash
1
Clotrimazole, vaginal creame, apply 2 times daily 1
cough mixture, paracetamol 1
Dichlorophenac, Tetanus, Amoxyl, flagyl 1
Diclofenac, Leopard Ointment 1
Diclofenac, Vit C, Valium, Crepe Bomdage 1
Diclophenac, Buscopan, Onizoral creame, Puriton 1
Dil saline IVF , Chloroquine, Phenegen 1
Ephedine nasal drops(0.5%), Sys. Actified 2.5mls tabs,suspension Zitronax 80mg
1
Figure 6-18: Drugs Consumed By Patients
This component of the report shows the number of patients by the prescription they were given. The
drugs were prescribed to one patient each. The syntax of the query used to generate this report is shown
below:
SELECT DM_Drug.Drug_Name, Count (DM_Summary.Patient_ID) AS Number of Patients
FROM DM_TIME INNER JOIN (DM_Drug INNER JOIN (DM_Diagnosis INNER JOIN
DM_Summary ON DM_Diagnosis.Diagnosis_ID = DM_Summary.Diagnosis_ID) ON
DM_Drug.Drug_ID = DM_Summary.Drug_ID) ON DM_TIME.Time_ID =
DM_Summary.Time_ID
GROUP BY DM_Drug.Drug_Name;

6.5.3 Prescribed Drugs and Age of Patients
UNIVERSITY OF GHANA HOSPITALPRESCRIBED DRUGS AND AGE OF PATIENTS
MONTH: December
YEAR: 2004
Patient Name Drug Name AGE
Benjamin Bourkum Urine catteter 45
Bernand Don-Bortey Alaxin, Paracetamol 33
Cedric Dorlu Malox 51
Chien Tin Gum Artesunuate course, Paracetamol, Widal STO, STH,Cipro 500mg
4
Cynthia Nzolezo Dil saline IVF , Chloroquine, Phenegen 35
Eric Ramaphosa Gvitter, Maxitrol, Gvitter Naphcos A 30
Ezekiel Alammu Paracetamol, Amoxyl, cough Mixture, Alaxin 38
Faustina Sonnel liberal oral fluids, steam inhalation, paracetamol syrup 27
Felix Hayna Chloroquine, Vit C, paracetamol, Workadine Antisepticmouth wash
31
Harriet Tagoe Clotrimazole, vaginal creame, apply 2 times daily 5
Harrison Koomson Alaxin tablets, Vit B'Co, Diclofenac 45
Kenneth Haggin Camoquine, Paracetamol, Mist Magnessium, Trisilicate 3
Kesiwaa Titus Suspension Amoxyl 7.5l, Syrup Paracetamol 7.5l,Antibiotic eye drops
33
Kinsley Adiepena Amosikklav 625mg, Decatylen Lozenges, paracetamol,Vit C, Histacet
12
Krofa Okronipa Amoxyl 125mg, Cough Mixture 65
Leornard Kuffuor Gvitter 160mg,Alaxin 60mg, Paracetamol 35
Mary-Anne Issifu Soluble Aspirin, Celinfine T 54
Micheal Farady Beverage eye ointment 39
Monica Coffie cough mixture, paracetamol 16
Figure 6-19: Prescribed Drugs and Age of Patients

The specific drugs that were given to each patient and their ages are displayed by this component of the
report and the syntax of the query used to generate this report is shown below:
SELECT DISTINCT DM_Patient.Patient_Name, DM_Drug.Drug_Name, DateDiff
('yyyy',DM_Patient![Date of Birth],Now()) AS AGE
FROM DM_TIME INNER JOIN (DM_Patient INNER JOIN (DM_Drug INNER
JOIN DM_Summary ON DM_Drug.Drug_ID = DM_Summary.Drug_ID)
ON DM_Patient.Patient_ID = DM_Summary.Patient_ID) ON
DM_TIME.Time_ID = DM_Summary.Time_ID;
6.5.4 Diagnosis and Drugs Prescribed Per Patients
UNIVERSITY OF GHANA HOSPITALDIAGNOSIS AND DRUGS PRESCRIBED PER PATIENTS
MONTH: December
YEAR: 2004
Patient_Name Diagnosis Name Drug Name
PatienceAmos
Ententis , Upper RespiratoryTract Infection
Chloramphenicol, ORS, Breastfeed frequently,Baby cough mixture
EzekielAlammu
Malaria Paracetamol, Amoxyl, cough Mixture, Alaxin
FaustinaSonnel
Mild Bronchititis liberal oral fluids, steam inhalation, paracetamolsyrup
RosemarySonko
Assault Flueconazole tablets
Victoriayaoborteley
Malaria Chloroquine 3cc, phenegen, Amoxyl 250mg
Panie Agnes Stomach ulcer Paracetamol
PanfordAndrews
Tonsilitis Amosiklav 625mg, wokadine antisepticssyrup,Decatylen lozenges
Penni Angela Myomas refered to gynaecologist
Chien TinGum
Swelling Artesunuate course, Paracetamol, Widal STO, STH,Cipro 500mg

UNIVERSITY OF GHANA HOSPITALDIAGNOSIS AND DRUGS PRESCRIBED PER PATIENTS
MONTH: December
YEAR: 2004
CynthiaNzolezo
Cut Dil saline IVF , Chloroquine, Phenegen
Felix Hayna Acute Tonsillitis Chloroquine, Vit C, paracetamol, WorkadineAntiseptic mouth wash
HarrisonKoomson
Gastroenterotis, second degreemalaria
Alaxin tablets, Vit B'Co, Diclofenac
KrofaOkronipa
Upper Respiratory TractInfection
Amoxyl 125mg, Cough Mixture
Ruby Bienta Upper Respiratory TractInfection
Syrup paracetamol 5ml, Ephedine (0.5%), Syrupenythromycin, cough mixture
Siaw Nsafoa Malaria Diclofenac, Vit C, Valium, Crepe Bomdage
Figure 6-20: Diagnosis and Drugs Prescribed Per Patients
The diagnosis for each patient as well as the prescriptions given to them is displayed by this component
of the report. The syntax of the query used to generate this report is as shown below:
SELECT DM_Patient.Patient_Name, DM_Diagnosis.[Diagnosis Name],
DM_Drug.Drug_Name
FROM DM_TIME INNER JOIN (DM_Patient INNER JOIN (DM_Drug INNER JOIN
(DM_Diagnosis INNER JOIN DM_Summary ON DM_Diagnosis.Diagnosis_ID
= DM_Summary.Diagnosis_ID) ON DM_Drug.Drug_ID =
DM_Summary.Drug_ID) ON DM_Patient.Patient_ID =
DM_Summary.Patient_ID) ON DM_TIME.Time_ID = DM_Summary.Time_ID;
6.5.5 Top Ten Causes of Hospital Attendance

UNIVERSITY OF GHANA HOSPITALTOP TEN CAUSES OF HOSPITAL ATTENDANCE
MONTH: December
YEAR: 2004
Diagnosis Name Number of Patients
Malaria 9
Upper Respiratory Tract Infection 4
Tonsilitis 2
Road Traffic Accident 2
Conjunctivitis 1
Menopausal syndrome 1
Hypetension, Rhinitis 1
Gastroenterotis, second degree malaria 1
Ententis , Upper Respiratory Tract Infection 1
Dyspepsia 1
Figure 6-21: Top Ten Causes of Hospital Attendance
This component of the report shows the top ten main causes of hospital attendant by patients in 2004.
Most of the patients, 9 were diagnose of Malaria. Other results are Upper respiratory tract infection (4),
Tonsillitis (2), and Road traffic Accident (2). One each of the patient were diagnoses of Conjunctivitis,
menopausal syndrome, Hypertension & Rhinitis, Gastroenteritis & Second degree Malaria, Ententis and
Upper respiratory tract infection and Dyspepsia respectively. The syntax of the query used to generate
this report is as shown below:
SELECT TOP 10 Top_Ten_Best.[Diagnosis Name],
Main_causes_of_admission.Frequency
FROM DM_TIME, Top_Ten_Best INNER JOIN Main_causes_of_admission ON
Top_Ten_Best.[Diagnosis Name] = Main_causes_of_admission.[Diagnosis Name];

6.5.6 Status of Patients and Drugs Prescribed
UNIVERSITY OF GHANA HOSPITALSTATUS OF PATIENTS AND DRUGS PRESCRIBED
MONTH: December
YEAR: 2004
Status Drug Name
Junior staff Diclofenac, Vit C, Valium, Crepe Bondages
Junior staff dependent Ephedine nasal drops (0.5%), Sys. Acetified 2.5mls tabs,suspension Zitronax 80mg
Private patient Amoxyl, Diclofenac, Mercurochrome paintings, leopardbalme
Private patient Artesunuate course, Paracetamol, Widal STO, STH, Cipro500mg
Private patient Camoquine, Paracetamol, Mist Magnessium, Trisilicate
Private patient Chloramphenicol, ORS, Breastfeed frequently, Baby coughmixture
Private patient Chloroquine 3cc, phenegen, Amoxyl 250mg
Private patient Chloroquine, Vit C, paracetamol, Workadine Antisepticmouth wash
Private patient Gvitter 80mg, Alaxin 60mg and Paracetamol
Private patient Inj. Diclofenac 75mg, Inj. Tetanus 0.5mg, Paracetamoltables
Senior member Penicillium V, wokadine anticeptic gargle, decatylenlozenges
Senior member Tylenol,Paracetamol, IVF, D/L, Phenegan
Senior member Urine catteter
senior member dependent Amosiklav 625mg, wokadine antiseptics syrup,Decatylenlozenges
senior member dependent Chloranphenicol eye drop, Amoxyl 500mg, Paracetamol
senior member dependent Clotrimazole, vaginal cream, apply 2 times daily
senior member dependent Flucloxaccilkine, acyclovine cream, tetanol, Dichlophenac,flagyl

UNIVERSITY OF GHANA HOSPITALSTATUS OF PATIENTS AND DRUGS PRESCRIBED
MONTH: December
YEAR: 2004
senior staff Gvitter, Maxitrol, Gvitter Naphcos A
senior staff dependent Amosikklav 625mg, Decatylen Lozenges, paracetamol, VitC, Histacet
Figure 6-22: Status of Patients and Drugs Prescribed
Figure 6-22 shows the status of patients and the drugs that were prescribed for each of them in
December, 2004. The query used to generate this report is as shown below:
SELECT DISTINCT DM_Patient.Status, DM_Drug.Drug_Name
FROM DM_TIME INNER JOIN (DM_Patient INNER JOIN (DM_Drug INNER
JOIN DM_Summary ON DM_Drug.Drug_ID = DM_Summary.Drug_ID)
ON DM_Patient.Patient_ID = DM_Summary.Patient_ID) ON
DM_TIME.Time_ID = DM_Summary.Time_ID
GROUP BY DM_Patient.Status, DM_Drug.Drug_Name;
6.6 Conclusion
A new system has thus been developed in line with the three stage Data Mart Development Life Cycle
adopted and shall be released for use by the Records Unit to generate reports that summarise the
medical information of patients for decision-making.

CHAPTER SEVEN
RECOMMENDATIONS AND CONCLUSIONS
7.0 Recommendations
For hospitals and other institutions to benefit from data mining, the following recommendations are
required to establish and administer a Data Mart:
A dedicated personal computer with at least Pentium IV, Microsoft Windows 98, 128 MB
RAM, 40 HDD, and 8-bit graphics adapter and display should be made available solely for use
as a server for the Data Mart.
Date of Birth rather than the age of patients should be collected
A Patient Identification Number should be used in addition to the Medical Record number
currently being used at the Hospital. This will enable clinical research work to be carried out

easily and also ensure the confidentiality of each patient. Currently, staff and their dependents
are given the same number.
Archiving and backing-up of data in the data mart must be routinely carried out to ensure that
the Data Mart can be rebuilt following data loss or software /hardware failures. Pen Drives and
CDRW are recommended for this purpose
The staff of the Biostatistics Unit should be encouraged to collect returns and feed them into the
data mart. The incoming data should be scrutinized carefully.
A member of staff should be trained to handle the data entry and updating services. This should
ensure that the data mart is updated continuously.
Staff of the Medical Records Department and Decision Makers who will operate and manage
the new system should be trained to do so. User manuals will be provided. Senior management
will also be trained in less structured manner using video demonstrations to give them an
overview of the system.
Appropriate File, Hardware and Systems conversion methods, timely updating as well as
upgrading the system to keep pace with new product, services, customers, government
regulations and other requirements should be adopted.
With the passage of the Health Insurance Bill into Law, the Ghana Health Service will be
required to organize its internal systems to provide services as prescribed by law. This will
require extensive restructuring of both outpatient and inpatient services and in particular the
billing system to be operated. Improvements should be made to the system so that data mining
can be used to detect fraud in the Health Insurance scheme.
To operate the system, these procedures must be followed:
i. Key data into the various tables and save
ii. Double click on the “Load and Extract data mart” on the switch board
iii. Run the appropriate queries by clicking on the query buttons on the

switch board
iv. Print the appropriate reports by clicking on the report buttons on the
switch board
v. Close and exit the data mart system
7.1 Conclusion
The University of Ghana Hospital, like any other hospital in Ghana, has been collecting the medical
data of patients but the data is not processed electronically. The volume of patient medical data at the
various hospitals has been increasing over the years. However, the data is not properly managed. As a
result of this, majority of out-patients do not have full medical record. With this situation, the
physician’s time is wasted since they have to collect this information again and in addition, it becomes
very difficult for them to keep track of the patients. This reduces the ability to carry out high quality
clinical research in the hospitals, and compromises the continuity of healthcare as well as the quality of
healthcare delivery in the hospital.
A Data Mart can be designed to collect, store, organize and retrieve the medical information of patients.
In this dissertation, a Data Mart was designed and built using Microsoft Access 2000 DBMS for the
Medical Records Unit of the University of Ghana Hospital. The Data Mart was mined using MS Access
to provide timely, accurate and reliable reports to meet the information needs of clinical research,
improving health care continuity and research at the University Hospital.
Although the Data Mart was developed particularly for the Medical Records Department of the
University of Ghana hospital, it can be adapted for use in the Medical Records Unit of other hospitals.
Data mining tools such as the association rules, sequential rules and neural networks can be used to

mine the patient data mart to identify previously undiscovered patterns and trends important to the
hospital.
The Data Mart can be built upon and deployed in Hospitals currently operating under the National
Health Insurance Scheme for easy detection of false claims and disease management.
REFERENCES
1. Abbott, P. A., Goodwin, L., Cullen, P. and Delaney, C. (1999). ‘The ABC’s of Data Mining: A
primer for Health care Professionals” AMIA 1999 annual Seminar. Workshop/Session W11.
http://medicine.ucsd.edu/f99/index.html 18th June 2004.

2. Bamgboye, E.A and Familusi (1990). “Morbidity trends at the children’s emergency room, University
College Hospital, Ibadan, Nigeria”. Afr. J. Med. Sci. Vol 19. Pp 49-56
3. Bamgboye, E.A and Familusi (1990). “Mortality pattern at the children’s emergency ward, University
College Hospital, Ibadan, Nigeria”. Afr. J. Med. Sci. Vol 19. Pp 127-132
4. Baylis, Philip. (1999) “Better health care with data mining, Clementine-Working with health care”:
An SPSS white Paper. Pp. 2-9
5. Berdt, D.J., Hevner, A.R. and Studnicki , J (2000). “Hospital Discharge Transacations: A data
warehouse component”. Proceedings of the 33 rd Hawaii conference on system sciences. IEEE. Pp 1-10
6. Berry, M. and Linoff, G. (2000). Data mining Techniques. John Wesley and Sons, Inc. USA: In
Bicen, Pelin and Oktay Firat, S.U. (2003). “Knowledge Discovery in databases (KDD) and Data Mining:
An application of customer segmentation analysis in banking sector”. Bulletin of the International
Statistical Institute, 54th Session, Volume LX, Invited Papers, August 2003, Berlin, , Germany. Pp.136
7. Bicen, Pelin and Oktay Firat, S.U. (2003). “Knowledge Discovery in databases (KDD) and Data
Mining: An application of customer segmentation analysis in banking sector”. Bulletin of the International
Statistical Institute, 54th Session, Volume LX, Invited Papers, August 2003, Berlin, Germany. Pp.136
8. Biritwum, R. B, Gulaid, J and Amaning, A. O.(2000) “Pattern of diseases or conditions leading to
hospitalization at Korle Bu Teaching Hospital, Ghana in 1996”. Ghana Medical Journal , Vol. 34, Number
4, Dec 2000, pp 197 -205
9. Bramson, Robert T. (2000). “Data mining for medical management: Data mining represents an
opportunity to shape the way in which medicine will be practiced in the 21st century”. An article excerpted
from mining the data, presented at Radiology in the 21st Century: the Digital Department on February 25,
2000, in Maui, Hawaii retrieved from www.imaginingeconomics.com on June 5th, 2004.
10. Bresnahan, J (1997).” Lives may not hang in the balance of your company’s data mining efforts. But
the experiences of those in the business of curing patients could help you come up with a prescription for a
healthier business”. CIO magazine. July 15, 1997 Issue.
11. Christensen, W. F., and Di Cook (1998). “Data mining soil characteristics affecting corn yield”.

citeseer.nj.nec.com/christensen98data.html: In Abdullah et al (2003): “Learning Dynamics of Pesticide
abuse through data mining”. A paper which appeared at the Australasian Workshop on Data Mining and
Web Intelligence (AWDM&WI, 2003) Dunedin, New Zealand. Conference in Research and Practice in
Information Technology Journal. Vol 32. http://crpit.com/confpapers/CRPITV32Abdullah.pdf on 14th
October 2004
12. Computer Science Innovations, Inc. (2001): “Data mining in Health Care”. September, 2001. A
Company report. http:// www.csi-inc.com
13. Connolly, T. and Begg, C. (2005) Database systems. 3rd Ed. Addison-Wesley. Pp. 1239-1240
14. Carbone, P(2000): Data mart Logo Courtesy www.mitre.org/news/the_edge/august_00/carbone.html
(August 2000, Volume 4 No. 2) retrieved on 26th June 2004
15. Degruy, B. Kristin. “Health care applications of Knowledge Discovery in Databases”. Published in the
Online Journal of Healthcare Information Management (JHIM) http://www.himss.org November 13, 2004
16. Dilly, R (1995). Data mining: An Introduction. Lecture notes for students of the Queens University,
Belfast, UK. http://www.pcc.qub.ac.uk/tec/courses/datamining/stu_notes/dm_book_1.html 28th June
2004. Pp.1 and 4
17. Edelstein, Herbert (1996). “Technology How To: Mining Data Warehouses.” Information Week
(January 8, 1996): In Laudon, Kenneth C and Laudon, Jane Price(2000): Management Information systems:
Organisation and Technology in Networked Enterprise, 6th ed. Prentice-Hall, Upper Saddle River, New
Jersey, pp 469-470
18. Edelstein, Herbert (1999). Introduction to Data Mining and Knowledge Discovery, 3rd Ed. A
Publication of Two Crows Corporation, Pp 5-34 retrieved from http://www.twocrows.com on 23rd August
2003
19. Epstein, S and Denius, H (2001): “Health Care’s Rocky Road: Data Mining for Better Quality of
Care Is a Path Worn Well into the Future. Published in ADVANCE for Health Information Executive.
20. Frand Jason (2004). W hat is data mining?
http://www.anderson.ucla.edu/faculty/jason.frand/teacher/technologies/palace/index.html 10th June 2004

21. Frawley, W.J., Piatetsky-Shapiro, G., Smyth, P, and Matheus, C.J.(1995). Knowledge Discovery in
Databases: An Overview: In Zaïane, R. O. (1999). CMPUT690 Principles of Knowledge Discovery in
Databases lecture Notes. Department of Computing Science, University of Alberta.
22. Grossman, R., Kasif, S., Moore, R., Rocke, D., and Ullman, J. (1998). Data Mining Research:
Opportunities and Challenges. A report of three National Science Foundation Workshops on Mining Large,
Massive, and Distributed Data retrieved from http://www.nsf.gov/ on June 28th, 2004
23. Gϋrsakal, Necmi and Acar, F. (1999). “Statistics, Data Analysis and Data mining”. IV National
Econometry and Statistics Symposium. Antalya, Turkey. Pg 2: In Bicen, Pelin and Oktay Firat, S.U. (2003).
“Knowledge Discovery in databases (KDD) and Data Mining: An application of customer segmentation
analysis in banking sector”. Bulletin of the International Statistical Institute, 54th Session, Volume LX,
Invited Papers, August 2003, Berlin, , Germany. Pp.136
24. Hagland, Mark (2004). “Stronger Computer tools allow deeper analysis of medical research, patient
care and insurance data in Health care Informatics”, April 2004. www.healthcare-
informatics.com/datamining.htm June 28th, 2004.
25. http://www.angoss.com
26. Http://www.billinmon.com
27. Http://www.datawarehousing.com
28. Http://www.dwinfocenter.org
29. Http://www.dw-institute.com
30. Http://www.ralphkimball.com
31. Inmon, W. H., Welch, J. D., Glassey, L. Katherine (1997). Managing the Data Warehouse: Practical
Techniques for monitoring Operations and Performances, Administering Data and tools and managing
Change and Growth. John Wiley & sons, Inc. USA. Pp 65-74.
32. Jones, Greg (2002). “Building Effective Data Marts: A practical, step-by-step guide to developing and
deploying the data mart that meets your business needs. An Article Published at www.oramag.com by
Fortune City. Http://www.fortunecity.com/skyscrapper/oracle/699/orahtml/oramag/38data2.htm 30th

October, 2004.
33. Kantor, J (2001): “A Case Study for ROI: With Intel® Processor-Based Data Mining “, In Company
newsletter of Clalit Health Services, Israel's second largest health service provider (HSP).
34. Krippendorf, M and Song, I (2002): The Translation of Star Schema into Entity-Relationship
diagrams”. College of Information Science and Technology Journal, Drexel University.
35. Laudon, Kenneth C and Laudon, Jane Price (2000). Management Information systems: Organisation
and Technology in Networked Enterprise, 6th ed. Prentice-Hall, Upper Saddle River, New Jersey.
36. Lin, W., Orgun, M.A, and Graham, J.W (2001): Mining Temporal Patterns from Health Care Data
retrieved www.csiro.org.au
37. Karuna, P. J (1997): Analysis of Data Mining Algorithms
38. Makulowich, John (1999). Government Data Mining Systems Defy Definition . Washington
Technology Online, Vol. 13 No. 22
http://www.washingtontechnology.com/news/13_22/tech_features/393-2.html on 15th October 2004
39. Mallach, G Efrem (2000). Decision Support Systems and Data Warehouse Systems. Irwin McGraw-
Hill. Pp 3-23, 197-228, and 465-552.
40. Marakas, M. George (1999). Decision Support Systems in the twenty-first century: DSS and data
mining technologies for tomorrow’s manager. Prentice-Hall, Inc. Upper saddle River, New Jersey 07458.
pp 1-11 and 321-382.
41. Marcel Holshemier & Arno Siebes (1994): In Jones, A.E (2001). Lecture Notes of CM35645-5 lecture
for Level 3 students of the Faculty of Computing, Engineering and Technology, Staffordshire University, UK.
Pg 4
42. Murphy, S. N., Morgan, M.M., Barnett, G.O and Chueh, H.C (2000): “Optimising Healthcare
Research Data Warehouse Design through Past COSTAR Query Analysis”. Laboratory of Computer
Science Report, Massachusetts General Hospital, Boston, MA.
43. Perner, P (2000):”Mining Knowledge in Medical Image Databases: In Data Mining and Knowledge
Discovery: Theory, Tools, and Technology, Belur V. Dasarathy (eds.), Proceedings of SPIE, Vol. 4057

(2000). Pp 359-369.
44. PriceWaterHouseCoopers (2000): “ Enhancing the Revenue Generation Capacity and Improving the
Efficiency and Cost Effectiveness of the University of Ghana including all institutes and schools- Final
Business Plan: University Hospital.” A Report submitted to the University of Ghana. November 2000. Pp 5-
9.
45. Raghu, R. and Gehrke, J. (2000): Database Management Systems. 2nd Edition, The McGraw Hill
Companies, Inc., USA. Pp 707-732
46. Schonlau, M., Bigelow, J.H. and Meili, R. C. (2003). “Exploratory analysis of patient level databases:
Building patient profiles for the MEPS data.” Bulletin of the International Statistical Institute, 54th Session,
Volume LX, Invited Papers, August 2003, Berlin, , Germany. Pp.294-296
47. Sokol, L., Garcia, B., West, M., Rodriguez, J and Kirk, J. (2001). “Precursory Steps to Mining HCFA
Health care claims”. Proceedings of the 34 th Annual Hawaii International Conference on System Science,
HICSS –34 Vol 6, January 03-06, 2001, Maui, Hawaii. Electronic Edition of IEEE Journal of Information
Systems.
48. Theus, Martin (2003). “A day in the life of a Data Miner”. Bulletin of the International Statistical
Institute, 54th Session, Volume LX, Invited Papers, August 2003, Berlin, , Germany. Pp.298-301
49. Verma, R. and Harper, J. (2003):“Lifecycle of a Data warehousing Project in Healthcare”. Published
in the Online Journal of Healthcare Information Management (JHIM) and http://www.himss.org and
Retrieved on November 13, 2004
50. Vice-Chancellor’s Annual Report, University of Ghana, 2000
51. Hersh, W (2003). What is Health/Medical/biomedical Informatics? A paper presented to the America
Medical Informatics Association. www.billhersh.info. Retrieved on 15/05/2005
52. Xinping, T. (2003). Building a database for Peking Union Medical College Hospital outpatients with
rheumatic diseases. A master’s thesis presented to the department of Medical Informatics and Outcome
Research and the Oregon Health & Sciences University School of Medicine. May 2003. unpublished
53. Zaïane, R. O. (1999). CMPUT690 Principles of Knowledge Discovery in Databases lecture Notes.

Department of Computing Science, University of Alberta.