developing a media plan
TRANSCRIPT
8/8/2019 Developing a Media Plan
http://slidepdf.com/reader/full/developing-a-media-plan 1/14
1. Developing a Media Plan
Sets forth the exact media vehicles to be used and dates and times of ads.Effectiveness of plan determines how many people in the advertiser's target will be exposed to the message. Need to select the media to be used and dates and
times ads appear.
Primary goal--reach the highest # of people (within the advertiser's target) per $spent. Achieve the appropriate message reach and frequency for the targetaudience while staying within the budget.
Various Media
o TV Channels/programs, Baseball = male 18-49 Academy awards = female
18-49o Sponsor cable channels, Reebok with Cable Health Club "Reebok
University"o Radio, Becoming more segmented, also allowed to own 2 FM stations in
one area.o Magazines, Lead time considerations, also pass along rate, subscription
plus news agent sales.o Newspapers, Local vs. national
o Direct Mail, Evolution of Database marketing, able to narrowly target with
DM.o Outdoor, Billboards Atlanta is most billboard per capita city, Transit...City
Buses, Blimps...At Eventso Placed-Based, Schools, also sponsor educational programs, Supermarkets,
Health Clubs, Dining Halls. Intrusive..."Only go where you are wanted!!".Target market is known...not assumed.
o Electronic, WWW, Compuserve et al.
Need to select general media, IE Newspapers, then subclass, IE PhiladelphiaInquirer.
Look at location and demographics of advertisers target, use media that appeals tothis group.Content of message to present affects the choice of media.Cost of media, use cost comparison indicator-within specific media (IE between
two magazines), CPM "cost per thousand" for magazines.-cost , total cost; per reader/viewer cost-reach, #viewers/readers in the audience, print media includes circulation and pass on, more for magazines than newspapers-waste, portion of marketer's audience that are not in the target market- frequency, how often can the medium be used/changed, i.e., TV radio hourly,newspapers daily, Yellow pages yearly.-message performance, number of exposures each advertisement generates and
8/8/2019 Developing a Media Plan
http://slidepdf.com/reader/full/developing-a-media-plan 2/14
how long it remains available to the audience; outdoor ads, manyexposures/message, magazines retained for a long period of time.-clutter, # of advertisements contained in a single program/issue of a medium. TVads moving to 15 secs. each is increasing clutter. Some moving to 2 minutes...or even 5, especially if there is a complex message...telecommunications...cars
maybe!!Primetime:
o CBS 13mins 52 secs of non programming time
o ABC 13mins 24 secs
o Daytime 8-19 mins
A media plan is put together with care and concern to accomplish certain objectives. The degree to which
the plan succeeds depends upon whether these objectives are the correct ones, and, if so, whether the media
plan successfully implements them. Use the following checklist to make certain that your media plan
carries out the goals you have set for it.
1. WHOM do we want to reach? Are we certain this is the correct target? Have we missed anyone who
might be a significant product or service user, purchaser, or influencer?
Suggest Improvement:
2. WHEN do we want to reach them? Are we certain we are reaching
them when they will not only be interested in our product or service
but also be most interested in receiving our message? Have we
considered not only what time of the year, but also what times of the
week and what times of the day we should reach them?
Suggest Improvement:
3. WHERE do we want to reach them? Are we focusing on those
geographic areas where our dollars can work most productively? Has
the plan considered all of the regional and local marketing factors that
influence the purchase and usage of our product or service? Have we
considered how our market focus will impact upon key factors in the
trade? Have we considered the value of reaching our target at home vs.
at work vs. elsewhere?
Suggest Improvement:
4. HOW MANY do we need to reach? Are we reaching enough prospects
with our message during a specific promotional period or within a
specific time frame that relates to our product or service’s purchase or
usage cycle?
8/8/2019 Developing a Media Plan
http://slidepdf.com/reader/full/developing-a-media-plan 3/14
Suggest Improvement:
5. HOW FREQUENTLY do we need to reach them? Are we reaching
them often enough to make our point, yet not so often that we waste
money that could more profitably be directed elsewhere?
Suggest Improvement:
6. WHAT MEDIA provide the best environments and conditions under
which to reach our prospects? Have we selected media that will
enhance the delivery of our message? Will it help us stand out from the
crowd and theclutter?
Suggest Improvement:
7. AT WHAT COST do we reach our prospects? Are we spending too
much to accomplish our objectives? Or are we spending so little that weare in essence “invisible”? Are we spending enough not only in total but
also in each individual media vehicle so as to establish an effective
presence? Have we considered not only the present activity of our
competition, but also their anticipated future activity?
Suggest Improvement:
8. IS ANYTHING MISSING... OR SHOULD ANYTHING BE DONE DIFFERENTLY?
• Have we looked at our media plan from all angles? • Have we challenged it? Have we compared it with other reasonable alternatives?
Suggested Improvement:
The Media Value Checklist
Every medium has certain distinct characteristics that contribute to (or detract from) theeffective and efficient communication of advertising to the consumer. Noted in The Media
Checklist is whether each of these characteristics tends to be a positive or a negative force.In the adjacent boxes, check those points that are of significance to you. The results of your media appraisal will helpp you determine whether or not a given medium should be
included in your media mix. With the increasing focus on new, nontraditional media, usethis same evaluation technique in determining their value in your marketingcommunications programs.
TELEVISION
8/8/2019 Developing a Media Plan
http://slidepdf.com/reader/full/developing-a-media-plan 4/14
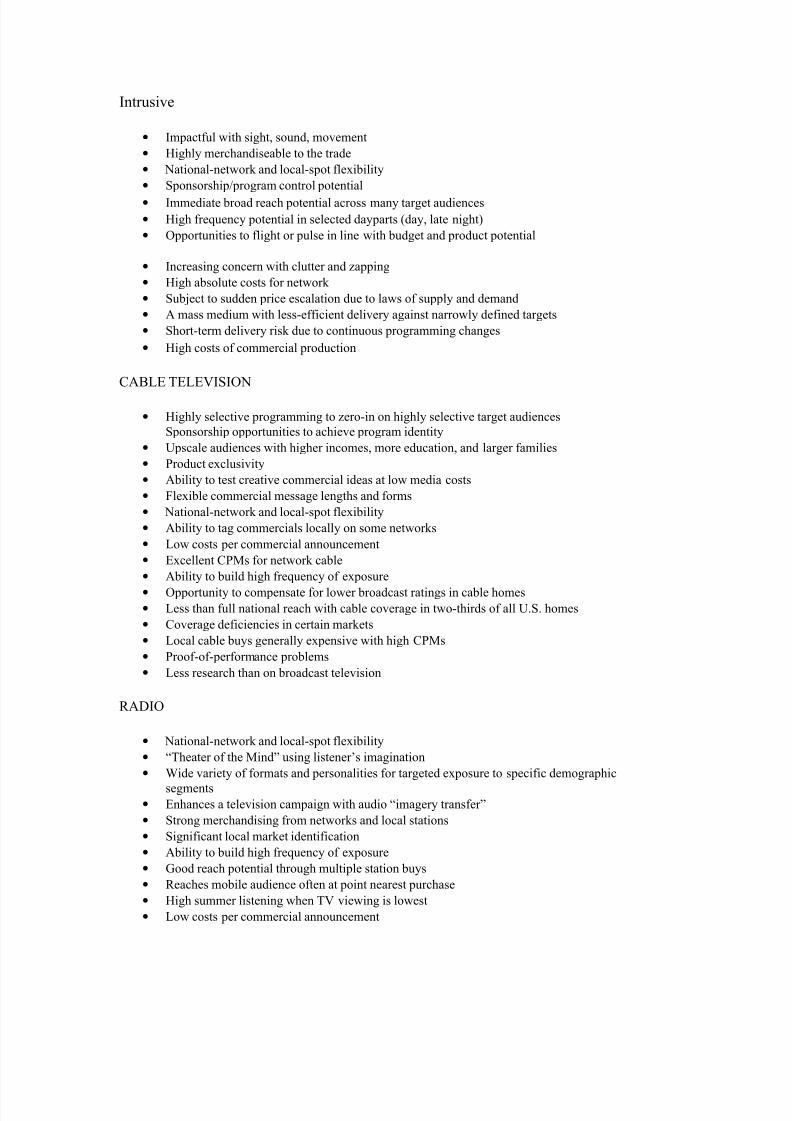
Intrusive
• Impactful with sight, sound, movement
• Highly merchandiseable to the trade
• National-network and local-spot flexibility
• Sponsorship/program control potential
• Immediate broad reach potential across many target audiences • High frequency potential in selected dayparts (day, late night)
• Opportunities to flight or pulse in line with budget and product potential
• Increasing concern with clutter and zapping
• High absolute costs for network
• Subject to sudden price escalation due to laws of supply and demand
• A mass medium with less-efficient delivery against narrowly defined targets
• Short-term delivery risk due to continuous programming changes
• High costs of commercial production
CABLE TELEVISION
• Highly selective programming to zero-in on highly selective target audiencesSponsorship opportunities to achieve program identity
• Upscale audiences with higher incomes, more education, and larger families
• Product exclusivity
• Ability to test creative commercial ideas at low media costs
• Flexible commercial message lengths and forms
• National-network and local-spot flexibility
• Ability to tag commercials locally on some networks
• Low costs per commercial announcement
• Excellent CPMs for network cable
• Ability to build high frequency of exposure
• Opportunity to compensate for lower broadcast ratings in cable homes• Less than full national reach with cable coverage in two-thirds of all U.S. homes
• Coverage deficiencies in certain markets
• Local cable buys generally expensive with high CPMs
• Proof-of-performance problems
• Less research than on broadcast television
RADIO
• National-network and local-spot flexibility
• “Theater of the Mind” using listener’s imagination
• Wide variety of formats and personalities for targeted exposure to specific demographic
segments• Enhances a television campaign with audio “imagery transfer”
• Strong merchandising from networks and local stations
• Significant local market identification
• Ability to build high frequency of exposure
• Good reach potential through multiple station buys
• Reaches mobile audience often at point nearest purchase
• High summer listening when TV viewing is lowest
• Low costs per commercial announcement
8/8/2019 Developing a Media Plan
http://slidepdf.com/reader/full/developing-a-media-plan 5/14
• Excellent CPMs
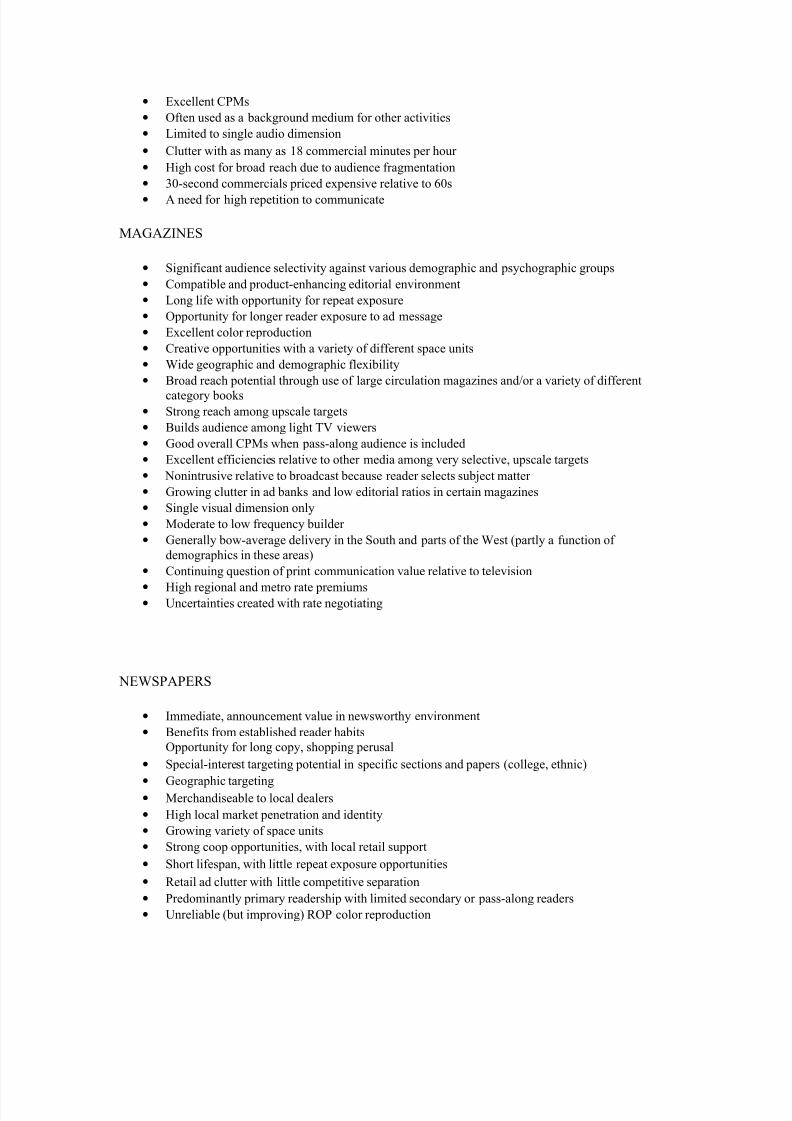
• Often used as a background medium for other activities
• Limited to single audio dimension
• Clutter with as many as 18 commercial minutes per hour • High cost for broad reach due to audience fragmentation
• 30-second commercials priced expensive relative to 60s
• A need for high repetition to communicate
MAGAZINES
• Significant audience selectivity against various demographic and psychographic groups
• Compatible and product-enhancing editorial environment
• Long life with opportunity for repeat exposure
• Opportunity for longer reader exposure to ad message
• Excellent color reproduction
• Creative opportunities with a variety of different space units
• Wide geographic and demographic flexibility
• Broad reach potential through use of large circulation magazines and/or a variety of different
category books• Strong reach among upscale targets
• Builds audience among light TV viewers
• Good overall CPMs when pass-along audience is included
• Excellent efficiencies relative to other media among very selective, upscale targets
• Nonintrusive relative to broadcast because reader selects subject matter
• Growing clutter in ad banks and low editorial ratios in certain magazines
• Single visual dimension only
• Moderate to low frequency builder
• Generally bow-average delivery in the South and parts of the West (partly a function of demographics in these areas)
• Continuing question of print communication value relative to television
•High regional and metro rate premiums
• Uncertainties created with rate negotiating
NEWSPAPERS
• Immediate, announcement value in newsworthy environment
• Benefits from established reader habitsOpportunity for long copy, shopping perusal
• Special-interest targeting potential in specific sections and papers (college, ethnic) •
Geographic targeting• Merchandiseable to local dealers • High local market penetration and identity
• Growing variety of space units
• Strong coop opportunities, with local retail support
• Short lifespan, with little repeat exposure opportunities • Retail ad clutter with little competitive separation • Predominantly primary readership with limited secondary or pass-along readers
• Unreliable (but improving) ROP color reproduction

8/8/2019 Developing a Media Plan
http://slidepdf.com/reader/full/developing-a-media-plan 6/14
• Declining readership among younger adults and in suburban areas • High cost of running multimarket campaign
• High CPMs except for small space units • Difficult to attain true national coverage due to concentration in major urban areas
• Mass penetration allows little audience selectivity • Limited negotiability
• Premiums for special positions
• Significant premiums for national vs. local advertisers
SUNDAY SUPPLEMENTS
• High local market coverage due to newspaper carrier penetration
• In-home, readership
• Good color reproduction
• Highly merchandiseable
• Broad reach potential
• Local market impact with a magazine format
• Little secondary or pass-along audience
• Not a considered purchase, like magazines
• Limited audience selectivity due to means of distribution
• High out-of-pocket cost and CPM for national coverage
OUT-OF-HOME
• Excellent reminder medium supporting other vehicles
• 24-hour exposure
• Opportunity for strong package and product identification
• Graphic flexibility
• Strong local market presence
• Broad reach and high frequency potential
• Impact of large space units
• Opportunity to rotate locations to maximize audience delivery
• Positioning opportunities near the point of purchase
• Excellent CPMs
• Limited to short, simple message
• Demographic selectivity difficult, although not impossible
• Increasingly restricted availabilities due to zoning laws
• High out-of-pocket costs for multimarket coverage
DIRECT MAIL
•
High degree of demographic, geographic, and “buying behavior” selectivity depending uponmailing list used
• Wide variety of sizes, shapes, and forms
• Intrusive
• Numerous response options
• Flexible
• Excellent reproduction
• High reach potential against selected targets
• Ability to build frequency through multiple mailings
8/8/2019 Developing a Media Plan
http://slidepdf.com/reader/full/developing-a-media-plan 7/14
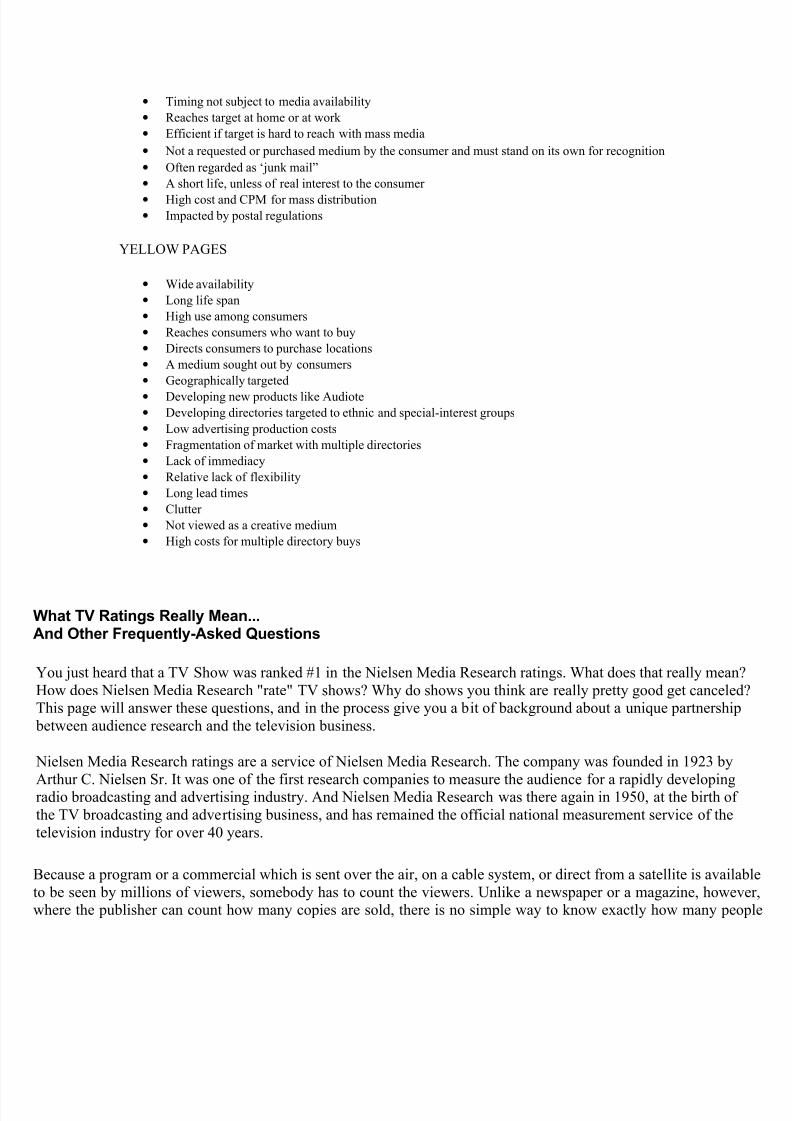
• Timing not subject to media availability
• Reaches target at home or at work
• Efficient if target is hard to reach with mass media
• Not a requested or purchased medium by the consumer and must stand on its own for recognition • Often regarded as ‘junk mail”
• A short life, unless of real interest to the consumer
• High cost and CPM for mass distribution• Impacted by postal regulations
YELLOW PAGES
• Wide availability
• Long life span
• High use among consumers
• Reaches consumers who want to buy
• Directs consumers to purchase locations
• A medium sought out by consumers
• Geographically targeted
• Developing new products like Audiote• Developing directories targeted to ethnic and special-interest groups
• Low advertising production costs
• Fragmentation of market with multiple directories
• Lack of immediacy
• Relative lack of flexibility
• Long lead times
• Clutter
• Not viewed as a creative medium
• High costs for multiple directory buys
What TV Ratings Really Mean... And Other Frequently-Asked Questions
You just heard that a TV Show was ranked #1 in the Nielsen Media Research ratings. What does that really mean?How does Nielsen Media Research "rate" TV shows? Why do shows you think are really pretty good get canceledThis page will answer these questions, and in the process give you a bit of background about a unique partnershipbetween audience research and the television business.
Nielsen Media Research ratings are a service of Nielsen Media Research. The company was founded in 1923 by
Arthur C. Nielsen Sr. It was one of the first research companies to measure the audience for a rapidly developingradio broadcasting and advertising industry. And Nielsen Media Research was there again in 1950, at the birth of the TV broadcasting and advertising business, and has remained the official national measurement service of thetelevision industry for over 40 years.
Because a program or a commercial which is sent over the air, on a cable system, or direct from a satellite is availabto be seen by millions of viewers, somebody has to count the viewers. Unlike a newspaper or a magazine, howevwhere the publisher can count how many copies are sold, there is no simple way to know exactly how many peo
8/8/2019 Developing a Media Plan
http://slidepdf.com/reader/full/developing-a-media-plan 8/14
are watching any given program. Nielsen Media Research estimates the audience by drawing a sample and thcounting the number of viewers in the sample.
Nielsen Media Research ratings provide an estimate of the audience for just about every program that can be seen TV. We do this through several research methods about which we will have a lot more to say later on this page.
But what Nielsen Media Research means by a "TV rating" is not the same as the common usage of the word"rating". Nielsen Media Research does not provide qualitative evaluations of how much a program is "liked"when we rate programs. The TV rating is only the simplest and most democratic measure of the audience: howmany people watched. Programs which have larger audiences are, by definition, the successful ones. Ratingsnumbers which you may have seen are the average audience rating, or the percent tuned to a particular programduring the average minute.
Some people have described the Nielsen Media Research ratings as being similar to voting. The role of Nielsen
Media Research in estimating the viewers is somewhat like the role of the board of elections in counting the votes.But the role of the viewers in Nielsen Media Research's panels is quite different from voters. They are not supposeto vote for or against programs by viewing them or not viewing them; our panel members represent the viewing of the actual audience simply by watching what they normally watch.
So when the Nielsen Media Research ratings report that a show is "top ranked" for the week, we are saying that thiis the show which was watched by more people than anything else on any channel at any time during the week. It iliterally the most popular show because its audience has more of the population in it.
There are two questions which Nielsen Media Research ratings answer about TV viewing: "Who is watching TV?"and "What are they watching?" These are not easy questions to answer, and we use research methods which have
been developed and refined over many years to provide answers every single day.
How does Nielsen Media Research know who is watching?
The way that Nielsen Media Research finds out about who is watching is to measure what a sample of televisiviewers are watching. For our national ratings estimates, we use a sample of more than 5,000 households, containover 13,000 people who have agreed to participate. Since there are over 99 million households with TVs in the U.it might seem that a sample of 5,000 is just not big enough to represent the nation.
Actually, a representative sample doesn't have to be very large to represent the population it is drawn from. Forexample, you don't need to eat an entire pot of vegetable soup to know what kind of soup it is. A cup of soup is
more than adequate to represent what is in the pot. If, however, you don't stir the soup to make sure that all of thevarious ingredients have a good chance of ending up in the cup, you might just pour a cup of vegetable brothStirring the soup is a way to make sure that the sample you draw represents all the different parts of what is in thepot.
While a sample doesn't have to be very large to represent the population, the sample does need to be selected in away which gives all members of the population the same chance of being chosen.
8/8/2019 Developing a Media Plan
http://slidepdf.com/reader/full/developing-a-media-plan 9/14
If 50% of the vegetable pieces in a huge pot are carrot cubes, the only way to know it for sure would be to examand count the contents of the entire pot. Let's say we stir well and pour a cup of soup with 10 vegetable pieces in tcup. If sampling were a perfect process, we would get five carrot cubes out of ten pieces. What actually happenthat we usually get close to five carrot cubes-sometimes a little more and sometimes a little less and sometimexactly five. It is possible, but really unlikely, to stir well and get no carrot pieces-or to get all carrot pieces. So wcould get a rough estimate of the proportion of carrots in the pot from counting what is in the cup.
If we wanted a closer estimate, we would take a larger sample. Imagine if we stirred well and then poured out enousoup to contain 5,000 vegetable pieces. We probably wouldn't get exactly 2,500 carrot pieces, but the chancegetting no carrots at all is very remote. In fact, according to sampling theory and a very tasty laboratory test, 19 out20 times we take a well-stirred sample of soup containing 5,000 vegetable pieces, we get between 48% and 52carrots. There is no guarantee that the percentage of carrots in a sample of this size will be between 48% and 52(one time in 20 it will be outside this range, but usually not far outside this range). The same sampling errors applya representative sample of television viewers.
Does Nielsen Media Research measure homes, TVs, programs, commercials or people?
In order to provide all the information which the TV and advertising industries need, Nielsen Media Researactually measures all of the above. We report the amount of TV usage on every set in a sample household - those ahomes which have agreed to participate in the Nielsen TV sampling for a specific period of time.
Just like a recipe in which several ingredients have to be combined, Nielsen Media Research constructs TV ratinfrom several different sources of information.
Measuring TV sets
In a specially selected sample of homes, Nielsen Media Research technicians install metering equipment on TVsets, VCRs and cable boxes (and even satellite dishes). The Nielsen Media Research meters automatically andinvisibly keep track of when the sets are on and what the sets are tuned to. These meters are connected to acentral "black box," which is actually a very small computer and modem. Information from the meters iscollected by the black box, and in the middle of the night all the black boxes call in their information to our central computers.
Identifying TV programs
For us to know what is on the channel at the time it is tuned, we have to collect a large amount of information eve
day about what is on every TV station and cable channel all across the country. A program may be scheduled bynetwork, but some stations that usually carry that network may not carry that program, or may delay the program ashow it at a different time.
Nielsen Media Research's primary source of information about which programs are airing for each station or cachannel comes from a very special coded ID number that is part of almost every TV picture-a series of lines and din the top edge of the picture which labels the program and episode. Nielsen Media Research developed and patentthis systems, which we call AMOL, or Automated Measurement Of Line-ups. All across the country, we have si
8/8/2019 Developing a Media Plan
http://slidepdf.com/reader/full/developing-a-media-plan 10/14
where TV stations are monitored and the program ID codes are detected and collected. Each night, these monitorisites connect up to our central computer and download the information. We compile the electronic progrinformation and compare it to other sources of information we have already received. If there are discrepancies, wcall TV stations and cable operators to verify what actually was aired. Keeping track of what is on TV is also dowith the help of program listings provided by networks, stations and cable systems, as well as published TV listing
We track more than 1,700 TV stations and 11,000 cable systems. With this database as a starting point, we can cretuning and viewing to all of the networks, syndicators, cable networks, TV stations and cable systems involvedproviding TV programming to the viewing public.
Identifying commercials
Although there are many TV programs, there are even more commercials. Keeping track of what commercials are TV is another service provided by Nielsen Media Research. Using a special passive TV signal identificattechnology, commercials on TV stations are continuously monitored and converted into a digital "fingerprint". Thfingerprints are then compared to a computer file of fingerprints from thousands of different commercials aautomatically identified whenever possible (which is about 95% of the time). The other 5% of the time, videotapesunmatched commercials are sent to a central office to be viewed and properly credited. This information is usedproduce reports detailing when and where TV commercials actually aired.
Measuring People
This is the main ingredient in the recipe for ratings: who is watching? When we combine the measurement of whowatching with what channel is tuned and what program is on that channel, we can credit viewing to a program.
Nielsen Media Research measures who is watching programs which reach the entire nation with the NielsenPeople Meter. In our national sample, we install set meters which have an attachment called a "People Meter". ThPeople Meter is a box, about the size of a paperback book, which is placed on or near each TV set.
The box has buttons and lights which are assigned to each person who lives in the household (with additional buttofor guests). There is also a remote control to operate the people meter from anywhere in the room.
When a viewer begins watching TV, they push their button, changing their indicator light from red to green. Whthey finish watching, they push their button again and the indicator changes back to red. Periodically, the lights flto remind people to check to make sure that the information in the people meter is accurate.
Information from the people meters is combined with set tuning information and relayed to Nielsen Media Reseaeach night.
National and local measurement
So far, we have been describing how Nielsen Media Research measures audiences to programs which reach the entnation. But the television system in the United States also requires a local measurement of how programs performspecific markets. In fact, Nielsen Media Research measures more than 200 individual local television markets
8/8/2019 Developing a Media Plan
http://slidepdf.com/reader/full/developing-a-media-plan 11/14
addition to the national measurement service. There are many important differences in the way Nielsen MeResearch measures local television.
Diaries: Another way to know who is watching
To measure the audiences for local television, Nielsen Media Research gathers viewing information using TV diaribooklets in which samples of viewers record their television viewing during a measurement week. We conduct diameasurement for each of the 210 television markets in the country four times each year, during February, May, Juand November: (You may have heard of these as "sweep" months, in which we conduct a complete dimeasurement across the nation.)
The diary requests that viewers write down not only who watched, but what program and what channel they watch
We have tried to make the task of filling out a diary as easy as possible by asking people to report what they doquarter hours (instead of minute-by-minute). Once the diaries are filled out, viewers mail them back to us and
transfer the information into our computers in order to calculate ratings.
In 48 of the largest markets, we have a sample of homes with set meters (not people meters) which provide thetuning status (set on/off, channel and time) of TV sets in the home. We collect information about who is viewingfrom separate samples of homes in these markets with diaries for each TV set. We combine the meter and diaryinformation in a way which projects the diary viewing data adjusted to the meter tuning data.
How does Nielsen Media Research know if its viewing information is accurate?
No measurement system is perfect, whether it measures the entire population or just a sample. Errors are alway
possibility. When measurement is based on a sample, there is the additional source of error which comes frsampling variation (some samples are going to be a bit high, others a bit low).
For this reason, Nielsen Media Research regularly cross-checks the information obtained from different samples adifferent measurement methods. Remarkably, the ratings produced from more than 100,000 diaries collected frommarkets during each sweep month have been similar to the ratings based on 5,000 People Meter homes for the samperiod of time. Different measurement methods, completely separate samples-and a vast difference in sampling siyet they both produce similar estimates of audience.
In addition to this, we have ongoing audits and quality checks to make sure that all of our procedures are workicorrectly.
Who are the Nielsen Media Research families?
The Nielsen Media Research families are a cross-section of the households with television sets all across AmericaBecause we have selected them in a way which gives every household an equal chance of being picked, we haveall kinds of households in the sample. This means that we have homes from all fifty states, from cities and towns,suburbs and rural areas. We have people who own their homes and people who live in apartments. Some homes inthe panel have children and some don't.
8/8/2019 Developing a Media Plan
http://slidepdf.com/reader/full/developing-a-media-plan 12/14
Various ethnic and income groups are represented. When we check the characteristics of households in our sampagainst the U.S. Census data, we find that our samples look very much like the population. Of course, the matchnot perfect. When you draw a representative sample, it is usually close to the population on a given characteristic.
Between 11 and 12 percent of the Nielsen Media Research samples are African American, for example, and tmatches the percentage of all TV households in the United States which are classified as African American.
Let's look at the individual samples in terms of African American representation. National People Meter SampleThere are 5,000 households in this sample. The number fluctuates daily as about 300 households come in and outthe sample every month. Of this number, nearly 550 households are African American, or about 11 percent of total.
How do I become a member of the Nielsen Media Research sample?
Strictly through chance. Naturally we'd like to accommodate people who offer to be in our sample, but doing would violate basic laws of sampling practice. The sample would immediately become biased because those wasked to join may be systematically different from the population at large.
Instead, we carefully draw our sample in a way that offers every U.S. television household an equal chance of beselected. Once the homes are selected and agree to participate, Nielsen Media Research protects their privacykeeping their identities confidential.
How do you make sure that a sample is representative of the population?
If every member of the population has an equally good chance of being in the sample, then this makes i
representative sample. Through statistical theory (and many years of practical experience which is consistent wthat theory), we know that fairly drawn (or random) samples vary in usually small ways from the population. Otime these small differences tend to average out.
We check our samples in various ways. Where we do know something about the characteristics of the entpopulation (thanks to U.S. Census Bureau data), we compare our sample to the population. We find that although samples aren't identical to the population, they are about as close to it as statistical theory predicts. The mimportant thing to check in our samples is the television viewing information. Although no one has measured viewing of the entire population, we do have ways to cross check against other samples and other methodsmeasurement. We regularly compare our National People Meter audience data to the combined information from diaries all across the 210 markets we measure.
Occasionally, we do special studies called Telephone Coincidentals. In these tests, we call thousands of randomly selected telephone numbers and ask people if their TV sets are on and who is watching. This research provides a completely independent check on the amount of TV usage and viewing, and when we have foundsome differences, it has helped us zero in on ways to improve our ongoing measurement systems.
How can Nielsen Media Research tell if people are really watching TV?
8/8/2019 Developing a Media Plan
http://slidepdf.com/reader/full/developing-a-media-plan 13/14
This is really one of the most difficult questions we face. Some of the information we measure is possible to checkindependent means. Programs are carried by stations and we can observe that when it happens. TV sets are tunedparticular stations and not to others, and we can measure that when it happens.
The only person who knows when viewing occurs is the viewer. Viewing is not necessarily looking at a TV; it is nnecessarily being in the room with a TV; it is something that only the viewer can define. This is why we use the diand the people meter; so that viewers can tell us what they do.
We conduct special research among former members of our TV meter and diary ratings samples to learn more abohow they actually watch television and how accurately they have reported their viewing. With the help of the viewpublic, we are constantly learning more about the partnership between TV and its audience.
How are the Nielsen Media Research ratings used?
Nielsen Media Research's role is to measure both what is transmitted and what is received. By doing this, we prov
the programmers and advertisers with vital feedback on their audience.
Nielsen Media Research ratings are used like currency in the marketplace of advertiser-supported TV. Whenadvertisers want a commercial to reach an audience, they need to place it in TV programs which deliver anaudience. The more audience a program delivers, the more the commercial time is worth to advertisers. So theamount charged for advertising is usually a negotiated rate per thousand viewers multiplied by the Nielsen MediaResearch audience estimate (in thousands).
Programs are expensive to produce, whether they attract large audiences or not. In the long run, TV programmcan't pay more for a program than they can earn from selling advertising in it.
Does Nielsen Media Research cancel low rated programs?
No. Occasionally some viewers find that a program they watch gets canceled. By estimating the audience, information helps programmers keep the popular shows on TV, and it also helps them make the difficult decisionscancel unpopular shows.
The irony of the mass medium of television is that a program with "only" a few million viewers may be an unpopuprogram. It may take ten million viewers for a network or nationally syndicated program to be popular enough to bbusiness success. Every time a program is canceled, a few million viewers feel betrayed. But if programmers triedkeep all programs going, the shows that lose money would eventually put the programmers out of business.
Nielsen Media Research ratings are also used by non-commercial television. They can learn about the audience thserve and make better programming decisions.
In Closing... We have just touched the surface of a very complicated measurement system which Nielsen MeResearch operates every day to provide information about who is watching TV and what they are watching. Usinsample of homes with diaries, set meters, or People Meters and combining this information with extensive databaof what programs are on each TV station and cable channel, Nielsen Media Research produces TV ratings- t

8/8/2019 Developing a Media Plan
http://slidepdf.com/reader/full/developing-a-media-plan 14/14
independent estimates of audiences which help the television industry operate their business and serve the Americpublic.