developed by the north carolina department of public instruction dr. sherry broome, regional lead...
TRANSCRIPT
Developed byThe North Carolina Department
of Public Instruction
Dr. Sherry Broome, Regional Lead
Self-Evaluation Training for Better School Improvement
Day 2Day 2
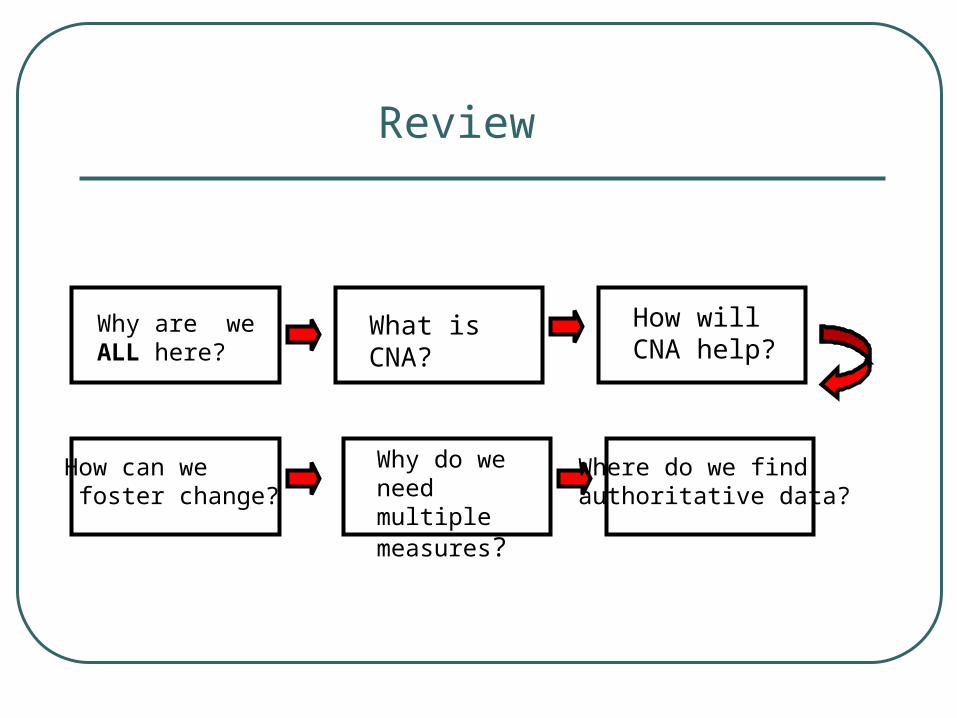
Review
Why are we ALL here?
What is CNA?
How will CNA help?
How can we foster change?
Why do we need multiple measures?
Where do we find authoritative data?
Authoritative Data

Activity: Additional Key Data Sources
Using the template provided, revise your Bernhardt Circles by adding/deleting data.
List each under the appropriate category.
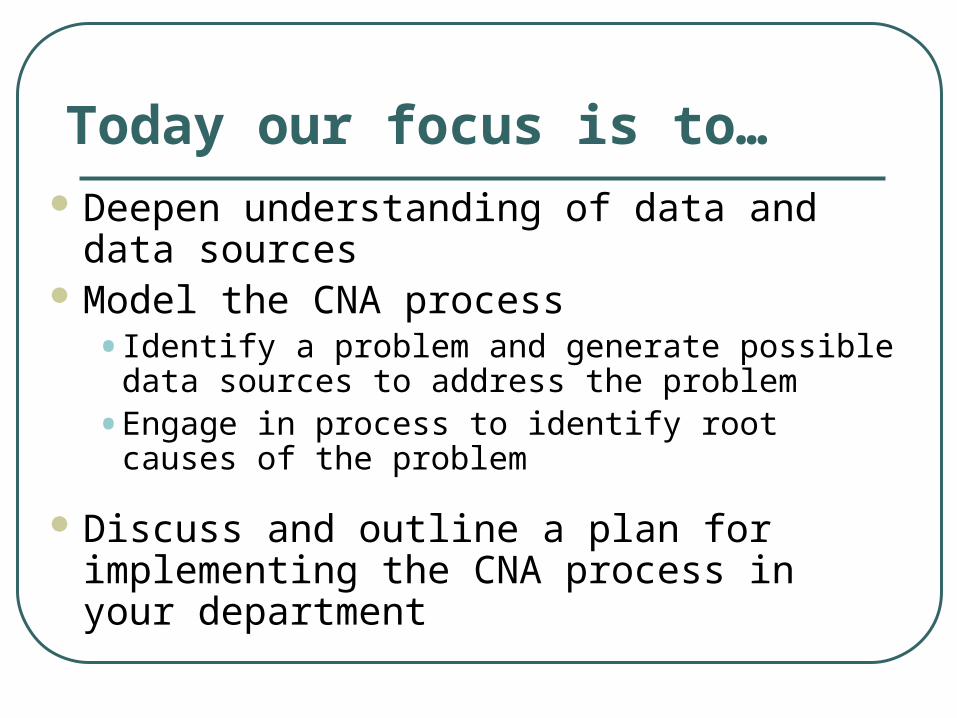
Today our focus is to…
Deepen understanding of data and data sources
Model the CNA process• Identify a problem and generate possible data
sources to address the problem
• Engage in process to identify root causes of the problem
Discuss and outline a plan for implementing the CNA process in your department
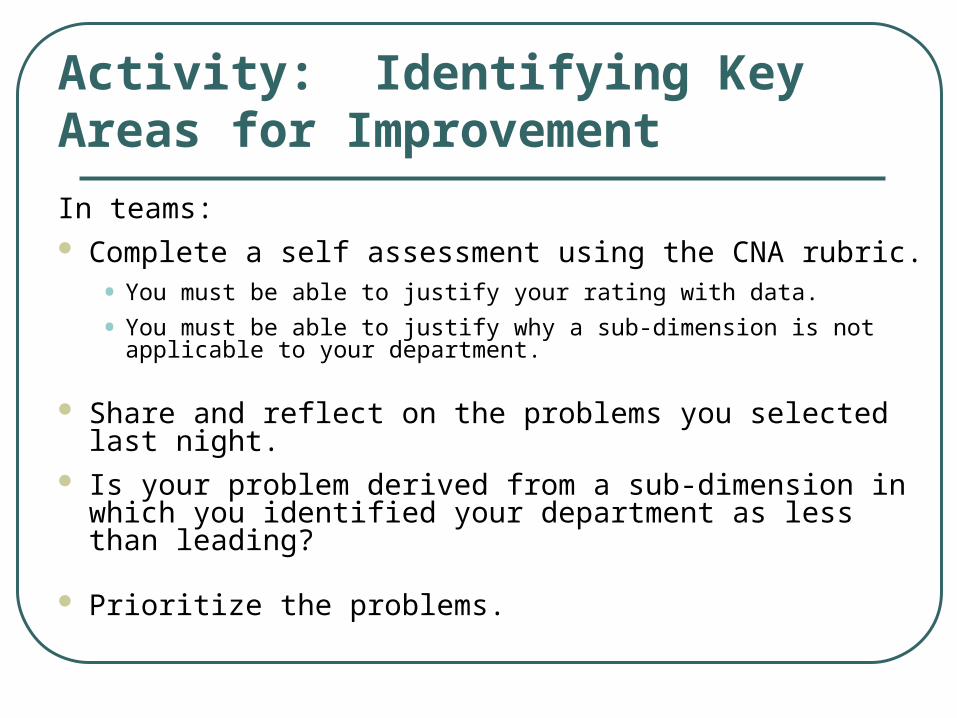
Activity: Identifying Key Areas for Improvement
In teams: Complete a self assessment using the CNA rubric.
• You must be able to justify your rating with data.
• You must be able to justify why a sub-dimension is not applicable to your department.
Share and reflect on the problems you selected last night.
Is your problem derived from a sub-dimension in which you identified your department as less than leading?
Prioritize the problems.
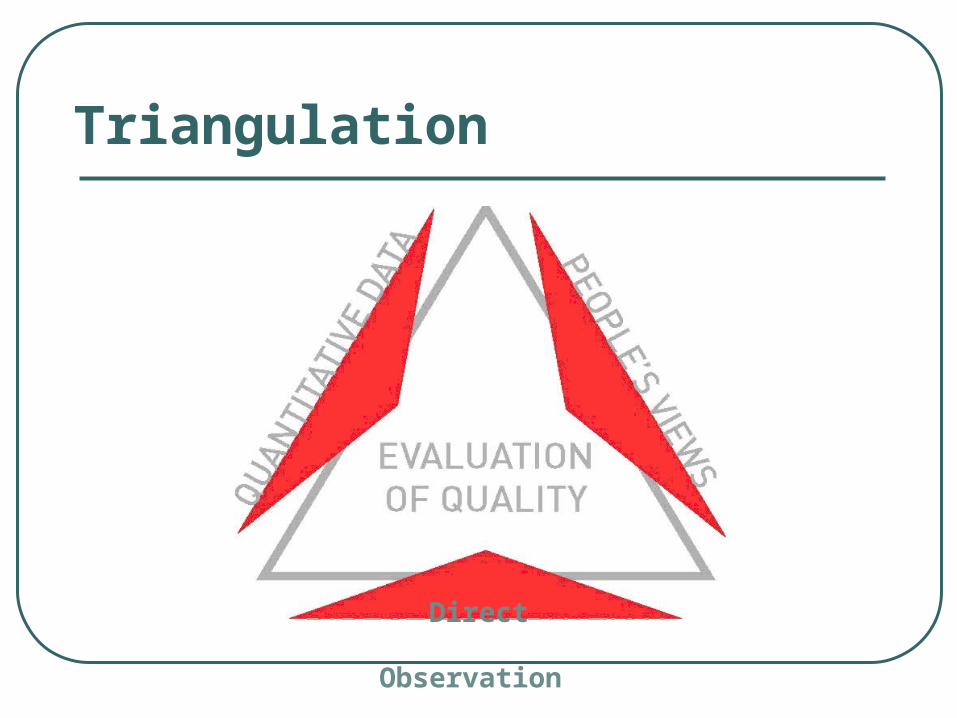
Triangulation
Direct
Observation
“When we focus only on student learning measures, we see school personnel using their time figuring out how to look better on the student learning measures. We want school personnel to use their time figuring out how to be better for all students.”
Bernhardt,V. L., (1998,March). Invited Monograph No. 4.California Association for Supervision and Curriculum Development (CASCD).
Morning Break

So Much Data…So Little Time...
What will it tell you?
What do you need to know?
How can it help you?
Where is it found?
Starting Data Dialogue
Are there any patterns/trends?
Does anything stand out to you?
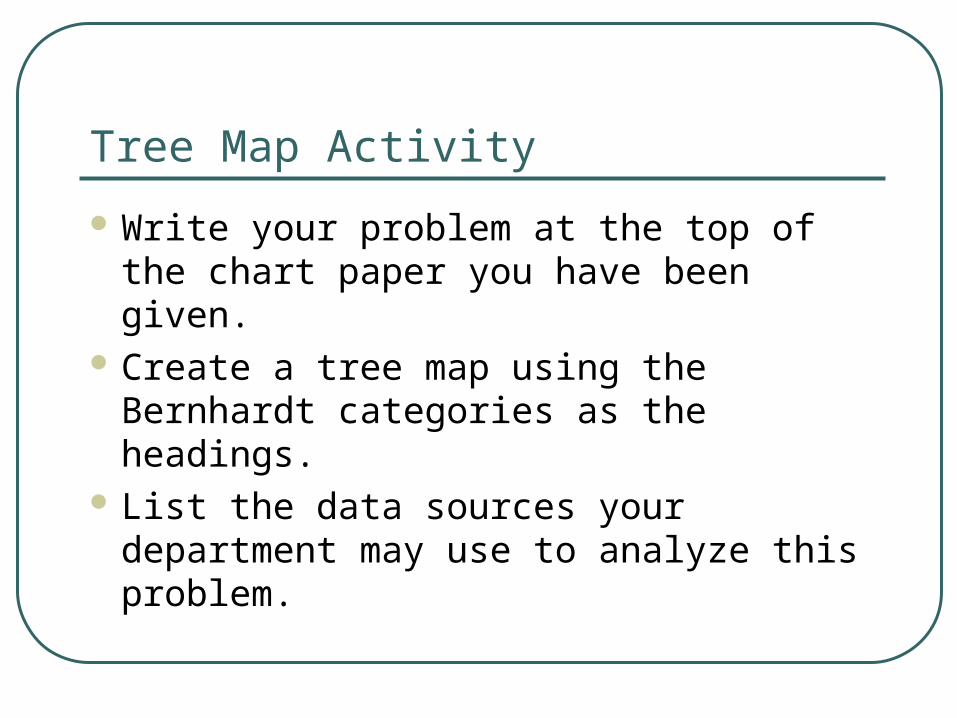
Tree Map Activity
Write your problem at the top of the chart paper you have been given.
Create a tree map using the Bernhardt categories as the headings.
List the data sources your department may use to analyze this problem.
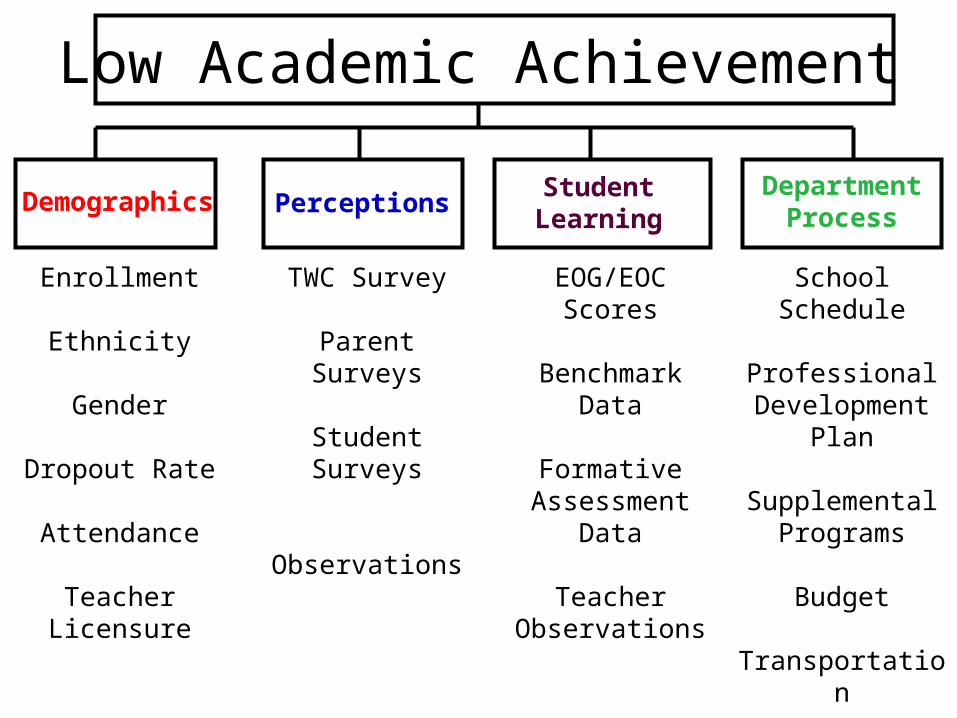
Low Academic Achievement
Demographics PerceptionsDepartment
Process
Enrollment
Ethnicity
Gender
Dropout Rate
Attendance
Teacher Licensure
TWC Survey
Parent Surveys
Student Surveys
Observations
EOG/EOC Scores
Benchmark Data
Formative Assessment Data
Teacher Observations
StudentLearning
School Schedule
Professional Development
Plan
Supplemental Programs
Budget
Transportation
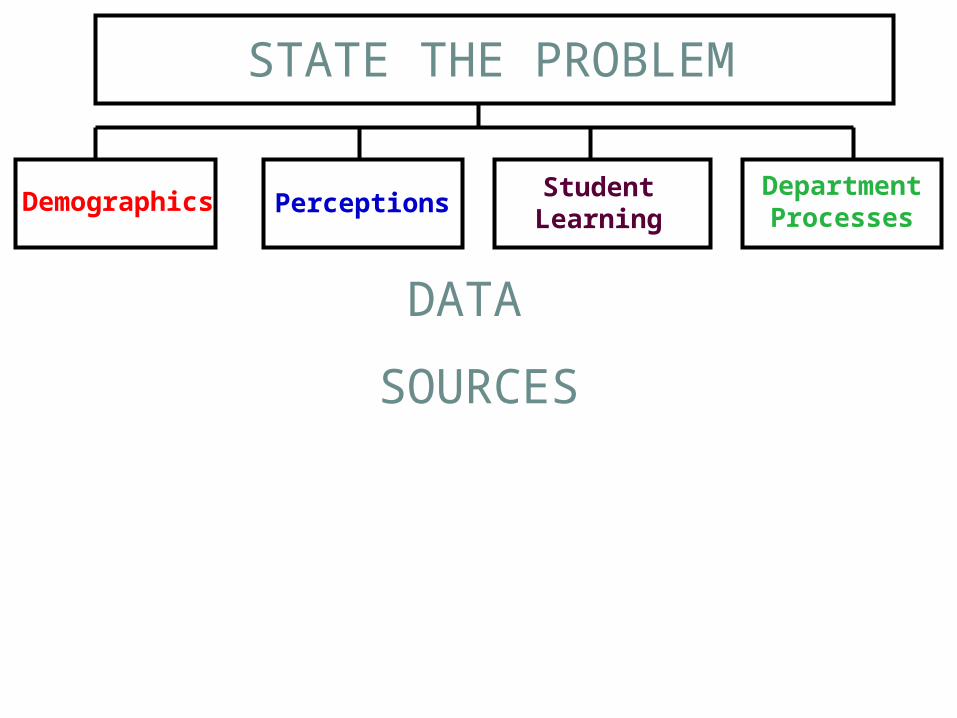
Demographics PerceptionsDepartmentProcesses
StudentLearning
STATE THE PROBLEM
DATA
SOURCES
Creating a Culture of Inquiry
“Willingness to ask questions—and to look for the real answers—gets to the heart of how data can stimulate the. . . change process.”
Ruth S. Johnson, “Using Data to Close the Achievement Gap: How to Measure Equity in Our Schools”, 2002
Gallery Walk
Place your group’s poster on the wall. When you hear the signal, move clockwise to
the next chart. As you move about the room, look for
commonalities between departments. We will debrief after the gallery walk.
Summary of Gallery Walk
Aha’s
Similarities (Overarching themes)
Differences
Impact
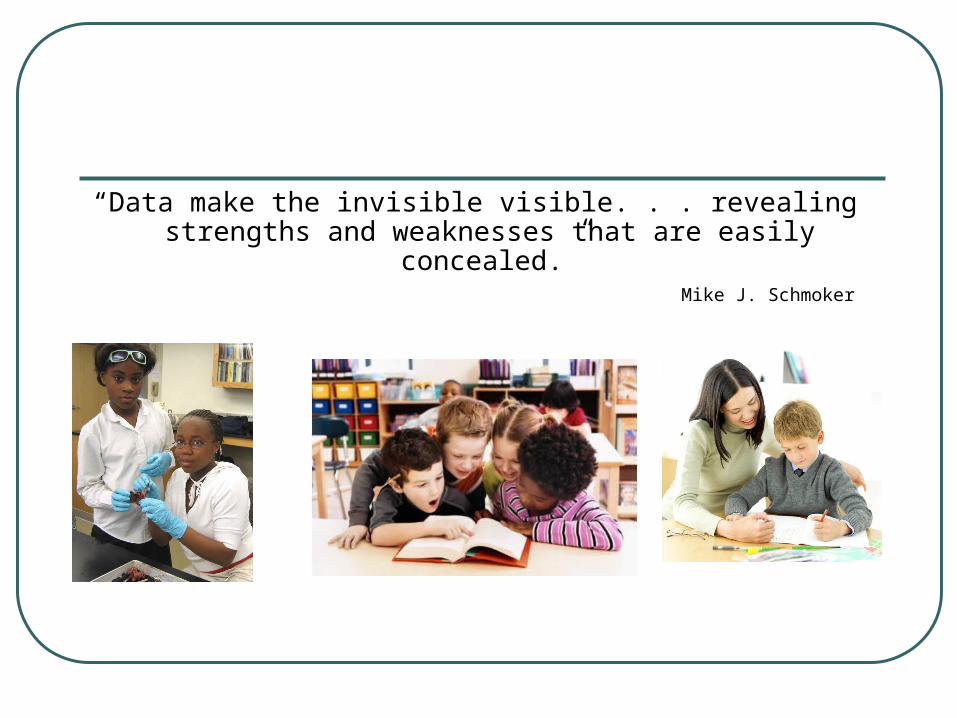
“Data make the invisible visible. . . revealing strengths and weaknesses that are easily concealed.”
Mike J. Schmoker
Determining the Root Cause
The Four Why’s
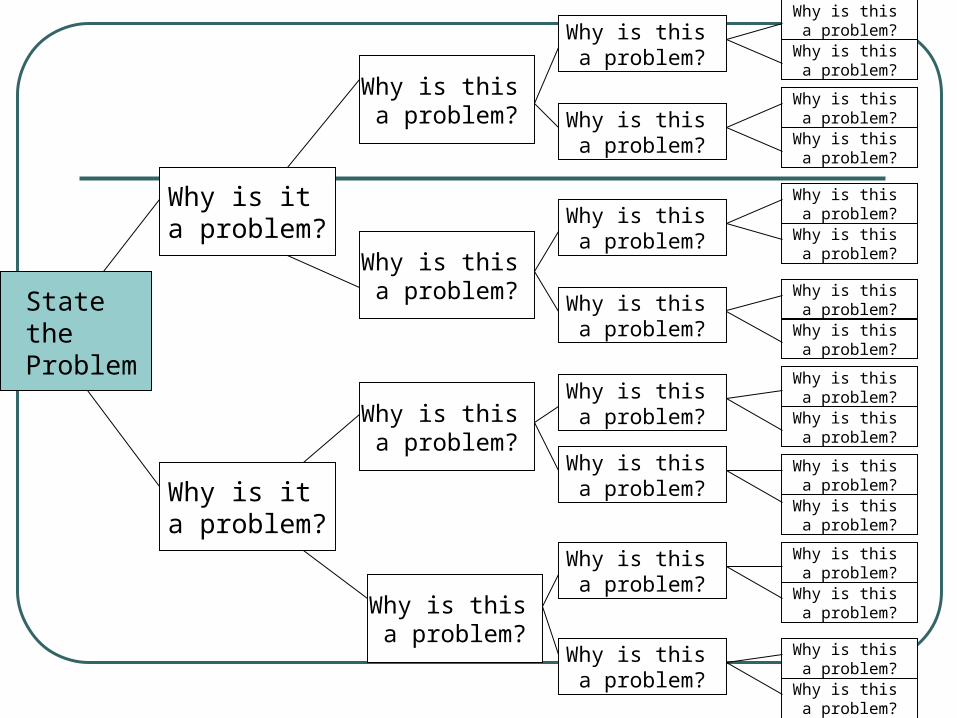
State the Problem
Why is it a problem?
Why is it a problem?
Why is this a problem?
Why is this a problem?
Why is this a problem?
Why is this a problem?
Why is this a problem?
Why is this a problem?
Why is this a problem?
Why is this a problem?
Why is this a problem?
Why is this a problem?
Why is this a problem?
Why is this a problem?
Why is this a problem?
Why is this a problem?
Why is this a problem?
Why is this a problem?
Why is this a problem?
Why is this a problem?
Why is this a problem?
Why is this a problem?
Why is this a problem?Why is this a problem?
Why is this a problem?Why is this a problem?
Why is this a problem?Why is this a problem?
Why is this a problem?Why is this a problem?

Four Whys – example
Don’t think it will help
They aren’t comfortable
Don’t feel welcome
Parent’s concerns not addressed
Parents don’t have a positive view of schools
Invitation seen by school as their responsibility
Limited meeting agenda
Historic practice
No strong links with local community leader
That has been their experience
Their experience of schools was being told
See school as a part of the ‘establishment’
No alternative models
Only educational professionals involved
Only concerned with what happens age 5-11
Aimed at solving school’s problems
Classroom issues seen as priority
Left school without sense of achievement
Parents have no link to what their children are learning
Parents not experienced adult education or training
They had poor teaching
Think that school will tell not listen
Impersonal invitations – from a stranger
Friends/wider family not invited
Usually asked to come to school when there is trouble
Learning seen as separate from everyday life
Agenda limited to educational issues
Agenda is school’s, not children’s
Negative experiences as children
Parents don’t engage
Don’t respond to communications from school

Where are we now?
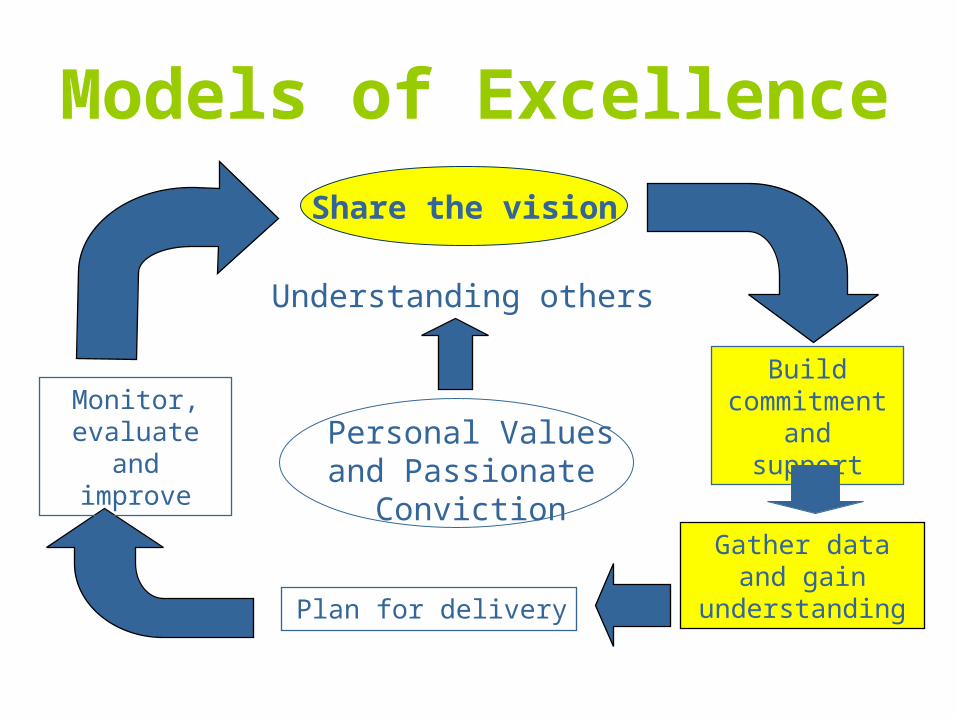
Models of Excellence
Understanding others
Share the vision
Personal Valuesand Passionate
Conviction
Monitor, evaluate and
improve
Build commitment and support
Gather data and gain
understandingPlan for delivery
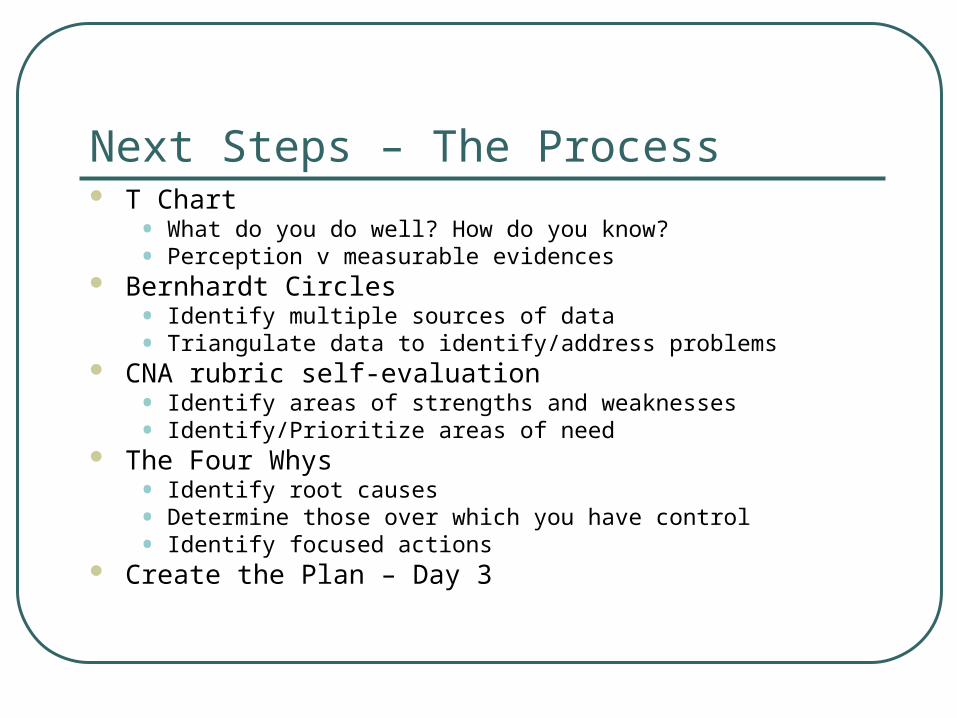
Next Steps – The Process T Chart
• What do you do well? How do you know?• Perception v measurable evidences
Bernhardt Circles• Identify multiple sources of data• Triangulate data to identify/address problems
CNA rubric self-evaluation• Identify areas of strengths and weaknesses• Identify/Prioritize areas of need
The Four Whys• Identify root causes• Determine those over which you have control • Identify focused actions
Create the Plan – Day 3
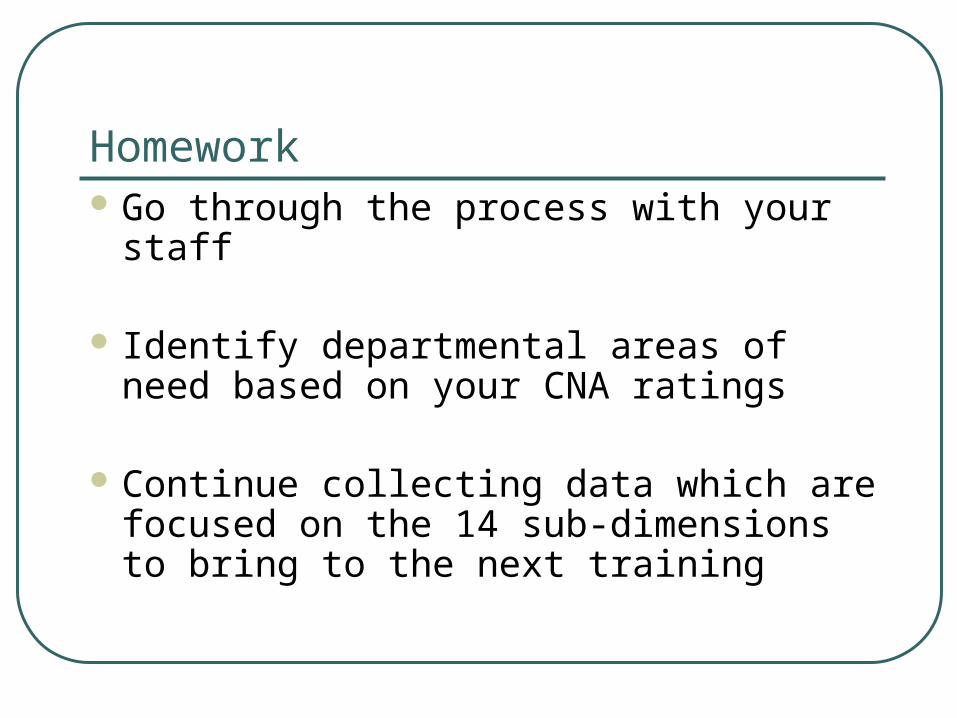
Homework Go through the process with your staff
Identify departmental areas of need based on your CNA ratings
Continue collecting data which are focused on the 14 sub-dimensions to bring to the next training
Feedback on Today
Even better if …Even better if …What went well?What went well?