deutsche bank roadshow anthony di iorio€¦ · milano, 6 july 2007 deutsche bank roadshow anthony...
TRANSCRIPT
Milano, 6 July 2007
Deutsche Bank RoadshowAnthony di IorioChief Financial Officer
financialtransparency.
Investor Relations 07/07· 2
Agenda
1 Outstanding performance
2 Strengthened strategic positions
3 Phase 3 of our Management Agenda
financialtransparency.
Investor Relations 07/07· 3
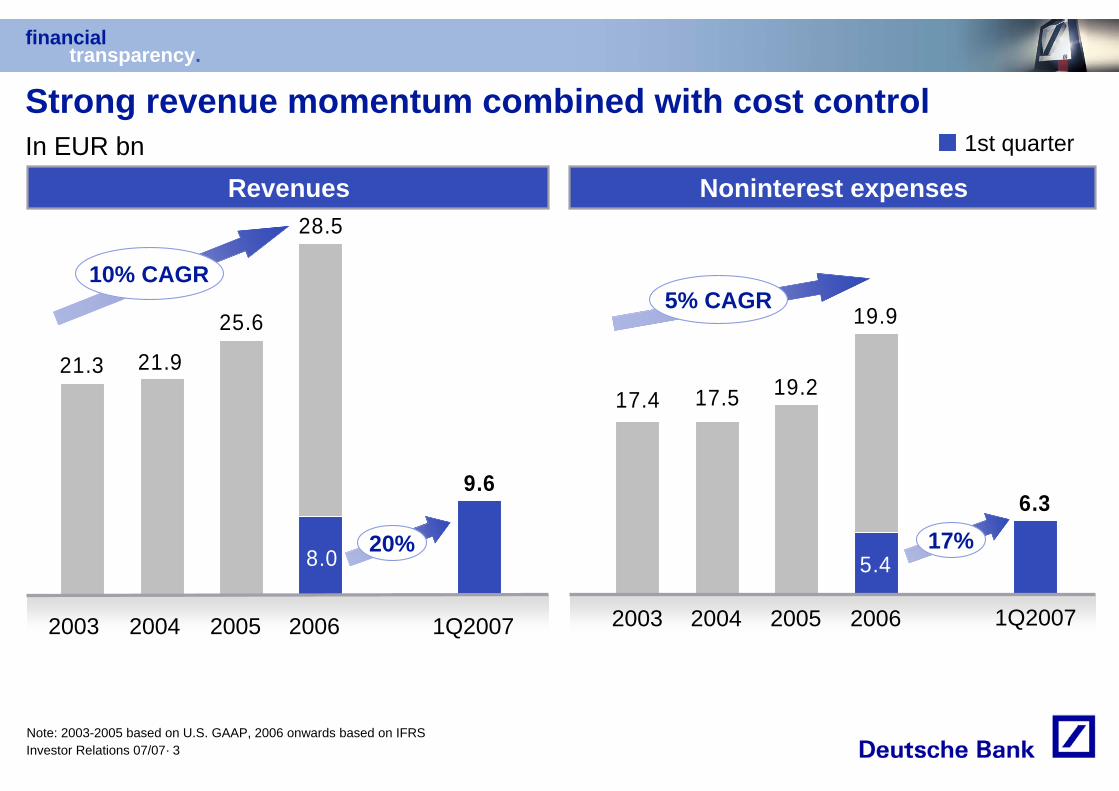
9.6
21.3 21.9
25.6
8.0
28.5
Strong revenue momentum combined with cost control1st quarter
2003 2004 2005 2006 1Q2007
Revenues Noninterest expenses
5.4
19.217.517.4
6.3
19.9
2003 2004 2005 2006 1Q2007
In EUR bn
17%
10% CAGR
Note: 2003-2005 based on U.S. GAAP, 2006 onwards based on IFRS
5% CAGR
20%
financialtransparency.
Investor Relations 07/07· 4
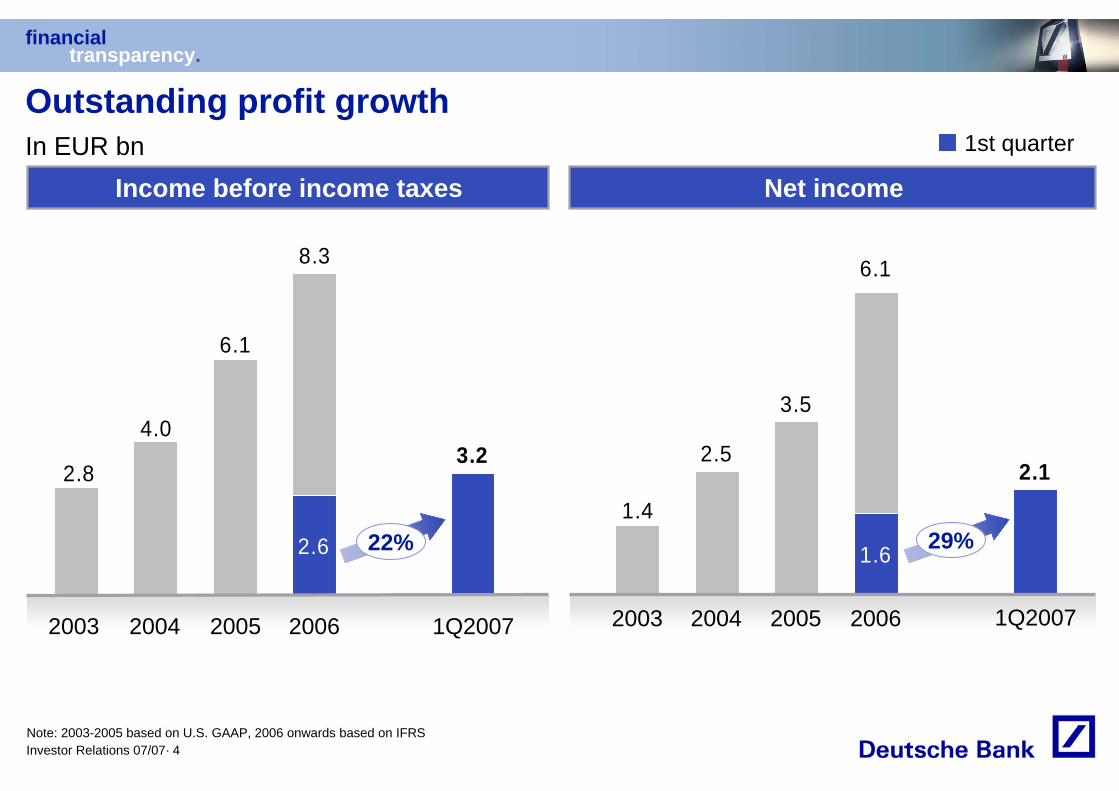
Outstanding profit growth1st quarter
3.22.8
4.0
6.1
2.6
8.3
2003 2004 2005 2006 1Q2007
Income before income taxes Net income
2.11.4
2.5
3.5
1.6
6.1
2003 2004 2005 2006 1Q2007
In EUR bn
29%22%
Note: 2003-2005 based on U.S. GAAP, 2006 onwards based on IFRS
financialtransparency.
Investor Relations 07/07· 5
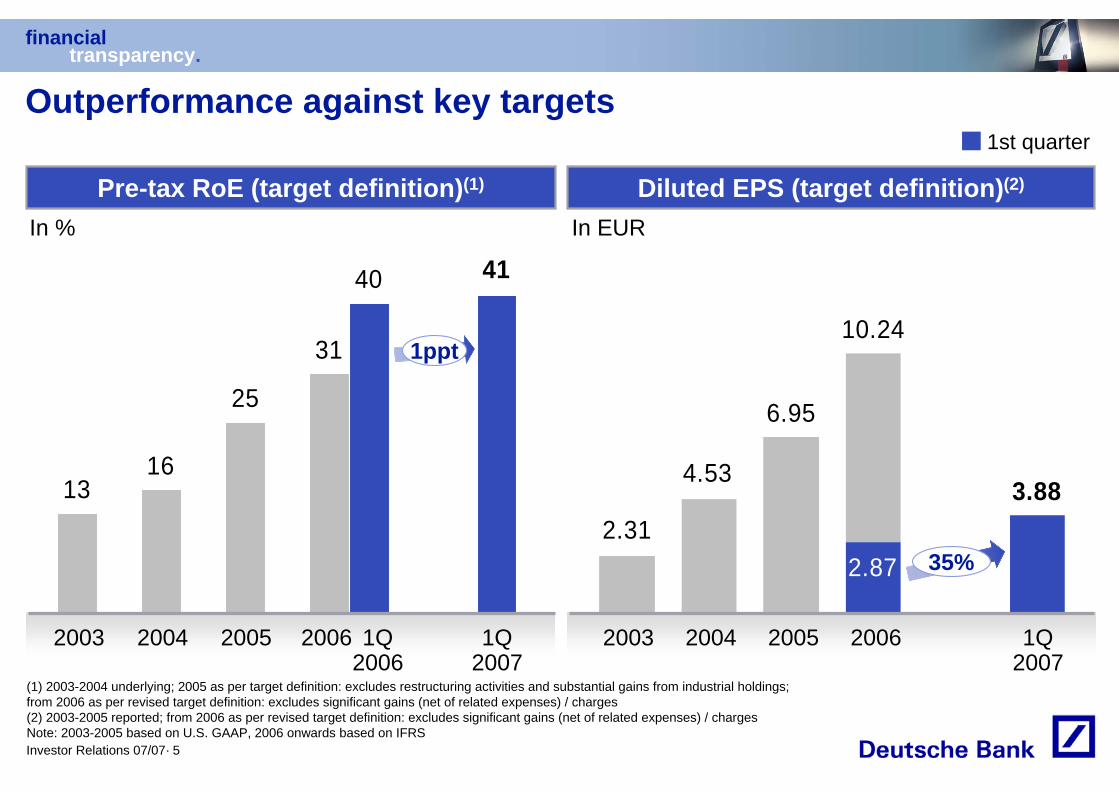
Outperformance against key targets
Diluted EPS (target definition)(2)Pre-tax RoE (target definition)(1)
In %
(1) 2003-2004 underlying; 2005 as per target definition: excludes restructuring activities and substantial gains from industrial holdings; from 2006 as per revised target definition: excludes significant gains (net of related expenses) / charges(2) 2003-2005 reported; from 2006 as per revised target definition: excludes significant gains (net of related expenses) / chargesNote: 2003-2005 based on U.S. GAAP, 2006 onwards based on IFRS
In EUR
2004 2005 20062003 1Q2007
1316
25
31
40 41
3.882.31
4.53
6.95
2.87
10.24
2004 2005 20062003 1Q2007
1st quarter
1ppt
35%
1Q2006
financialtransparency.
Investor Relations 07/07· 6
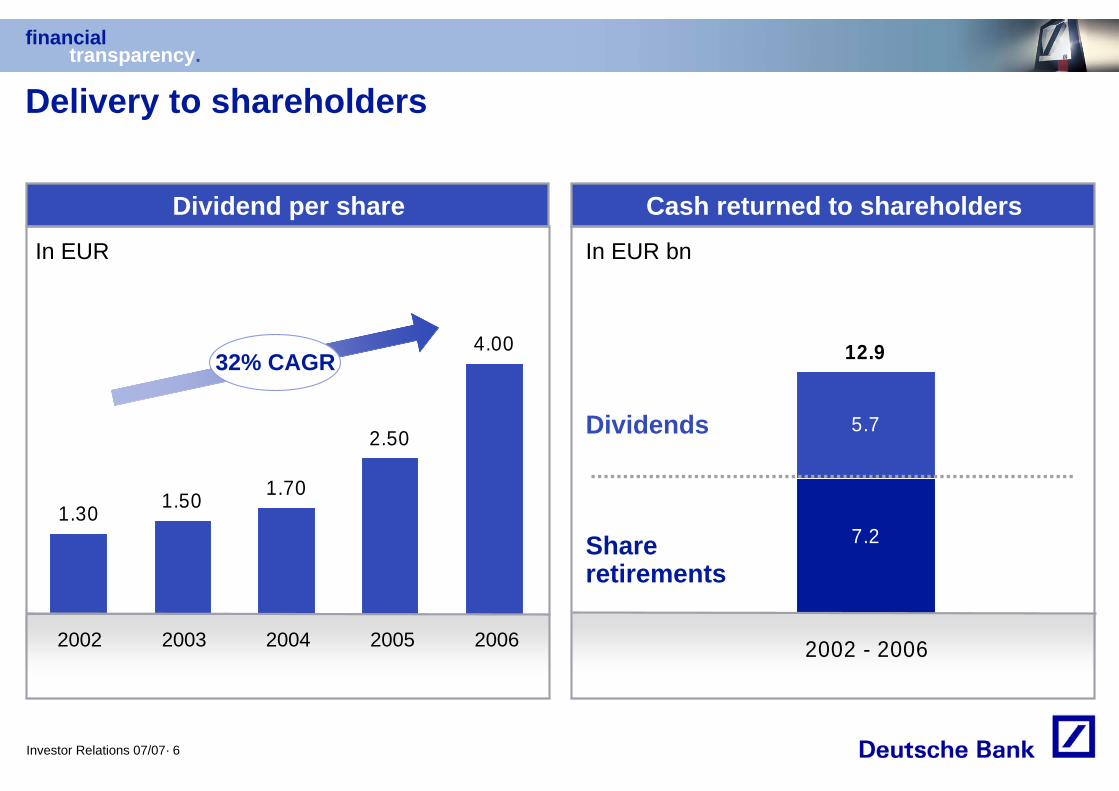
5.7
12.9
7.2
2002 - 2006
1.30 1.50 1.70
2.50
4.00
Delivery to shareholders
Dividend per share
20062002 2003 2004 2005
In EUR
Cash returned to shareholdersIn EUR bn
Share retirements
Dividends
32% CAGR
financialtransparency.
Investor Relations 07/07· 7
Agenda
1 Outstanding performance
2 Strengthened strategic positions
3 Phase 3 of our Management Agenda
financialtransparency.
Investor Relations 07/07· 8
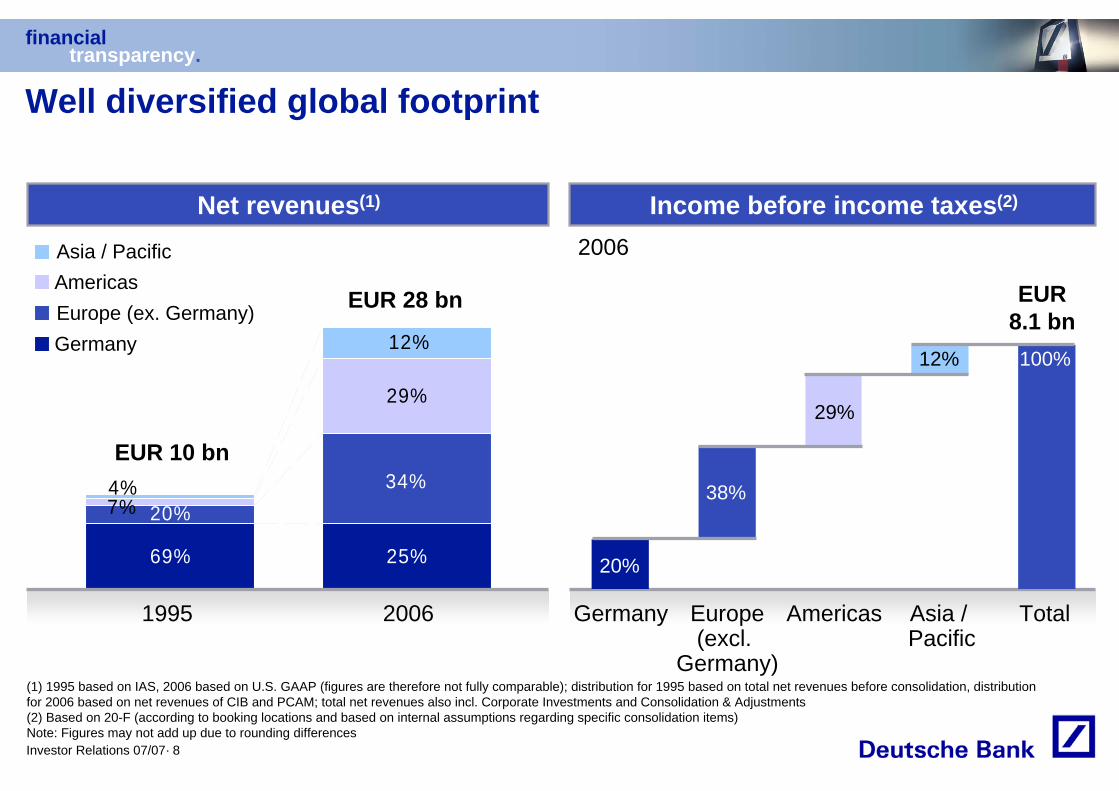
Net revenues(1) Income before income taxes(2)
Well diversified global footprint
Germany Europe(excl.
Germany)
Americas Asia / Pacific
Total
(1) 1995 based on IAS, 2006 based on U.S. GAAP (figures are therefore not fully comparable); distribution for 1995 based on total net revenues before consolidation, distribution for 2006 based on net revenues of CIB and PCAM; total net revenues also incl. Corporate Investments and Consolidation & Adjustments (2) Based on 20-F (according to booking locations and based on internal assumptions regarding specific consolidation items)Note: Figures may not add up due to rounding differences
20%
38%
29%
12% 100%
69% 25%
20%34%
7%
29%
4%
12%
1995 2006
EUR 10 bn
EUR 28 bn
2006
EUR 8.1 bn
Asia / PacificAmericasEurope (ex. Germany)Germany
financialtransparency.
Investor Relations 07/07· 9
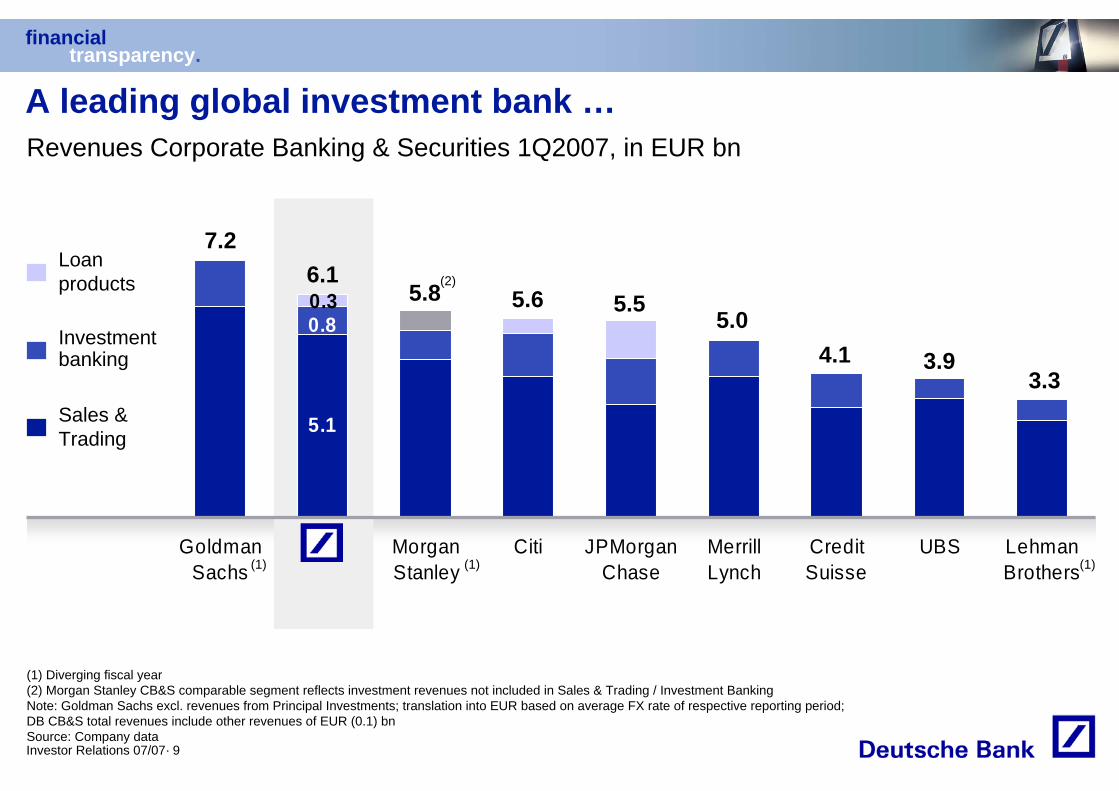
A leading global investment bank …
5.1
0.80.3
GoldmanSachs
DB MorganStanley
Citi JPMorganChase
MerrillLynch
CreditSuisse
UBS LehmanBrothers
Revenues Corporate Banking & Securities 1Q2007, in EUR bn
7.2
5.5
3.9
5.66.1
5.85.0
Loan products
Sales & Trading
Investment banking 4.1
3.3
(2)
(1) (1) (1)
(1) Diverging fiscal year(2) Morgan Stanley CB&S comparable segment reflects investment revenues not included in Sales & Trading / Investment Banking Note: Goldman Sachs excl. revenues from Principal Investments; translation into EUR based on average FX rate of respective reporting period; DB CB&S total revenues include other revenues of EUR (0.1) bnSource: Company data
financialtransparency.
Investor Relations 07/07· 10
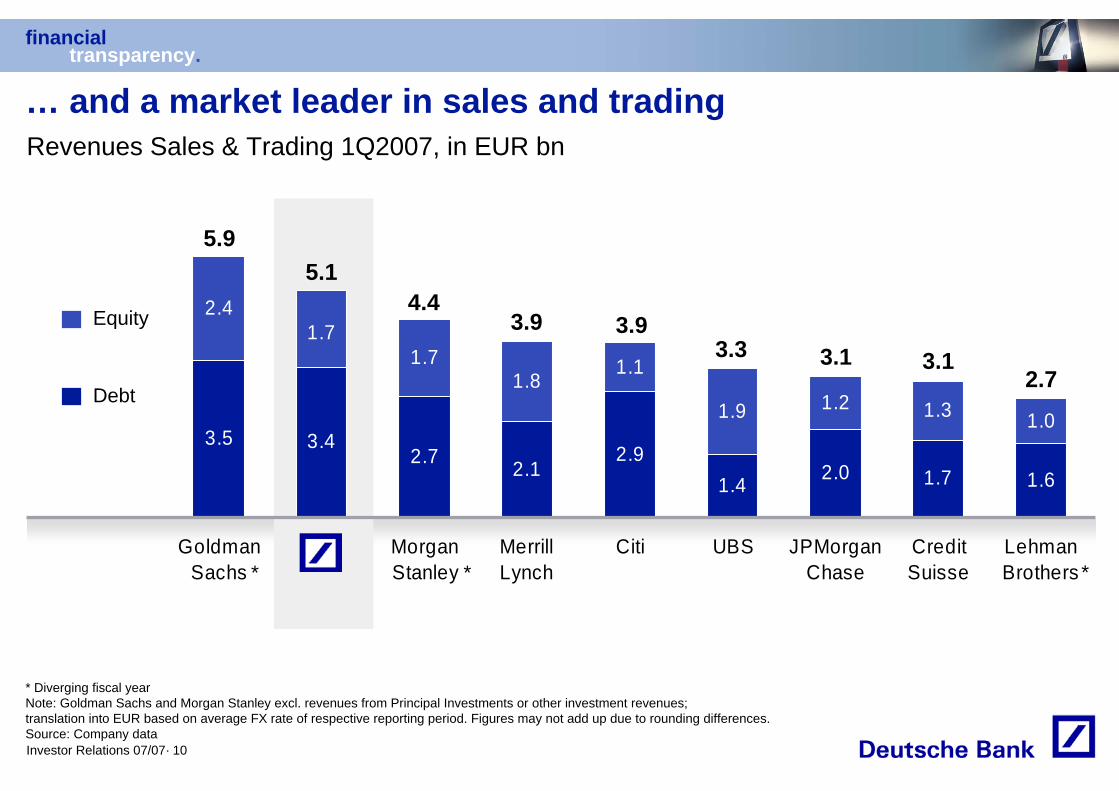
1.7
3.43.52.7 2.1
2.91.4 2.0 1.6
1.3
2.4
1.7 1.1
1.9 1.21.8
1.7
1.0
GoldmanSachs
DB MorganStanley
MerrillLynch
Citi UBS JPMorganChase
CreditSuisse
LehmanBrothers
5.9
3.93.1
3.9
5.14.4
3.3
Debt
Equity
3.12.7
*
Revenues Sales & Trading 1Q2007, in EUR bn
* Diverging fiscal yearNote: Goldman Sachs and Morgan Stanley excl. revenues from Principal Investments or other investment revenues; translation into EUR based on average FX rate of respective reporting period. Figures may not add up due to rounding differences.Source: Company data
… and a market leader in sales and trading
**
financialtransparency.
Investor Relations 07/07· 11
0
1
2
3
4
5
6
1Q02
2Q02
3Q02
4Q02
1Q03
2Q03
3Q03
4Q03
1Q04
2Q04
3Q04
4Q04
1Q05
2Q05
3Q05
4Q05
1Q06
2Q06
3Q06
4Q06
1Q07
0
1
2
3
4
5
6
1Q02
2Q02
3Q02
4Q02
1Q03
2Q03
3Q03
4Q03
1Q04
2Q04
3Q04
4Q04
1Q05
2Q05
3Q05
4Q05
1Q06
2Q06
3Q06
4Q06
1Q07
Sale
s &
Trad
ing
reve
nues
, in
EU
R b
n
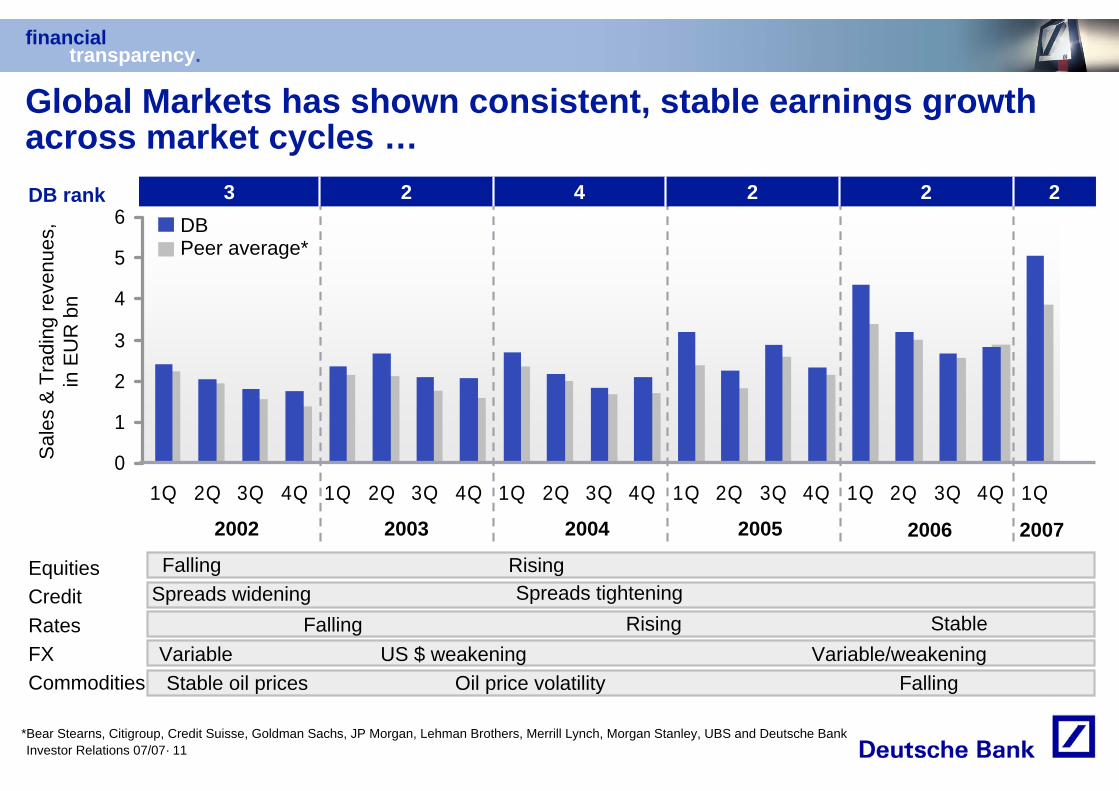
RatesCredit
FXCommodities
EquitiesSpreads widening Spreads tightening
Falling RisingVariable US $ weakening Variable/weakeningStable oil prices Oil price volatility Falling
Falling Rising
Global Markets has shown consistent, stable earnings growth across market cycles …
2002 2003 2004 2005 2006 2007
DB rank 2 22423DBPeer average*
Stable
*Bear Stearns, Citigroup, Credit Suisse, Goldman Sachs, JP Morgan, Lehman Brothers, Merrill Lynch, Morgan Stanley, UBS and Deutsche Bank
financialtransparency.
Investor Relations 07/07· 12
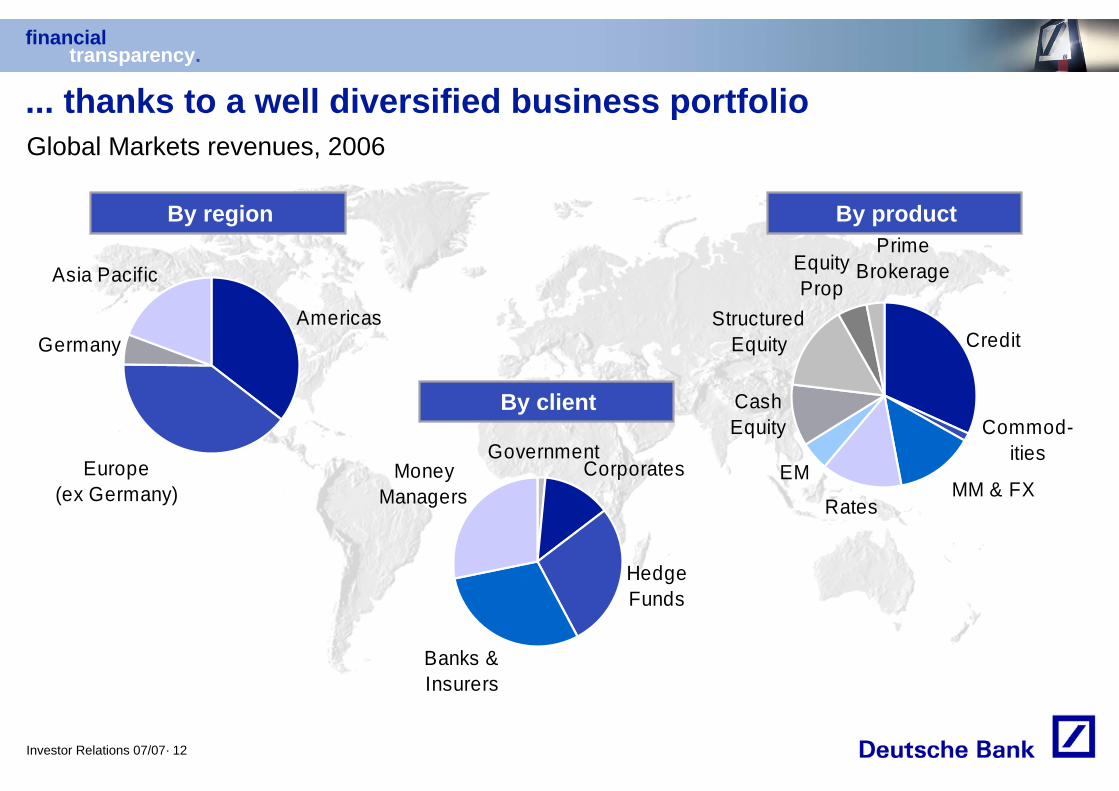
Corporates
Banks & Insurers
Money Managers
Government
HedgeFunds
MM & FX
Equity Prop
Prime Brokerage
Commod-ities
Structured Equity
Cash Equity
Rates
EM
Credit
... thanks to a well diversified business portfolio
By region By product
By client
Global Markets revenues, 2006
Americas
Europe(ex Germany)
Germany
Asia Pacific
financialtransparency.
Investor Relations 07/07· 13
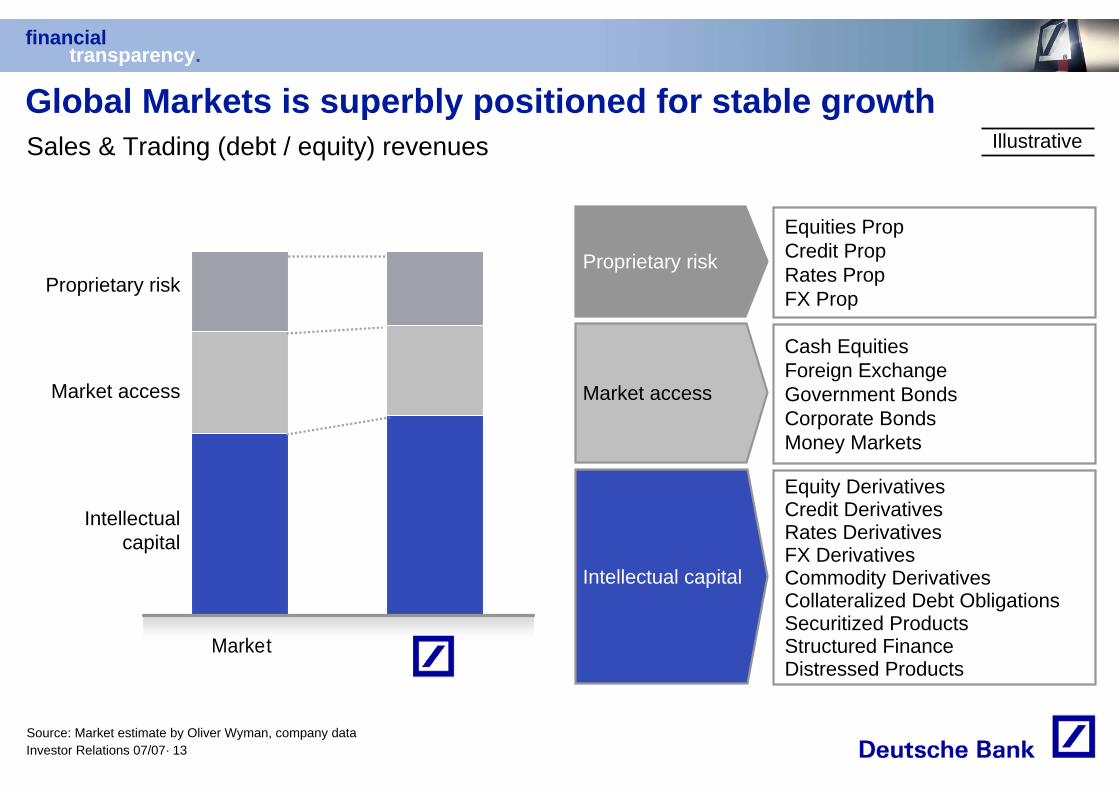
Market db
Proprietary risk
Equities PropCredit PropRates PropFX Prop
Market access
Cash EquitiesForeign ExchangeGovernment BondsCorporate BondsMoney Markets
Intellectual capital
Equity DerivativesCredit DerivativesRates DerivativesFX DerivativesCommodity DerivativesCollateralized Debt Obligations Securitized ProductsStructured FinanceDistressed Products
Proprietary risk
Market access
Intellectual capital
Global Markets is superbly positioned for stable growth
Source: Market estimate by Oliver Wyman, company data
Sales & Trading (debt / equity) revenues Illustrative
financialtransparency.
Investor Relations 07/07· 14
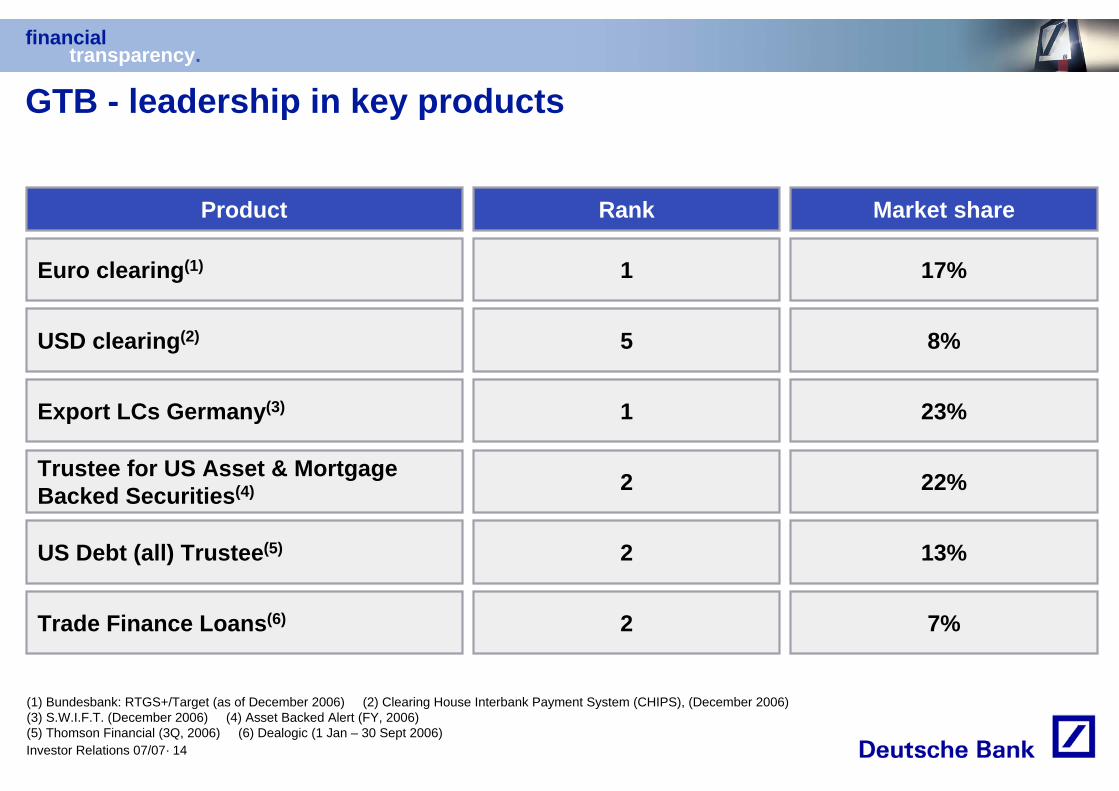
GTB - leadership in key products
(1) Bundesbank: RTGS+/Target (as of December 2006) (2) Clearing House Interbank Payment System (CHIPS), (December 2006)(3) S.W.I.F.T. (December 2006) (4) Asset Backed Alert (FY, 2006) (5) Thomson Financial (3Q, 2006) (6) Dealogic (1 Jan – 30 Sept 2006)
Product
Euro clearing(1)
USD clearing(2)
Trustee for US Asset & Mortgage Backed Securities(4)
Export LCs Germany(3)
US Debt (all) Trustee(5)
Trade Finance Loans(6)
Rank Market share
1 17%
5 8%
2 22%
1 23%
2 13%
2 7%
financialtransparency.
Investor Relations 07/07· 15
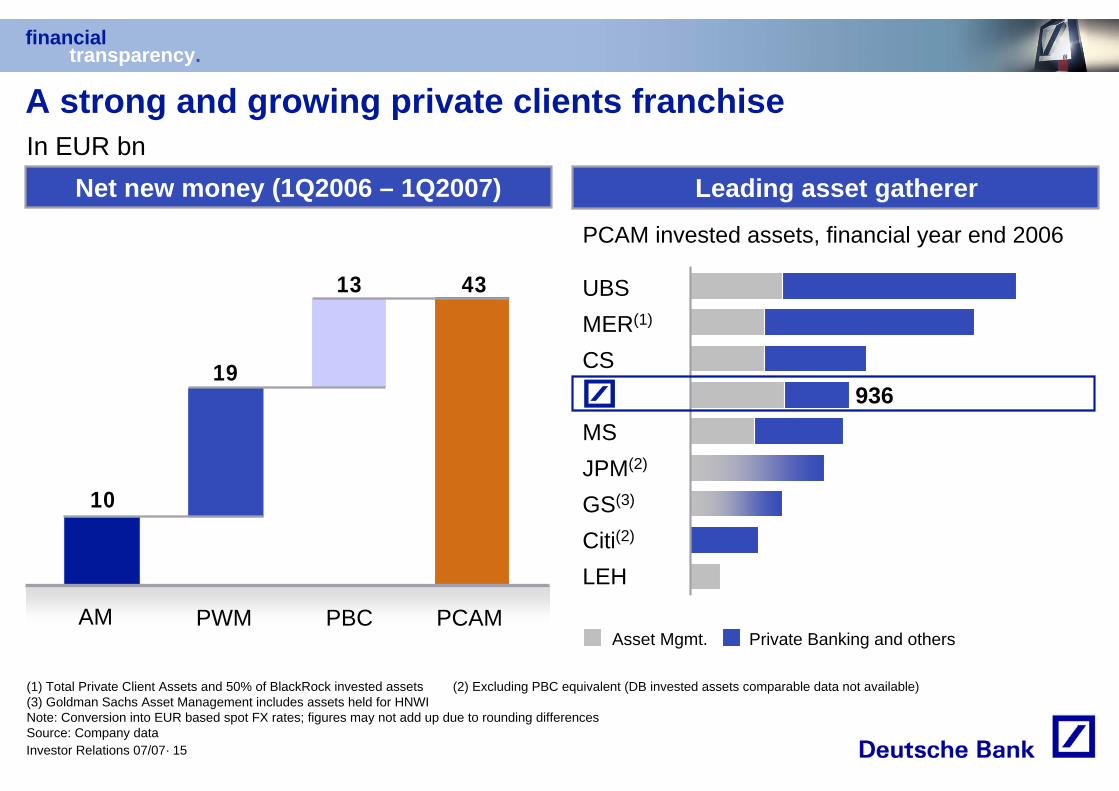
10
19
13 43
Net new money (1Q2006 – 1Q2007)
AM PWM PBC PCAM
Leading asset gatherer
PCAM invested assets, financial year end 2006
936
Private Banking and othersAsset Mgmt.
UBSMER(1)
CS
MSJPM(2)
GS(3)
Citi(2)
LEH
In EUR bnA strong and growing private clients franchise
(1) Total Private Client Assets and 50% of BlackRock invested assets (2) Excluding PBC equivalent (DB invested assets comparable data not available)(3) Goldman Sachs Asset Management includes assets held for HNWINote: Conversion into EUR based spot FX rates; figures may not add up due to rounding differencesSource: Company data
financialtransparency.
Investor Relations 07/07· 16
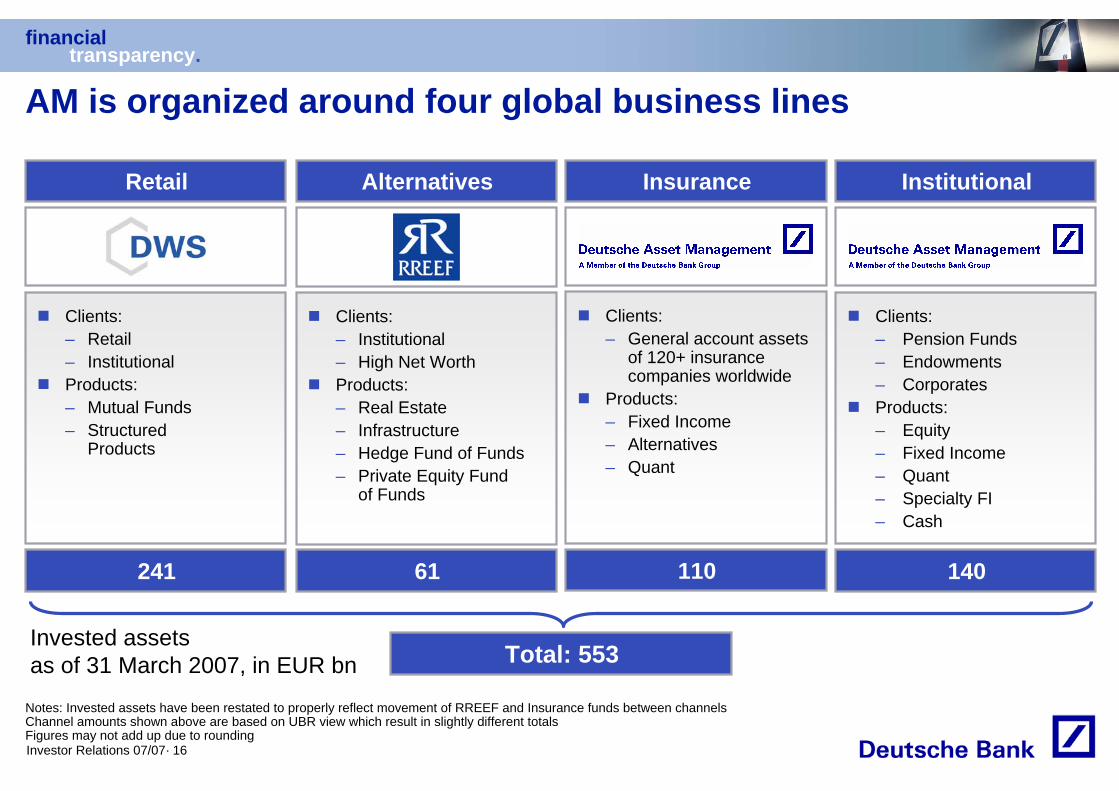
AM is organized around four global business lines
Retail
241
Institutional
140
Alternatives
61
Total: 553
Insurance
110
Clients:– General account assets
of 120+ insurance companies worldwide
Products:– Fixed Income– Alternatives– Quant
Clients:– Institutional– High Net WorthProducts:– Real Estate– Infrastructure– Hedge Fund of Funds– Private Equity Fund
of Funds
Clients:– Retail– InstitutionalProducts:– Mutual Funds– Structured
Products
Clients:– Pension Funds– Endowments– CorporatesProducts:– Equity– Fixed Income– Quant– Specialty FI– Cash
Notes: Invested assets have been restated to properly reflect movement of RREEF and Insurance funds between channelsChannel amounts shown above are based on UBR view which result in slightly different totalsFigures may not add up due to rounding
Invested assets as of 31 March 2007, in EUR bn
financialtransparency.
Investor Relations 07/07· 17
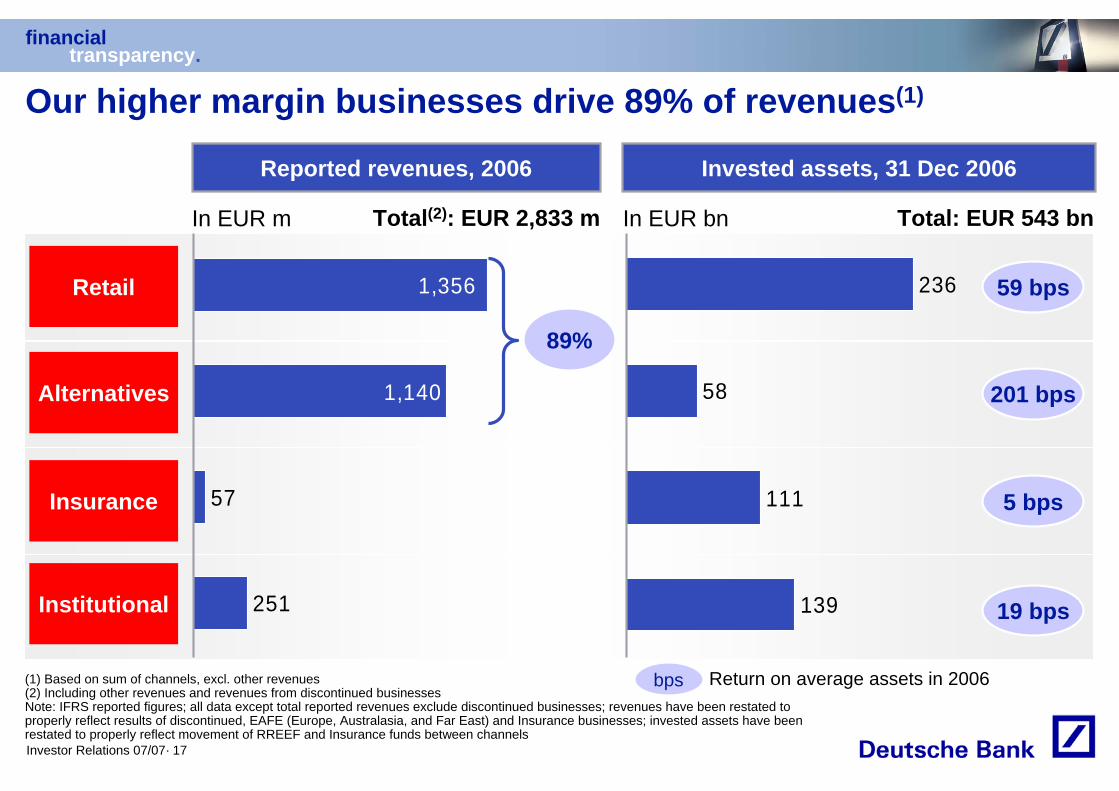
Our higher margin businesses drive 89% of revenues(1)
Retail
Insurance
Alternatives
139
111
58
236
Invested assets, 31 Dec 2006
In EUR bn Total: EUR 543 bn
Reported revenues, 2006
In EUR m
59 bps
201 bps
19 bps
Return on average assets in 2006bps
Institutional
5 bps
(1) Based on sum of channels, excl. other revenues(2) Including other revenues and revenues from discontinued businesses Note: IFRS reported figures; all data except total reported revenues exclude discontinued businesses; revenues have been restated to properly reflect results of discontinued, EAFE (Europe, Australasia, and Far East) and Insurance businesses; invested assets have been restated to properly reflect movement of RREEF and Insurance funds between channels
251
57
1,140
1,356
Total(2): EUR 2,833 m
89%
financialtransparency.
Investor Relations 07/07· 18
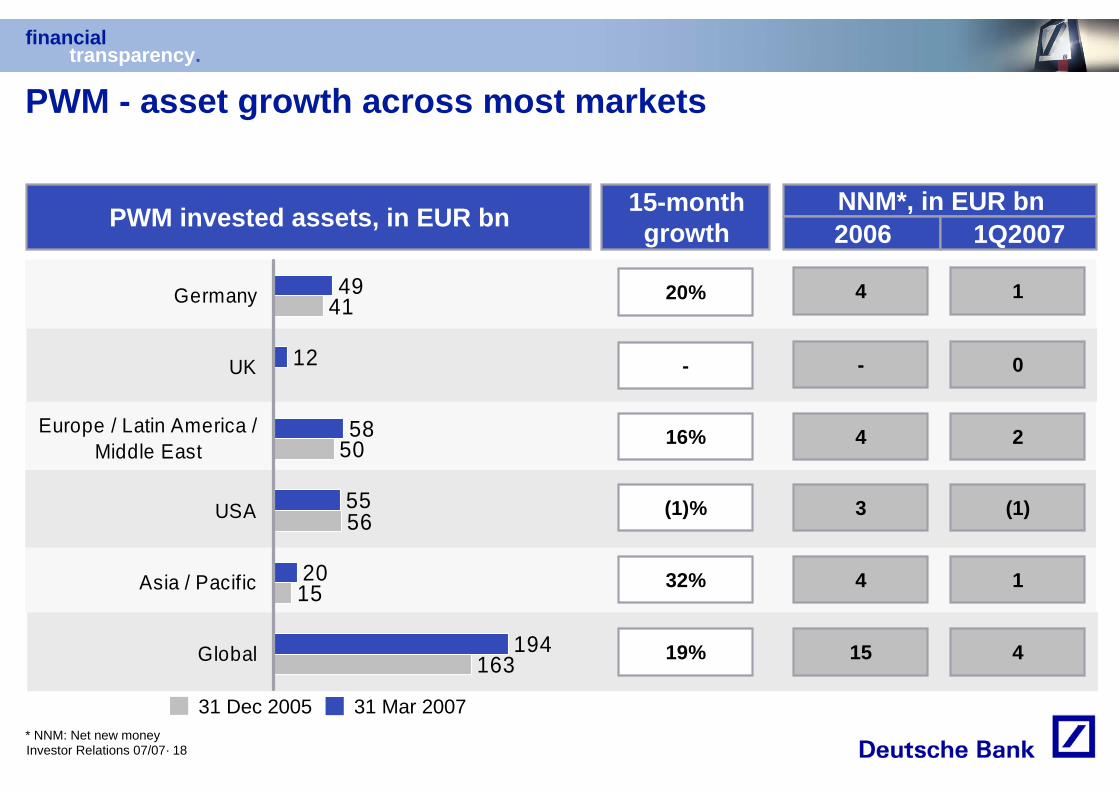
PWM - asset growth across most markets
163
15
56
50
41
194
20
55
58
12
49
Global
Asia / Pacific
USA
Europe / Latin America /Middle East
UK
Germany
PWM invested assets, in EUR bn
31 Mar 200731 Dec 2005
15-month growth
20%
16%
(1)%
32%
19%
4
4
3
4
15
1
2
(1)
1
4
NNM*, in EUR bn2006 1Q2007
* NNM: Net new money
- - 0
financialtransparency.
Investor Relations 07/07· 19
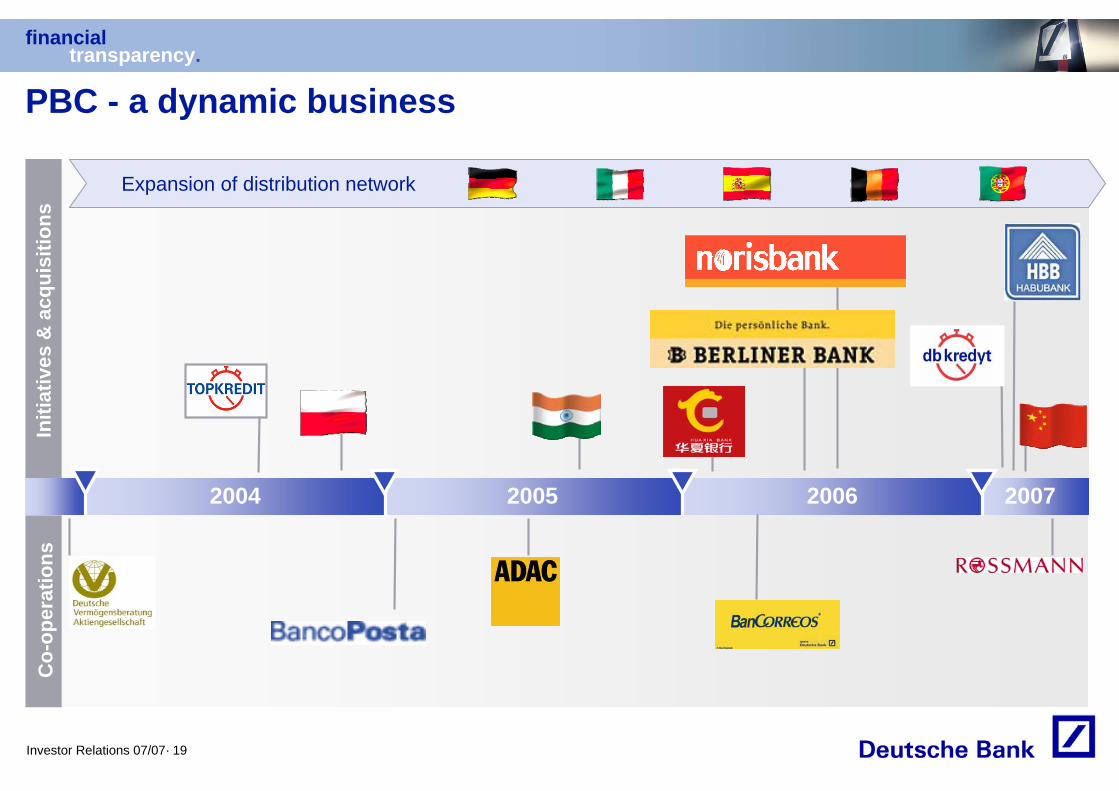
PBC - a dynamic business
Initi
ativ
es &
acq
uisi
tions
2004 2005 2006 2007
Co-
oper
atio
ns
Expansion of distribution network
financialtransparency.
Investor Relations 07/07· 20
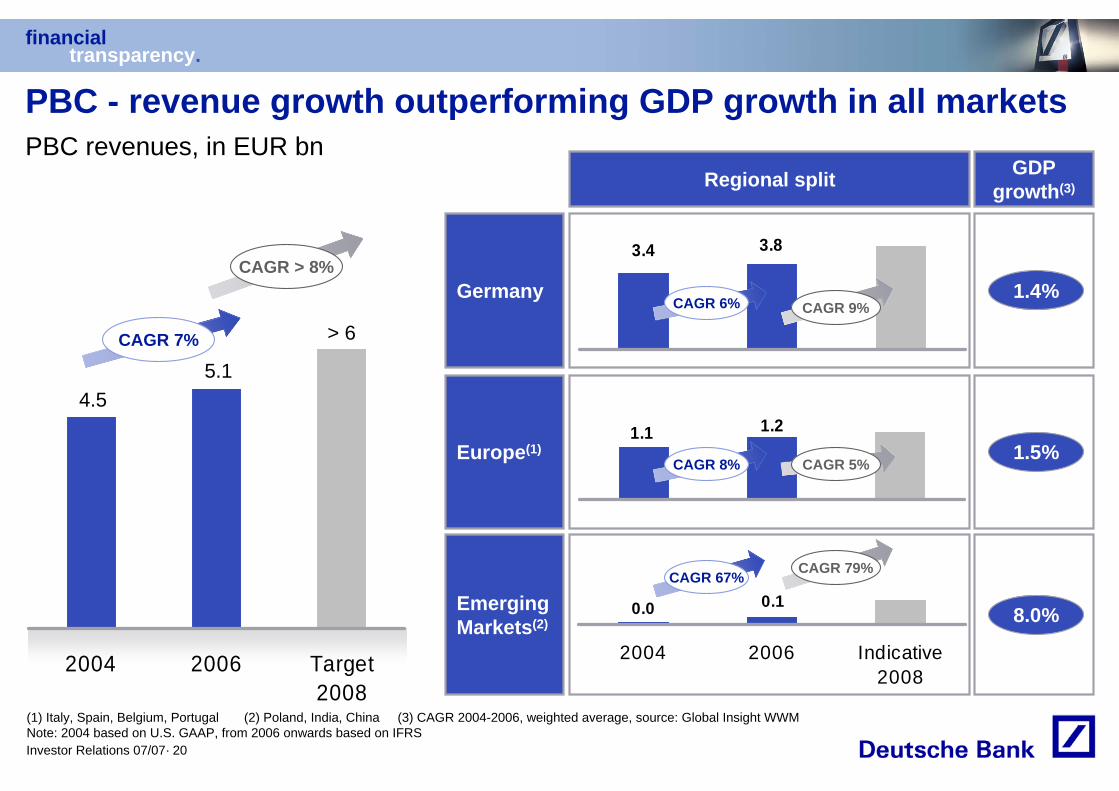
GDP growth(3)
Europe(1)
Germany
EmergingMarkets(2)
PBC - revenue growth outperforming GDP growth in all marketsPBC revenues, in EUR bn
2004 2006 Target2008
CAGR 7%
(1) Italy, Spain, Belgium, Portugal (2) Poland, India, China (3) CAGR 2004-2006, weighted average, source: Global Insight WWMNote: 2004 based on U.S. GAAP, from 2006 onwards based on IFRS
Regional split
3.4 3.8
1.21.1
0.10.0
2004 2006 Indicative2008
1.4%
1.5%
8.0%
CAGR 6%
CAGR 8%
CAGR 67%
> 6
4.55.1
CAGR > 8%
CAGR 9%
CAGR 79%
CAGR 5%
financialtransparency.
Investor Relations 07/07· 21
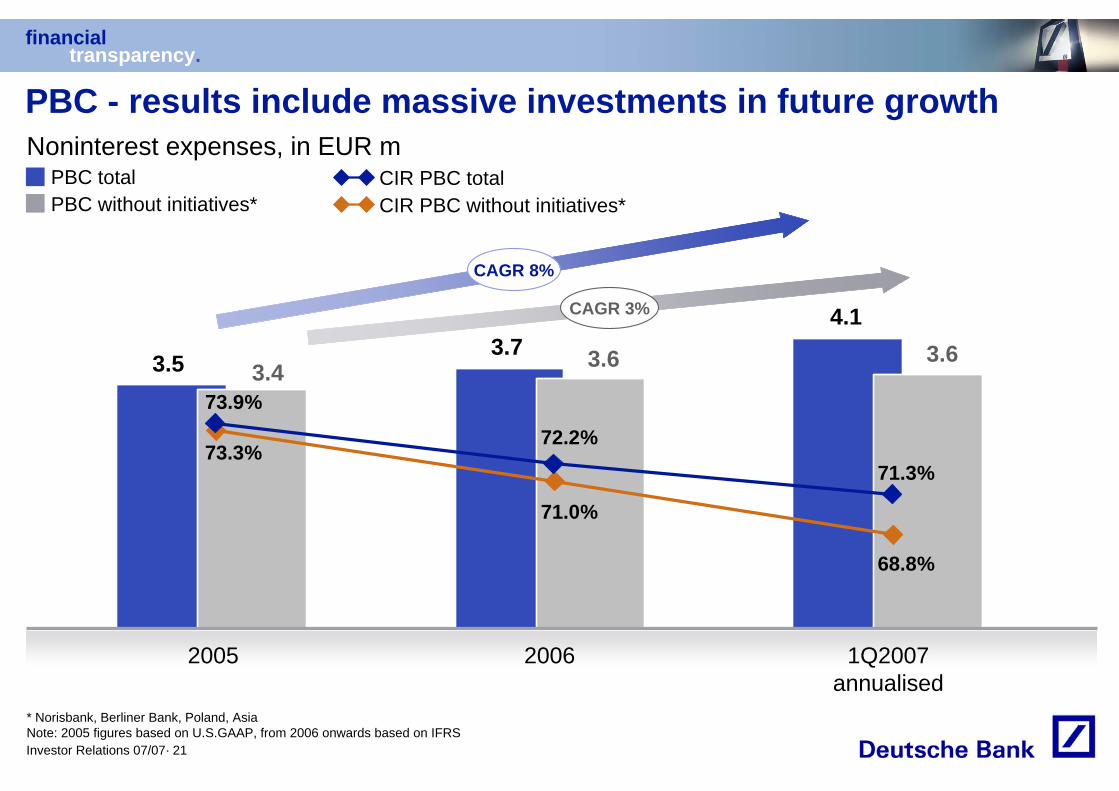
PBC - results include massive investments in future growth
1Q2007annualised
2005 2006
Noninterest expenses, in EUR m
PBC without initiatives*PBC total
CIR PBC without initiatives* CIR PBC total
* Norisbank, Berliner Bank, Poland, AsiaNote: 2005 figures based on U.S.GAAP, from 2006 onwards based on IFRS
3.53.7
4.1
3.4 3.6 3.6
CAGR 3%
73.9%
72.2%
71.3%73.3%
71.0%
68.8%
CAGR 8%
financialtransparency.
Investor Relations 07/07· 22
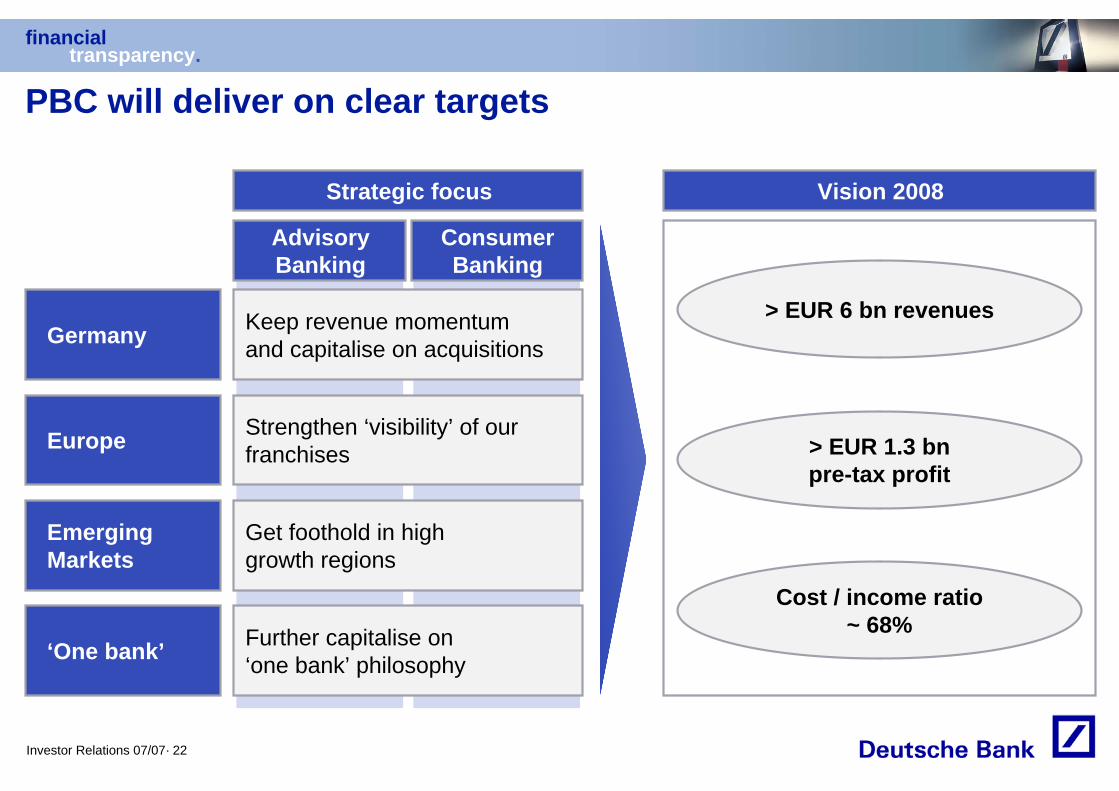
PBC will deliver on clear targets
Germany
Europe
Emerging Markets
Strategic focus Vision 2008
> EUR 6 bn revenues
> EUR 1.3 bnpre-tax profit
Cost / income ratio~ 68%
‘One bank’
AdvisoryBanking
ConsumerBanking
Keep revenue momentum and capitalise on acquisitions
Strengthen ‘visibility’ of our franchises
Get foothold in high growth regions
Further capitalise on ‘one bank’ philosophy
financialtransparency.
Investor Relations 07/07· 23
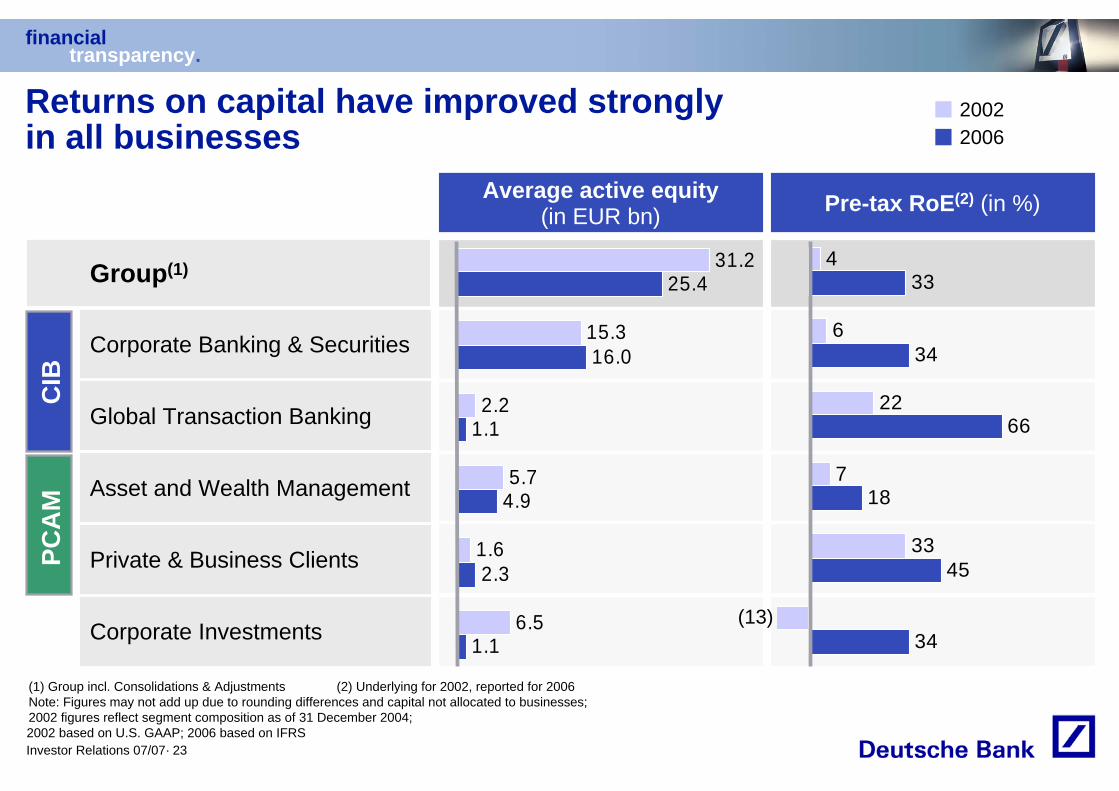
Returns on capital have improved strongly in all businesses
20022006
Corporate Banking & Securities
Global Transaction Banking
Corporate Investments
Private & Business Clients
Asset and Wealth Management
PCA
MC
IB
Average active equity (in EUR bn) Pre-tax RoE(2) (in %)
Group(1)
34
45
18
66
34
33
33
7
6
4
22
1.1
2.3
4.9
1.1
16.0
25.4
6.5
1.6
5.7
15.3
31.2
2.2
(13)
(1) Group incl. Consolidations & Adjustments (2) Underlying for 2002, reported for 2006Note: Figures may not add up due to rounding differences and capital not allocated to businesses; 2002 figures reflect segment composition as of 31 December 2004;2002 based on U.S. GAAP; 2006 based on IFRS
financialtransparency.
Investor Relations 07/07· 24
Agenda
1 Outstanding performance
2 Strengthened strategic positions
3 Phase 3 of our Management Agenda
financialtransparency.
Investor Relations 07/07· 25
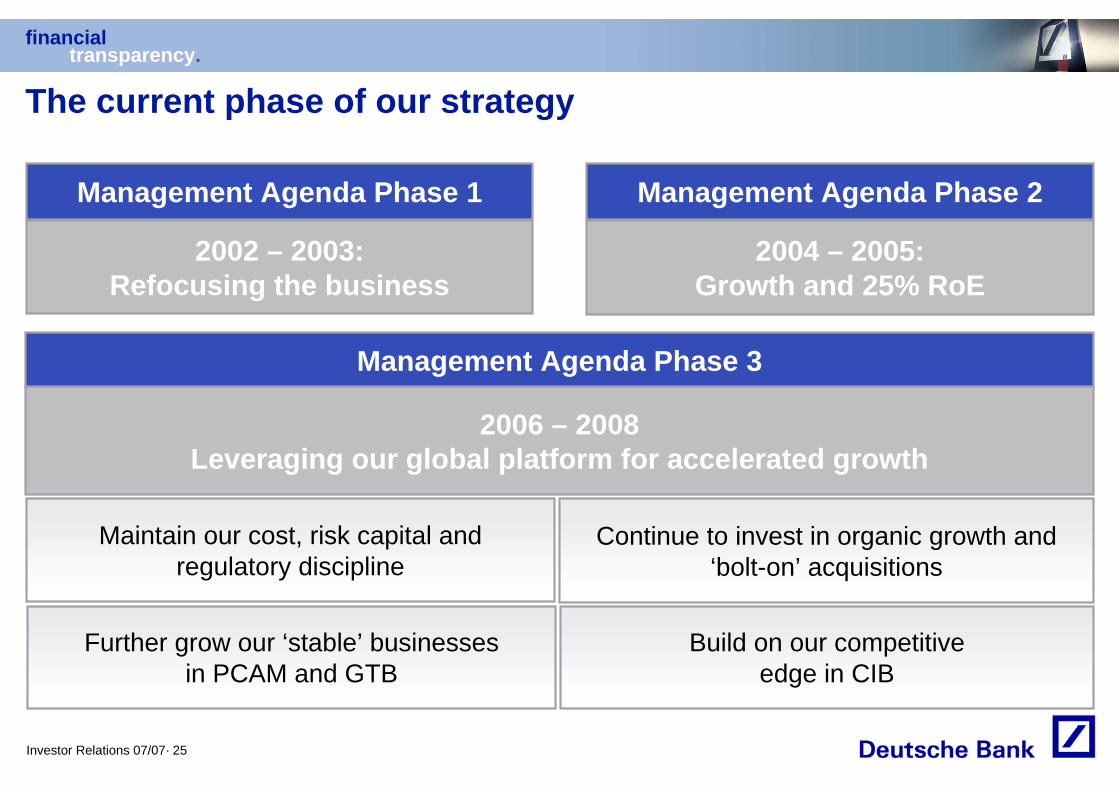
The current phase of our strategy
Management Agenda Phase 3
2006 – 2008Leveraging our global platform for accelerated growth
Management Agenda Phase 1 Management Agenda Phase 2
2002 – 2003:Refocusing the business
2004 – 2005:Growth and 25% RoE
Maintain our cost, risk capital and regulatory discipline
Continue to invest in organic growth and ‘bolt-on’ acquisitions
Further grow our ‘stable’ businesses in PCAM and GTB
Build on our competitiveedge in CIB
financialtransparency.
Investor Relations 07/07· 26
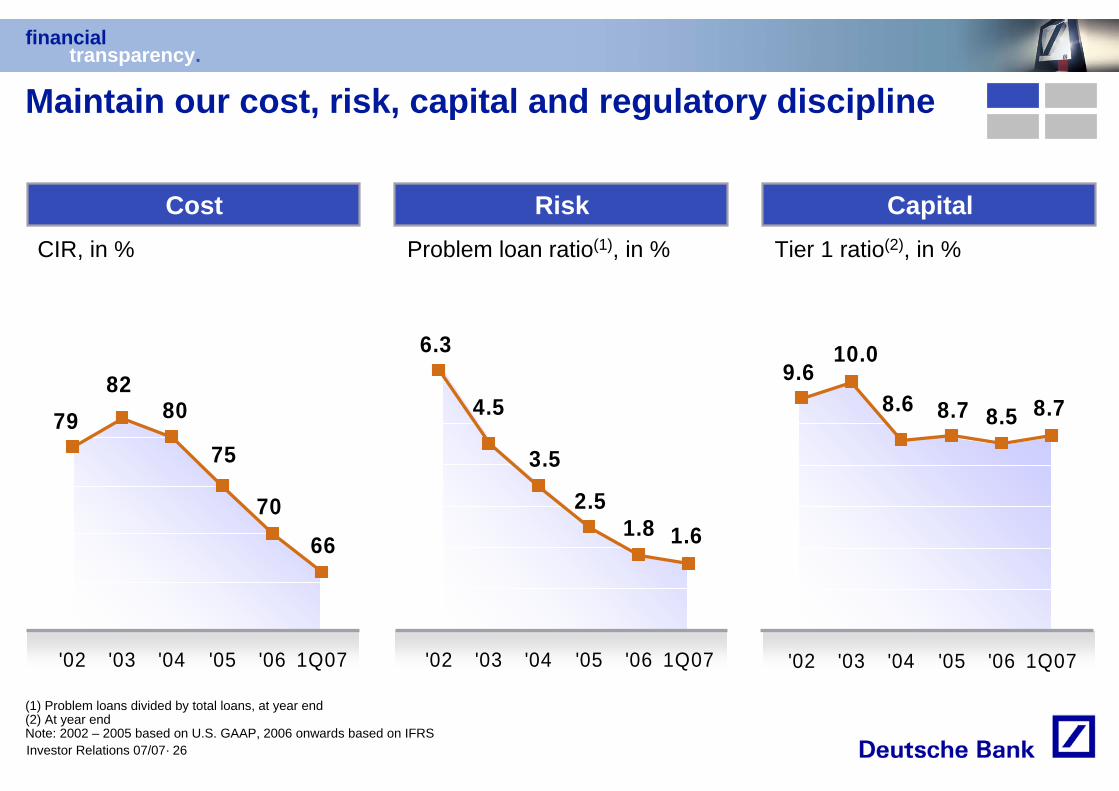
6670
8279 80
75
'02 '03 '04 '05 '06 1Q07
1.61.8
4.5
6.3
3.5
2.5
'02 '03 '04 '05 '06 1Q07
8.78.5
10.09.6
8.6 8.7
'02 '03 '04 '05 '06 1Q07
Maintain our cost, risk, capital and regulatory discipline
Cost Risk Capital
(1) Problem loans divided by total loans, at year end(2) At year endNote: 2002 – 2005 based on U.S. GAAP, 2006 onwards based on IFRS
Tier 1 ratio(2), in %CIR, in % Problem loan ratio(1), in %
financialtransparency.
Investor Relations 07/07· 27
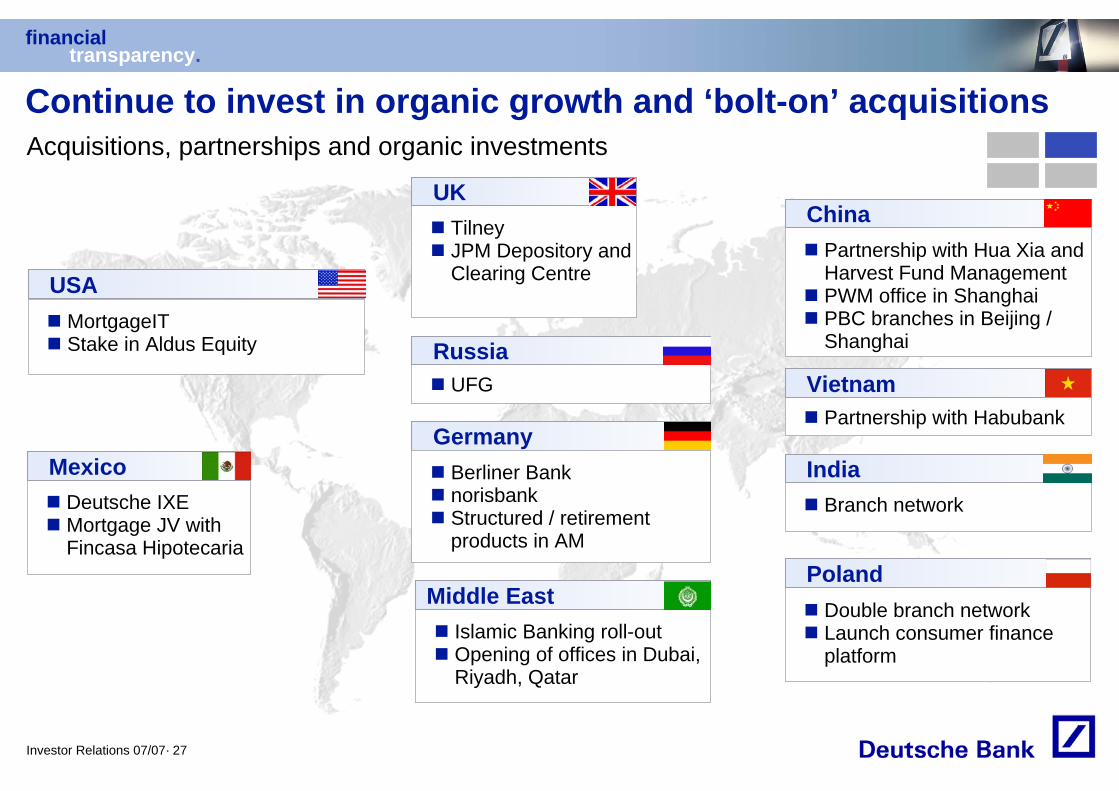
Continue to invest in organic growth and ‘bolt-on’ acquisitionsAcquisitions, partnerships and organic investments
MortgageITStake in Aldus Equity
USA
Deutsche IXEMortgage JV with Fincasa Hipotecaria
Mexico
UFGRussia
TilneyJPM Depository and Clearing Centre
UK
Partnership with Hua Xia and Harvest Fund ManagementPWM office in ShanghaiPBC branches in Beijing / Shanghai
China
GermanyBerliner BanknorisbankStructured / retirement products in AM
Islamic Banking roll-outOpening of offices in Dubai, Riyadh, Qatar
Middle East
Branch network
India
Partnership with HabubankVietnam
Double branch network Launch consumer finance platform
Poland
financialtransparency.
Investor Relations 07/07· 28
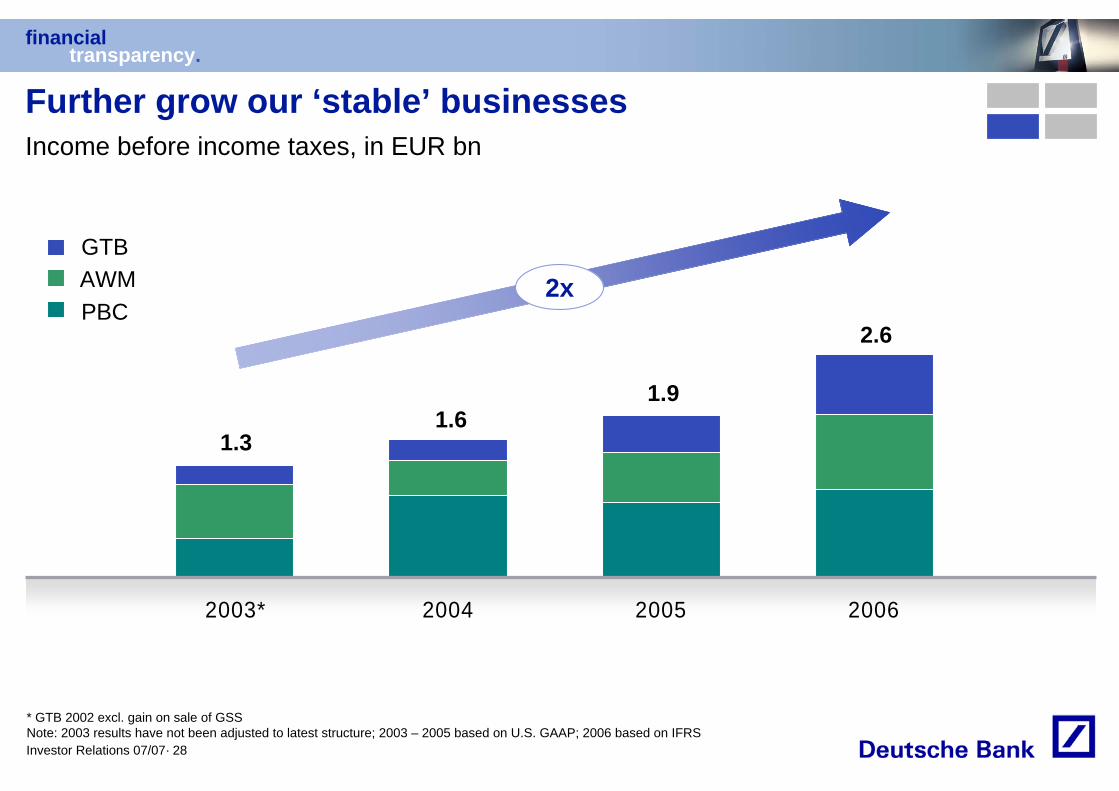
2003* 2004 2005 2006
* GTB 2002 excl. gain on sale of GSSNote: 2003 results have not been adjusted to latest structure; 2003 – 2005 based on U.S. GAAP; 2006 based on IFRS
Further grow our ‘stable’ businessesIncome before income taxes, in EUR bn
1.31.6
1.9
2.6
GTB
PBCAWM 2x
financialtransparency.
Investor Relations 07/07· 29
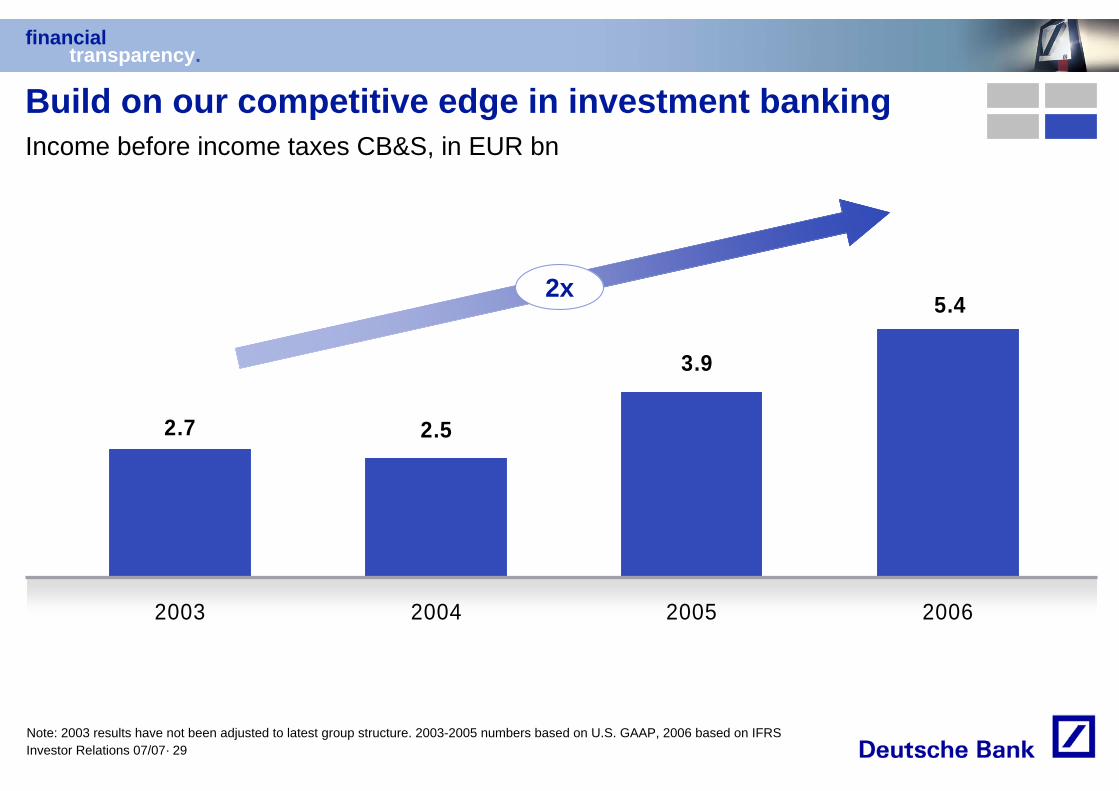
5.4
3.9
2.52.7
2003 2004 2005 2006
Build on our competitive edge in investment banking
Note: 2003 results have not been adjusted to latest group structure. 2003-2005 numbers based on U.S. GAAP, 2006 based on IFRS
Income before income taxes CB&S, in EUR bn
2x
financialtransparency.
Investor Relations 07/07· 30
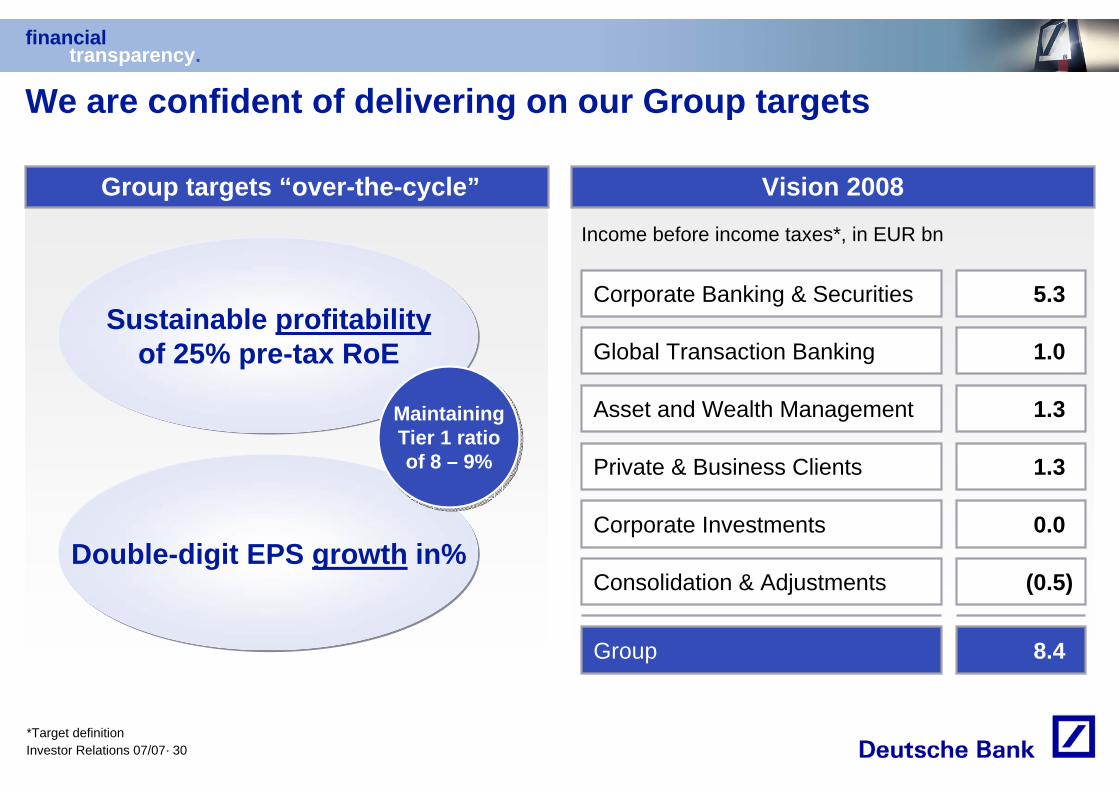
We are confident of delivering on our Group targets
Double-digit EPS growth in%
Sustainable profitabilityof 25% pre-tax RoE
MaintainingTier 1 ratioof 8 – 9%
MaintainingTier 1 ratioof 8 – 9%
1.3
1.3
(0.5)
5.3
1.0
0.0
8.4
Asset and Wealth Management
Private & Business Clients
Consolidation & Adjustments
Corporate Banking & Securities
Global Transaction Banking
Corporate Investments
Group
Group targets “over-the-cycle” Vision 2008
Income before income taxes*, in EUR bn
*Target definition
financialtransparency.
Investor Relations 07/07· 31
Cautionary statementsUnless otherwise indicated, the financial information provided herein has been prepared under the International Financial Reporting Standards (IFRS). It may be subject to adjustments based on the preparation of the full set of financial statements for 2007. The segment information is based on IFRS 8: ‘Operating Segments’. IFRS 8, whilst approved by the International Accounting Standards Board (IASB), has yet to be endorsed by the European Union.
This presentation also contains forward-looking statements. Forward-looking statements are statements that are not historical facts; they include statements about our beliefs and expectations and the assumptions underlying them. These statements are based on plans, estimates and projections as they are currently available to the management of Deutsche Bank. Forward-looking statements therefore speak only as of the date they are made, and we undertake no obligation to update publicly any of them in light of new information or future events.
By their very nature, forward-looking statements involve risks and uncertainties. A number of important factors could therefore cause actual results to differ materially from those contained in any forward-looking statement. Such factors include the conditions in the financial markets in Germany, in Europe, in the United States and elsewhere from which we derive a substantial portion of our trading revenues, potential defaults of borrowers or trading counterparties, the implementation of our management agenda, the reliability of our risk management policies, procedures and methods, and other risks referenced in our filings with the U.S. Securities and Exchange Commission. Such factors are described in detail in our SEC Form 20-F of 27 March 2007 on pages 9 through 15 under the heading "Risk Factors." Copies of this document are readily available upon request or can be downloaded from www.deutsche-bank.com/ir.
This presentation contains non-IFRS financial measures. For a reconciliation to directly comparable figures reported under IFRS refer to the 1Q2007 Financial Data Supplement, which is accompanying this presentation and available on our Investor Relations website at www.deutsche-bank.com/ir.