deutsche bank media, telecom & business services … · experienced management team with a...
TRANSCRIPT

0 © 2017 On Assignment, Inc. All rights reserved.
Deutsche Bank
Media, Telecom & Business Services Conference
March 2018
Peter Dameris, CEO
Ted Hanson, President

1 © 2017 On Assignment, Inc. All rights reserved. 1
Safe Harbor
This presentation contains “forward-looking statements” within the meaning of Section 21E of the
Securities Exchange Act of 1934, as amended, and involve a high degree of risk and uncertainty.
Forward-looking statements include statements regarding the Company's anticipated future
financial and operating performance. All statements in this presentation, other than those setting
forth strictly historical information, are forward-looking statements. Forward-looking statements
are not guarantees of future performance, and actual results might differ materially. In particular,
the Company makes no assurances that estimates of revenues, gross margin, SG&A, Adjusted
EBITDA, cash flow and other financial metrics will be achieved. Further, the Company makes no
assurances or guarantees: i) that the announced transaction with ECS Federal, LLC will be
completed; ii) that the assumptions made in determining the value of the transaction will be
realized; iii) that the Company will be able to finance the potential transaction; or iv) that 2018
preliminary financial estimates for ECS will be realized. Factors that could cause or contribute to
such differences include actual demand for our services, our ability to attract, train and retain
qualified staffing consultants, our ability to remain competitive in obtaining and retaining staffing
clients, the availability of qualified temporary and permanent placement professionals,
management of our growth, continued performance of our enterprise-wide information systems,
and other risks detailed from time to time in our reports filed with the Securities and Exchange
Commission, including our Annual Report on Form 10-K for the year ended December 31, 2017,
as filed with the SEC on March 1, 2018. We specifically disclaim any intention or duty to update
any forward-looking statements contained in this presentation.
Fin
ancia
ls
Addre
ssable
Mark
et
Overv
iew
1
1

2 © 2017 On Assignment, Inc. All rights reserved.
Positioned to Capitalize on $150B Market
Large and Growing Provider of Professional / IT Services via
Contingent Labor/Shared Delivery Model
Differentiated Platform Featuring IT, Digital, Creative,
Engineering and Scientific Skill Sets
Attractive Financial Characteristics – Strong Operating
Margins and Substantial Free Cash Flow Generation
Rate of Adoption of the contingent labor/shared
delivery model continues to expand
Experienced Management Team with a Proven
Track Record to Execute On Assignment’s Growth
Strategy
1
2
3
4
5
6
Key investment highlights
2
Fin
ancia
ls
Addre
ssable
Mark
et
Overv
iew

3 © 2017 On Assignment, Inc. All rights reserved.
77.6%
22.4%
APEX
LTM Revenues: $2.04 billion
Gross Margin: 29.8%
OXFORD
LTM Revenues: $589 million
Gross Margin: 41.4%
1 LTM as of December 31, 2017. 2 As of Q4 2017.
Large and Growing Provider of Professional Services
Broad Capabilities • ASGN’s Professional Services and Staffing Solutions
capabilities delivers IT, Creative, Digital, Engineering and
Scientific talent to our clients via a flexible labor pool
• “Light deliverable” model involves shared responsibility
between the service provider and the customer
Established Footprint • 2,505 staffing consultants in 156 branch offices in North
America and Europe2
• Delivers fast, quality sales and fulfillment services
Large and Growing End Markets • The U.S. market for Professional / IT Services, including
staffing, measures ~$275B
• Via ASGN’s Contingent Labor/Shared Delivery model,
addressable market ~ $150B
Attractive Business Model • High operating efficiency with strong conversion of free cash
flow
• One of the highest gross margins in the staffing industry –
32.4%1
• Professional Services Solutions deliver highly attractive
financial characteristics compared with staffing solutions
LTM
REVENUES:
$2.63 Billion1
GROSS MARGIN:
32.4%1
3
Fin
ancia
ls
Addre
ssable
Mark
et
Overv
iew

4 © 2017 On Assignment, Inc. All rights reserved.
Technology & Other
Clinical / Scientific
Telecommunications
Healthcare / Pharmaceuticals
IndustrialA&D / Gov't / Business Services
Financial
Digital / Creative
SEGMENT KEY STATISTICS2
Average # of Customers: 3,613
Average Bill Rate: $57
Top 10 Customers as a % of Revenues: 26.5%
Geographic Footprint
U.S. and Canada
Provides mission critical IT skill sets
• 200+ National Accounts with a presence in 65 markets
• Service clients in IT, business services, financials,
healthcare, pharmaceuticals, government services, consumer
industrials and telecommunications industries
• Approximately 13,500 contract professionals at ~770 clients
• Average bill rate of $61 an hour
Provides scientific skill sets • Service clients in the biotechnology, pharmaceutical, food &
beverage, medical devices, personal care, chemical,
automotive, educational and environmental industries
• Approximately 2,200 contract professionals at ~600 clients
• Average bill rate of $33 an hour
Provides creative/digital professionals
• Supports creative and marketing departments for over 200 of
the Fortune 1000 listed companies
• Large, attractive end markets; spans virtually all industries
including retail, financial services, automotive, entertainment &
leisure, and consumer
• Approximately 3,500 contract professionals at ~2,300 clients
• Average bill rate of $63 an hour
1 LTM as of December 31, 2017.
2 As of Q4 2017.
APEX Segment Overview
LTM
REVENUES:
$2.04 Billion1
GROSS MARGIN:
29.8%1
4
Fin
ancia
ls
Addre
ssable
Mark
et
Overv
iew

5 © 2017 On Assignment, Inc. All rights reserved.
Enterprise Applications
IT Infrastructure
SW/HW
Engineering
Reg & Comp
Clinical/Scientific
Healthcare Technology
Permanent Placement
LTM
REVENUES:
$589 Million1
GROSS MARGIN:
41.4%1
SEGMENT KEY STATISTICS2
Average # of Customers: 1,036
Average Bill Rate: $101
Top 10 Customers as a % of Revenues: 10.7%
Geographic Footprint
U.S. and Europe
Provides high-end IT & engineering professionals • Minimal client and industry business concentration; no customer
accounts for more than 3% of sales
• Significantly higher success rate filling engagements than
competitors
• Average bill rate of $117 per hour
Provides permanent placement staffing • Dedicated perm placement practice with automated client
generation, lead distribution, and candidate sourcing supported
by global cloud solution
• 2.6 million opt-in recipients of job alerts
• 960,000 website visitors per month
• 230,000 web-based job applications received per month
Provides clinical & scientific skill sets in Europe • Chemists, clinical research associates, clinical lab assistants,
engineers, biologists, biochemists, microbiologists, and other
skilled scientific professionals
• European operations in the Netherlands, Belgium, Spain and
U.K.
• Approximately 500 contract professionals at ~200 clients
• Average bill rate of $49 an hour
1 LTM as of December 31, 2017.
2As of Q4 2017.
OXFORD Segment Overview
5
Fin
ancia
ls
Addre
ssable
Mark
et
Overv
iew

6 © 2017 On Assignment, Inc. All rights reserved.
Our 2,505 staffing consultants in 156 branch offices provide staffing solutions for
in-demand, skilled talent
Established Domestic Footprint with Significant Scale
6
Fin
ancia
ls
Addre
ssable
Mark
et
Overv
iew

7 © 2017 On Assignment, Inc. All rights reserved.
In our pursuit of “talent for the digital worldTM” On Assignment is positioned to continue as a highly respected and
highly profitable organization. Our strategic advantage not only comes from our 30 years of experience and
connections, but also from our unmatched ability to provide what companies need most, today and in the future
– the right people, with the right skills.
7
Experienced Management Team A Proven Track Record to Execute On Assignment’s Growth Strategy
Peter Dameris CEO 20 years in industry 14 years with ASGN
Ted Hanson President, On Assignment 17 years in industry 5 years with ASGN
Rand Blazer President, Apex Systems 32 years in industry 5 years with ASGN
Edward Pierce Executive VP & CFO 16 years CFO experience 11 years with ASGN
James Brill Senior VP, CAO & Treasurer 24 years CFO experience 11 years with ASGN
Fin
ancia
ls
Addre
ssable
Mark
et
Overv
iew

8 © 2017 On Assignment, Inc. All rights reserved. 8
1992
On Assignment initial
public offering
2007
Expanded into Professional Temporary IT Staffing Solutions
• Acquired Oxford
• Generating $50 Million in FCF
2012
Comprehensive Temporary IT Staffing Provider
• Acquired Apex Systems
• Generating $700 Million Revenue
• Achieved $1 Billion in Sales
• On Assignment transfers from NASDAQ to NYSE
2015
Professional Digital/Creative Solutions
• Acquired Creative Circle
2004
Comprehensive Scientific Staffing
Provider
• Peter Dameris appointed CEO
• Implemented Revitalization Plan
8
A History Of Persistent Growth
Scientific Staffing
Professional / IT
Services Focus
2013
Expanded Permanent IT
Staffing capabilities
• Acquired CyberCoders
Expanded Staffing
Solutions 1985
On Assignment Founded
2011
Expanded Pharmaceutical
Staffing capabilities
• Acquired Valesta
2017
Expanded Clinical/Scientific
Staffing capabilities
• Acquired Stratacuity
2018
Entrance into the Government
Services sector
• Acquires ECS Federal
8 8

9 © 2017 On Assignment, Inc. All rights reserved. 9
Go-To-Market Strategy
DELIVERY MODELS RESPONSIBILITY FOR PROJECT OVERSIGHT
DELIVERABLES ASSIGNED TO SERVICE PROVIDER COST OF USING SERVICE PROVIDER
Staff Augmentation
Statement of Work
Professional Services
Staff Augmentation Statement of Work Professional Services
Customer Service Provider & Customer
Service Provider
Statement of Work Professional Services
Low
Medium
Highest None
Heavy to many
Staff Augmentation
TOTAL ADDRESSABLE MARKET
$150B
ESTIMATED MARKET SIZE Staffing and Professional Services (IT, Engineering, Creative and Scientific)
ASGN ADDRESSABLE MARKET
Temporary Staffing On Assignment Model Professional Services
$50B1 100B2
$275B
Staffing & Professional Services Overview
+ = $150B
1 Staffing Industry Analysts (September 2017) 2 IBISWorld, AdAge and third party independent research
Offshore
None
Moderate to few
Heavy to many
Heavy to many
9
Staff Augmentation Contingent labor pool
Statement of Work Contingent labor pool
Professional / Consulting Full time employees
Offshore Full time employees located outside the US
Fin
ancia
ls
Addre
ssable
Mark
et
Overv
iew

10 © 2017 On Assignment, Inc. All rights reserved.
ASGN SERVICE OFFERINGS
“With over 30 years in industry, our strong position as an
experienced leader in technology, life sciences and creative solutions
is a key differentiator for On Assignment.”
Peter T. Dameris
CEO
IT
$31 Billion
Clinical
/Scientific
$2.5 Billion
Creative /
Marketing
$8.5 Billion2 Engineering
$8 Billion
ASGN Operates In The Most Attractive End Markets
2017 Estimated Market Size1,2
1 Staffing Industry Analysts Insight: Staffing Industry Forecast (September 2017). 2 3rd party independent research.
IT
Clinical / Scientific
Digital / Creative
IT
Engineering
Clinical / Scientific
Perm Placement
Professional /
IT
Services
$100 Billion2
(addressable)
ADDRESSABLE MARKET SIZE
Fin
ancia
ls
Addre
ssable
Mark
et
Overv
iew
10
11 © 2017 On Assignment, Inc. All rights reserved.
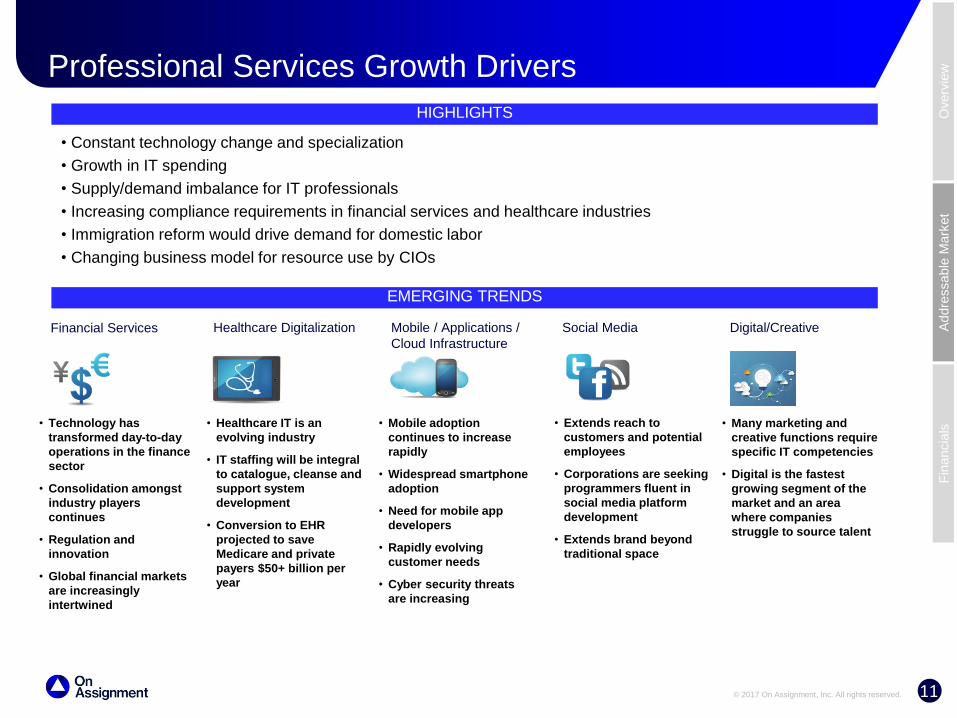
HIGHLIGHTS
Professional Services Growth Drivers
• Constant technology change and specialization
• Growth in IT spending
• Supply/demand imbalance for IT professionals
• Increasing compliance requirements in financial services and healthcare industries
• Immigration reform would drive demand for domestic labor
• Changing business model for resource use by CIOs
Financial Services
Healthcare Digitalization
Mobile / Applications /
Cloud Infrastructure
Social Media
Digital/Creative
• Technology has
transformed day-to-day
operations in the finance
sector
• Consolidation amongst
industry players
continues
• Regulation and
innovation
• Global financial markets
are increasingly
intertwined
• Healthcare IT is an
evolving industry
• IT staffing will be integral
to catalogue, cleanse and
support system
development
• Conversion to EHR
projected to save
Medicare and private
payers $50+ billion per
year
• Mobile adoption
continues to increase
rapidly
• Widespread smartphone
adoption
• Need for mobile app
developers
• Rapidly evolving
customer needs
• Cyber security threats
are increasing
• Extends reach to
customers and potential
employees
• Corporations are seeking
programmers fluent in
social media platform
development
• Extends brand beyond
traditional space
• Many marketing and
creative functions require
specific IT competencies
• Digital is the fastest
growing segment of the
market and an area
where companies
struggle to source talent
EMERGING TRENDS
11
Fin
ancia
ls
Addre
ssable
Mark
et
Overv
iew

12 © 2017 On Assignment, Inc. All rights reserved. 12
31%
6%6%
23%
35%
The “Sharing Economy”
Contingent labor1 is a significant & growing portion of the U.S. workforce
From 2015 to 2017, the number of diversified workers has increased from 14.1 mm to
19.8 mm professionals, largely due to increased participation in the “sharing economy”.
36% of the 2017 U.S. workforce
57m represent
1Contingent labor is defined as individuals who have engaged in supplemental, temporary, project – or contract-based work within the past 12 months.
Source: “Freelancing in America,” an online survey of U.S. adults who have done paid work in the past 12 months. Commissioned by Freelancer’s Union and Upwork and
conducted by independent research firm Edelman Berland.
Independent Contractors
Don’t have an employer…
do freelance, temporary,
or supplemental work on a
project-by-project basis 17.7m people
Moonlighters
Professionals with a primary,
traditional job who also moonlight 13.0m
Freelance Business Owners
Business owners with
1 employees 3.4m people
Temporary Workers
Single employer, client, job,
or contract project where
employment is temporary 3.4m
Diversified Workers
Multiple sources of
income; mix of traditional
and freelance work 19.8m
Fin
ancia
ls
Addre
ssable
Mark
et
Overv
iew
12

13 © 2017 On Assignment, Inc. All rights reserved.
Fractionalization of Human Capital: Staffing Firms vs. Independent Freelancers
Advantages of utilizing staffing agencies
• Firms are best able to leverage the source of quality
consultants with the skills, experience and pay rate that
meets clients’ needs
• Firms can ensure compliance with federal and state
employment laws, thereby freeing clients from the risks
associated with hiring contingent labor directly
• Avoid employee misclassification and reduce the risk
of lawsuits challenging the classification of a group of
workers paid on a 1099 basis
• Enhance security by delivering vetted technical resources
that can present reliable work backgrounds
• Savings:
• Time. Firms hours cover finding consultants and
screening them as well as processing payroll,
benefits and taxes
• Cost Reduction. Firms finance the bulk of recruitment
processes and pay most fees for background checks
10-Year Plan:
Buyers’ plan for various types of labor force
1 Source: Staffing Industry Analysts 2017 Report
By working with a trustworthy staffing firm, companies (buyers) can reduce time, cost and risk – and
take advantage of top talent that meets all compliance requirements
Net
Increase-Decrease1
Outsourced Workers 41%
SOW Consultants 39%
Freelancers 32%
Agency Temporary Workers 23%
Internal Temporary Workers 13%
Independent Contractors 9%
Part-time Employees 7%
Full-time Employees -24%
N=180
13
Fin
ancia
ls
Addre
ssable
Mark
et
Overv
iew

14 © 2017 On Assignment, Inc. All rights reserved.
Net benefit to U.S. IT Staffing Industry
• Increases demand for domestic labor
• Increase in bill rates and pay rates
• Staff augmentation delivery/deployment
model gains market share from offshore
companies
Evolving Labor Landscape
• Modify lottery to a merit-based system
• Longer turn processing
• Scrutinize offshore IT service companies
• Inspect companies with more than 15%
of workforce on visas
Source: “Freelancing in America,” an online survey of 7,107 U.S. adults who have done paid work in the past 12 months. Commissioned by Freelancer’s Union and
Upwork and conducted by independent research firm Edelman Berland from July 30 to August 14, 2015.
CONTINGENT LABOR1 IS A SIGNIFICANT & GROWING PORTION OF THE U.S. WORKFORCE
• 54 million people, representing 34% of the 2015 U.S. workforce
• From 2014 to 2015, the number of diversified workers has increased from 9.3 mm to 14.1 mm
professionals, largely due to increased participation in the “sharing economy”
Trump administration plans to discourage technology companies from hiring low-wage foreign workers; frees up H-1B
Visas for higher skilled talent
• Reduce lower IT technologists seeking
U.S. opportunities
• Push out offshore IT service companies
• Higher wages for U.S. tech employees
Root out H-1B Visa Abuse
Reduce Foreign Competition
Net benefit to U.S. IT /
Professional Services Industry
14
Fin
ancia
ls
Addre
ssable
Mark
et
Overv
iew

15 © 2017 On Assignment, Inc. All rights reserved.
Human Cloud and the Gig-Economy
The “Human Cloud” is an emerging set of online/digital platforms that enable purchasers and
talent to manage and complete work arrangements
Human Cloud companies generally: • Facilitate peer-to-peer transactions through the internet or internet-enabled devices (e.g. smartphone
“apps”)
• Rely on user-based ratings
• Offer talent flexibility in deciding working hours or times
• Typically expect talent to supply their own equipment to complete work (e.g. computer, software, car, tools,
etc.)
• Manage the relationship from sourcing through payment via the platform
Examples of such Human Cloud companies are:
15
Fin
ancia
ls
Addre
ssable
Mark
et
Overv
iew
16 © 2017 On Assignment, Inc. All rights reserved. 16
Human Cloud and the Gig-Economy
Though Human Cloud companies are frequently mentioned in the media, they pose little threat to On Assignment’s Professional services
Key Issues Affecting The Human Cloud:
• Large organizations, which make up the majority of the B2B Human Cloud, are reluctant to embrace work performed remotely
• B2B Human Cloud vendors are unable to solve multiple organizational workforce problems
• Although total Human Cloud revenue nearly doubled in size last year, much is due to a few key players in the B2C (i.e. Uber, Lyft, etc.) market rather than Human Cloud businesses as a whole
• Legal challenges around worker classification have plagued the Human Cloud market
• Personal and cyber-security issues associated with recruiting talent via the Human Cloud
• Many governments have not yet updated legislation to address the boom in the Gig-Economy
• Users of Human Cloud services are individual people unlike OA’s giant client database
• Many Human Cloud companies are not yet profitable such as Uber and Lyft
• There has been a significant drop in the number of Human Cloud companies started in the last 3 years
• Raising capital has become increasingly difficult, creating further obstructions for startups and unprofitable firms
• The total market size of the Human Cloud is a fraction of other services in the Gig-Economy and the majority of the work is performed by off-shore workers
• Cloud Labor spend is less than 0.5% of total program spend at large enterprise clients
16
Fin
ancia
ls
Addre
ssable
Mark
et
Overv
iew

17 © 2017 On Assignment, Inc. All rights reserved. 17
ECS Federal Company Overview
• ECS Federal, one of the largest privately held government services providers (82% prime contracts),
delivers cyber security, cloud, DevOps, IT modernization and advanced science and engineering solutions
• ECS has well established positions on critical IT systems of national importance which provide unmatched
customer access and unique visibility into future technology transformation initiatives
– Engagements are generally longer in duration than management consulting-led models (e.g. PwC,
McKinsey) and are among the most highly differentiated in the sector from a technical standpoint
– In some cases (e.g., NETCOM), ECS is responsible for the design, build and operation of IT systems that
have mission-critical functionality for demanding customers
– Operates four business units: 1) Mission Solutions; 2) Enterprise Solutions; 3) Cyber and Health IT;
4) Advanced Science and Engineering
– Primary capabilities include 1) Cyber Security and Infrastructure Support; 2) Agile Software Development
and Cloud Solutions; 3) Advanced Science, Engineering and Program Support
• Strong positions on critical IT systems of national importance which provide customer access and unique
visibility into future technology transformation initiatives
• ~2,300 employees with deep mission knowledge and a diverse set of domain experience as well as 1,000+
unique certifications and accreditations
– ~1,500 cleared employees
• 2017 Revenue and adjusted EBITDA of $586 million and $68 million, respectively
17 17
Fin
ancia
ls
Addre
ssable
Mark
et
Overv
iew

18 © 2017 On Assignment, Inc. All rights reserved. 18
ECS Federal Business Units
Mission Solutions Enterprise Solutions
Cyber & Health IT Advanced Science & Engineering
18
• Focuses on complex technical solutions, especially for the
Department of Defense, National Security and Intelligence
Community customers
• Particularly fixed-priced and managed service solutions
• Commercial managed cyber clients
• Top customers include US Army, US Marine Corps, US Navy,
US Air Force, DHS, Office of Secretary of Defense,
USTRANSCOM and DHA
• Strategic partnerships with industry-leading manufacturers,
providing lead generation, special pricing and integrated
delivery teams
• Delivers advanced technical solutions primarily in the civilian
sector
• Strong focus on cloud and managed service solutions
• Natural synergy with ECS’ Software Engineering and IT
Operations services
• Top customers include US Postal Office, Department of
Labor, Health and Human Services, DoJ / FBI, Department of
Energy, General Accounting Office and Department of
Agriculture
• Key partnerships with Microsoft, AWS, IBM and Gimmal
• Delivers high-quality personnel that provide first-class
engineering, information technology and program analysis
support to Department of Defense and federal civilian
programs
• Works closely with the government’s own engineering and
acquisition staff members to advance their respective
missions
• Delivers high-performance, high-fidelity radar cross section
systems and flight termination systems
• Top customers include US Army, Missile Defense Agency,
EPA, US Navy and NOAA
• Focuses on end-to-end cyber security design, engineering,
deployment and sustainment
• Capabilities include cyber engineering, network engineering
and enterprise solutions and engineering & deployment
• Top customers include Defense Health Agency, Space &
Naval Warfare Systems Center Atlantic and Navy Bureau of
Medicine and Surgery
• Global infrastructure supports 220,000+ users and over 700
facilities worldwide
18
Fin
ancia
ls
Addre
ssable
Mark
et
Overv
iew

19 © 2017 On Assignment, Inc. All rights reserved. 19
ECS Federal Capabilities
Cyber Security &
Infrastructure Support
Agile Software Development
& Cloud Solutions
Advanced Science, Engineering
& Program Support
• Delivers advanced cyber security
services and solutions to US public
sector, Department of Defense and
Fortune 500
• Architect and deploy advanced
endpoint Security-as-a-Service
solutions
• Provides application and infrastructure
support to worldwide systems
• Provides Continuous Diagnostics of
Mitigation for Department of Homeland
Security and .gov domains and
performs advanced security,
engineering, assessments and
authorizations
• 643 billable employees
• Recognized cloud solutions leader
deploying cloud solutions across the
AWS and Microsoft Azure / Office 365
platforms within both US public sector
and commercial markets
• Develops artificial intelligence to
sense, detect, identify, track and
geolocate high-value targets
• Develops mission critical enterprise-
level solutions using agile and
development operations
methodologies
• Performs agency-wide migration of
data and operations to the cloud
• 644 billable employees
• Advanced engineering services,
including systems integration, analysis
for NextGen weapons systems and
ship, aircraft and drone design and
maintenance
• Delivers high-performance, high-
fidelity radar cross-section systems,
flight termination systems and
classified solutions
• Delivering the first Flight Termination
System upgrade at the Department of
Defense’s largest missile range
• Supports shipbuilding and marine
operations
• 834 billable employees
$196 Million 2017E Revenue
$236 Million 2017E Revenue
$154 Million 2017E Revenue
19 19
Fin
ancia
ls
Addre
ssable
Mark
et
Overv
iew

20 © 2017 On Assignment, Inc. All rights reserved.
Compelling Strategic Combination
ECS provides a comprehensive platform to expand into the broader IT services market
and is aligned to robust and growing areas of the federal budget
• Improving outlook for increased spending in defense and not operating under continuing resolutions
• Government revenue base tends to be more resistant to downturns, especially in the areas ECS focuses
on, mitigating On Assignment’s risk during a correction in the economy
• Past performance and certifications allow for bids on large, complex, competitive long-term contracts as
well as the ability to capture limited competition procurements, providing ample room for growth
• Strong platform in a highly fragmented market with a number of extremely small players
ECS’ capabilities complement and elevate On Assignment’s highly technical IT offerings
• Diversifies On Assignment’s client base into the large and attractive federal government end market
• Adds talented workforce with over ~1,500 cleared employees with deep technical and domain expertise
that reinforce On Assignment’s positioning as a “premium” human capital provider
• Combination with On Assignment enhances ECS’ long-term expansion strategy into the private sector as
well as other areas of the federal government, such as intelligence and homeland security
20 20
Fin
ancia
ls
Addre
ssable
Mark
et
Overv
iew

21 © 2017 On Assignment, Inc. All rights reserved.
Contingent Labor$50
IT & Professional
Services$100
Federal Civilian IT & Professional
Services$65
Federal Defense IT & Professional
Services$64
ECS Significantly Expands Addressable Market
Entry into Federal IT and professional services demonstrates On Assignment’s
commitment to executing domestic, non-commodity technology services opportunities
• Provides On Assignment with access to the ~$129 billion Federal IT and professional services sector
• The Federal IT & Professional Services sector consists of both Civilian and Defense and is estimated to be
$65 and $64 billion, respectively in 2018 and is larger than On Assignment’s markets
• Nearly doubles On Assignment’s addressable market to $279 billion and ECS’ highly specialized skill sets
reinforce the Company’s positioning as a premium human capital provider and complements its highly
technical IT offerings
21
Current Addressable Market Pro Forma Addressable Market
Note: Staffing includes the IT/Engineering, Creative/Marketing and Clinical/Scientific markets
Source: Staffing Industry Analysts (September 2017), IBIS World, AdAge and third party independent research
TAM: $150 Billion
($ in Billions)
TAM: $279 Billion
($ in Billions)
New
Addressable
Market
IT & Professional
Services$100
Contingent Labor$50
21
Fin
ancia
ls
Addre
ssable
Mark
et
Overv
iew

22 © 2017 On Assignment, Inc. All rights reserved.
On Assignment & ECS Federal – A Unique Combination
22
55,4001
Contract
Employees
14,500 Clients
156 Branch Offices
$129 Billion End Market
82% Prime Contract
Revenue
$150 Billion End Market
$2.6 Billion 2017 Revenue
3,800 Internal
Employees
• On Assignment and ECS Federal will create a unique platform, offering an integrated suite of human capital solutions and
expertise in the IT & Professional Services sector
• ECS Federal has developed long relationships with key Government contractors. With On Assignment’s ability to find
cleared personnel, ECS will enhance positioning for upcoming contract bids and recompetes
– One of the largest inhibitors of growth in the Federal services sector is timely finding and placing technical talent.
Therefore, On Assignment’s recruiting capabilities will enhance ECS’ performance and value proposition versus
Government services peers
– On Assignment has 22,000+ contract professionals on billing on a daily basis; ~1,400 currently cleared
• ECS Federal has developed differentiated expertise in highly transferable domains that would be applicable for On
Assignment’s Fortune 1000 client base
– Given the increased frequency and complexity, cyber security, for instance, is a top Fortune 1000’s technology priority
– ECS’ domain expertise and first-hand experience are invaluable and will position the combined company well to support
commercial engagements in cyber security, artificial intelligence and biometrics
~2,300 Highly Skilled
Employees
$586 Million 2017E Revenue
$1.6 Billion Total Backlog
$9.8 Billion Opportunity Pipeline
(Unfactored)
1 Total number of contract professionals placed on assignment during each year that are considered employees; this number does not include employees of our subcontractors
22
Fin
ancia
ls
Addre
ssable
Mark
et
Overv
iew

23 © 2017 On Assignment, Inc. All rights reserved.
Financials
Fin
ancia
ls
Addre
ssable
Mark
et
Overv
iew
23

24 © 2017 On Assignment, Inc. All rights reserved.
Summary Operating Results
1 Adjusted EPS, a non-GAAP measurement, is calculated by adjusting GAAP EPS for (i) after-tax acquisition, strategic planning and integration expenses and (ii)
amortization of identifiable intangible assets.
2 Does not include the “Cash Tax Savings on Indefinite-lived Intangible Assets.” These savings total $6.8 million each quarter, or $0.13 per diluted share, and represent the
economic value of the tax deduction that we receive from the amortization of goodwill trademarks.
Fin
ancia
ls
Addre
ssable
Mark
et
Overv
iew
(In thousands, except per share amounts) Quarter Ended December 31, LTM Ended December 31,
2017 2016 Chg. 2017 2016 Chg.
Revenues:
Assignment 647,446 591,958 9.4% 2,496,314 2,312,270 8.0%
Permanent Placement 31,589 28,925 9.2% 129,610 128,143 1.1%
679,034$ 620,884$ 9.4% 2,625,924$ 2,440,413$ 7.6%
Gross profit 220,677 198,195 11.3% 850,073 795,183 6.9%
SG&A expenses 151,447 142,630 6.2% 591,893 565,829 4.6%
Amortization of intangible assets 8,433 9,710 -13.2% 33,444 39,628 -15.6%
Income from continuing operations:
GAAP 67,377 24,060 180.0% 157,874 97,196 62.4%
Adjusted1,2
75,977 34,296 121.5% 193,832 139,570 38.9%
Diluted earnings per common share:
GAAP 1.28$ 0.45$ 184.4% 2.97$ 1.81$ 64.1%
Adjusted1,2
1.44$ 0.64$ 125.0% 3.64$ 2.60$ 40.0%
Adjusted EBITDA2
82,946 70,725 17.3% 311,436 285,033 9.3%
Margins:
Gross 32.5% 31.9% 0.6% 32.4% 32.6% -0.2%
SG&A expenses 22.3% 23.0% -0.7% 22.5% 23.2% -0.6%
Adjusted EBITDA 12.2% 11.4% 0.8% 11.9% 11.7% 0.2%
Conversion of gross profit into adjusted EBITDA 37.6% 35.7% 1.9% 36.6% 35.8% 0.8%
Number of billable days 60.0 60.2 (0.2) 249.3 250.5 (1.2)
24

25 © 2017 On Assignment, Inc. All rights reserved. 25
Selected Cash Flow and Balance Sheet Data
1 Long-term debt is net of unamortized deferred loan costs.
Fin
ancia
ls
Addre
ssable
Mark
et
Overv
iew
25
($'s in millions) Three Months Ended December 31, LTM Ended December 31,
Cash Flows Data: 2017 2016 2017 2016 Chg. %
Adjusted EBITDA 82.9$ 70.7$ 311.4$ 285.0$ 26.4$ 9.3%
Cash Flows from Operating Activities 58.3 56.4 196.4 199.3 (2.9) -1.4%
Capital Expenditures 6.2 6.6 24.3 27.1 (2.9) -10.6%
Free Cash Flow 52.0 49.8 172.2 172.2 (0.0) 0.0%
Free Cash Flow as a Percent of:
Revenues 7.7% 8.0% 6.6% 7.1% -7.1%
Adjusted EBITDA 62.7% 70.5% 55.3% 60.4% -8.5%
Debt Repayment 35.5 19.0 68.0 118.0 (50.0) -42.4%
Cash Paid to Repurchase Shares 0.0 20.5 60.1 43.1 17.0 39.5%
Balance Sheet Data: December 31, December 31,
2017 2016
Cash and Cash Equivalents 36.7$ 27.0$
Working Capital 332.8 275.0
Long-term Debt1
575.2 640.4
Stockholders' Equity 991.4 868.9
Leverage Ratio (debt to trailing 12-months EBITDA) 1.89x 2.32x

26 © 2017 On Assignment, Inc. All rights reserved.
Financial Estimates for Q1 2018
1 Q1 estimates include $4.9 million in revenues from StratAcuity which was acquired on August 8, 2017. On a same “Billable Days” basis, our implied year-over-year revenue growth rate excluding StratAcuity
for the first quarter ranges from 6.8 to 8.4 percent. 2 These estimates do not include acquisition, integration, or strategic planning expenses, other than the $10.0 million in estimated acquisition expenses related to the pending acquisition of ECS. 3 Adjusted Net Income, a non-GAAP financial measure, is defined as net income adjusted for, (i) acquisition, integration and strategic planning expenses and (ii) amortization of identifiable intangible assets.
Does not include the “Cash Tax Savings” on Indefinite-lived Assets.” These savings total $4.6 million per quarter, or $0.09 per diluted share and represent the economic value of the tax deduction that we
received from the amortization of goodwill and trademarks. 4 Adjusted EBITDA, a non-GAAP financial measure, is defined as EBITDA (earnings before interest, income taxes, depreciation and amortization) adjusted for, among other things, (i) equity-based
compensation expense and (ii) acquisition, integration and strategic planning expenses.
Fin
ancia
ls
Addre
ssable
Mark
et
Overv
iew
(In millions, except per share amounts)
Low High
Revenues1
$672.0 $682.0
Year-over-year growth rate 7.3% 8.9%
Same billable day basis 7.6% 9.2%
Gross Margin 31.5% 31.8%
SG&A Expenses2
$164.7 $166.9
Amortization of Intangible Assets $7.6 $22.55
Net Income:
GAAP2
$24.4 $26.6
Adjusted3
$39.0 $41.2
EPS (Diluted):
GAAP2
$0.46 $0.50
Adjusted3
$0.74 $0.78
Adjusted EBITDA4
$69.0 $72.0
Diluted Shares 52.8
26

27 © 2017 On Assignment, Inc. All rights reserved.
Adjusted EPS Estimates for Q1 2018
Table above shows adjustments to GAAP Net Income to calculate Adjusted Net Income
1. Amortization of identifiable intangible assets (e.g., customer/contractor relationships, non-compete agreements, etc.) related to the acquired businesses.
2. Income taxes (assuming a 26.5 percent marginal rate) on the portion of amortization of identifiable intangible assets that are not deductible for income tax purposes
(mainly amortization associated with the CyberCoders acquisition that the Company was not able to step-up the tax basis in those acquired assets for tax purposes).
3. Does not include the “Cash Tax Savings on Indefinite-lived Intangible Assets.” These savings total $4.6 million each quarter, or $0.09 per diluted share, and
represent the economic value of the tax deduction that we receive from the amortization of goodwill and trademarks.
27
Fin
ancia
ls
Addre
ssable
Mark
et
Overv
iew
(In millions, except per share amounts)
Low High
Net Income - GAAP Basis 24.4$ 26.6$
Add-backs:
Amortization of identifiable intangible assets1
7.6 7.6
Estimated acquisition expenses related to the pending acquisition of ECS 10.0 10.0
Tax effect on estimated acquisition expenses (2.7) (2.7)
Income taxes on amortization for financial reporting purposes
not deductible for income tax purposes2
(0.3) (0.3)
Net Income - As Adjusted3
39.0$ 41.2$
Earnings Per Share (Diluted):
GAAP Basis 0.46$ 0.50$
As Adjusted 0.74$ 0.78$

28 © 2017 On Assignment, Inc. All rights reserved.
2018 Financial Estimates for ECS
1 As reported in our Q4 2017 press release. 2 Includes $14.1 million in depreciation and $3.3 million in stock-based compensation expense. 3 Does not include the “Cash Tax Savings on Indefinite-lived Intangible Assets.” These savings are estimated to be approximately $9.0 million annually over 15 years and represent the economic value of the tax
deduction that we receive from the amortization of goodwill and trademarks. 4 Adjusted EBITDA, a non-GAAP financial measure, is defined as EBITDA (earnings before interest, income taxes, depreciation and amortization) adjusted for equity-based compensation expense.
(In millions)1
Low High
Revenues $620.0 $640.0
Operating Costs and Expenses2
$567.3 $583.9
Amortization of Intangible Assets $45.0 $42.0
Net Income:
GAAP ($19.0) ($14.3)
Adjusted3
$26.0 $27.7
Adjusted EBITDA4
$70.0 $73.5
28

29 © 2017 On Assignment, Inc. All rights reserved.
Financial Targets for 2018 (final year of 5-Year Strategic Plan) published in March 2014
• Revenues of $3 billion ($1.7 billion for 2013, the Base Year of the 5-Year Plan)
– Financial target implied 5-year revenue CAGR of 11.8%
– Assumed year-over-year organic growth of 10 percent, and contribution of approximately $240 million from acquisitions
• Gross margin of 31 to 32 percent (31.9 percent for 2013)
– Assumed revenue mix shift toward higher volume / lower gross margin business (i.e., higher growth in Apex segment)
– Compression in margin caused by shift in mix of revenues to be partially offset by higher mix of permanent placement
revenues
• Adjusted EBITDA margin of 11.5% to 12.5% (10.7% for 2013)
– Assumed a 2% reduction in cash SG&A expenses as a percent of revenues
– Improvement assumed higher staffing consultant productivity, greater economies of scale & higher efficiency from
integration / consolidation initiatives
• Cumulative Free Cash Flow of $675 million
($ in Millions) 2018 Financial Status
Targets1
Low / High
Revenues $3,000
Gross Profit 930 / 960
Adjusted EBITDA 345 / 375
Gross Margin2 31.0% / 32.0%
Adjusted EBITDA Margin 11.5% / 12.5%
Conversion of GP into Adj. EBITDA 37.1% / 39.1%
Cumulative Free Cash Flow $675
1 Financial goals for 2018 as set forth in the 5-Year Strategic Plan (2018 was the final year of the 5-Year Plan). 2 Gross margin target applied to our core business only.
P
P
P
P
P
P
P
Update on Five-Year Strategic Plan Financial Targets
29

30 © 2017 On Assignment, Inc. All rights reserved.