deutsche bank - l'oréal investisseurs et actionnaires mass market hair & beauty salons...
TRANSCRIPT

Jean-Paul AGON Chairman and CEO
Deutsche Bank JUNE 19th 2014
1 // June 19th 2014

STRONG
STRATEGIC
CONTINUITY
I
2 // June 19th 2014

A PURE PLAYER IN BEAUTY FOR 105 YEARS
3 // June 19th 2014
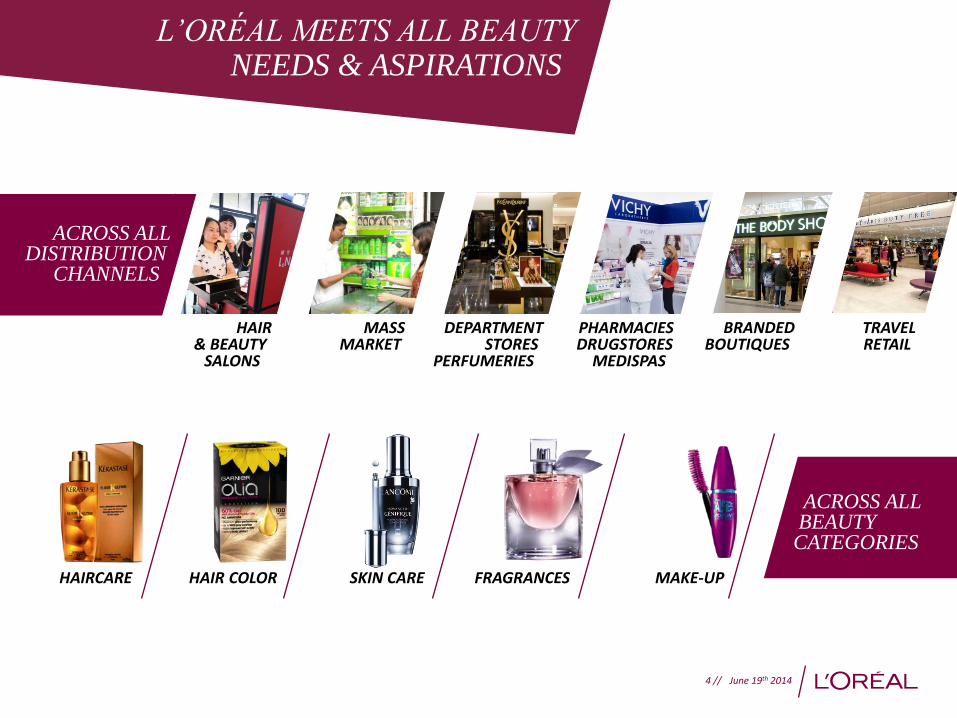
L’ORÉAL MEETS ALL BEAUTY NEEDS & ASPIRATIONS
ACROSS ALL BEAUTY CATEGORIES
ACROSS ALL DISTRIBUTION CHANNELS
4 // June 19th 2014
TRAVEL RETAIL
BRANDED BOUTIQUES
PHARMACIES DRUGSTORES MEDISPAS
DEPARTMENT STORES PERFUMERIES
MASS MARKET
HAIR & BEAUTY SALONS
MAKE-UP FRAGRANCES HAIR COLOR HAIRCARE SKIN CARE
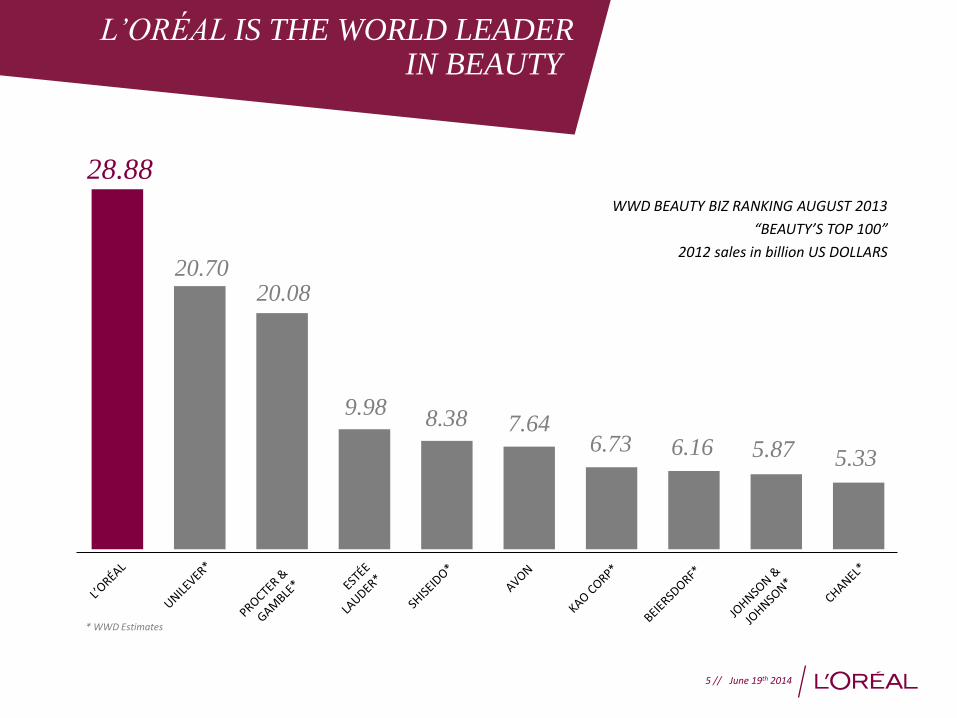
28.88
20.70 20.08
9.98 8.38 7.64
6.73 6.16 5.87 5.33
* WWD Estimates
L’ORÉAL IS THE WORLD LEADER IN BEAUTY
WWD BEAUTY BIZ RANKING AUGUST 2013
“BEAUTY’S TOP 100”
2012 sales in billion US DOLLARS
5 // June 19th 2014

RESEARCH & INNOVATION AT THE HEART OF OUR BUSINESS MODEL
3.4% OF SALES
R&I
6 // June 19th 2014
*
* Pro-forma 2013 – Galderma & Inneov consolidated under the equity method, in application of IFRS 11.

A UNIQUE PORTFOLIO OF COMPLEMENTARY BRANDS
7 // June 19th 2014

€ 2 Bn
€ 300 m
2013 1995
€ 530 m
€ 40 m
2013 1999
CAGR 21%
CAGR 12%
8 // June 19th 2014

SINCE ACQUISITION
IN 2011
x2.5 SALES
ACQUISITION IN 2012 +42%
SALES
*2013 Like-for-like sales growth 9 // June 19th 2014
*

WESTERN EUROPE
35.1 %
BREAKDOWN OF 2013 COSMETICS SALES BY REGION
BALANCED GEOGRAPHIC POSITIONS
NEW MARKETS
39.8 %
NORTH AMERICA
25.1 %
10 // June 19th 2014

22.2% 18.7% 19.2%
20.1%**
Western Europe
North America
New Markets
20.5% 19.9% 20.0% 21.2%
20.1%**
Professional Products
Consumer Products
L’Oréal Luxe
Active Cosmetics
BY DIVISION* (as a % of sales)
BALANCED OPERATING PROFIT
BY REGION* (as a % of sales)
* Before central group expenses, fundamental research expenses, stock-option & free grant of shares expenses and miscellaneous items – as a % of total cosmetics sales ** Cosmetics divisions total
11 // June 19th 2014

2013 KEY FINANCIAL FIGURES IN MILLION EUROS
% change
2013 Reported At constant exchange rates***
Consolidated sales 22 977 +2.3% +6.0%
Operating profit 3 875 +4.8% +7.8%
Net profit* 3 117 +4.9% +7.4%
Earnings per share** (in euros) 5.13 +4.4% +7.0%
Net operating cash flow 2 689 +4.4%
*Excluding non-recurring items attributable to owners of the company **Diluted earnings per share based on net profit excluding non-recurring items, attributable to owners of the company *** 2013 figures at 2013 rates / 2012 figures at 2013 rates
12 // June 19th 2014

CONTINUOUS PRODUCTIVITY & EFFICIENCY ENHANCEMENTS
INTEGRATED ON/OFF LINE
MEDIA STRATEGY
ON-GOING OPTIMISATION
OF OUR MEDIA BUYING
ECONOMETRIC MODELING
40 Cosmetics factories worldwide
(excl. Dermatology)
REENGINEERING OF OUR INDUSTRIAL FOOTPRINT & LOGISTICS NETWORK
OPERATIONS GROWTH DRIVERS
OPTIMISATION OF SUPPORT FUNCTIONS AND SYSTEMS
ORGANISATIONS
ON-GOING ASSESSMENT OF OUR PROCUREMENT PERFORMANCE
13 // June 19th 2014

SOLID BALANCE SHEET IN BILLION EUROS
ASSETS LIABILITIES
1.8 2.6 6.2 6.3
6.4 6.7 0.2 0.4
21.3 21.9
2.2 2.0
20.9 22.6
Non-current
liabilities
12.31.2012 12.31.2013 12.31.2012 12.31.2013
Current liabilities
Financial debt (current & non-current)
Non-current
assets
Current
assets
Cash & cash
equivalents
Total Assets 29.5 31.3
Shareholders’
equity
Total Liabilities 29.5 31.3
14 // June 19th 2014

OPERATIONAL & FINANCIAL ROBUSTNESS: A POWERFUL & LONG TERM BUSINESS MODEL
0.008 0.025
0.097
0.44
0.00
0.50
1.00
1.50
2.00
2.50
196
3
196
4
196
5
196
6
196
7
196
8
196
9
197
0
197
1
197
2
197
3
197
4
197
5
197
6
197
7
197
8
197
9
198
0
198
1
198
2
198
3
198
4
198
5
198
6
198
7
198
8
198
9
199
0
199
1
199
2
199
3
199
4
199
5
199
6
199
7
199
8
199
9
200
0
200
1
200
2
200
3
200
4
200
5
200
6
200
7
200
8
200
9
201
0
201
1
201
2
201
3
2.50*
1990
1970
2000
1980
2010
1.80
2.00
2.30
*Approved at the shareholders’ meeting held on April 17th, 2014
2013 dividend per share
2.30€ 2.50€*
2012 2013
+8.7%
15 // June 19th 2014

1997 1998 1999 2000 2001 2002 2003 2004 2005 2006 2007 2008 2009 2010 2011 2012 2013
48.7%**
30.2%
31.6%
33.6%
35.7% 36.0% 36.6% 36.8%
38.5%
39.6%
41.1% 41.3%
43.9% 44.9%
46.3%
29.1%
* Taking into account the Sanofi history with regards to the dividends. ** Based on the dividend approved at the AGM held on April 17th, 2014
46.8%
PAY-OUT RATIO: 1997-2013 AS A % OF NET PROFIT*
16 // June 19th 2014

A NEW L’ORÉAL
II
17 // June 19th 2014

1/ NEW STRATEGY
2/ NEW INNOVATION FIREPOWER
3/ RECENT ACQUISITIONS TO COMPLEMENT OUR PORTFOLIO
4/ NEW GEOGRAPHICAL FOOTPRINT
5/ NEW MARKETING MODEL
6/ NEW SUSTAINABILITY COMMITMENTS
7/ NEW SHAREHOLDING STRUCTURE
18 // June 19th 2014

1/ ACCELERATED EXPANSION OF THE MIDDLE CLASS
LATIN AMERICA
8%
NORTH AMERICA
10%
EUROPE
22%
ASIA PACIFIC
54%
MIDDLE EAST AND
NORTH AFRICA
5%
SUB SAHARAN
AFRICA
2%
2020 2009
1.8
3.2
GEOGRAPHICAL SPLIT OF THE GLOBAL MIDDLE CLASS 2020* GLOBAL
MIDDLE CLASS*
(IN BILLION)
*OECD 2010. The emerging middle class in developing countries
19 // June 19th 2014

1/ OUR STRATEGY
UNIVERSALIZATION
OUR OBJECTIVE: 1 BILLION NEW CONSUMERS
GLOBALIZING
WHILE RESPECTING
DIFFERENCES
20 // June 19th 2014

2/ A STRONG CORE AND FIVE REGIONAL R&I HUBS
COUPLED WITH EXPERT MARKETING HUBS
21 // June 19th 2014

Pro-Xylane
2/ MAXIMISE OUR SCIENTIFIC BREAKTHROUGHS
2006
2013
22 // June 19th 2014

2/ LOCAL INNOVATIONS THAT TURN INTO WORLDWIDE BLOCKBUSTERS
23 // June 19th 2014

2/ SPOT, IMPROVE AND AMPLIFY EMERGING IDEAS
Blur Oil BB Cream
24 // June 19th 2014

3/ BRANDS TO CAPTURE NEW CATEGORIES OPPORTUNITIES
25 // June 19th 2014 25 // June 19th 2014

3/ BRANDS TO STRENGTHEN OUR LOCAL / REGIONAL POSITIONS
26 // June 19th 2014

4/ STRATEGIC POSITIONS IN BRIMC COUNTRIES*
No1
MEXICO
BRAZIL
No4
No2
CHINA
INDIA
No3
No1
RUSSIA
*Internal estimates 2013
27 // June 19th 2014

No1
NORTH AMERICA
14.3%
No4
LATIN AMERICA
8.5%
No1
WESTERN EUROPE
19.3%
No1
EASTERN EUROPE
11.8% No8
JAPAN
2.2% No2
AFRICA MIDDLE EAST**
10.2% (in the countries where
L’Oréal is present)
No2
ASIA PACIFIC
10.5% (excl. Japan)
4/ A LEADER WITH HIGH POTENTIAL
L’OREAL MARKET SHARE BY GEOGRAPHIC ZONE 2013*
12.2%
16.9%
8.6%
L’ORÉAL “WORLD”:
“MATURE MARKETS”:
“NEW MARKETS”: * Excluding soaps, razors and toothpastes L’Oréal Estimates BMS ** Perimeter: countries where L’Oréal is present 28 // June 19th 2014

NORTH AMERICA
AFRICA MIDDLE EAST
WESTERN EUROPE
EASTERN EUROPE
SOUTH ASIA PACIFIC
4/ NEW ORGANIZATION 8 STRATEGIC REGIONS
BRAZIL
HISPANIC LATAM
NORTH ASIA
29 // June 19th 2014

5/ DIGITAL REVOLUTION A HISTORIC OPPORTUNITY FOR BEAUTY
RICH CONSUMER DIALOGUE PERSONALIZED SERVICES CONNECTED BEAUTY
E-COMMERCE
+20%*
SALES
DIGITAL MEDIA
12% OF OUR NET MEDIA EXPENSES
*2013
30 // June 19th 2014

31 // June 19th 2014
THE ULTIMATE VIRTUAL BEAUTY ADVISOR
5/ INVENTING A NEW ERA OF DIGITALLY-ENRICHED SERVICES
NEW CONSUMER EXPERIENCES THROUGH VIRTUAL REALITY
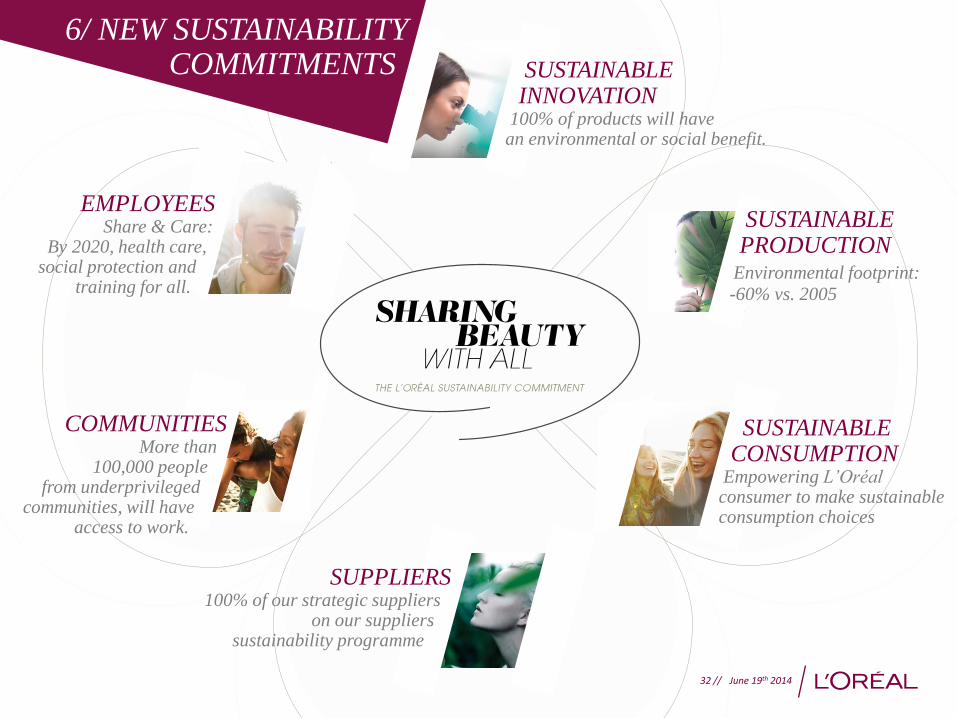
SUSTAINABLE INNOVATION 100% of products will have an environmental or social benefit.
SUSTAINABLE PRODUCTION Environmental footprint:
-60% vs. 2005
SUSTAINABLE CONSUMPTION Empowering L’Oréal consumer to make sustainable consumption choices
SUPPLIERS 100% of our strategic suppliers on our suppliers sustainability programme
COMMUNITIES More than 100,000 people from underprivileged communities, will have access to work.
EMPLOYEES Share & Care: By 2020, health care, social protection and training for all.
32 // June 19th 2014
6/ NEW SUSTAINABILITY COMMITMENTS

7/ STRATEGIC TRANSACTION ANNOUNCED FEBRUARY 11th, 2014
Nestlé
23.29%
Others
Bettencourt Meyers family
Treasury shares
* % of share capital based on a total number of shares of 605,901,887 as of 31/12/2013 ** % of share capital based on a total number of shares of 606,059,384 as of 31/01/2014 - after cancellation of the repurchased shares
New shareholding structure** Buy-back of €6.0Bn L’Oréal shares owned by Nestlé
48.5 million shares
8.0% of L’Oréal’s share capital
124.48€/share
(30.64%*)
(29.44%*)
33.31%
(1.01%*)
1.27%
(38.91%*)
42.13%
BUYBACK Cancellation of the shares EPS enhancement impact: +5% full year est.
33 // June 19th 2014

CONFIDENCE
FOR THE
FUTURE
III
34 // June 19th 2014
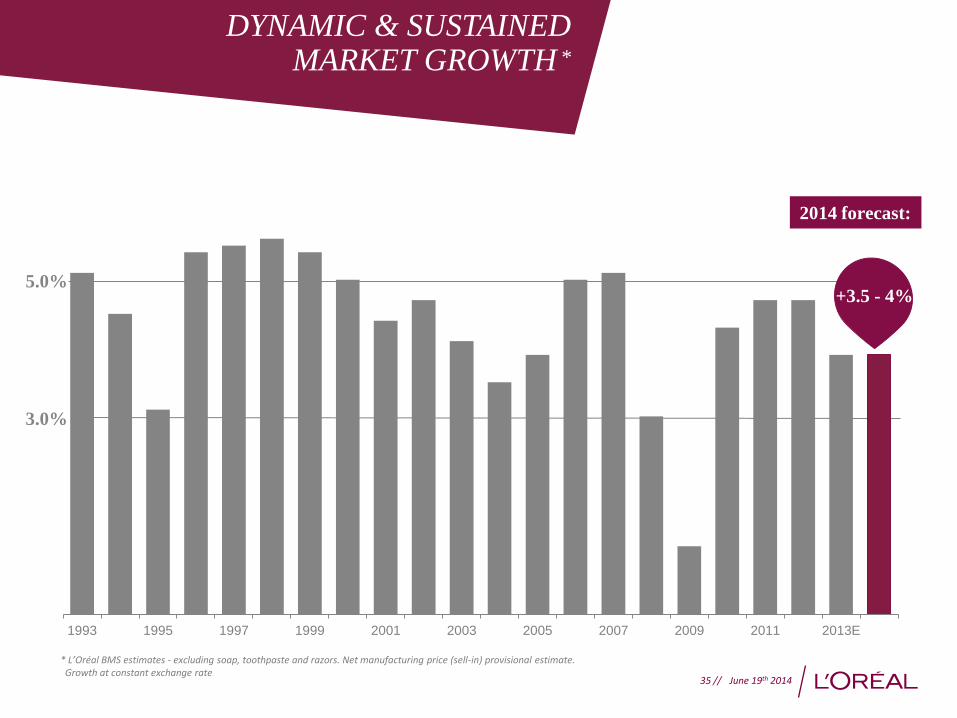
1993 1995 1997 1999 2001 2003 2005 2007 2009 2011 2013E
5.0%
3.0%
+3.5 - 4%
2014 forecast:
* L’Oréal BMS estimates - excluding soap, toothpaste and razors. Net manufacturing price (sell-in) provisional estimate. Growth at constant exchange rate
35 // June 19th 2014
DYNAMIC & SUSTAINED MARKET GROWTH *

L’ORÉAL IS STEADILY OUTPERFORMING THE MARKET
*excluding soaps, razors and toothpastes. 2013 provisional estimates
Source: L’Oréal estimates. Excluding exchange rate impact
+5.6%
+4.2%
2010
+5.0%
+4.6%
+5.5%
+4.6%
MARKET
+5.2%
+3.8%
2011 2012 2013
COSMETICS MARKET GROWTH* AND L’ORÉAL LIKE-FOR-LIKE
COSMETICS SALES GROWTH
36 // June 19th 2014

Like-for-like % change
2013 Q1 2014
Professional Products +2.1% +3.7%
Consumer Products +4.9% +1.2%
L'Oréal Luxe +6.8% +7.2%
Active Cosmetics +7.8% +8.7%
Cosmetics Divisions +5.2% +3.7%
The Body Shop +1.2% -3.4%
Consolidated Total +5.1% +3.5%
* From January 1st 2014, Galderma and Inneov, both 50% owned subsidiaries, will be consolidated under the equity method, in application of IFRS 11.
Like-for-like % change
2013 Q1 2014
Western Europe +1.9% +2.8%
North America +3.8% -0.6%
New Markets +9.4% +7.5%
of which:
- Asia, Pacific +8.4% +6.8%
- Latin America +11.5% +8.2%
- Eastern Europe** +8.2% +6.3%
- Africa, Middle East** +14.3% +14.9%
Cosmetics Divisions +5.2% +3.7%
** As of July 1st, 2013, Turkey and Israel, which were previously included in the Africa, Middle East zone, were transferred to the Eastern Europe zone. All figures for earlier periods have been restated to allow for this change.
AN ENCOURAGING & CONTRASTED FIRST QUARTER
BY DIVISION* BY REGION*
37 // June 19th 2014

38 // June 19th 2014
POWERFUL INNOVATION

HEALTHY MARKET GROWTH
ENHANCED WORLDWIDE LEADERSHIP
MARKET SHARE GAIN OPPORTUNITIES
REGULAR PROFIT INCREASE
DYNAMIC DIVIDEND POLICY
SOLID PROSPECTS
39 // June 19th 2014

-------------------------Avertissement / Disclaimer ------------------------- « Ce document ne constitue pas une offre de vente ou la sollicitation d’une offre d’achat de titres L’Oréal. Si vous souhaitez obtenir des informations plus complètes concernant L’Oréal,
nous vous invitons à vous reporter aux documents publics déposés en France auprès de l’Autorité des Marchés Financiers (également disponibles en version anglaise sur notre site Internet
www.loreal-finance.com).Ce document peut contenir certaines déclarations de nature prévisionnelle. Bien que la Société estime que ces déclarations reposent sur des hypothèses
raisonnables à la date de publication du présent communiqué, elles sont par nature soumises à des risques et incertitudes pouvant donner lieu à un écart entre les chiffres réels et ceux
indiqués ou induits dans ces déclarations.»
"This document does not constitute an offer to sell, or a solicitation of an offer to buy, L’Oréal shares. If you wish to obtain more comprehensive information about L’Oréal, please refer to the
public documents registered in France with the Autorité des Marchés Financiers (which are also available in English on our Internet site: www.loreal-finance.com).This document may contain
some forward-looking statements. Although the Company considers that these statements are based on reasonable hypotheses at the date of publication of this release, they are by their
nature subject to risks and uncertainties which could cause actual results to differ materially from those indicated or projected in these statements."
Françoise Lauvin
Head of Investor Relations
Tel. : + 33 1 47 56 86 82
Fax : + 33 1 47 56 74 93
email : [email protected]
Sophie Gasperment
Group General Manager, Financial Communication
Strategic Prospective
Tel. : + 33 1 47 56 86 22
Fax : + 33 1 47 56 74 93
email : [email protected]