deutsche bank global consumer conference …/media/files/e/estee-lauder/events... · deutsche bank...
TRANSCRIPT

DEUTSCHE BANK
GLOBAL CONSUMER CONFERENCEJune 14, 2017
CEDRIC PROUVÉ
GROUP PRESIDENT, INTERNATIONAL
TRACEY T. TRAVIS
EXECUTIVE VICE PRESIDENT AND CFO
FORWARD-LOOKING INFORMATIONThe forward-looking statements in this presentation, including those containing words like “expect,” “plans,” “may,” “could,” “anticipate,” “estimate,” “projected,” “forecasted,” involve risks and uncertainties. Factors that could cause actual results to differ materially from those forward-looking statements include the following:
(1) increased competitive activity from companies in the skin care, makeup, fragrance and hair care businesses;
(2) the Company’s ability to develop, produce and market new products on which future operating results may depend and to successfully address challenges in the Company’s business;
(3) consolidations, restructurings, bankruptcies and reorganizations in the retail industry, and other factors causing a decrease in the number of stores that sell the Company’s products, an increase in the ownership concentration within the retail industry, ownership of retailers by the Company’s competitors or ownership of competitors by the Company’s customers that are retailers and our inability to collect receivables;
(4) destocking and tighter working capital management by retailers;
(5) the success, or changes in timing or scope, of new product launches and the success, or changes in the timing or the scope, of advertising, sampling and merchandising programs;
(6) shifts in the preferences of consumers as to where and how they shop for the types of products and services the Company sells;
(7) social, political and economic risks to the Company’s foreign or domestic manufacturing, distribution and retail operations, including changes in foreign investment and trade policies and regulations of the host countries and of the United States;
(8) changes in the laws, regulations and policies (including the interpretations and enforcement thereof) that affect, or will affect, the Company’s business, including those relating to its products or distribution networks, changes in accounting standards, tax laws and regulations, environmental or climate change laws, regulations or accords, trade rules and customs regulations, and the outcome and expense of legal or regulatory proceedings, and any action the Company may take as a result;
(9) foreign currency fluctuations affecting the Company’s results of operations and the value of its foreign assets, the relative prices at which the Company and its foreign competitors sell products in the same markets and the Company’s operating and manufacturing costs outside of the United States;
(10) changes in global or local conditions, including those due to the volatility in the global credit and equity markets, natural or man-made disasters, real or perceived epidemics, or energy costs, that could affect consumer purchasing, the willingness or ability of consumers to travel and/or purchase the Company’s products while traveling, the financial strength of the Company’s customers, suppliers or other contract counterparties, the Company’s operations, the cost and availability of capital which the Company may need for new equipment, facilities or acquisitions, the returns that the Company is able to generate on its pension assets and the resulting impact on its funding obligations, the cost and availability of raw materials and the assumptions underlying the Company’s critical accounting estimates;
(11) shipment delays, commodity pricing, depletion of inventory and increased production costs resulting from disruptions of operations at any of the facilities that manufacture nearly all of the Company’s supply of a particular type of product (i.e. focus factories) or at the Company’s distribution or inventory centers, including disruptions that may be caused by the implementation of information technology initiatives or by restructurings;
(12) real estate rates and availability, which may affect the Company’s ability to increase or maintain the number of retail locations at which the Company sells its products and the costs associated with the Company’s other facilities;
(13) changes in product mix to products which are less profitable;
(14) the Company’s ability to acquire, develop or implement new information and distribution technologies and initiatives on a timely basis and within the Company’s cost estimates and the Company’s ability to maintain continuous operations of such systems and the security of data and other information that may be stored in such systems or other systems or media;
(15) the Company’s ability to capitalize on opportunities for improved efficiency, such as publicly-announced strategies and restructuring and cost-savings initiatives, and to integrate acquired businesses and realize value therefrom;
(16) consequences attributable to local or international conflicts around the world, as well as from any terrorist attack, retaliation or similar threats;
(17) the timing and impact of acquisitions, investments and divestitures; and
(18) additional factors as described in the Company’s filings with the Securities and Exchange Commission, including its Annual Report on Form 10-K for the fiscal year ended June 30, 2016.
The Company assumes no responsibility to update forward-looking statements made herein or otherwise.

NON-GAAP DISCLOSURES
These materials include some non-GAAP financial measures relating to: constant currency; charges associated with restructuring activities; accelerated orders associated with the Company’s SMI rollout; the Venezuela remeasurement charges; and interest expense on debt extinguishment. We use such measures, among other financial measures, to evaluate our operating performance, which represent the manner in which we conduct and view our business. Management believes that excluding certain items that are not comparable from period to period helps investors and others compare operating performance between two periods. While we consider the non-GAAP measures useful in analyzing our results, they are not intended to replace, or act as a substitute for, any presentation included in the consolidated financial statements prepared in conformity with U.S. GAAP. Information about GAAP andnon-GAAP financial measures, including reconciliation information, is included on the Investors section of the Company’s website, www.elcompanies.com, under the heading “GAAP Reconciliation.”

WE ARE A LEADER IN GLOBAL PRESTIGE BEAUTY
• Diverse portfolio of 25+ brands
• Four major product categories
• Sold in more than 150 countries and territories
• More than 10 prestige distribution channels
• Broad demographic reach

WE ARE A GROWTH COMPANY IN A DYNAMIC, GROWING INDUSTRY
• Prestige beauty is one of the fastest growing HPC industries
• Our goal is to grow ≥ 1% above industry, gaining global share
• We are solely focused on prestige beauty
0%
1%
2%
3%
4%
5%
6%
7%
Average Net Sales Growth2011 - 2016
Global Prestige Beauty Estee Lauder Consumer Staples
Source: ELC sales growth in constant currency for fiscal years 2012 – 2017E. Euromonitor
2016 for premium skin care, makeup and fragrances. FactSet data for S&P 500 Consumer
Staples sector.

WE HAVE STRENGTH IN MAKEUP AND SKIN CARE AND OPPORTUNITY IN FRAGRANCE
Global Prestige Beauty$100B – CAGR +5%
$41B
CAGR +5%
$9B
CAGR
+4%
Estée Lauder Cos.~$12B – CAGR +7%
$23B
CAGR +7%
$27B
CAGR +4%
$4B
CAGR +4%
$2B
CAGR +8%
$5B
CAGR +9%
$1B
CAGR
+5%
Source: ELC net sales F2017E and growth in constant currency for fiscal years 2012 – 2017E. Euromonitor 2016 retail sales for premium skin care, makeup and fragrances, excluding travel
retail. Growth at constant 2016 exchange rates.
Skin Care Makeup Fragrance Hair Care

OUR GROWTH IS POWERED BY OUR LONG-TERM STRATEGY
BRAND GEOGRAPHY CHANNELCATEGORY
MULTIPLE ENGINES OF GROWTH

ONLINE IS OUR FASTEST GROWING CHANNEL
• 5 year CAGR ~25%
• Representing ~11% of F2017E net sales
• In multiple countries with opportunity for expansion
• Strong growth across brand and retailer sites
• Omnichannel
F2013 F2014 F2015 F2016 F2017E
ONLINE SALESCAGR 25%
NA UK EMEA APAC LATAM
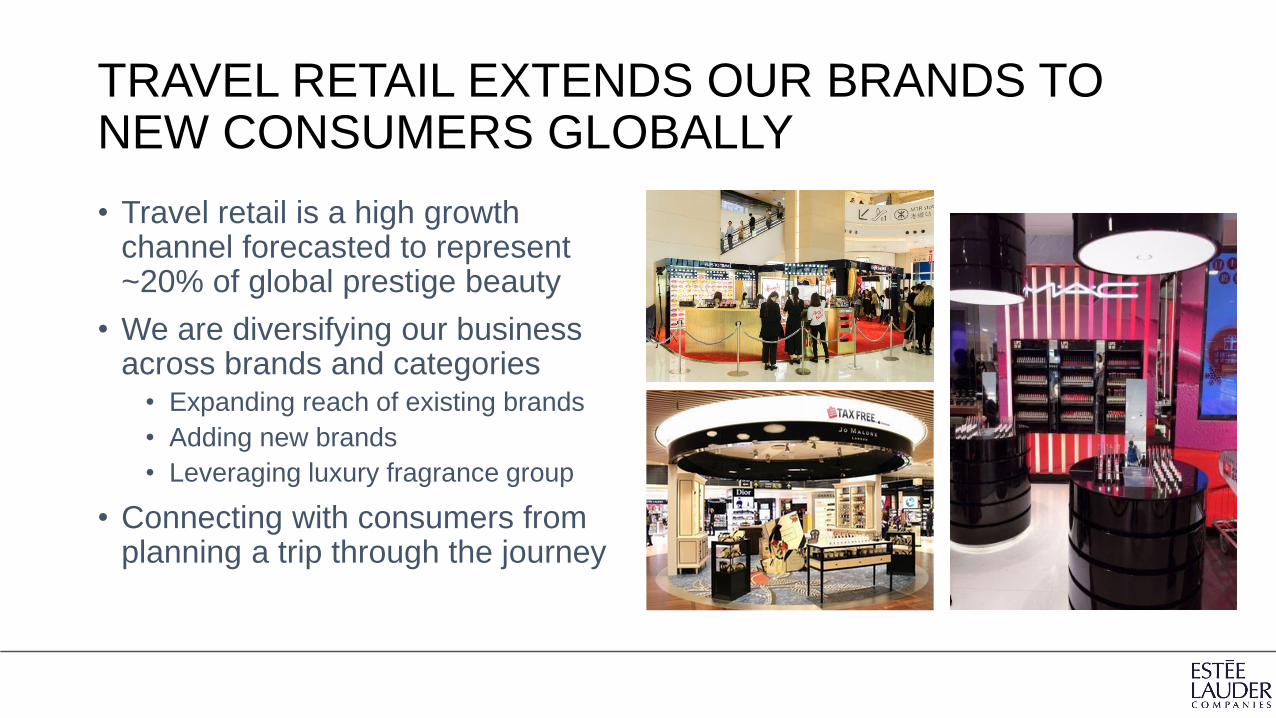
TRAVEL RETAIL EXTENDS OUR BRANDS TO NEW CONSUMERS GLOBALLY
• Travel retail is a high growth channel forecasted to represent ~20% of global prestige beauty
• We are diversifying our business across brands and categories
• Expanding reach of existing brands
• Adding new brands
• Leveraging luxury fragrance group
• Connecting with consumers from planning a trip through the journey

WE ARE LEVERAGING SPECIALTY-MULTI RETAIL GROWTH GLOBALLY
EVE AND BOY, THAILAND KICKS, SWEDEN SEPHORA, FRANCE ULTA, USA
BOOTS, UKMECCA, AUSTRALIADOUGLAS, GERMANYSHOPPERS DRUG, CANADA

FREESTANDING RETAIL STORES FILL DISTRIBUTION GAPS AND SHOWCASE BRANDS
1,400 STORES
MAC
COMPANY STORES
AVEDA
JO MALONE
ORIGINS
BOBBI BROWN
CLINIQUE
NEW BRANDS
ESTEE LAUDER
ALL OTHER
AVEDA FLAGSHIP SALON, DUBAI JO MALONE, BRAZIL
ESTÉE LAUDER, CHINA MAC, UNITED KINGDOM
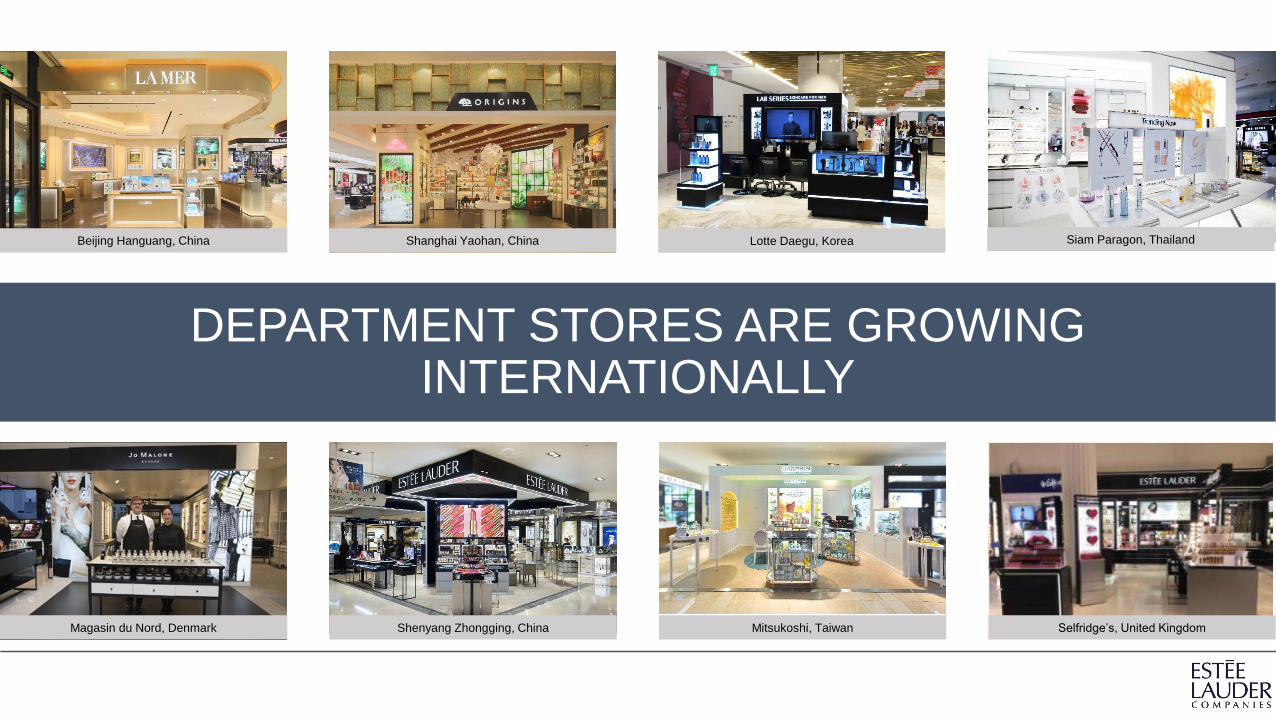
DEPARTMENT STORES ARE GROWING INTERNATIONALLY
Lotte Daegu, KoreaShanghai Yaohan, ChinaBeijing Hanguang, China Siam Paragon, Thailand
Mitsukoshi, TaiwanShenyang Zhongging, ChinaMagasin du Nord, Denmark Selfridge’s, United Kingdom

CREATIVITY AND INNOVATION UNDERPINS OUR SUCCESS
Net Sales
NEW PRODUCTS EXISTING PRODUCTS

THE WAY WE CONNECT WITH CONSUMERS HAS EVOLVED
“Telegraph, telephone, tell a woman”

SOCIAL MEDIA AMPLIFICATIONPLATFORM ACTIVATION ON THE MOMENT CONTENT INFLUENCER ACTIVATIONS IN-HOUSE INFLUENCERS
global and local platforms global content amplification brand storytellers social ambassador programs
new opportunities / formats local content creation commercial partners granularity in artist placement
driving AI / bots innovation new media buying approach long-term affiliations artist communities

EUROPE, THE MIDDLE EAST & AFRICA
• 5 year net sales CAGR +9%
• Gaining share
• Strategy tailored by country
• Leveraging ELC makeup strength
• Strong growth in emerging markets
• Selective retail store deployment
• Digital / social expansion

ASIA / PACIFIC
China: Clinique Pep Start launch event in Shanghai.
• 5 year net sales CAGR +6%
• Gaining share
• Strong skin care markets
• Makeup and fragrance developing
• China accelerating, Korea trends
• Distribution becoming more balanced
• Digital / social expansion
China: MAC Tmall collaboration, including fan parties, super brand day, how-to videos.
Tianjin Hai Xin, China Wuhan Plaza, China

LATIN AMERICA
Mexico: Successful initiatives through integration of Social Media and Bricks & Mortar.
Brazil: Jo Malone London In-store Event - Basil and Neroli Launch
Peru: Bobbi Brown launch event with social media engagement.
• 5 year net sales CAGR +20%
• Gaining share
• Trading consumers up from mass
• Building infrastructure
• Launching new brands
• Activating social media
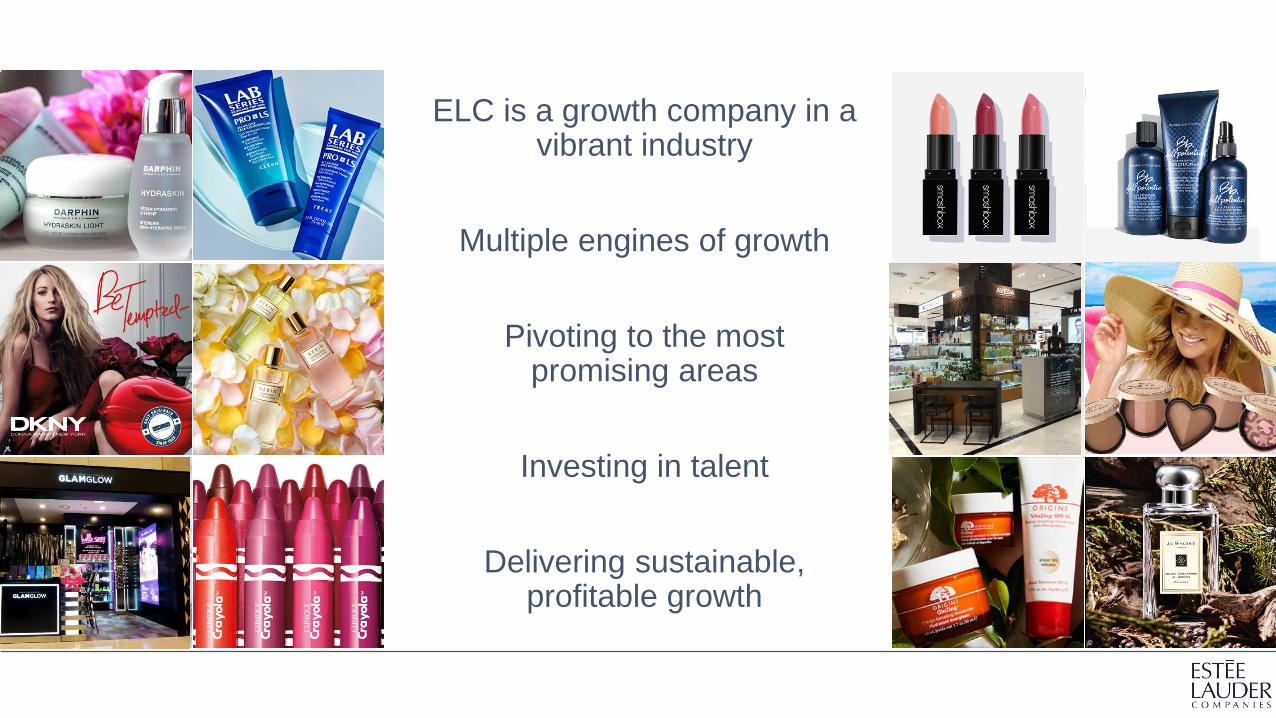
ELC is a growth company in a vibrant industry
Multiple engines of growth
Pivoting to the most promising areas
Investing in talent
Delivering sustainable, profitable growth
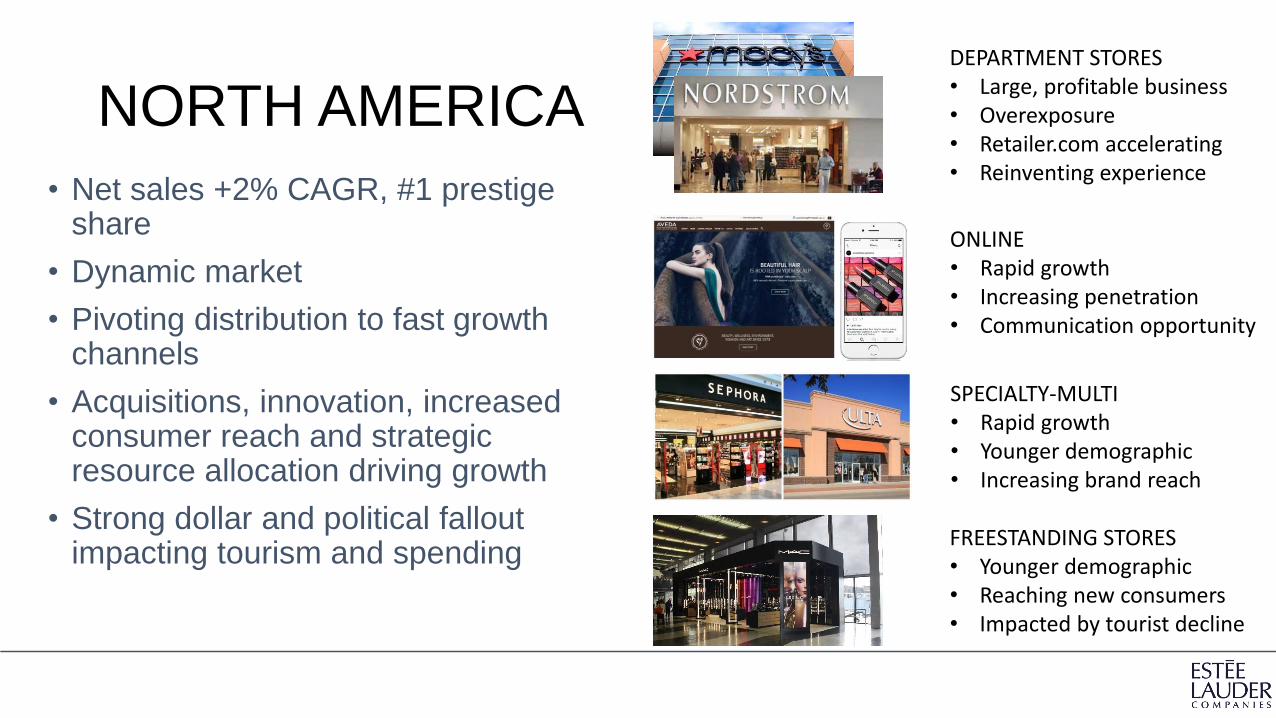
NORTH AMERICA
• Net sales +2% CAGR, #1 prestige share
• Dynamic market
• Pivoting distribution to fast growth channels
• Acquisitions, innovation, increased consumer reach and strategic resource allocation driving growth
• Strong dollar and political fallout impacting tourism and spending
DEPARTMENT STORES• Large, profitable business• Overexposure• Retailer.com accelerating• Reinventing experience
ONLINE• Rapid growth• Increasing penetration• Communication opportunity
SPECIALTY-MULTI• Rapid growth• Younger demographic• Increasing brand reach
FREESTANDING STORES• Younger demographic• Reaching new consumers• Impacted by tourist decline

ACQUISITION AND LICENSE STRATEGYBuying growth opportunity, not sales
1995 1996 1997 1998 1999 2000 2001 2002 2003 2004 2005 2006 2007 2008 2009 2010 2011 2012 2013 2014 2015 2016 2017E

WE DELIVER CONSISTENT, BEST-IN-CLASS SALES GROWTH
9
10
11
12
F2012 F2013 F2014 F2015 F2016 F2017E
AS REPORTED FX TRANSLATION
REPORTED 5% 6% 2% 3% ~5%
CONSTANT CURRENCY6% 7% 6% 7% ~7%
Adjusted for charges and SMI sales shifts
$ Billions
• Grew faster than global prestige beauty over five years
• Goal to grow at least 1pp faster every year
• Acquisitions targeted to add an additional point over 3 years
• Ample geographic, brand and channel opportunities
• Favorable pricing and mix% Growth

SUPPORTED BY INCREASING MODERNIZATION AND EFFICIENCY
• Completed modernization of key systems
• Now enabling cost savings
• Continuing information technology investment
• Leading Beauty Forward initiative• Lowers overhead cost base /
increases expense leverage
• Funds priority investments
• Annual net benefits $200M to $300M before tax

RESULTING IN SOLID ORGANIC OPERATING MARGIN IMPROVEMENT
F2012 ORGANIC CURRENCY ACQUISITIONS F2017E
COST SAVINGS
INITIATIVES
EXPENSE LEVERAGE
EFFICIENCY /
EFFECTIVENESS
CURRENCY TRANSLATION
INVESTMENTS /
ACQUISITIONS
RETAIL STORE
ACCELERATION
PRODUCT MIX
Adjusted for charges.
14.2%
+350 bps -150 bps
-70 bps
15.5%
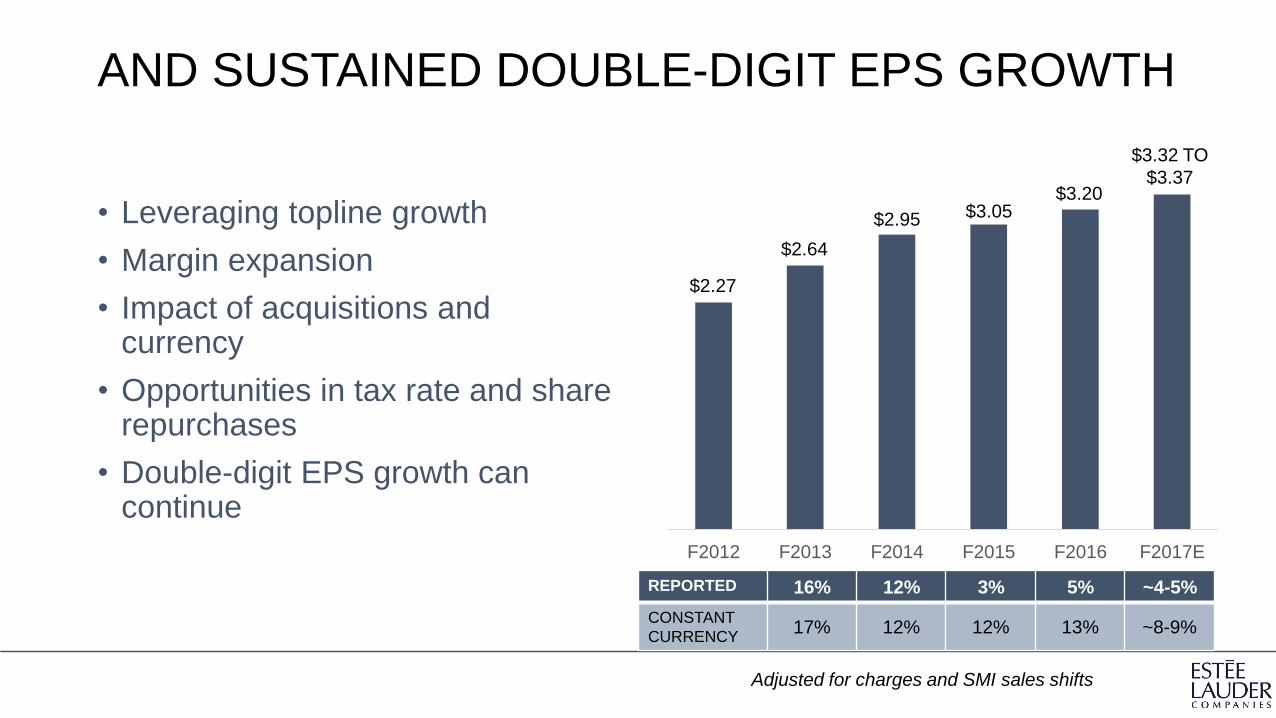
AND SUSTAINED DOUBLE-DIGIT EPS GROWTH
• Leveraging topline growth
• Margin expansion
• Impact of acquisitions and currency
• Opportunities in tax rate and share repurchases
• Double-digit EPS growth can continue
F2012 F2013 F2014 F2015 F2016 F2017E
REPORTED 16% 12% 3% 5% ~4-5%
CONSTANT
CURRENCY17% 12% 12% 13% ~8-9%
$2.64
$2.95 $3.05$3.20
$3.32 TO
$3.37
Adjusted for charges and SMI sales shifts
$2.27
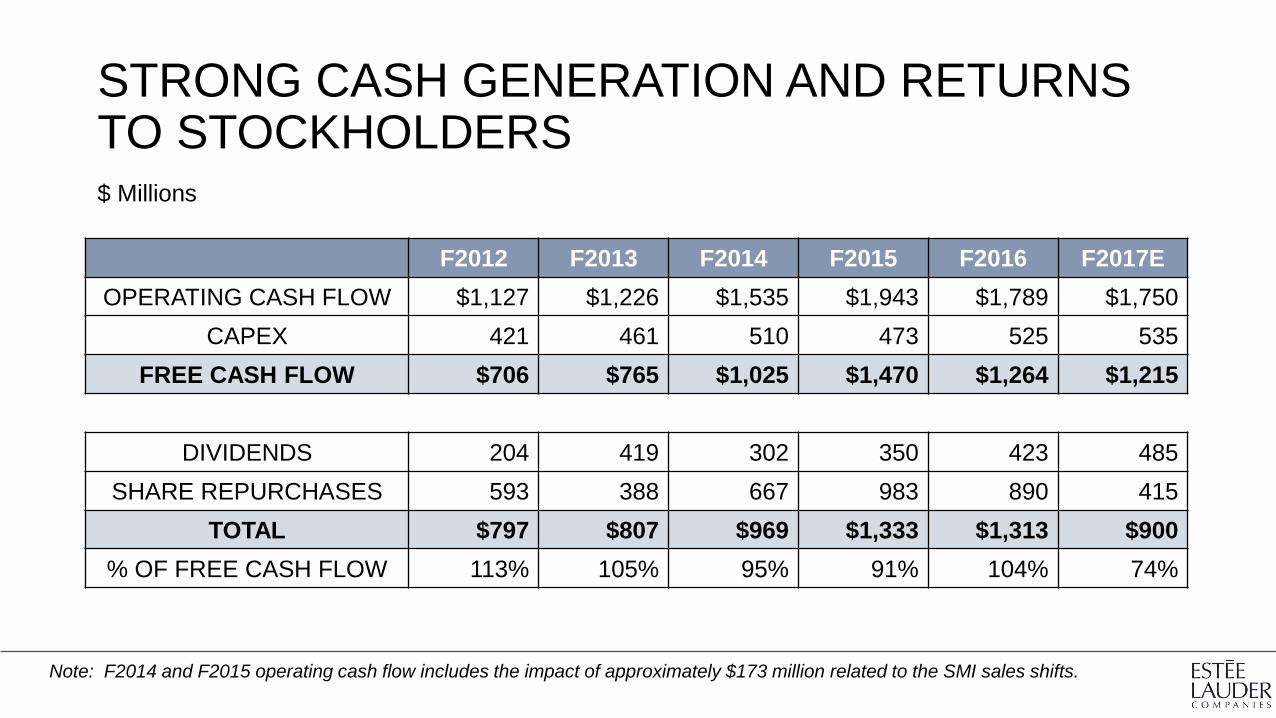
STRONG CASH GENERATION AND RETURNS TO STOCKHOLDERS
F2012 F2013 F2014 F2015 F2016 F2017E
OPERATING CASH FLOW $1,127 $1,226 $1,535 $1,943 $1,789 $1,750
CAPEX 421 461 510 473 525 535
FREE CASH FLOW $706 $765 $1,025 $1,470 $1,264 $1,215
DIVIDENDS 204 419 302 350 423 485
SHARE REPURCHASES 593 388 667 983 890 415
TOTAL $797 $807 $969 $1,333 $1,313 $900
% OF FREE CASH FLOW 113% 105% 95% 91% 104% 74%
$ Millions
Note: F2014 and F2015 operating cash flow includes the impact of approximately $173 million related to the SMI sales shifts.

ACTIVE CASH FLOW DEPLOYMENT
Ending Cash 2012 Operating CashFlow
Debt Stock BasedComp / Other
Dividends / ShareRepurchases
CapitalExpenditures
Acquisitions Ending Cash &Investments
2017E
$ Millions
1,348
8,245
2,575651 (5,323)
(2,508)
(2,050)
2,938