deutsche bank equities conference 2012
TRANSCRIPT
Deutsche Bank Equities Conference
Frankfurt, May 15, 2012 1 1
Deutsche Bank Equities
Conference 2012
Panalpina Group
Frankfurt, May 15, 2012
Deutsche Bank Equities Conference
Frankfurt, May 15, 2012 2 2
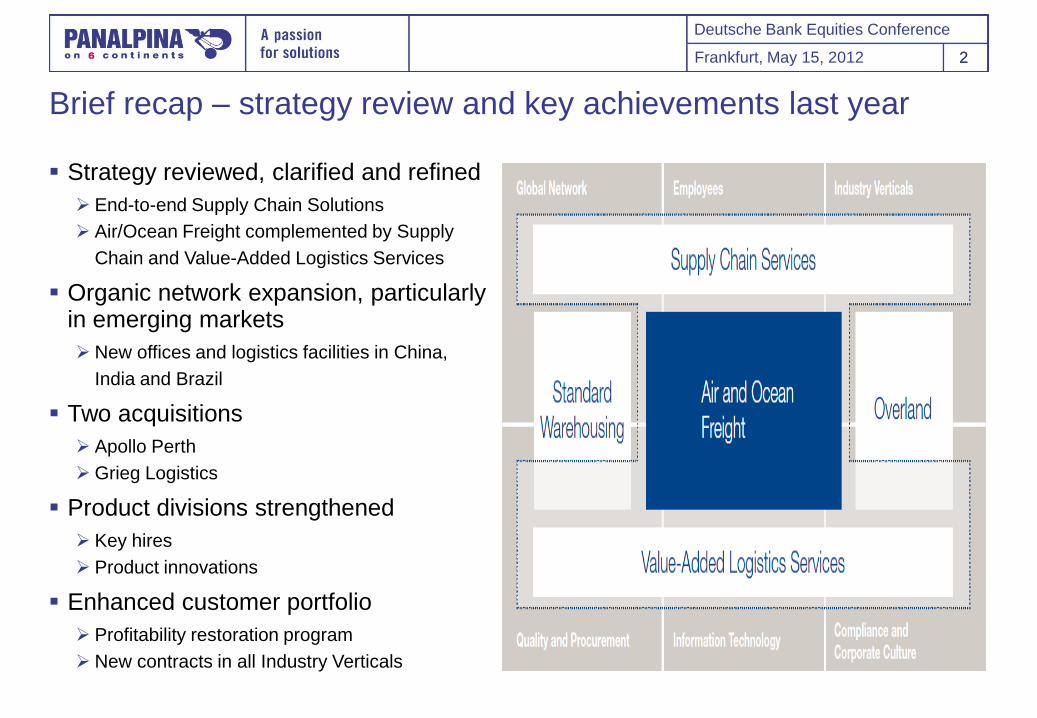
Brief recap – strategy review and key achievements last year
Strategy reviewed, clarified and refined
End-to-end Supply Chain Solutions
Air/Ocean Freight complemented by Supply
Chain and Value-Added Logistics Services
Organic network expansion, particularly in emerging markets
New offices and logistics facilities in China,
India and Brazil
Two acquisitions
Apollo Perth
Grieg Logistics
Product divisions strengthened
Key hires
Product innovations
Enhanced customer portfolio
Profitability restoration program
New contracts in all Industry Verticals

Deutsche Bank Equities Conference
Frankfurt, May 15, 2012 3 3
Cash flow before changes in WC 161.7 150.2
Changes in working capital 67.4 (75.0)
Cash from operations 229.1 75.3
Interest and income taxes paid (35.6) (38.2)
Net cash from operating activities 193.5 37.0
Net cash from investing activities (151.6) (30.8)
Free cash flow (FCF) 41.9 6.2
FCF adj. for money market
investments and acquisitions152.7 12.3
FY 2011 FY 2010
2011 – focused execution leads to solid financial results
-2.8% 9.4%
-3.1% 8.6%
5.6% 15.4%
YTD y/y growth
CHF Excl. FX Air
Ocean
Logistics
• Strong organic gross profit growth in all segments Group GP (excl. FX) up 12% y/y
• EBITDA/GP margin rising from 14.1% (FY 2010) to 14.4% (FY 2011)
• Adjusted free cash flow of CHF 153 million (FY 2010: CHF 12 million)
• Pay-out of CHF 3.90 per share (dividend CHF 2.00, capital reduction CHF 1.90)
1. Strong organic business growth 2. Increase in profitability and margins 3. Strong cash flow generation
Gross profit in CHF million EBITDA in CHF million Cash flow in CHF million
667 688
453 439
360 350
0
300
600
900
1'200
1'500
FY 2010 FY 2011
Logistics
Ocean
Air
(Excl. FX: +15%)
+2%
208 212
14.1% 14.4%
0%
2%
4%
6%
8%
10%
12%
14%
16%
18%
20%
0
20
40
60
80
100
120
140
160
180
200
220
FY 2010 FY 2011
CH
F m
illio
n
Development of (underlying) Group EBITDA
Underlying EBITDA Underlying EBITDA/GP margin

Deutsche Bank Equities Conference
Frankfurt, May 15, 2012 4 4
Comprehensive global network
Among top 5 globally in Air freight and Ocean freight
Worldwide end-to-end supply chain solutions
500 own offices in over 80 countries, > 15‟000 employees
Key competences in 9 industry verticals, industrial projects
Solid financial position (2011 figures)
Net forwarding revenue: CHF 6.5 billion (€ 5.3 billion)
Net earnings: CHF 127 million (€ 104 million)
Return on Capital Employed: 43.2%
Equity ratio: 42.9%
In a nutshell: well positioned within the logistics industry
Regions and product divisions – relative contribution to GP
Total gross profit 2011:
CHF 1.5 billion (€ 1.2 billion)
Europe / Africa / Middle East / CIS (50%)
North America (18%)
Central and South America (11%)
Asia / Pacific (21%)
Air Freight (46%)
Ocean Freight (30%)
Logistics (24%)

Deutsche Bank Equities Conference
Frankfurt, May 15, 2012 5 5
Glo
ba
lly
bala
nc
ed
Lo
call
y
focu
se
d
Focus on Contract Logistics Combined Contract Logistics and Freight Forwarding offering Focus on FF & VAS
OHL Kerry
CEVA
DHL
Agility
KNIN
CHRW
EXPD
Rhenus Fiege Win-
canton
DSV
UPS
Local
heroes
PWTN
Asset-intensive Asset-light Asset-laden
UTIW
Target positioning
DB
Schenker
KWE
Where do we want to go?
Strategic pillars
Focus on Air and Ocean Freight (core services)
Complement with Value-Added Logistics Services
Maintain asset-light business model
Focus on Consumer & Retail, Healthcare, Hi-Tech and
Oil & Gas
Financial objectives 2014
Grow above market in Air and Ocean Freight
Achieve an EBITDA/GP margin of 20%
NWC intensity ≤ 2%
Tax rate 25%

Deutsche Bank Equities Conference
Frankfurt, May 15, 2012 6 6
Logistics
Aftermarket
Services
Logistics
Distribution
Services
Logistics
Production
Services
Logistics
Value Added
Warehousing
Logistics
Inbound
Services
Continuous extension of product line in Logistics New value-added services introduced, e.g.
Inbound to manufacturing
Aftermarket spare parts
Service logistics
Technical distribution
Postponement services
Regional competence centers on three continents launched
Logistics centers opened in 18 countries, including the Huntsville Logistics Center next to Panalpina„s Huntsville Hub (USA)

Deutsche Bank Equities Conference
Frankfurt, May 15, 2012 7 7
Four distinctive competences to support the Logistics strategy
Distinctive
competences Strengths – key differentiators
Clearly defined Logistics strategy and value added services solutions established
No obligation to fill own warehouses due to asset-light business model
No conflict of interests to fill own warehouses – service offering is solution driven
More related to corporate culture versus „silo thinking‟
Lean organization and size of Panalpina bring speed and agility
Flexible approach to commercial models
Global footprint and asset-light business model means solutions can be implemented wherever
needed but also be wound down relatively quickly
Operational excellence program
driven
Entrepreneurial
and flexible
Scalable
model
IT Fully integrated Logistics toolset renders increased productivity and transparency
IT as a differentiator (ABC, KPI tools, etc.)

Deutsche Bank Equities Conference
Frankfurt, May 15, 2012 8 8
Leading economic indicators signal improvements in operating conditions in the months to come…
IFO Business Climate Germany
(Jan 2000 – Apr 2012)
JP Morgan Purchasing Manager Index
(Jan 1998 – Apr 2012)
25
30
35
40
45
50
55
60
65
Ja
n 9
8
Ja
n 9
9
Ja
n 0
0
Ja
n 0
1
Ja
n 0
2
Ja
n 0
3
Ja
n 0
4
Ja
n 0
5
Ja
n 0
6
Ja
n 0
7
Ja
n 0
8
Ja
n 0
9
Ja
n 1
0
Ja
n 1
1
Ja
n 1
2Global PMI New Orders Production
80
85
90
95
100
105
110
115
120
20
00
20
01
20
02
20
03
20
04
20
05
20
06
20
07
20
08
20
09
20
10
20
11
20
12
German ifo business climate index
• US rebounding, China growth slowing down but still on high level
• EU sovereign crisis not resolved, Europe in „W-shaped‟ recession
• Across the board, companies continue to invest – but cautiously
• Some positive indications for 2nd half of the year
While 2012 may turn out to be a “lost year” for Europe, other markets continue to grow

Deutsche Bank Equities Conference
Frankfurt, May 15, 2012 9 9
… although trend growth may be lower than initially anticipated
4.4% 4.5%
4.0% 4.0%
3.9%
3.5%
3.9% 3.9%
2.0%
2.5%
3.0%
3.5%
4.0%
4.5%
5.0%
2011 2012 2013 2014
Forecast as of April 2011 Forecast as of April 2012
GDP growth
6.4% 6.2% 6.4% 5.8%
-0.5%
2.0% 5.3% 4.8%
-2.0%
0.0%
2.0%
4.0%
6.0%
8.0%
2011 2012 2013 2014
Forecast as of April 2011 Forecast as of April 2012
Air freight market growth
7.4% 6.9%
5.2%
6.0%
5.8%
4.0%
5.4% 5.4%
2.0%
3.0%
4.0%
5.0%
6.0%
7.0%
8.0%
2011 2012 2013 2014
Forecast as of April 2011 Forecast as of April 2012
World trade growth
8.0% 8.0% 8.0% 8.0%
7.0%
4.5%
7.0%
7.0%
3.0%
4.0%
5.0%
6.0%
7.0%
8.0%
9.0%
2011 2012 2013 2014
Forecast as of April 2011 Forecast as of April 2012
Ocean freight market growth
Source: IMF, IATA, IHS, Seabury

Deutsche Bank Equities Conference
Frankfurt, May 15, 2012 10 10
The Logistics industry still offers many growth opportunities… Findings from a recent study*
*Source: „The State of Logistics Outsourcing“ (16th Annual Third-Party Logistics Study, October 2011)
Logistics expenditures represent an average
of 12% of sales revenues for shippers, of
which 42% is spent on outsourcing
64% of shippers are increasing their use of
3PL services
58% are reducing/consolidating the number
of 3PL providers they use
Fuel efficiency and carbon emissions are
becoming more important decision factors
for selecting 3PLs
165 158 149 28
0 200 400 600
Europe
Asia-Pacific
North America
Latin America
Other regions
165 158 149 28
0 200 400 600
Europe
Asia-Pacific
North America
Latin America
Other regions
Total market size (global 3PL revenues 2010)
$542 billion
Source: Armstrong & Associates, 2011
% of respondents that use a 3PL (third-party logistics) provider
Deutsche Bank Equities Conference
Frankfurt, May 15, 2012 11 11
0%
1%
2%
3%
4%
5%
6%
DH
L
K+
N
DB
Sc
he
nk
er
Pa
na
lpin
a
Nip
po
n E
xp
res
s
UP
S S
CS
Ex
pe
dit
ors
Ge
od
is
Ce
va
SD
V
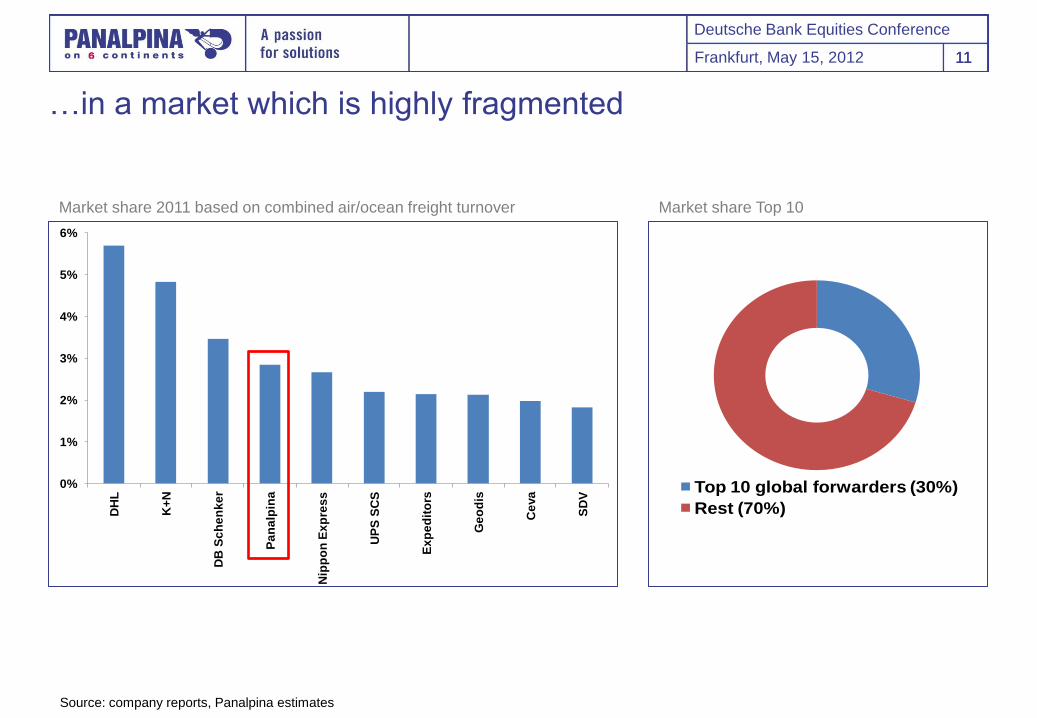
…in a market which is highly fragmented
Top 10 global forwarders (30%)
Rest (70%)
Market share 2011 based on combined air/ocean freight turnover Market share Top 10
Source: company reports, Panalpina estimates

Deutsche Bank Equities Conference
Frankfurt, May 15, 2012 12 12
To achieve ambitious growth targets, Panalpina picked its battles
Dimension Focus Achievements
Geographies US, Mercosur, Middle East,
China, India, Central Europe
Clear strategic plans on Area
level, some grey spots to be
considered
Tradelanes Ex-Asia: FEWB, TPEB, Asia-ME,
Intra-Asia, Asia-Latam
Various investments
Industry
Verticals
Hi-Tech, Healthcare, Oil & Gas,
Consumer & Retail, Pan Projects
Significant progress since last
year
Products Air Freight, Ocean Freight;
Supporting: Logistic VAS,
Customs Brokerage
Organizational structures
strengthened, new products
introduced, visibility enhanced
Productivity Operations Transformation SAP-TM implementation started,
impact of Operations Transform-
ation Program not yet visible

Deutsche Bank Equities Conference
Frankfurt, May 15, 2012 13 13
The organization has been refined, regional mgmt team completed Introduction of regional structure as of mid-year
Board of Directors
Chief Legal Officer/Corp Sec.
Christoph Hess
Chief Financial Officer
Robert Erni *
Chief HR Officer
Alastair Robertson
Chief Operating Officer
Karl Weyeneth
• Corporate Legal Services
• Government Affairs
• Corporate Insurance
Management
• HR Processes & Projects
• International Compensation &
Benefits
• HR Operations
• Capability Development &
Panalpina Academy
• Corp Dev., Agent Relations
• Corp Communications
• Air Freight
• Ocean Freight
• Logistics
• Sales & Marketing
• Supply Chain Solutions/Industry
Verticals
• Business Processes &
Quality
Chief Executive Officer
Monika Ribar
• Corporate Audit
• Corp Compliance
• Corporate Accounting
• Corporate Taxes
• Corporate Controlling
• Investor Relations
• Indirect Purchasing
• Strategic Finance & Projects
• Group Treasury
• Corporate Information
Technology**
Europe/Middle East
Volker Böhringer Americas
Ferdinand Kurt *
Asia Pacific
Marco Gadola
Areas Europe/Middle East Areas Americas Areas Asia Pacific
• Area Sub-Saharan Africa
Executive Board (EB) Committee Members Executive Committee = + * starting dates yet to be confirmed
** new CIO to be announced in due course

Deutsche Bank Equities Conference
Frankfurt, May 15, 2012 14 14
Implementation of corporate strategy brings along a variety of investments and productivity initiatives
Productivity initiatives:
Workflow-based processes as key
productivity driver of SAP TM implementation
(Event Management)
Rate standardization program
E-File
Customer connectivity on bookings
Carrier EDI connectivity
• Panalpina remains committed to invest selectively in order to execute the corporate strategy
• Various initiatives contribute to a sustainable increase of operational productivity
Planned investments:
(Lean) regional setup headed by three
Regional CEOs (Americas, EME, APAC)
Completion of product division structures
(niche products, Logistics competence
centers, order management capabilities)
IT / SAP TM
Further investments into growth markets
(network expansion, new services)

Deutsche Bank Equities Conference
Frankfurt, May 15, 2012 15 15
Roll-out of SAP TM acts as a key productivity driver
Productivity drivers:
Streamlined and standardized
processes
Automation/reduction of manual
steps
Enhanced coordination of
shipment processing
Faster billing and costing 2012 2014 2015
>10%
Enhanced functionalities:
Structured data fields for easier
EDI connectivity
Standardized master data
Decommissioning of local stand-
alone applications
SAP TM roll-out: milestones and productivity
2013
SAP TM
Ocean
(major
countries)
SAP TM
Air
(major
countries)
SAP TM Air/Ocean
(remaining countries)
Pro
ductivity incre
ase

Deutsche Bank Equities Conference
Frankfurt, May 15, 2012 16 16
Panalpina‟s priorities in 2012
Implement Sales Excellence
Grow above market
Drive operational productivity
Step up Logistics performance
Boost end-to-end Supply Chain Solutions

Deutsche Bank Equities Conference
Frankfurt, May 15, 2012 17 17
Market leadership in
freight forwarding &
end-to-end supply
chain solutions
High returns on capital
due to asset-light
business model
Excellent long-term
industry growth
prospects
Value delivery through
globally standardized
IT systems
Industry leadership in
terms of compliance
Global network with
diversification across
industries and trade
lanes
Panalpina – reasons to invest

Deutsche Bank Equities Conference
Frankfurt, May 15, 2012 18 18
Disclaimer
Investing in the shares of Panalpina World Transport Holding Ltd involves risks. Prospective investors are strongly requested to
consult their investment advisors and tax advisors prior to investing in shares of Panalpina World Transport Holding Ltd.
This document contains forward-looking statements which involve risks and uncertainties. These statements may be identified by
such words as “may”, “plans”, “expects”, “believes” and similar expressions, or by their context. These statements are made on the
basis of current knowledge and assumptions. Various factors could cause actual future results, performance or events to differ
materially from those described in these statements. No obligation is assumed to update any forward-looking statements. Potential
risks and uncertainties include such factors as general economic conditions, foreign exchange fluctuations, competitive product and
pricing pressures and regulatory developments.
The information contained in this document has not been independently verified and no representation or warranty, express or
implied, is made to, and no reliance should be placed on, the fairness, accuracy, completeness or correctness of the information or
opinions contained herein. The information in this presentation is subject to change without notice, it may be incomplete or
condensed, and it may not contain all material information concerning the Panalpina Group. None of Panalpina World Transport
Holding Ltd or their respective affiliates shall have any liability whatsoever for any loss whatsoever arising from any use of this
document, or its content, or otherwise arising in connection with this document.
This document does not constitute, or form part of, an offer to sell or a solicitation of an offer to purchase any shares and neither it
nor any part of it shall form the basis of, or be relied upon in connection with, any contract or commitment whatsoever. This
information does neither constitute an offer to buy shares of Panalpina World Transport Holding Ltd nor a prospectus within the
meaning of the applicable Swiss law.