deutsche bank brics metals & mining conference · 2015-01-15 · bubble size = gdp of us$5...
TRANSCRIPT

Deutsche Bank BRICS Metals & Mining Conference Andrew Mackenzie Chief Executive Non-Ferrous 2 November 2011
Jansen Project Site, Saskatchewan

Disclaimer
Reliance on Third Party Information The views expressed here contain information that has been derived from publicly available sources that have not been independently verified. No representation or warranty is made as to the accuracy, completeness or reliability of the information. This presentation should not be relied upon as a recommendation or forecast by BHP Billiton.
Forward Looking Statements This presentation includes forward-looking statements within the meaning of the U.S. Securities Litigation Reform Act of 1995 regarding future events and the future financial performance of BHP Billiton. These forward-looking statements are not guarantees or predictions of future performance, and involve known and unknown risks, uncertainties and other factors, many of which are beyond our control, and which may cause actual results to differ materially from those expressed in the statements contained in this presentation. For more detail on those risks, you should refer to the sections of our annual report on Form 20-F for the year ended 30 June 2011 entitled “Risk factors”, “Forward looking statements” and “Operating and financial review and prospects” filed with the U.S. Securities and Exchange Commission.
No Offer of Securities Nothing in this presentation should be construed as either an offer to sell or a solicitation of an offer to buy or sell BHP Billiton securities in any jurisdiction.
Non-GAAP Financial Information BHP Billiton results are reported under International Financial Reporting Standards (IFRS). References to Underlying EBIT and EBITDA exclude any exceptional items. A reconciliation to statutory EBIT is contained within the profit announcement, available at our website www.bhpbilliton.com.
Andrew Mackenzie, Group Executive and Chief Executive Non-Ferrous Slide 2

Disclaimer
Slide 3 Andrew Mackenzie, Group Executive and Chief Executive Non-Ferrous
Province Measured Resource (Mt)
Indicated Resource (Mt)
Inferred Resource (Mt)
Range of Potential Mineralisation (Bt)
BHP Billiton interest
Low Mid High %
Western Australia Iron Ore 2,210 3,871 13,240 16 32 48 88
Samarco JV 2,200 2,329 1,551 50
Olympic Dam 1,408 @ 1.08% Cu 4,571 @ 0.88% Cu 3,150 @ 0.74% Cu 1.2 @ 1.08% Cu 2.4 @ 1.08% Cu 3.6 @ 1.08% Cu 100
Queensland Coal 2,812 5,293 4,889 14 26 30 55
Illawarra Coal 297 381 503 100
Potash – 3,250 @ 25.4% K2O 119 @ 26.7% K2O 2.7 5.4 8.1 100
Escondida 3,102 @ 0.75% Cu 4,670 @ 0.59% Cu 11,730 @ 0.49% Cu 16 @ 0.4-0.6% Cu 23 @ 0.4-0.6% Cu 43 @ 0.5-0.6% Cu 57.5
Cerro Colorado 153 @ 0.65% Cu 188 @ 0.66% Cu 83 @ 0.64% Cu 100
Spence 219 @ 0.99% Cu 118 @ 0.65% Cu 8.2 @ 0.51% Cu 100
Antamina 188 @ 0.85% Cu 1,018 @ 0.92% Cu 708 @ 0.73% Cu 33.75
Exploration Targets and Mineral Resources This presentation includes information on Exploration Targets (Potential Mineralisation) and Mineral or Coal Resources. Mineral Resources are compiled by: P Whitehouse (MAusIMM) – Western Australian Iron Ore (WAIO) and Samarco, S O’Connell (MAusIMM) – Olympic Dam, A Paul (MAusIMM) – Queensland Coal and Illawarra Coal, T J Kilroe (MAusIMM) – Saskatchewan Potash, and R Preece (FAusIMM) – Escondida mineral district, Cerro Colorado, Spence and Antamina. This is based on Mineral Resource information in the BHP Billiton 2011 Annual Report for all assets which can be found at www.bhpbilliton.com.
Exploration Targets (Potential Mineralisation) are compiled by: WAIO: J Knight (MAIG); Olympic Dam: S O’Connell (MAusIMM); Queensland Coal: A Paul (MAusIMM); Potash: J McElroy (MAusIMM); Escondida: J des Rivieres (IGI) – (reported in BHP Billiton Preliminary Results Presentation, 19 August 2011 and updated for WAIO in its Financial Community Briefing, 27 September 2011).
All information is reported under the ‘Australasian Code for Reporting of Exploration Results, Mineral Resources and Ore Reserves, 2004’ (the JORC Code) by the above-mentioned persons who are employed by BHP Billiton and have the required qualifications and experience to qualify as Competent Persons for Mineral or Coal Resources or Exploration Results under the JORC Code.
The compilers verify that this report is based on and fairly reflects the Exploration Targets and Mineral Resources information in the supporting documentation and agree with the form and context of the information presented.
Mineral Resource classification and Potential Mineralisation Ranges (100% basis) for each province , where relevant, are contained in Table 1.
Table 1

Agenda
Long term supply demand fundamentals remain intact
Positioned to capture the opportunity, today and tomorrow
Strong margins and returns reflect the quality of our business
Our tier 1, diversified resource portfolio generates more options for shareholder value creation
Developing large, high return, organic growth projects focused on our chosen commodities
Delivering strong and sustainable production growth
Andrew Mackenzie, Group Executive and Chief Executive Non-Ferrous Slide 4

Long term supply demand fundamentals remain intact
Andrew Mackenzie, Group Executive and Chief Executive Non-Ferrous Slide 5
China
India
US
Eurozone
Japan
South Korea
Australia
Brazil
Canada
Chile Russia
South Africa
India 2030
China 2030
US 1980
Japan 1980
0
10
20
30
40
50
0 200 400 600 800 1,000 1,200 1,400 1,600
Source: Global Insight; BHP Billiton analysis. 1. All figures for 2009 unless mentioned otherwise.
Population (million persons)
Bubble size = GDP of US$5 trillion (real 2005 PPP)
World GDP per capita1
(US$’000, real 2005 PPP)

Supply likely to remain constrained
Bowen Basin cumulative rainfall (millimetres)
0
700
1,400
Jul
Aug
Sep
Oct
Nov
Dec
Jan
Feb
Mar
Apr
May
Jun
FY11
FY01 – FY10 average
Source: www.bom.gov.au.
Short term disruptions to existing supply – Queensland metallurgical coal – Indian iron ore – Chilean copper – Middle Eastern/North African oil
Underdelivery of ambitious growth targets a likely indicator of future performance – Cost inflation – Tight labour markets – Plant and equipment shortages – Approvals/regulatory processes – Financial liquidity/funding
1. Denotes shortfall in global CY11 production as forecast by Macquarie Commodities Research in August 2011 compared with June 2008. Production refers to seaborne iron ore, seaborne metallurgical coal (ex-USA supply) and mined copper (including SX-EW production).
Underdelivery of production forecasts¹
(%)
(15)% (10)% (5)% 0%
Iron ore
Metallurgical coal
Copper
Source: Macquarie Commodities Research, August 2011.
Andrew Mackenzie, Group Executive and Chief Executive Non-Ferrous Slide 6

50
100
150
200
250
0 5 10 15 20 25 30 35 40 45 50
GDP per capita (2005 real US$’000, PPP basis)
Commodity intensity evolves with economic development
Andrew Mackenzie, Group Executive and Chief Executive Non-Ferrous
Electricity
USA (Demand Index1)
Slide 7
Steel
Copper
Emerging Economies
Developed Economies
Corn and soybean
Meat
Source: World Bank; Brook Hunt; CRU; IISI; Global Insight; CISA; worldsteel; JBS; IEA; BHP Billiton analysis. 1. The demand intensity index represents the volume consumption per capita consumption, 1968 as 100 for each of the commodities.

Positioned to capture the opportunity, today and tomorrow
Ferrous generates the most significant proportion of our Underlying EBIT today, consistent with the steel intensive nature of early stage Chinese economic growth
Our uniquely diversified portfolio ensures our earnings mix will evolve as developing world demand matures
Jansen (potash), Olympic Dam (copper, gold, uranium) and our shale gas investments further position us for that evolution in commodities demand
Andrew Mackenzie, Group Executive and Chief Executive Non-Ferrous Slide 8
0
5
10
15
20
25
30
35
Underlying EBIT¹
(FY11, US$ billion)
Ferrous 51.6%
Non Ferrous 25.5%
Energy 22.9%
Energy Coal
Manganese
Petroleum
D&SP SSM
Metallurgical Coal
Base Metals
Iron Ore
1. Excludes third party trading activities.
Aluminium

Strong margins and returns reflect the quality of our business
Underlying return on capital (%)
Underlying EBIT margin1
(%)
0
10
20
30
40
50
60
FY07 FY08 FY09 FY10 FY11
Peer group BHP Billiton 1. Includes third party trading activities. Note: Peer group includes Rio Tinto, Vale, Anglo American and Xstrata. Source: Annual Reports, press releases and BHP Billiton analysis.
Slide 9
0
10
20
30
40
50
FY07 FY08 FY09 FY10 FY11
Andrew Mackenzie, Group Executive and Chief Executive Non-Ferrous

Our tier 1, diversified resource portfolio generates more options for shareholder value creation
Slide 10 Andrew Mackenzie, Group Executive and Chief Executive Non-Ferrous
Saskatchewan Potash
Escondida mineral district Copper
Queensland Coal Western Australia
Iron Ore
Onshore US Petroleum¹
The Inventory Life is estimated from the Mineral Inventory (sum of Potential Mineralisation and Mineral Resources) stated on a 100% basis. The detailed breakdown of Mineral Resources for all assets are shown in the FY11 Annual Report. The range of Potential Mineralisation is estimated from geological information including boreholes, outcrops and geophysical information. The potential quantity is conceptual in nature, there has been insufficient exploration to define a Mineral Resource and it is uncertain if further exploration will result in the determination of a Mineral Resource. It should not be expected that the quality of the Potential Mineralisation is equivalent to that of the Mineral Resource. The Minimum Mineral Inventory or Inventory Life in years is the Mineral Inventory divided by the FY11 production rate (for Potash this is the expected FY20 production rate) and does not imply that any mine planning has been completed. In Mineral Provinces (e.g. Pilbara, Bowen Basin) the inventory life of individual mines may be more or less than the number stated above. Refer to disclaimer on slide 3 as presented on 2 November 2011. 1. Includes interests in the Fayetteville shale and Petrohawk Energy Corporation. Petroleum Reserves (Proved and Probable) are defined according to US SEC definitions. Petroleum Contingent Resources
are 2C resources defined according to the Society of Petroleum Engineers Petroleum Resource Management System (SPE PRMS). Petrohawk Proved Reserves and Risked Potential Resources from Petrohawk public statements.
Legend
Ratio (years) Minerals - Minimum Mineral Inventory life at FY11 production rates Petroleum – Minimum inventory life based on FY11 production rates
Resource
Potential Mineralisation 100+
200+ 100+
100+
100+
100+ Olympic Dam
Copper/Uranium
100+

25
35
45
55
65
75
0 5,000 10,000 15,000 20,000
A large, low cost and ideally located iron ore business with significant expansion potential
Andrew Mackenzie, Group Executive and Chief Executive Non-Ferrous Slide 11
Global iron ore deposits¹ (average Fe grade, %)
Western Australia Iron Ore
Samarco
Source: Annual Reports, press releases and BHP Billiton FY11 Annual Report. Refer to disclaimer on slide 3 as presented on 2 November 2011. Note: Bubble size represents estimated annual equity production from current operations and approved projects only. 1. Based on a selection of iron ore peers that provides a fair representation of the industry. Excludes Vale. Source: Macquarie Research, March 2011.
Resource (million tonnes, equity share)
Our WAIO resource represents a significant competitive advantage
Total mineral resource of approximately 19 billion tonnes in addition to between 16 and 48 billion tonnes of potential mineralisation within 250 km (100% basis)
Our hub based, modular development model will leverage long life infrastructure and drive strong investment returns
Iron ore cost curve – fines (US$ per tonne, CIF China equivalent basis)
Cumulative volume (million tonnes)
120
80
0 0 350 700 1,050 1,400
BHP Billiton Western Australia
Iron Ore
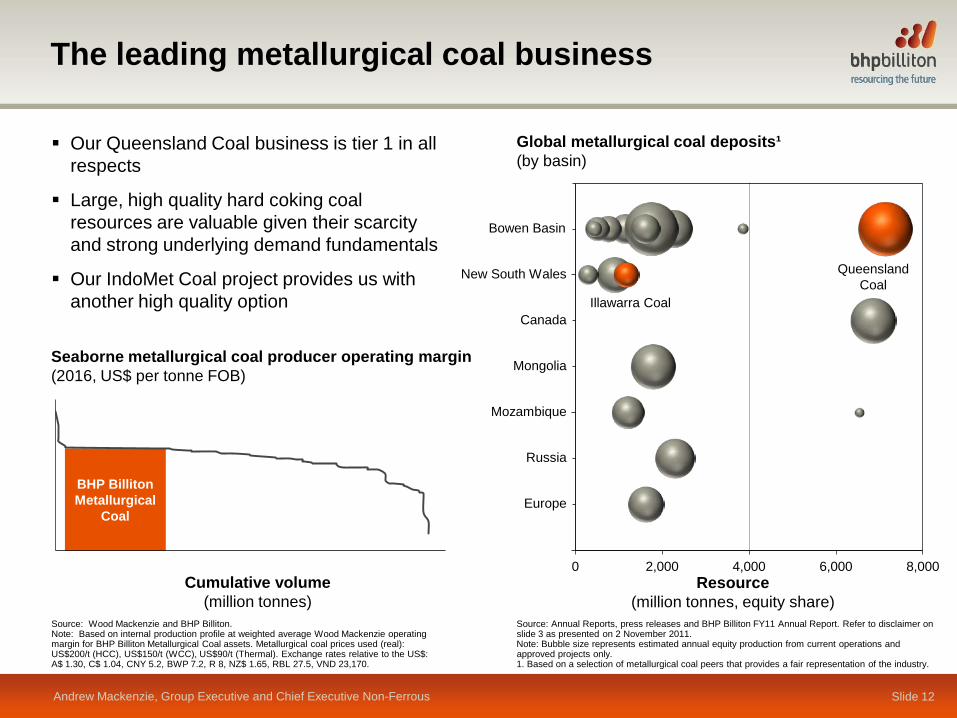
The leading metallurgical coal business
Andrew Mackenzie, Group Executive and Chief Executive Non-Ferrous Slide 12
Source: Wood Mackenzie and BHP Billiton. Note: Based on internal production profile at weighted average Wood Mackenzie operating margin for BHP Billiton Metallurgical Coal assets. Metallurgical coal prices used (real): US$200/t (HCC), US$150/t (WCC), US$90/t (Thermal). Exchange rates relative to the US$: A$ 1.30, C$ 1.04, CNY 5.2, BWP 7.2, R 8, NZ$ 1.65, RBL 27.5, VND 23,170.
Our Queensland Coal business is tier 1 in all respects
Large, high quality hard coking coal resources are valuable given their scarcity and strong underlying demand fundamentals
Our IndoMet Coal project provides us with another high quality option
0 2,000 4,000 6,000 8,000
Global metallurgical coal deposits¹ (by basin)
New South Wales
Bowen Basin
Canada
Mongolia
Mozambique
Russia
Europe
Queensland Coal
Illawarra Coal
Source: Annual Reports, press releases and BHP Billiton FY11 Annual Report. Refer to disclaimer on slide 3 as presented on 2 November 2011. Note: Bubble size represents estimated annual equity production from current operations and approved projects only. 1. Based on a selection of metallurgical coal peers that provides a fair representation of the industry.
Resource (million tonnes, equity share)
BHP Billiton Metallurgical
Coal
Seaborne metallurgical coal producer operating margin (2016, US$ per tonne FOB)
Cumulative volume (million tonnes)

Large and expandable Base Metals assets
Andrew Mackenzie, Group Executive and Chief Executive Non-Ferrous Slide 13
Long life assets in the South American copper belt
Tier 1 resources support long term, modular expansion
Olympic Dam, a low cost producer in its expanded state
0.00
0.20
0.40
0.60
0.80
1.00
0 7,000 14,000 21,000
Global copper deposits¹ (Cu grade excluding by-products1, %)
Source: Brook Hunt Q3 2011, 2010 C1 cash cost (normal costing).
3.00
Escondida
Olympic Dam Spence
Cerro Colorado Antamina
Source: Annual Reports, press releases and BHP Billiton FY11 Annual Report. Refer to disclaimer on slide 3 as presented on 2 November 2011. Note: Bubble size represents estimated annual equity metal production from current operations and approved projects only. 1. Based on a selection of copper peers that provides a fair representation of the industry. Grades not inclusive of by-product credits which can be significant, particularly in the case of poly-metallic resources such as Olympic Dam.
Resource (million tonnes, equity share)
C1 cash cost (US cents per pound Cu)
Escondida
Antamina Spence
Cerro Colorado
Olympic Dam
OD, a low cost producer in its expanded state
Cumulative volume (million tonnes)

Developing a world class presence in potash
Andrew Mackenzie, Group Executive and Chief Executive Non-Ferrous Slide 14
Source: CRU and BHP Billiton analysis. 1. BHP Billiton FY11 Annual Report. Refer to disclaimer on slide 3 as presented on 2 November 2011.
Prospective Jansen production in the context of major producers’ total current production (million tonnes product, equity share)
0
2
4
6
8
10
12
Source: Annual Reports, Company Presentations, BHP Billiton. Note: All forms of potash included.
BHP Billiton Jansen at capacity
A large presence in the world’s major potash basin
3 billion tonnes of resource identified at Jansen to date¹
Significant mineralisation potential at other project and exploration areas
Large, modern Jansen mine to be a low cost producer
Export cost curve (2020, US$ per tonne FOB)
BHP Billiton Jansen
Cumulative volume (million tonnes)
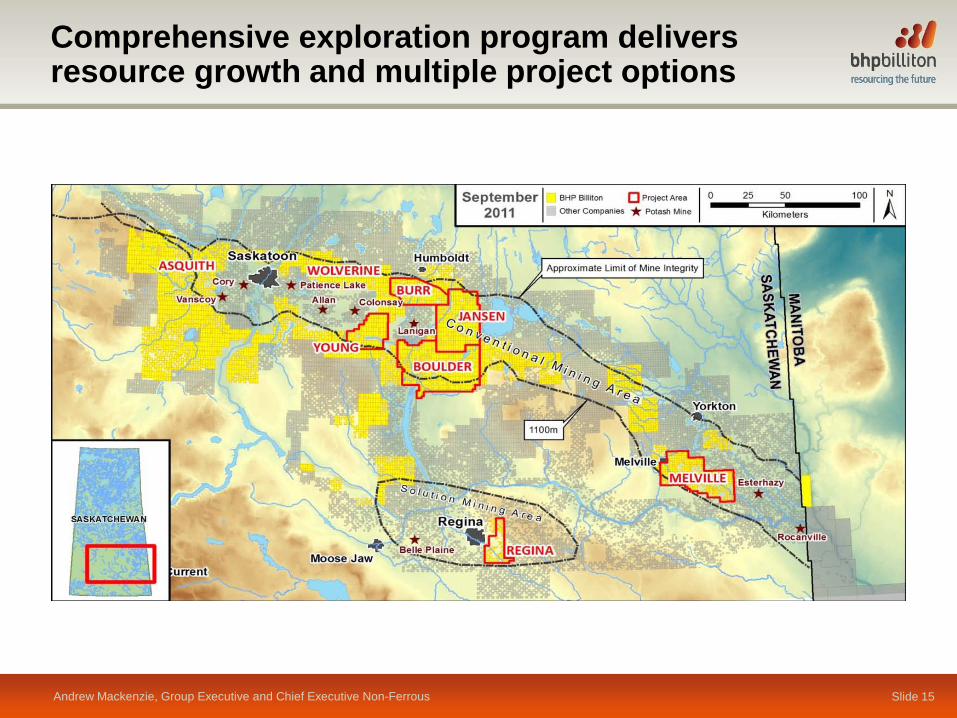
Comprehensive exploration program delivers resource growth and multiple project options
Andrew Mackenzie, Group Executive and Chief Executive Non-Ferrous Slide 15
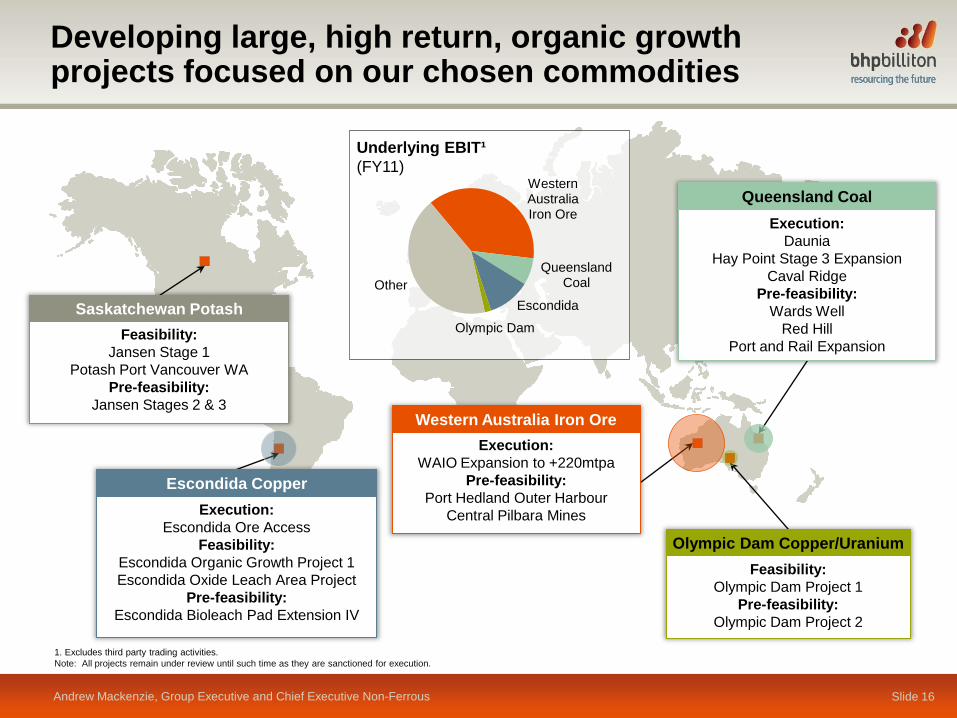
Developing large, high return, organic growth projects focused on our chosen commodities
Execution: Escondida Ore Access
Feasibility: Escondida Organic Growth Project 1 Escondida Oxide Leach Area Project
Pre-feasibility: Escondida Bioleach Pad Extension IV
Escondida Copper
Feasibility: Jansen Stage 1
Potash Port Vancouver WA Pre-feasibility:
Jansen Stages 2 & 3
Saskatchewan Potash
Execution: Daunia
Hay Point Stage 3 Expansion Caval Ridge
Pre-feasibility: Wards Well
Red Hill Port and Rail Expansion
Queensland Coal
Execution: WAIO Expansion to +220mtpa
Pre-feasibility: Port Hedland Outer Harbour
Central Pilbara Mines
Western Australia Iron Ore
Feasibility: Olympic Dam Project 1
Pre-feasibility: Olympic Dam Project 2
Olympic Dam Copper/Uranium
Western Australia Iron Ore
Queensland Coal
Escondida
Olympic Dam
Other
Underlying EBIT¹ (FY11)
1. Excludes third party trading activities. Note: All projects remain under review until such time as they are sanctioned for execution.
Andrew Mackenzie, Group Executive and Chief Executive Non-Ferrous Slide 16
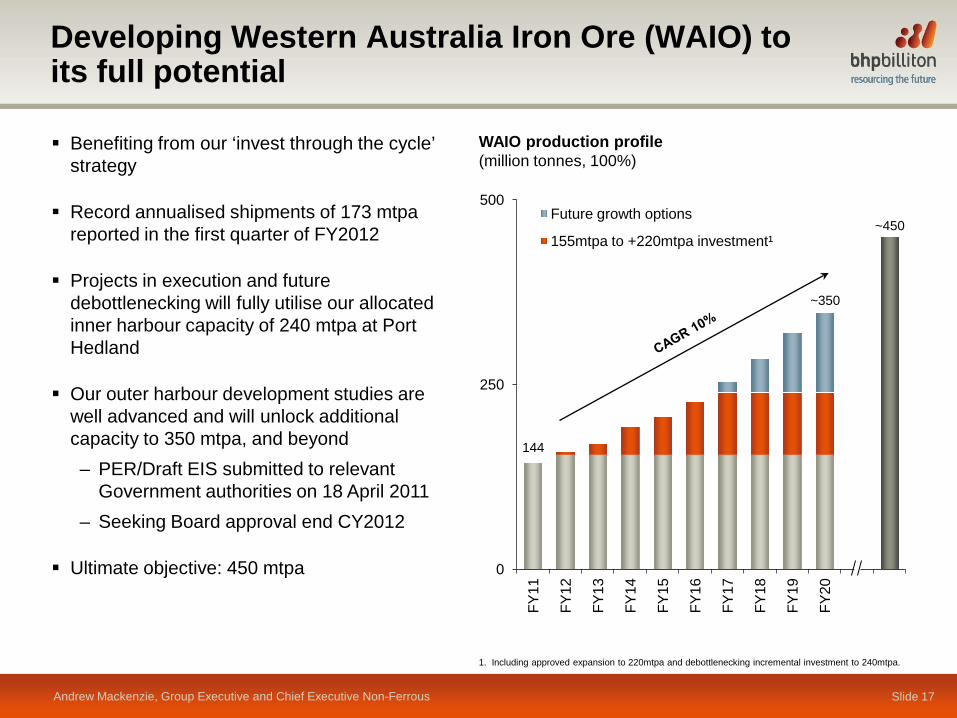
WAIO production profile (million tonnes, 100%)
Developing Western Australia Iron Ore (WAIO) to its full potential
0
250
500
FY11
FY12
FY13
FY14
FY15
FY16
FY17
FY18
FY19
FY20
Future growth options
155mtpa to +220mtpa investment¹
~350
~450
144
1. Including approved expansion to 220mtpa and debottlenecking incremental investment to 240mtpa.
Andrew Mackenzie, Group Executive and Chief Executive Non-Ferrous Slide 17
Benefiting from our ‘invest through the cycle’ strategy
Record annualised shipments of 173 mtpa reported in the first quarter of FY2012
Projects in execution and future debottlenecking will fully utilise our allocated inner harbour capacity of 240 mtpa at Port Hedland
Our outer harbour development studies are well advanced and will unlock additional capacity to 350 mtpa, and beyond – PER/Draft EIS submitted to relevant
Government authorities on 18 April 2011 – Seeking Board approval end CY2012
Ultimate objective: 450 mtpa
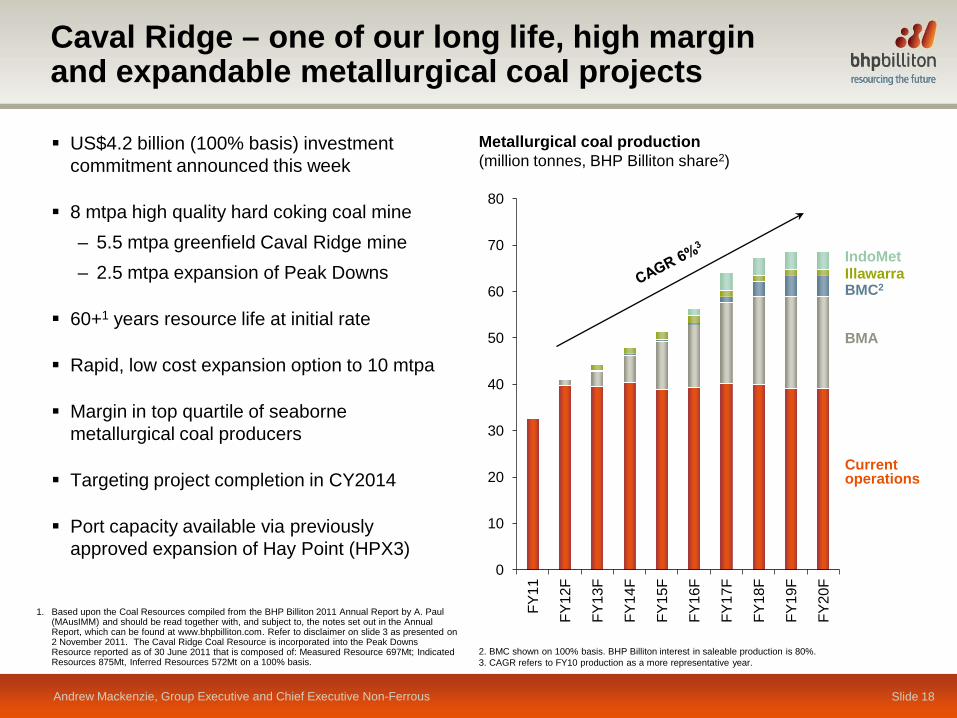
Caval Ridge – one of our long life, high margin and expandable metallurgical coal projects
Andrew Mackenzie, Group Executive and Chief Executive Non-Ferrous Slide 18
US$4.2 billion (100% basis) investment commitment announced this week
8 mtpa high quality hard coking coal mine – 5.5 mtpa greenfield Caval Ridge mine – 2.5 mtpa expansion of Peak Downs
60+1 years resource life at initial rate
Rapid, low cost expansion option to 10 mtpa
Margin in top quartile of seaborne metallurgical coal producers
Targeting project completion in CY2014
Port capacity available via previously approved expansion of Hay Point (HPX3)
0
10
20
30
40
50
60
70
80
FY11
FY12
F
FY13
F
FY14
F
FY15
F
FY16
F
FY17
F
FY18
F
FY19
F
FY20
F
Current operations
BMC2
IndoMet
BMA
Illawarra
Metallurgical coal production (million tonnes, BHP Billiton share2)
1. Based upon the Coal Resources compiled from the BHP Billiton 2011 Annual Report by A. Paul (MAusIMM) and should be read together with, and subject to, the notes set out in the Annual Report, which can be found at www.bhpbilliton.com. Refer to disclaimer on slide 3 as presented on 2 November 2011. The Caval Ridge Coal Resource is incorporated into the Peak Downs Resource reported as of 30 June 2011 that is composed of: Measured Resource 697Mt; Indicated Resources 875Mt, Inferred Resources 572Mt on a 100% basis.
2. BMC shown on 100% basis. BHP Billiton interest in saleable production is 80%. 3. CAGR refers to FY10 production as a more representative year.

Escondida – the world’s leading copper mine
129% increase in the Escondida Mineral Resource reported in CY20111
Escondida Ore Access project establishes the pathway to higher grades and production in FY2013 and beyond
Potential to significantly increase throughput rates with a modular approach to expansion
Large SAG mills will leverage proven technologies and standardised designs
Escondida ore processing capacity (million tonnes per annum)
1. Competent Person: Richard Preece (FAusIMM,). The Mineral Resources reported here on 100% basis were compiled from the BHP Billiton 2011 Annual Report by R. Preece and should be read together with, and subject to, the notes set out in the Annual Report, which can be found at www.bhpbilliton.com. This information is reported under the ‘Australasian Code for Reporting of Exploration Results, Mineral Resources and Ore Reserves, 2004’ (the JORC Code) by the above named Competent Persons who is employed by BHP Billiton and has the required qualifications and experience to estimate and report Mineral Resources under the JORC Code. Richard Preece verifies that this report is based on, and fairly reflects, the Mineral Resources information in the supporting documentation and agrees with the form and context information presented. The 2011 Mineral Resources, reported as of 30 June 2011 are composed of: Measured Resources 3.1Bt @ 0.75% Cu; Indicated Resources 4.7Bt @ 0.59% Cu; and Inferred Resources 11.7Bt @ 0.49% Cu and include the Escondida, Pampa Escondida, and Pinta Verde mineral deposits.
Slide 19 Andrew Mackenzie, Group Executive and Chief Executive Non-Ferrous
0
200
400
600
Note: Conceptual representation of our conveyor belt of growth options.
OGP1 OGP2
OGPs
Escondida, Chile

Olympic Dam Project will maximise returns from a truly unique and world class resource
Andrew Mackenzie, Group Executive and Chief Executive Non-Ferrous Slide 20
Overburden
Environmental Impact Statement approved by State and Federal Governments and new indenture agreement signed with the South Australian Government in October
Open pit could extract up to 85% of the total resource (~79 million tonnes of contained copper) compared to ~10% with the existing underground configuration
Open pit strip ratios will decline in the decades to come, while grades will remain robust
Potential to produce ~750,000 tpa of copper, and beyond
Recent US$1.2 billion investment pre-commitment, majority of which remains conditional on indenture agreement approval by parliament. Targeting sanction mid CY2012
-500 m
-1,000 m
-1,500 m
-2,000 m
0 m
Copper equivalent grade 0.01% ≤ to < 0.50% 0.50% ≤ to < 1.00% 1.00% ≤ to < 2.00% 2.00% ≤ to < 30.00%
500m
Olympic Dam ore body long section

Olympic Dam Project will maximise returns from a truly unique and world class resource
Andrew Mackenzie, Group Executive and Chief Executive Non-Ferrous Slide 21
-500 m
-1,000 m
-1,500 m
-2,000 m
0 m
Copper equivalent grade 0.01% ≤ to < 0.50% 0.50% ≤ to < 1.00% 1.00% ≤ to < 2.00% 2.00% ≤ to < 30.00%
500m
open pit
Environmental Impact Statement approved by State and Federal Governments and new indenture agreement signed with the South Australian Government in October
Open pit could extract up to 85% of the total resource (~79 million tonnes of contained copper) compared to ~10% with the existing underground configuration
Open pit strip ratios will decline in the decades to come, while grades will remain robust
Potential to produce ~750,000 tpa of copper, and beyond
Recent US$1.2 billion investment pre-commitment, majority of which remains conditional on indenture agreement approval by parliament. Targeting sanction mid CY2012
Olympic Dam ore body long section

Slide 22
Olympic Dam will follow a similar path to the successful development of Escondida
Copper production (million tonnes per annum)
Open pit development
Andrew Mackenzie, Group Executive and Chief Executive Non-Ferrous
2.0
1.8
1.6
1.4
1.2
1.0
0.8
0.6
0.4
0.2
0.0 0 50 years
Escondida production
Conceptual Olympic Dam production Escondida historical
production
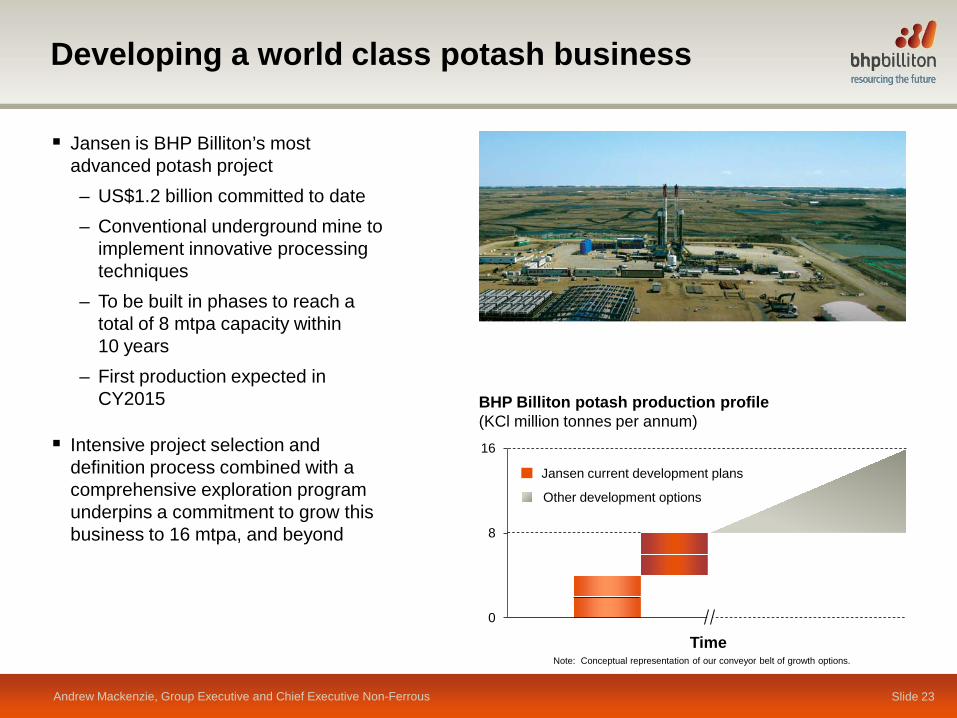
Developing a world class potash business
Andrew Mackenzie, Group Executive and Chief Executive Non-Ferrous Slide 23
Jansen is BHP Billiton’s most advanced potash project – US$1.2 billion committed to date – Conventional underground mine to
implement innovative processing techniques
– To be built in phases to reach a total of 8 mtpa capacity within 10 years
– First production expected in CY2015
Intensive project selection and definition process combined with a comprehensive exploration program underpins a commitment to grow this business to 16 mtpa, and beyond
BHP Billiton potash production profile (KCl million tonnes per annum)
Jansen Project Site, Saskatchewan
Note: Conceptual representation of our conveyor belt of growth options.
0
8
16
Time
Jansen current development plans
Other development options

Petrohawk – a substantial resource acquisition
Andrew Mackenzie, Group Executive and Chief Executive Non-Ferrous Slide 24
Total enterprise value of ~US$15.1 billion¹
Natural gas is a preferred fuel in a low carbon world
Complements our recent Fayetteville shale acquisition and adds to portfolio diversity
Significant increase in Petroleum resources
Leverages our cost of capital advantage and financial capacity to accelerate production growth
1. Includes debt as at 30 June 2011 of approximately US$3.8 billion less approximately US$800 million proceeds from sale of midstream assets; does not include penalties associated with the early retirement of Petrohawk’s debt facilities.
0
1,000
2,000
3,000
4,000
5,000
6,000
7,000
2011 Petrohawk announced
capex
FY15 FY20
Acceleration of Petrohawk’s development spend (US$ million net, real)
Range of anticipated, accelerated development
spend

Delivering strong and sustainable production growth
Andrew Mackenzie, Group Executive and Chief Executive Non-Ferrous Slide 25
0
50
100
150
200
FY11 FY15 FY20
Long term production growth
(copper equivalent units¹)
1. Production from continuing operations converted to copper equivalent units based on long term consensus price estimates where available. Indexed to 100 from FY11.
2. Production CAGR from FY11 to FY20. Includes production growth from Petrohawk Energy Corporation.
Long term supply demand fundamentals remain intact
Positioned to capture the opportunity, today and tomorrow
Strong margins and returns reflect the quality of our business
World class resource base + low cost position = superior investment returns
Developing a suite of large scale, high return, organic growth projects
