detours in bird migration
TRANSCRIPT

J. theor. Biol. (2001) 209, 319}331doi:10.1006/jtbi.2001.2266, available online at http://www.idealibrary.com on
Detours in Bird Migration
THOMAS ALERSTAM*
Department of Animal Ecology, ¸und ;niversity, Ecology Building, SE-22362 ¸und, Sweden
(Received on 19 September 2000, Accepted in revised form on 12 January 2001)
Bird migration routes often follow detours where passages across ecological barriers arereduced in extent. This occurs in spite of the fact that long barrier crossings are within thebirds' potential #ight range capacity. Long-distance #ights are associated with extra energycosts for transport of the heavy fuel loads required. This paper explores how important the fueltransport costs, estimated on the basis of #ight mechanics, may be to explain detours for birdsmigrating by #apping #ight. Maximum detours in relation to expanse of the barrier arepredicted for cases where birds travel along the detour by numerous short #ights and small fuelreserves, divide the detour into a limited number of #ight steps, and where a reduced barrierpassage is included in the detour. The principles for determining the optimum route, ofteninvolving a shortcut across part of the barrier, are derived. Furthermore, the e!ects ofdi!erences in fuel deposition rates and in transport costs for the pro"tability of detours arebrie#y considered. An evaluation of a number of observed and potential detours in relation tothe general predictions of maximum detours, indicates that reduction of fuel transport costsmay well be a factor of widespread importance for the evolution of detours in bird migration atwide ecological barriers.
( 2001 Academic Press
1. Introduction
Migratory birds are capable of storing large fuelreserves and making non-stop #ights covering4000}5000 km or even longer distances (Aler-stam, 1990; Battley et al., 2000). Still, there aremany cases where birds refrain from crossingbarriers (like sea, desert or ice) which are clearlywithin their potential #ight range capacity,but rather migrate along detours where barrierpassages are reduced in extent.
Why do the birds not migrate the direct andshortest routes to their destinations in thesecases? There are many factors a!ecting the costsand bene"ts of alternative migration routes, likedi!erences in winds and weather, stopover andfuel deposition conditions, risks of starvation,
*E-mail: [email protected]
0022}5193/01/070319#13 $35.00/0
predation, drift, and disorientation, and in costsof transport. In addition, migration routes maybe constrained to some (as yet unknown) degreeaccording to the orientation principles used bythe birds and to the historic process of geo-graphic range expansion and colonization (cf.Sutherland, 1998).
Wind has a major e!ect on the resulting cost oftransport for migrating birds, and wind patternshave an important in#uence on the evolutionof bird migration routes among landbirds andwaders (Gauthreaux, 1980) and even more pro-foundly among seabirds (Dorst, 1962; Alerstam,1990). It is also recognized that the low costof transport in thermal soaring #ight comparedwith #apping #ight promotes detours wheresoaring migrants (raptors, storks, cranes) avoidpassages that necessitate #apping #ight, to a
( 2001 Academic Press

320 T. ALERSTAM
degree that could be predicted from the relativetransport costs of the two travel modes (Aler-stam, 1981; Kerlinger, 1989). A correspondingcase is the avoidance of land crossings by sea-birds travelling by soaring #ight over thesea. Alexander (2000) evaluated some cases ofoptimum detours for animals walking or runningon ground with "rm and marshy patches, andthis can be applied generally to movement acrossareas with di!erent costs of transport.
However, detours are often found also amongbirds that migrate consistently by #apping #ight,and this is the principal situation considered inthis paper. The fuel stores of a bird contribute toraise its total body mass and body frontal area,which in turn will lead to enhanced induced andparasite drag and to increased #apping #ightcosts (Pennycuick, 1975). Hence, the marginalvalue, in terms of additional #ight range, ofa given amount of fuel decreases with the fuelload that the bird has already stored, and #ightrange is therefore a concave (negatively acceler-ated) function of fuel load (Alerstam, 1979;Alerstam & LindstroK m, 1990; Alerstam & Heden-stroK m, 1998).
This means that birds will save energy if theymigrate by short #ight steps and low fuel levelsrather than departing on long #ights with heavyfuel loads. Other things being equal, this willmake them prone to avoid barriers and accepta certain detour if they can increase the degree bywhich they travel by shorter #ight steps (the &&nu-merous-short-#ights-strategy''), as pointed out byAlerstam (1979). Since birds saving energy in thisway will need less stopover time to accumulatethe required fuel, any reduction in total energycosts will also lead to a reduced total duration ofthe migratory journey. This means that the costof heavy fuel loads may be a factor promotingdetours for birds in time- as well as energy-se-lected migration (Alerstam & LindstroK m, 1990).Piersma (1987) also discussed costs and bene"tsof migration by long and short #ights, andstressed the importance of feeding and fatteningrates at stopover sites for the optimal travelschemes.
Heavy fuel loads not only cause increased#ight costs, but there are additional possiblemass-dependent costs like increased predationrisk (HedenstroK m, 1992; Fransson & Weber,
1997), reduced foraging e$ciency (Loria &Moore, 1990; Klaassen & LindstroK m, 1996) andothers as reviewed by Witter & Cuthill (1993).These costs will further promote migration alongdetours where barrier passages are reduced inextent. However, in contrast to the mass-depen-dent #ight cost, these additional costs do notpermit any quantitative predictions about thepossible bene"ts of detours. Maintaining largefuel reserves may of course also be bene"cial asan insurance against unpredictable conditionsand risks of starvation or energetic stress.
In this contribution I will explore how impor-tant the extra energy costs for carrying fuel loadsin #ight may be to explain detours in bird migra-tion. I will derive generalized predictions aboutmaximum expected detours according to thisfactor. These predictions apply to both energy-and time-selected migration, because any savingsof energy costs will, other things being equal, beassociated with savings in the time required forenergy accumulation. Furthermore, I will con-sider the principles for optimum detours and alsobrie#y investigate the in#uence of di!erences infuel deposition rates and transport costs for thepro"tability of detours. The e!ect of di!erences infuel deposition rates along alternative routes is ofspeci"c importance for time-selected migration.Finally, I will compare predictions with someobserved detours and direct #ights at larger andsmaller barriers.
2. Maximum Detours
2.1. MAXIMUM DETOUR WITH NUMEROUS
FLIGHT STEPS
Following Alerstam (1979) and Alerstam &HedenstroK m (1998) I use two versions of therange equation for #apping #ight:
>"cA1!1
J1#fB , (1a)
>"c2
ln(1#f ), (1b)
where> is the #ight range, f the relative fuel load(fuel mass relative to lean body mass) and c isa coe$cient which depends on several factors

FIG. 1. Flight range in relation to relative fuel load.Because of mass-dependent #ight costs, #ight range is a con-cave function of fuel load. Two range functions are illus-trated, according to eqns (1a) and (1b) (cf. text), based on#ight mechanics. The extrapolated derivative from the rangecurve at f"0 shows the maximum range with no fueltransport costs.
FIG. 2. The maximum predicted extra distance D alonga detour (where the birds travel by numerous short #ightsand negligible fuel loads) is given by the di!erence betweenmaximum range with no fuel transport costs and the barrierdistance. This di!erence is calculated for the amount of fuelrequired to cross the barrier in a single #ight step.
BIRD MIGRATION 321
such as fuel composition, muscle work e$ciency,bird morphology and wind. These equations arebased on #ight mechanical theory (Pennycuick,1975), assuming that fuel load increases bothinduced and parasite drag of an ideal #yingbird (a) or only the former component (b). Pre-sumably, the true relationship is intermediatebetween the two equations (Alerstam & Heden-stroK m, 1998), especially in view of the fact thatmigrating birds show changes in mass of muscles(Pennycuick, 1998; LindstroK m et al., 2000) anddigestive organs (Piersma et al., 1999; Battleyet al., 2000), which serve to mitigate the highmass-dependent costs of long-distance #ights.
These two functions are illustrated in Fig. 1along with the maximum range with no fueltransport costs:
>max
"
c2
f. (2)
This linear relationship corresponds to the deriv-ative of > with respect to f according to eqns(1a, b) at f"0, giving the total range attained bycumulative short #ights (with negligible fuel load)for a given total amount of energy (expressed asf ) consumed during these #ights.
Considering a certain barrier distance >bas in
Fig. 2, a bird will be able to travel an extradistance D (">
max!>
b) on the same amount of
fuel if it can do it by short #ights (negligible fuelloads) rather than in a single long-distance #ight.Hence, detours may be economical up to amaximum detour ratio of
D>
b
"
f
2(1!1/J1#f )!1, (3a)
D>
b
"
fln (1#f )
!1, (3b)
where >b
and >max
are given by eqns (1) and(2), respectively, and f is the fuel load requiredto cross barrier distance >
b. By relating the
extra distance D (">max
!>b) to >
bthe pre-
diction becomes independent of any additional&&non-barrier'' migratory distances before orafter the barrier. D is determined as the totaldistance along the detour minus the totaldistance along the direct route, and divided bythe barrier distance to give the detour ratio (cf.below).

FIG. 3. Maximum predicted extra distance D along a de-tour for a bird dividing the journey into n #ight steps. Thedi!erence D between the total range with n #ight steps andthe barrier range is calculated for the amount of fuel re-quired to cross the barrier in a single #ight. The thin lineshows the maximum range with no fuel transport costs, i.e.with n approaching in"nity.
FIG. 4. Maximum predicted detour ratios (extra distancealong detour relative to barrier distance) in relation torelative fuel load required to cross the barrier in a single#ight. Predictions are calculated for di!erent numbers of#ight steps along the detour. The upper (a) and lower panels(b) are based on eqns (4a) and (4b), respectively.
322 T. ALERSTAM
2.2. MAXIMUM DETOUR WITH N FLIGHT STEPS
Birds may also make a detour by usingstopover sites that are available as steppingstones permitting the journey to be subdividedinto a number of #ight steps rather than crossingthe barrier in one #ight step. This case is illus-trated in Fig. 3. The maximum detour ratio isgiven by
D>
b
"n(1!1/J1#f/n)
(1!1/J1#f )!1, (4a)
D>
b
"nln(1#f/n)ln (1#f )
!1, (4b)
where n is the number of #ight steps, f is fuel loadrequired to cross barrier distance >
b, and D is
>n!>
b, where>
nis the total distance covered in
n equally long #ight steps with fuel load f/n foreach step.>
nand>
bare solved from eqn (1). With
increasing n, eqns (4a, b) will approach eqns(3a, b), respectively.
The maximum predicted detour ratios accord-ing to eqns (4a, b) for barriers corrresponding todi!erent required relative fuel loads are shown inFig. 4(a) and (b) for di!erent number of #ight
steps along the detour. The maximum detourratios for the case with numerous short #ights(negligible fuel transport costs along detour) ac-cording to eqns (3a, b) are also given in these"gures.
By way of example, for a barrier requir-ing f"0.8 to be crossed in one #ight step,birds are expected to save energy by migrat-ing along a detour that is up to 14}22% longerthan the barrier distance if the passage is coveredby two equally long #ight steps rather thanone, and up to 36}57% longer than the bar-rier distance if the birds can circum#y thebarrier by numerous short #ights [Fig. 4(a)and (b)].
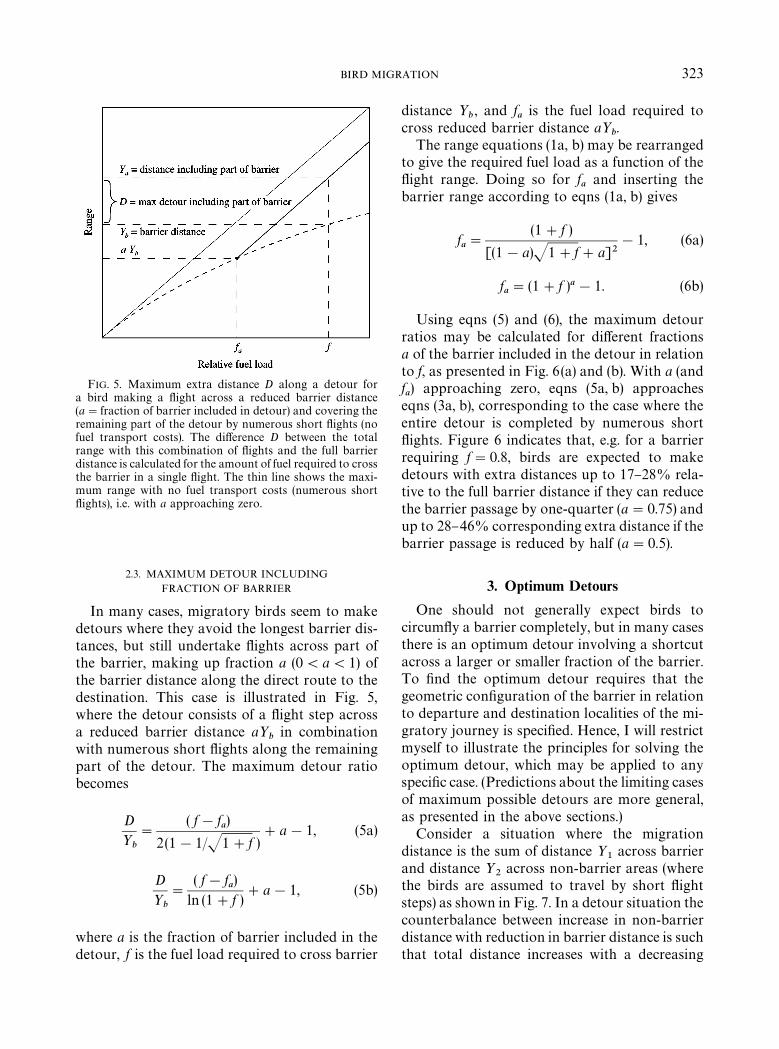
FIG. 5. Maximum extra distance D along a detour fora bird making a #ight across a reduced barrier distance(a"fraction of barrier included in detour) and covering theremaining part of the detour by numerous short #ights (nofuel transport costs). The di!erence D between the totalrange with this combination of #ights and the full barrierdistance is calculated for the amount of fuel required to crossthe barrier in a single #ight. The thin line shows the maxi-mum range with no fuel transport costs (numerous short#ights), i.e. with a approaching zero.
BIRD MIGRATION 323
2.3. MAXIMUM DETOUR INCLUDINGFRACTION OF BARRIER
In many cases, migratory birds seem to makedetours where they avoid the longest barrier dis-tances, but still undertake #ights across part ofthe barrier, making up fraction a (0(a(1) ofthe barrier distance along the direct route to thedestination. This case is illustrated in Fig. 5,where the detour consists of a #ight step acrossa reduced barrier distance a>
bin combination
with numerous short #ights along the remainingpart of the detour. The maximum detour ratiobecomes
D>
b
"
( f!fa)
2(1!1/J1#f )#a!1, (5a)
D>
b
"
( f!fa)
ln (1#f )#a!1, (5b)
where a is the fraction of barrier included in thedetour, f is the fuel load required to cross barrier
distance >b, and f
ais the fuel load required to
cross reduced barrier distance a>b.
The range equations (1a, b) may be rearrangedto give the required fuel load as a function of the#ight range. Doing so for f
aand inserting the
barrier range according to eqns (1a, b) gives
fa"
(1#f )
[(1!a)J1#f#a]2!1, (6a)
fa"(1#f )a!1. (6b)
Using eqns (5) and (6), the maximum detourratios may be calculated for di!erent fractionsa of the barrier included in the detour in relationto f, as presented in Fig. 6(a) and (b). With a (andfa) approaching zero, eqns (5a, b) approaches
eqns (3a, b), corresponding to the case where theentire detour is completed by numerous short#ights. Figure 6 indicates that, e.g. for a barrierrequiring f"0.8, birds are expected to makedetours with extra distances up to 17}28% rela-tive to the full barrier distance if they can reducethe barrier passage by one-quarter (a"0.75) andup to 28}46% corresponding extra distance if thebarrier passage is reduced by half (a"0.5).
3. Optimum Detours
One should not generally expect birds tocircum#y a barrier completely, but in many casesthere is an optimum detour involving a shortcutacross a larger or smaller fraction of the barrier.To "nd the optimum detour requires that thegeometric con"guration of the barrier in relationto departure and destination localities of the mi-gratory journey is speci"ed. Hence, I will restrictmyself to illustrate the principles for solving theoptimum detour, which may be applied to anyspeci"c case. (Predictions about the limiting casesof maximum possible detours are more general,as presented in the above sections.)
Consider a situation where the migrationdistance is the sum of distance >
1across barrier
and distance >2
across non-barrier areas (wherethe birds are assumed to travel by short #ightsteps) as shown in Fig. 7. In a detour situation thecounterbalance between increase in non-barrierdistance with reduction in barrier distance is suchthat total distance increases with a decreasing

FIG. 6. Maximum predicted detour ratios (extra distancealong detour relative to barrier distance) in relation torelative fuel load required to cross the barrier in a single#ight. Predictions are calculated for di!erent fractions of thebarrier included in the detour (assuming that the remainingpart of the detour is completed by numerous short #ightsand no fuel transport costs). The upper (a) and lower (b)panels are based on eqns (5a) and (5b), respectively.
FIG. 7. The optimum route is associated with the combi-nation of barrier and non-barrier distances that gives theminimum total energy cost. Depending on the geometry ofthe barrier the optimum route may or may not involvea passage across a signi"cant part of the barrier. For a situa-tion of monotonously increasing non-barrier distance withdecreasing barrier distance, the optimum route is associatedwith the condition in eqn (7), as indicated by the dots in thelower part of the "gure.
324 T. ALERSTAM
barrier distance (d>2/d>
1is less than !1 in the
linear case). Non-barrier distance is reduced tozero in the schematic example in Fig. 7, but mayof course be shifted to a higher level dependingon how much non-barrier distance is includedalong the shortest route.
The total energy cost E for the migratory jour-ney is the sum of fuel consumption f
1for the
barrier #ight and f2
(cumulative) for the #ightscovering the non-barrier distance. The optimumdetour is associated with minimum E, which inturn is associated with the condition:
df1
d>1
"!
df2
d>1
. (7)
The left-hand derivative can be solved fromeqn (1a, b) as
df1
d>1
"
2c
1(1!>
1/c)3
. (8a)
df1
d>1
"
2c
e2Y1@c. (8b)
For the right-hand derivative, one may notefor migration with successive short #ights (negli-gible fuel transport costs) that df
2/d>
2"2/c ac-
cording to eqn (2). Hence, for the linear case withd>
2/d>
1(!1,
df2
d>1
"
df2
d>2
d>2
d>1
(!
2c
. (9)
BIRD MIGRATION 325
It follows from eqns (7) to (9) that, under thegiven assumptions, the optimum route is ex-pected to involve a shortcut #ight across thebarrier (Y
1'0). It is the relationship between
>2
and >1, de"ned by the barrier geometry, that
determines if a detour is bene"cial and, if so, whatis the optimum shortcut across the barrier. Sum-ming up travel distances and associated energycosts across barrier/non-barrier areas, as illus-trated in Fig. 7, for speci"c cases of migratoryjourneys will permit the optimum route, asso-ciated with minimum energy costs, to be predicted.
4. Further Cases of Detours
4.1. EFFECTS OF DIFFERENCES IN FUEL
DEPOSITION RATE
So far the maximum and optimum detourshave been evaluated in terms of energy costs forthe migratory transport along alternative routes.The predictions will apply also to time-selectedmigration (Alerstam & LindstroK m, 1990) pro-vided that the rate of fuel deposition is the samefor migration along the di!erent routes (and that#apping #ight time, which is small in relation tofuel deposition time, is ignored in the time budgetof migration) and that there are no extra timecosts associated with each new stopover/fueldeposition site.
However, if fuel deposition rate di!ers betweenthe sites where birds store fat for the barriercrossings and the stopover sites along potentialdetours, this will a!ect the expected maximumdetour ratios for time-selected migration.
Considering a case where the rate of fueldeposition associated with the direct barriercrossing is k
1, while this rate is k
2at sites along
detours where the birds travel by numerous short#ights, the maximum detour ratio in time-selected migration becomes
D>
b
"
k2
k1
f
2(1!1/J1#f )!1, (10a)
D>
b
"
k2
k1
fln (1#f )
!1. (10b)
It is seen, by comparison with eqns (3a, b)for the corresponding case of energy-selected
migration, that fuel deposition rates have animportant impact on expected detours in time-selected migration. If k
2'k
1an increased pro-
pensity to make long detours, compared withpredictions for energy-selected migration, isexpected, while detours will be less favourable ifk1'k
2. Another factor that may contribute to
make detours by numerous short #ights lessfavourable is the possible costs in time and/orenergy for settling at each new stopover site(Alerstam & LindstroK m, 1990; Alerstam &HedenstroK m, 1998).
4.2. EFFECTS OF DIFFERENCES IN TRANSPORT COSTS
Consider a case where birds travel by di!erenttransport costs across barrier (high transportcost) and non-barrier (low transport cost) areas.The di!erences in transport costs may arise asa consequence of, e.g. di!erences in wind assis-tance or in #ight modes used by the birds whentravelling across the barrier and non-barrierareas, respectively. Transport cost (energy perdistance) C
1across the barrier is the e!ective
#ight power P1
divided by the e!ective speed <1.
The corresponding transport cost C2
acrossnon-barrier areas equals P
2/<
2, and C
2(C
1.
The maximum detour ratio becomes
D>
b
"
C1
C2
!1. (11)
This means that if C1
for example is 3 or 4times as high as C
2, which may well be the case
for raptors travelling by thermal soaring #ightacross land compared with #apping #ight overthe sea (cf. Alerstam, 2000), it may be economicalto make a detour involving an extra distance upto 2 or 3 times the barrier distance. The optimumroute, which may involve a shortcut across partof the barrier, can be solved, given the geometryof the barrier, as exempli"ed by Alexander (2000)or according to Section 3.
Incorporating the time aspect by assuminga rate of energy accumulation K (assumed tobe the same irrespective if the birds migrateacross the barrier or along a detour), the max-imum detour ratio associated with maximum re-sulting speed of migration (taking both energyaccumuation time and travel time into account)

FIG. 8. Map showing examples of observed and potential detours in bird migration at ecological barriers like theMediterranean Sea and Sahara desert, Atlantic Ocean and Gulf of Mexico. The cases illustrated are evaluated in Table 1 andthe text. Departure and destination localities used for distance calculations are indicated by small circles. Mercator mapprojection (not true to distance).
326 T. ALERSTAM
becomes
D>
b
"
<2
(K#P2)(K#P
1)
<1
!1, (12)
which is less than the corresponding ratio ineqn (11) given that P
1'P
2(which is the normal
situation associated with C1'C
2). This means
that, other things being equal, the tendencyto make detours will normally be somewhatlower in time- as compared to energy-selectedmigration.
5. Evaluation of Some Detours
I will now evaluate some observed or potentialdetours for birds that migrate by #apping #ight,to investigate if they are compatible or not withthe quantitative predictions in Figs 4 and 6. Anagreement with predictions means that reductionof the extra fuel transport costs associated withlong-distance #ights across barriers may be a
su$cient explanation for the evolution of theobserved detours.
The detours considered are shown on themaps of Figs 8 and 9, and distances, detourratios and fractions of barrier included in thedetours (a), or the number of #ight steps alongthe detour (n), are given in Table 1. Distan-ces have been calculated along loxodromes(di!ering by less than 2% from great circle dis-tances in the cases considered) except for thebrent goose.
To be able to compare the detours in Table 1with predictions it is necessary to estimate therelative fuel loads that correspond to the barrierranges given. This is done from eqns (1a, b), rear-ranged to give f as a function of >. I have provi-sionally assumed the coe$cient c to be 15 000 kmfor all species (Alerstam & HedenstroK m, 1998).This is a rough approximation, since birds withrelatively long and slender wings like geese orwaders are expected to have a larger coe$cientthan broad-winged warblers. However, the
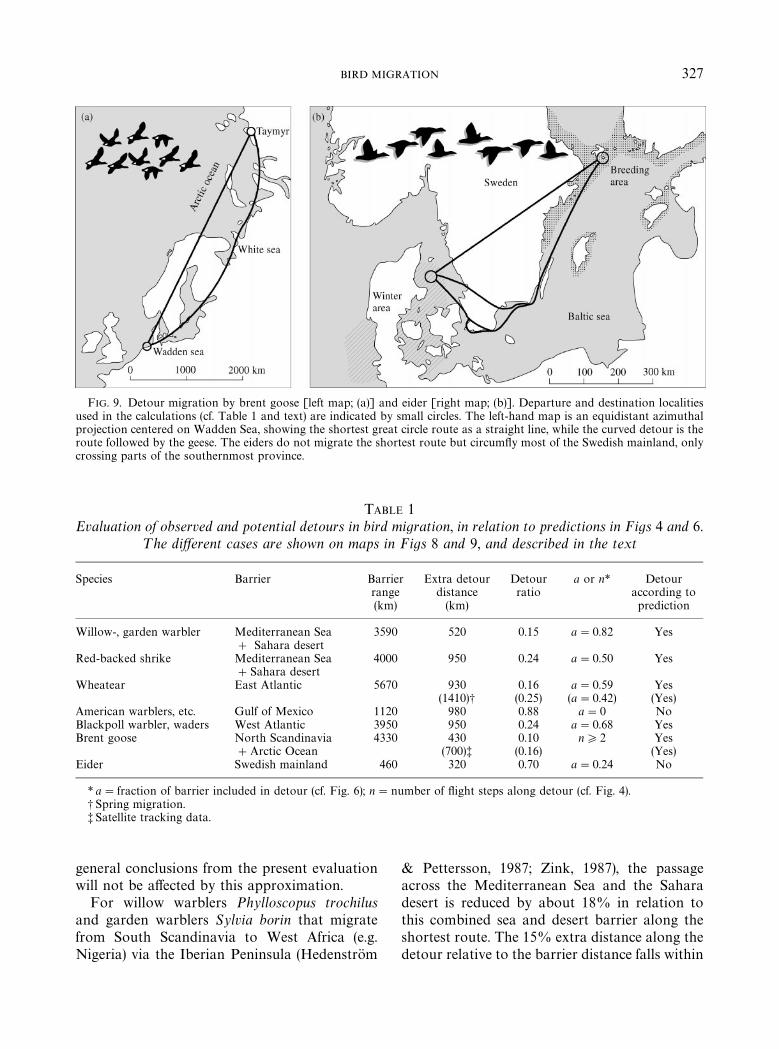
FIG. 9. Detour migration by brent goose [left map; (a)] and eider [right map; (b)]. Departure and destination localitiesused in the calculations (cf. Table 1 and text) are indicated by small circles. The left-hand map is an equidistant azimuthalprojection centered on Wadden Sea, showing the shortest great circle route as a straight line, while the curved detour is theroute followed by the geese. The eiders do not migrate the shortest route but circum#y most of the Swedish mainland, onlycrossing parts of the southernmost province.
TABLE 1Evaluation of observed and potential detours in bird migration, in relation to predictions in Figs 4 and 6.
¹he di+erent cases are shown on maps in Figs 8 and 9, and described in the text
Species Barrier Barrier Extra detour Detour a or n* Detourrange distance ratio according to(km) (km) prediction
Willow-, garden warbler Mediterranean Sea 3590 520 0.15 a"0.82 Yes# Sahara desert
Red-backed shrike Mediterranean Sea 4000 950 0.24 a"0.50 Yes#Sahara desert
Wheatear East Atlantic 5670 930 0.16 a"0.59 Yes(1410)- (0.25) (a"0.42) (Yes)
American warblers, etc. Gulf of Mexico 1120 980 0.88 a"0 NoBlackpoll warbler, waders West Atlantic 3950 950 0.24 a"0.68 YesBrent goose North Scandinavia 4330 430 0.10 n*2 Yes
#Arctic Ocean (700)? (0.16) (Yes)Eider Swedish mainland 460 320 0.70 a"0.24 No
* a"fraction of barrier included in detour (cf. Fig. 6); n"number of #ight steps along detour (cf. Fig. 4).-Spring migration.?Satellite tracking data.
BIRD MIGRATION 327
general conclusions from the present evaluationwill not be a!ected by this approximation.
For willow warblers Phylloscopus trochilusand garden warblers Sylvia borin that migratefrom South Scandinavia to West Africa (e.g.Nigeria) via the Iberian Peninsula (HedenstroK m
& Pettersson, 1987; Zink, 1987), the passageacross the Mediterranean Sea and the Saharadesert is reduced by about 18% in relation tothis combined sea and desert barrier along theshortest route. The 15% extra distance along thedetour relative to the barrier distance falls within

328 T. ALERSTAM
the maximum expected detour ratio according toFig. 6(a) ( f"0.73) but not Fig. 6(b) ( f"0.61).Interestingly, the warblers seem not to follow thisdetour during spring migration, but then rathertravel directly towards Scandinavia (HedenstroK m& Pettersson, 1987). This may be related to achanged barrier situation, after winter rains inthe Mediterranean region and North Africa.
Red-backed shrikes ¸anius collurio migratingbetween southeastern France and Tanzania(Zink, 1987) reduce their barrier crossing con-siderably by making a detour via the easternMediterranean region. Their detour is in accord-ance with predictions in Fig. 6(a) and (b) (forf"0.86 and 0.70, respectively). Sutherland (1998)classi"ed the route of the red-backed shrike assuboptimal, being apparently longer than seemssensible. However, this analysis indicates that thelong detour may in fact be adaptive since thebirds reduce the long-distance barrier #ight byhalf, which more than compensates for the extraenergy costs associated with the additional dis-tance (covered by short #ights and small fuelloads) along the detour.
This holds true also for wheatears Oenantheoenanthe migrating across the East AtlanticOcean between Greenland and Senegal via Iberiaor southern France (Salomonsen, 1967; Alerstam,1996). The observed detour ratio falls clearlywithin predictions in Fig. 6(a) and (b) (for f"1.6and 1.1, respectively), for the relevant value of a.One cannot be certain that the very long #ightacross the full barrier is really within thewheatears' capacity (relative fuel loads exceeding1 seem to be rare among migratory birds).The wheatears make an even longer detourduring spring migration, when they return toGreenland via Britain (Snow, 1953; Salomonsen,1967). For this return journey the detour ratiois 0.25, and a"0.42, which is also clearly withinthe maximum detour ratios predicted in Fig. 6.Salomonsen (1967) attributed the evolutionof di!erent autumn and spring migration routesto the movements of low-pressure systemsand wind patterns over the northeastern AtlanticOcean.
Whether birds migrate across or around theGulf of Mexico was a matter of much contro-versy half a century ago, but the existence ofmassive trans-Gulf migration during both spring
and autumn is now well documented (Gauth-reaux, 1999). The distance across the Gulf ofMexico is comparatively modest, correspondingto f"0.17 or 0.16 according to eqns (1a, b), andavoidance of fuel transport costs cannot explainextra detour distances as illustrated in Fig. 8.Hence, circum-Gulf migration, if it is of anyimportance at all, must have other causes.
Blackpoll warblers Dendroica striata as well asseveral wader species make a direct #ight acrossthe West Atlantic Ocean between North andSouth America during autumn migration, whilethey return in spring via the Carribean regionand Florida (Williams et al., 1977; Morrison,1984; Baird, 1999). The trans-Atlantic autumn#ights take place in spite of the fact that a detourvia Florida falls within the predicted maximumdetour ratio according to Fig. 6(a) ( f"0.84)but not Fig. 6(b) ( f"0.69). The fact that windsare favourable for a transoceanic #ight in autumnbut not in spring is probably of decisive im-portance for the evolution of this migrationsystem.
The shortest route for brent geese Branta ber-nicla between their staging areas in the WaddenSea and their breeding localities at the TaymyrPeninsula is along the great circle across NorthScandinavia and the Arctic Ocean as shown inFig. 9(a). This distance can be regarded as a bar-rier, since there are no suitable refuelling sitesalong this route. However, the brent geese travelclose to the loxodrome, which is 10% longer, ina "rst #ight to the White Sea region, wherefromthey continue after refuelling in one or more#ights to their destination (Ebbinge & Spaans,1995). Satellite tracking has recently shown thatindividual #ight paths to the destination are onaverage 16% longer than the great circle distance(Green et al., in press). This falls within or veryclose to maximum detour ratios given in Fig. 4(a)( f"0.98) and (b) ( f"0.78), respectively.
Eiders Somateria mollissima breeding in theBaltic Sea and wintering in Danish waters, donot travel along the shortest route but circum#ythe Swedish mainland via the southernmostprovince as shown in Fig. 9(b) (Alerstam et al.,1974). This detour is quite long relative to thebarrier range, and could have nothing to dowith reduction of fuel transport costs as seenfrom Fig. 6 ( f"0.06).

BIRD MIGRATION 329
These evaluated examples (Table 1) show thatreduction of fuel transport costs across barriersmay well be of widespread importance for theevolution of detours in bird migration, especiallywhere barrier distances are long. It is also seenthat wind is a very important additional selectiveagent. Detours at shorter barriers, like the Gulf ofMexico (if circum-Gulf migration is at all of sig-ni"cant importance) or the Swedish mainland(eiders), have probably evolved in response torisk factors since these detours are clearlyunfavourable from the point of view of fuel econ-omy. The risk factors mentioned in the introduc-tion, of starvation, predation, reduced foraginge$ciency, drift, disorientation, unfavourableweather and winds, constitute the main alterna-tive and contributory factors to explain whybirds often follow detours rather than crossingecological barriers directly.
An important assumption for many of theabove predictions is that birds migrate by short#ight steps and small fuel reserves across non-barrier areas, storing heavy fuel loads only just infront of barriers. This seems to hold for somespecies but there are also other interesting strate-gies, with gradually increasing fuel loads as thebirds approach a barrier, or deposition of largereserves well in advance of the barrier (Schaub &Jenni, 2000a, b).
The basic assumptions behind the range equa-tions (1a, b) that the e!ective lift : drag ratio ofa #ying bird remains una!ected by the fuel load[eqn 1(b)] or becomes somewhat reduced withincreasing fuel load because of an increase inparasite drag with increasing body frontal area[eqn 1(a)], seem to be very robust from the pointof view of #ight mechanics (cf. Pennycuick, 1975).However, physiological processes during #ightare less well understood, and they may a!ect therelationship between range and fuel load, leavingroom for migration along detours to a smaller orlarger extent than predicted in this paper. Untilthe physiological e!ects of increased fuel loads on#ight power can be properly predicted, it seemsappropriate to use #ight mechanical theory as theprimary basis for predictions of maximal andoptimal detours, as presented in this paper.
Taking the strategy of fuel deposition along themigration route and the exact barrier geometryinto account, the optimum route associated with
minimum total fuel consumption, may be pre-dicted for speci"c species or populations on thebasis of the detour theory outlined in this paper.This will serve to further test the possibility raisedin this paper, that the aerodynamics of fuel trans-port is an important factor for the evolutionof detours in bird migration at wide ecologicalbarriers.
I am very grateful to Gunilla Andersson for drawingthe "gures, and to A_ ke LindstroK m and twoanonymous referees for valuable comments on themanuscript. This work was supported by the SwedishNatural Science Research Council.
REFERENCES
ALERSTAM, T. (1979). Wind as selective agent in bird migra-tion. Ornis Scand. 10, 76}93.
ALERSTAM, T. (1981). The course and timing of bird migra-tion. In: Animal Migration (Aidley, D. J., ed.), pp. 9}54.Cambridge: Cambridge University Press.
ALERSTAM, T. (1990). Bird Migration. Cambridge: Cam-bridge University Press.
ALERSTAM, T. (1996). The geographical scale factor inorientation of migrating birds. J. Exp. Biol. 199, 9}19.
ALERSTAM, T. (2000). Bird migration performance on thebasis of #ight mechanics and trigonometry. In: Biomecha-nics in Animal Behaviour (Domenici, P. & Blake, R. W.,eds), pp. 105}124. Oxford: Bios Scienti"c Publishers.
ALERSTAM, T. & HEDENSTROG M, A. (1998). The developmentof bird migration theory. J. Avian Biol. 29, 343}369.
ALERSTAM, T. & LINDSTROG M, A_ . (1990). Optimal migration:the relative importance of time, energy and safety. In: BirdMigration: Physiology and Ecophysiology (Gwinner, E.,ed.), pp. 331}351. Berlin: Springer-Verlag.
ALERSTAM, T., BAUER, C.-A. & ROOS, G. (1974). Springmigration of eiders Somateria mollissima in southern Scan-dinavia. Ibis 116, 194}210.
ALEXANDER, R. McN. (2000). Walking and running strat-egies for humans and other animals. In: Biomechanics inAnimal Behaviour (Domenici, P. & Blake, R. W., eds),pp. 49}57. Oxford: Bios Scienti"c Publishers.
BAIRD, J. (1999). Returning to the tropics: the epic autumn#ight of the blackpoll warbler. In: Gatherings of Angels:Migrating Birds and their Ecology (Able, K. P., ed.),pp. 63}77. Ithaca: Cornell University Press.
BATTLEY, P. F., PIERSMA, T., DIETZ, M. W., TANG, S.,DEKINGA, A. & HULSMAN, K. (2000). Empirical evidencefor di!erential organ reductions during trans-oceanic bird#ight. Proc. R. Soc. ¸ond. B 267, 191}195.
DORST, J. (1962). ¹he Migrations of Birds. London:Heinemann.
EBBINGE, B. S. & SPAANS, B. (1995). The importance ofbody reserves accumulated in spring staging areas in thetemperate zone for breeding in dark-bellied brent geeseBranta bernicla in the high arctic. J. Avian Biol. 26,105}113.
FRANSSON, T. & WEBER, T. P. (1997). Migratory fuelling inblackcaps (Sylvia atricapilla) under perceived risk of pre-dation. Behav. Ecol. Sociobiol. 41, 75}80.

330 T. ALERSTAM
GAUTHREAUX Jr S. A. (1980). The in#uence of globalclimatological factors on the evolution of bird migratorypathways. In: Acta X<II Congressus InternationalisOrnitologici (NoK hring, R., ed.), pp. 517}525. Berlin: Verlagder Deutschen Ornithologen-Gesellschaft.
GAUTHREAUX Jr S. A. (1999). Neotropical migrantsand the Gulf of Mexico: the view from aloft. In: Gather-ings of Angels: Migrating Birds and their Ecology(Able, K. P., ed.), pp. 27}49. Ithaca: Cornell UniversityPress.
GREEN, M., ALERSTAM, T., CLAUSEN, P., DRENT, R. &EBBINGE, B. S. (in press). Dark-bellied brent geeseBranta bernicla bernicla, as recorded by satellite tele-metry, do not minimize #ight distance during springmigration. Ibis.
HEDENSTROG M, A. (1992). Flight performance in relation tofuel load in birds. J. theor. Biol. 158, 535}537.
HEDENSTROG M, A. & PETTERSSON, J. (1987). Migrationroutes and wintering areas of willow warblers Phylloscopustrochilus ringed in Fennoscandia. Ornis Fennica 64,137}143.
KERLINGER, P. (1989). Flight Strategies of Migrating Hawks.Chicago: University of Chicago Press.
KLAASSEN, M. & LINDSTROG M, A_ . (1996). Departure fuelloads in time-minimizing migrating birds can be explainedby the energy costs of being heavy. J. theor. Biol. 183,29}34.
LINDSTROG M, A_ ., KVIST, A., PIERSMA, T., DEKINGA, A. &DIETZ, M. W. (2000). Avian pectoral muscle size rapidlytracks body mass changes during #ight, fasting and fuell-ing. J. Exp. Biol. 203, 913}919.
LORIA, D. E. & MOORE, F. R. (1990). Energy demands ofmigration on red-eyed vireos. <ireo olivaceus. Behav. Ecol.1, 24}35.
MORRISON, R. I. G. (1984). Migration systems of someNew World shorebirds. In: Behaviour of Marine Animals,Vol. 6. Shorebirds: Migration and Foraging Behaviour(Burger, J. & Olla, B. L., eds), pp. 125}202. New York:Plenum Press.
PENNYCUICK, C. J. (1975). Mechanics of #ight. In: AvianBiology, Vol. 5 (Farner, D. S. & King, J. R., eds), pp. 1}75.New York: Academic Press.
PENNYCUICK, C. J. (1998). Computer simulation of fat andmuscle burn in long-distance bird migration. J. theor. Biol.191, 47}61.
PIERSMA, T. (1987). Hop, skip or jump? Constraints onmigration of arctic waders by feeding, fattening and #ightspeed. ¸imosa 60, 185}194 (in Dutch with English sum-mary).
PIERSMA, T., GUDMUNDSSON, G. A. & LILLIENDAHL, K.(1999). Rapid changes in the size of di!erent functionalorgan and muscle groups during refueling in a long-distance migrating shorebird. Phys. Biochem. Zool. 72,405}415.
SALOMONSEN, F. (1967). Fuglene pa> Gr~nland (in Danish).Copenhagen: Rhodos.
SCHAUB, M. & JENNI, L. (2000a). Fuel deposition of threepasserine bird species along the migration route. Oecologia122, 306}317.
SCHAUB, M. & JENNI, L. (2000b). Body mass of six long-distance migrant passerine species along the autumnmigration route. J. Ornithol. 141, 441}460.
SNOW, D. W. (1953). The migration of the Greenlandwheatear. Ibis 95, 376}378.
SUTHERLAND, W. J. (1998). Evidence for #exibility andconstraint in migration systems. J. Avian Biol. 29, 441}446.
WILLIAMS, T. C., WILLIAMS, J. M., IRELAND, L. C. &TEAL, J. M. (1977). Autumnal bird migration over thewestern Atlantic Ocean. Am. Birds 31, 251}267.
WITTER, M. S. & CUTHILL, I. C. (1993). The ecological costsof avian fat storage. Philos. ¹rans. R. Soc. ¸ond. B 340,73}92.
ZINK, G. (1987). Der Zug europa( ischer Singvo( gel. Band I.Wiesbaden: AULA-Verlag.
APPENDIX A
Notation
a fraction of barrier distance included indetour (0(a(1)
c proportionality coe$cient in rangeequation for #apping #ight
C1
transport cost (energy/distance) for#ight mode used in barrier crossing
C2
transport cost (energy/distance) for#ight mode used in migration acrossnon-barrier areas
D extra distance along detour, i.e. dis-tance along total detour minus dis-tance along total direct route
D/>b
detour ratioE total energy consumption for #ight
transportf fuel load relative to lean body mass
fa
f required to #y across fraction a ofbarrier
f1
fuel consumption f for #ight acrossbarrier distance >
1f2
fuel consumption f (cumulative)for #ights across non-barrier distance>
2k1
relative fuel deposition rate (increase inf per time) for barrier crossing
k2
relative fuel deposition rate (increasein f per time) for migration alongdetour
K rate of energy accumulation (energy/time) during migration
n number of #ight steps along detourP
1e!ective power (energy consumptionper time) for #ight mode used in bar-rier crossing
P2
e!ective power (energy consumptionper time) for #ight mode used in migra-tion across non-barrier areas

BIRD MIGRATION 331
<1
e!ective speed for #ight mode used inbarrier crossing
<2
e!ective speed for #ight mode used inmigration across non-barrier areas
> #ight range>
b#ight range across barrier
>max
maximum range with no fuel transportcosts (covered by numerous short#ights)
>n
range covered in n equally long #ights>
1distance across barrier
>2
distance across non-barrier areas