determining the source of longwall gob gas: lower
TRANSCRIPT

Determining the Source of Longwall Gob Gas: Lower Kittanning Coalbed, Carnbria County, PA
By William P. Diamond, James P. Ulery, and Stephen J. Kravits
Mission: As the Nation's principal conservation agency, the Department of the Interior has respon- sibility for most of our nationally-owned public lands and natural and cul tural resources. This includes fostering wise use of our land and water resources, protecting our f ish and wildl i fe, pre- serving the environmental and cultural values of our national parks and historical places, and pro- viding for the enjoyment of l i fe through outdoor recreation. The Department assesses our energy and mineral resources and works to assure that their development is i n the best interests of a l l our people. The Department also promotes the goals of the Take Pride i n America campaign by encouraging stewardship and citizen responsibil- i ty for the public lands and promoting cit izen par- ticipation in their care. The Department also has a major responsibility for American Indian reser- vation communit ies and for people w h o live i n Island Territories under U.S. Administration.

Report of Investigations 9430
Determining the Source of Longwall Gob Gas: Lower Kittanning Coalbed, Cambria County, PA
By William P. Diamond, James P. Ulery, and Stephen J. Kravits
UNITED STATES DEPARTMENT OF THE INTERIOR Manuel Lujan, Jr., Secretary
BUREAU OF MINES T S Ary, Director

Library of Congress Cataloging in Publication 'Data:
Diamond, W. P. (William P.) Determining the source of longwall gob gas : Lower Kittanning Coalbed, Cambria
County, PA / by William P. Diamond, James P. Ulery, and Stephen J. Kravits.
p. cm. - (Report of investigations; 9430)
Includes bibliographical references @. 13).
1. FiredampPennsylvaniaAmbna County. 2. Coal mine waste-Pennsylvania- Cambria County. 3. Longwall mining-PennsylvaniaAmbria County. 4. Mine ventilation. I. Ulery, J. P. (James P.) 11. Kravits, S. J. (Stephen J.) 111. Title. IV. Series: Report of investigations (United States. Bureau of Mines); 9430.
TN23.U43 [TN305] 622 S--dc20 [622'.42] 92-13059 CIP

CONTENTS Page
Abstract . . . . . . . . . . . . . . . . . . . . . . . . . . . . . . . . . . . . . . . . . . . . . . . . . . . . . . . . . . . . . . . . . . . . . . . . . . . Introduction . . . . . . . . . . . . . . . . . . . . . . . . . . . . . . . . . . . . . . . . . . . . . . . . . . . . . . . . . . . . . . . . . . . . . . . . Acknowledgments . . . . . . . . . . . . . . . . . . . . . . . . . . . . . . . . . . . . . . . . . . . . . . . . . . . . . . . . . . . . . . . . . . . . Methodology . . . . . . . . . . . . . . . . . . . . . . . . . . . . . . . . . . . . . . . . . . . . . . . . . . . . . . . . . . . . . . . . . . . . . . .
Criteria for corehole site selection . . . . . . . . . . . . . . . . . . . . . . . . . . . . . . . . . . . . . . . . . . . . . . . . . . . . . . Gas content determination and sample selection . . . . . . . . . . . . . . . . . . . . . . . . . . . . . . . . . . . . . . . . . . .
. . . . . . . . . . . . . . . . . . . . . . . . . . . . . . . . . . . . . . . . . . . . . . . . . . . . . . . . . . . . . . . . Results and discussion
. . . . . . . . . . . . . . . . . . . . . . . . . . . . . . . . . . . . . . . . . . . . . . . . . . . . . . . . . . . . . . . . In-place gas content . . . . . . . . . . . . . . . . . . . . . . . . . . . . . . . . . . . . . . . . . . . . . . . . Volumetric calculations of overburden gas
Material balance calculations . . . . . . . . . . . . . . . . . . . . . . . . . . . . . . . . . . . . . . . . . . . . . . . . . . . . . . . . . . . . . . . . . . . . . . . . . . . . . . . . . . . . . . . . . . . . . . . . . . . . . . . . . . . . . . . . . . . . . . . . . . . . Recommendations
. . . . . . . . . . . . . . . . . . . . . . . . . . . . . . . . . . . . . . . . . . . . . . . . . . . . . . . . . . . . . . . . . . . . . . . . Conclusions References . . . . . . . . . . . . . . . . . . . . . . . . . . . . . . . . . . . . . . . . . . . . . . . . . . . . . . . . . . . . . . . . . . . . . . . . . Appendix...Gas content data. coreholes 9. 10. 11. and 13 . . . . . . . . . . . . . . . . . . . . . . . . . . . . . . . . . . . . . . .
ILLUSTRATIONS
Mine map of study area . . . . . . . . . . . . . . . . . . . . . . . . . . . . . . . . . . . . . . . . . . . . . . . . . . . . . . . . . . . Comparison of daily methane production rates for good- and poor-producing gob gas vent holes. panel1 . . . . . . . . . . . . . . . . . . . . . . . . . . . . . . . . . . . . . . . . . . . . . . . . . . . . . . . . . . . . . . . . . . . . . .
Stratigraphic columns with results of coalbed gas content . . . . . . . . . . . . . . . . . . . . . . . . . . . . . . . . . . . . . . . . . . . . . . . . . . . . . . . . . . . . . . . . . . . . . . . . . . . . . . . . . . . . . . . Proposed zone of gas emissions
. . . . . . . . . . . . . . . . . . . . . . . . . . . . . . . . . . . . . Variation of in-place gas volumes during mining cycle . . . . . . . . . . . . . . . . . . . . . . . . . . . . . . . . Cumulative gas production from gob gas vent holes. panel 1
Mine map of study area with zone of gas emission and proposed methane drainage borehole systems . . Schematic of speculated pressure gradients in study area . . . . . . . . . . . . . . . . . . . . . . . . . . . . . . . . . . . Cross-sectional view of proposed cross-measure gas drainage holes . . . . . . . . . . . . . . . . . . . . . . . . . . .
TABLES
. . . . . . . . . 1 . Calculated in-place gas volumes for 600- by 4.15 0. by 275-ft zone of gas emissions. panel 1 . . . . . . . . . . . . . . . . . . . . . . . . . . . . . . . . . . . . . . . . . . . . . . 2 . Gas volume reduction between coreholes
. . . . . . . . . . . . . . . . . . . . . . . . . . . . . . . . . . . . . . . . . . . . . . . A.1 . Measured gas contents from corehole 9 . . . . . . . . . . . . . . . . . . . . . . . . . . . . . . . . . . . . . . . . . . . . . . A.2 . Measured gas contents from corehole 10 . . . . . . . . . . . . . . . . . . . . . . . . . . . . . . . . . . . . . . . . . . . . . . A.3 . Measured gas contents from corehole 11 . . . . . . . . . . . . . . . . . . . . . . . . . . . . . . . . . . . . . . . . . . . . . . A.4 . Measured gas contents from corehole 13

UNIT OF MEASURE ABBREVIATIONS USED IN THIS REPORT
OF degree Fahrenheit in inch
ft foot in Hg inch of mercury (atmospheric pressure)
ft3 cubic foot mD millidarcy
ft3/ft3 cubic foot per cubic foot MMcf million cubic feet
ft3/st cubic foot per short ton P C ~ percent
g/cm3 gram per cubic centimeter

DETERMINING THE SOURCE OF LONGWALL GOB GAS: LOWER I KITTANNING COALBED, CAMBRIA COUNTY, PA 1
By William P. ~iamond, ' James P. ulery,' and Stephen J. ~ rav i ts *
ABSTRACT
This report presents results of a cooperative research project between the U.S. Bureau of Mines and BethEnergy Mines, Inc. Four coreholes (two before mining and two after mining) were drilled at a longwall mine operating in the Lower Kittanning Coalbed to obtain coal and rock samples from over- lying strata to determine their gas content at various times in the mining cycle. The results of those tests indicate that 91 pct of the gas removed from the overlying strata came from coalbeds. Material balance calculations were made to compare the volume of gas produced both from gob gas vent holes drilled on the panel and gas removed by the mine's ventilation system with the volume of gas removed from strata directly overlying the panel to a height of 275 ft. This analysis indicates that only 40 pct of the total gas produced from the panel actually came from the strata directly overlying the panel. The remaining volume of gas production probably migrated to the Iongwall gob from overlying, and perhaps underlying, strata immediately adjacent to the panel and perhaps from greater distances downdip because of the establishment of a long-term pressure gradient in the study area.
' ~ e o l o ~ i s t . 2 ~ i n i n g engineer (now with Resource Enterprises, Salt Lake City, UT). Pittsburgh Research Center, U.S. Bureau of Mines, Pittsburgh, PA.
INTRODUCTION
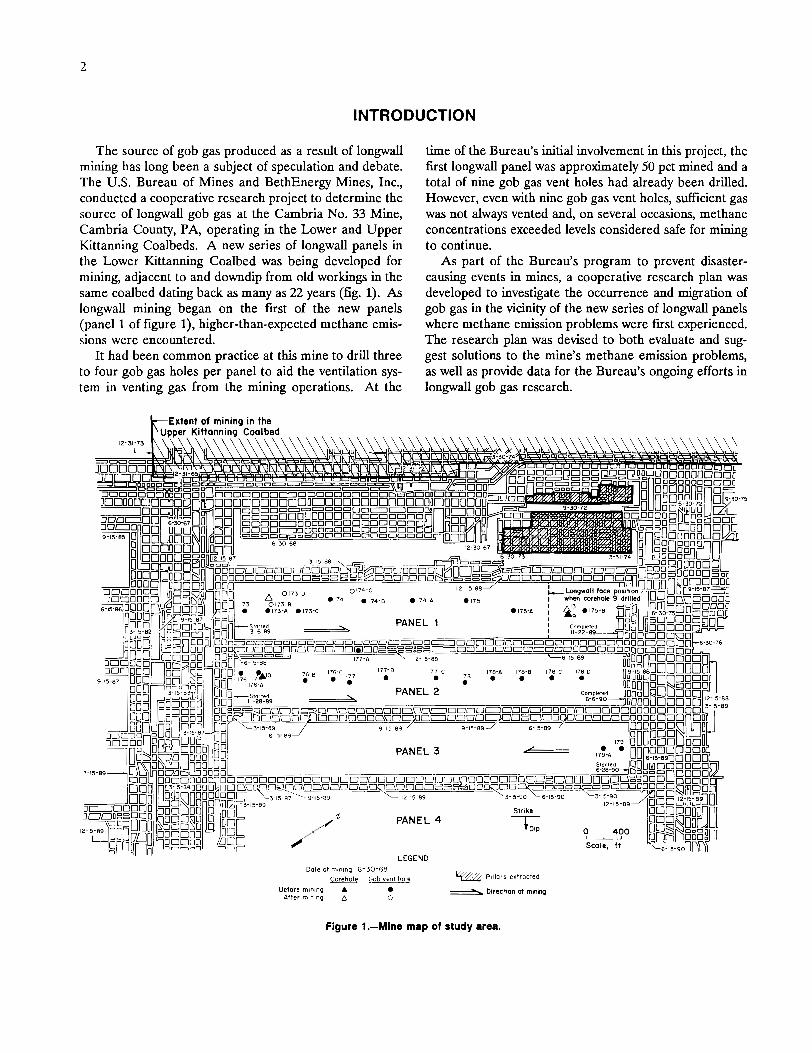
The source of gob gas produced as a result of longwall mining has long been a subject of speculation and debate. The U.S. Bureau of Mines and BethEnergy Mines, Inc., conducted a cooperative research project to determine the source of longwall gob gas at the Cambria No. 33 Mine, Cambria County, PA, operating in the Lower and Upper Kittanning Coalbeds. A new series of longwall panels in the Lower Kittanning Coalbed was being developed for mining, adjacent to and downdip from old workings in the same coalbed dating back as many as 22 years (fig. 1). As longwall mining began on the ftrst of the new panels (panel 1 of figure I), higher-than-expected methane emis- sions were encountered.
It had been common practice at this mine to drill three to four gob gas holes per panel to aid the ventilation sys- tem in venting gas from the mining operations. At the
time of the Bureau's initial involvement in this project, the first longwall panel was approximately 50 pct mined and a total of nine gob gas vent holes had already been drilled. However, even with nine gob gas vent holes, sufficient gas was not always vented and, on several occasions, methane concentrations exceeded levels considered safe for mining to continue.
As part of the Bureau's program to prevent disaster- causing events in mines, a cooperative research plan was developed to investigate the occurrence and migration of gob gas in the vicinity of the new series of longwall panels where methane emission problems were first experienced. The research plan was devised to both evaluate and sug- gest solutions to the mine's methane emission problems, as well as provide data for the Bureau's ongoing efforts in longwall gob gas research.
LEGEND Date of mlninq 6-30-68
Carehole Gob vent hole Pallors ertrocled
Before rnlnlng A After mlnlng A
d D~rectimn d mmmg 0
Figure 1 .--Mine map of study area.
ACKNOWLEDGMENTS
The day-to-day assistance of Donald E. Raab, project provided access to geologic and engineering data and to engineer, BethEnergy Mines, was noteworthy in accom- mine maps, and he managed the field logistics for obtain- plishing the goals of this project. In particular, he ing coal and rock cores for gas content determination.
METHODOLOGY
CRITERIA FOR COREHOLE SITE SELECTION
In addition to evaluating all the available engineering and geologic data for the area of interest, it was recom- mended that a series of coreholes be drilled to obtain rock and coal samples for reservoir characterization of the over- lying strata. This characterization, which is the focus of this report, was primarily the determination of the gas con- tent of the overlying strata, including both the coal and rock.
Four coreholes were drilled by BethEnergy at the loca- tions indicated in figure l. The drilling locations were based on the data requirements of the project and selected to provide the maximum amount of data with the fewest number of holes. At the time when the drilling program was being finalized, the longwall on panel 1 was approxi- mately 75 pct complete and located just beyond gob gas vent hole 175-A (fig. 1).
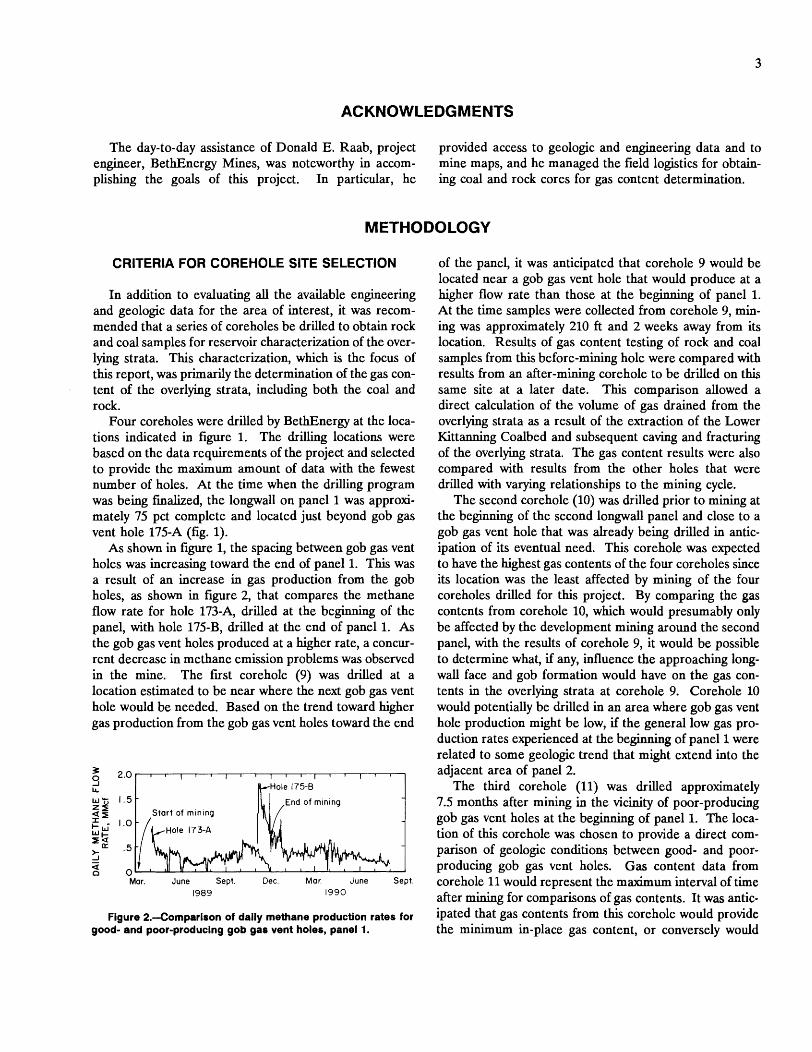
As shown in figure 1, the spacing between gob gas vent holes was increasing toward the end of panel 1. This was a result of an increase in gas production from the gob holes, as shown in figure 2, that compares the methane flow rate for hole 173-A, drilled at the beginning of the panel, with hole 175-B, drilled at the end of panel 1. As the gob gas vent holes produced at a higher rate, a concur- rent decrease in methane emission problems was observed in the mine. The first corehole (9) was drilled at a location estimated to be near where the next gob gas vent hole would be needed. Based on the trend toward higher gas production from the gob gas vent holes toward the end
2.0
1.5
I .o
.5
0 Mar. June Sept.
1989 Dec. Mar. June
1990 Sept.
l l ( 1 l [ l l ~ 1 l l l r l l l
Hole 175-8
End of mining Start of min~ng
Hole 173-A
Figure 2.--Comparison of daily methane production rates for good- and poor-producing gob gas vent holes, panel 1.
of the panel, it was anticipated that corehole 9 would be located near a gob gas vent hole that would produce at a higher flow rate than those at the beginning of panel 1. At the time samples were collected from corehole 9, min- ing was approximately 210 ft and 2 weeks away from its location. Results of gas content testing of rock and coal samples from this before-mining hole were compared with results from an after-mining corehole to be drilled on this same site at a later date. This comparison allowed a direct calculation of the volume of gas drained from the overlying strata as a result of the extraction of the Lower Kittanning Coalbed and subsequent caving and fracturing of the overlying strata. The gas content results were also compared with results from the other holes that were drilled with varying relationships to the mining cycle.
The second corehole (10) was drilled prior to mining at the beginning of the second longwall panel and close to a gob gas vent hole that was already being drilled in antic- ipation of its eventual need. This corehole was expected to have the highest gas contents of the four coreholes since its location was the least affected by mining of the four coreholes drilled for this project. By cornparing the gas contents from corehole 10, which would presumably only be affected by the development mining around the second panel, with the results of corehole 9, it would be possible to determine what, if any, influence the approaching long- wall face and gob formation would have on the gas con- tents in the overlying strata at corehole 9. Corehole 10 would potentially be drilled in an area where gob gas vent hole production might be low, if the general low gas pro- duction rates experienced at the beginning of panel 1 were related to some geologic trend that might extend into the adjacent area of panel 2.
The third corehole (11) was drilled approximately 7.5 months after mining in the vicinity of poor-producing gob gas vent holes at the beginning of panel 1. The loca- tion of this corehole was chosen to provide a direct com- parison of geologic conditions between good- and poor- producing gob gas vent holes. Gas content data from corehole 11 would represent the maximum interval of time after mining for comparisons of gas contents. It was antic- ipated that gas contents from this corehole would provide the minimum in-place gas content, or conversely would

show the maximum drainage of gas from the overlying strata of the four coreholes.
The last corehole (13) was drilled approximately 2 months after mining at the same site as corehole 9, which was drilled in advance of mining. These two core- holes were drilled at the same site so that before- and after-mining gas contents could be compared on an as equal as possible geologic basis. Also, by comparing gas contents from the before-mining coreholes (9 and 10) with the results from coreholes 13 and 11 (drilled 2 and 7.5 months, respectively, after mining), an assessment of the timing of gas flow from the overlying strata could be made.
GAS CONTENT DETERMINATION AND SAMPLE SELECTION
Coal and rock samples were collected from each core- hole for gas content determination using the Bureau's modified direct method (MDM) test (I)? The MDM was originally developed by the Bureau to accurately measure the generally low gas contents of oil shale (2). The MDM differs from the original direct method test (3), in that the volume of gas desorbed or released from the sample is determined at periodic intervals by measuring pressure differentials in the sealed sample container and calculating gas volumes according to the ideal gas law. Gas samples are taken for compositional analysis each time the pressure differentials are measured. This permits the calculation of the actual hydrocarbon gas content of the sample, as well as providing data on other gases present. The original direct method test relied on bleeding gas from the sample container and measuring the volume directly by a water-displacement method. The MDM was used on this project because of the expected low gas contents of the noncoal rocks in the strata overlying the Lower Kittanning Coalbed. For data consistency, the MDM was also used on the coal samples.
The total gas content of a sample is composed of three parts: lost, desorbed, and residual gas. The lost gas is that volume of gas that escapes from the sample between the time the sample is cored in the hole and finally retrieved on the surface and sealed in a desorption con- tainer. For coal samples where gas is stored by adsorp- tion, the lost gas can be estimated by a graphical pro- cedure based on the relationship that the volume of gas emitted from a fine coal particle is proportional to the square root of time (4-5). No such relationship is known to exist for rocks where the gas is free gas in the porosity of the sample and not stored by adsorption. Therefore, no
3~talic numbers in parentheses refer to items in the list of references preceding the appendix at the end of this report.
lost gas volume is included in the gas content values reported in this study for noncoal rocks. For rocks that are highly permeable, such as some sandstones, a sid- cant volume of the original gas in place could be lost to the atmosphere in the time required to recover the core from the ground and seal it into a container.
The gas desorbed or released from the sample while it is sealed in the container was measured by the MDM as described above.
The final constituent of the total gas content is the residual gas. At some point in time, a sample will reach a low level of gas release, beyond which only a small incre- ment of additional gas will be measured. At this point, additional gas may still be contained within the micropore structure of a coal sample. However, most of this gas will not be released from the solid sample under ambient con- ditions. This residual gas in coal samples can be measured by crushing the sample to a fine powder in a sealed vessel and measuring the volume of gas released. The current apparatus available for measuring the residual gas content of coal is not suitable for crushing other rock types to evaluate the presence of any residual gas.
Measuring the volume of residual gas in coal samples is of general interest for many fundamental and theoretical studies of the occurrence of coalbed gas. Since residual gas is gas that cannot be produced from a small diameter core at ambient conditions on the surface, it represents a volume of gas that probably will never migrate to a mine opening or to a methane drainage borehole. For this rea- son, it is not absolutely necessary to determine residual gas contents of samples where the primary interest is to access or compare desorbable volumes of gas that would migrate to a mine opening or to methane drainage boreholes. The residual gas component for the coal and rock samples col- lected was not thought to contribute to mine emissions and therefore was not determined.
The sampling strategy for the cores obtained for this study included the gas content testing of all coalbeds in the strata overlying the Lower Kittanning Coalbed to a height of approximately 275 ft. A height of 275 ft was selected to cover the generally reported height of approximately 200 ft for the fractured zone above an extracted longwall panel (6-9). For thin coalbeds (generally less than 3 ft thick) the entire coalbed was tested as a single sample. Some of the thicker coalbeds were divided into two sep- arate samples for gas content testing; however, the results were normalized and reported as a single value in this study. At least one representative noncoal rock sample was tested in each 2 0 4 core run within the 2754 stratigraphic interval above the Lower Kittanning Coalbed investigated for this study. On occasion, more than one noncoal rock sample was tested in a single core run when a simcant lithologic change occurred in the 20-ft section.

The basic sampling strategy was occasionally compromised desorbed gas, but not residual gas, and include only hydro- on the two after-mining coreholes (11 and 13) because of carbon gases. The gas contents of noncoal rocks are on extensive breakage or poor recovery of core from the gob. the same basis as above, with the exception that only the
In summary, the gas content values of coal samples desorbed gas is reported. The gas content values for the reported in this study are on a raw coal basis (not nor- noncoal rocks should therefore be considered minimum malized to an ash-free basis) and at STP conditions (60" F, values. The actual values could be higher, especially for 29.9 in Hg). The gas content values include lost and any rocks with high permeability.
RESULTS AND DISCUSSION
IN-PLACE GAS CONTENT order of influence of mining. In some instances, the thinner coalbeds, such as the various rider coals, may not
The measured gas content results obtained from the actually be continuous or stratigraphically equivalent to four coreholes drilled for this study are presented along coalbeds in the other coreholes. The character of the with the associated stratigraphic data in figure 3 and in the stratigraphically equivalent coalbeds can change signifi- appendix (tables A-1 through A-4). The lithologic sections cantly throughout the study area, which can complicate the on which the coalbed gas content results are plotted in data evaluation. The most obvious change in coal char- figure 3 are arranged from left to right in increasing acter observed in figure 3 is in the relative amounts of coal
COALBED 1-1 124 U~per Free port rider
3 Lower Freeport
5/ Upper Kittanning
........... Lower Kittanning rider -
Lower K ittanning Hole 10 Hole 9 Hole II
Hole l3 Mined out
KEY
Limestone 0 Sandy shale or siltstone 0 Shale or siltstone Bone or bony shale a Sandstone Coal
0 Shale or siltstone a Estimated value
with interbedded 278 Gas content, ft3/st sandstone
Figure 3.--Stratigraphic columns with results of coalbed gas content

and bone in the Upper Freeport Coalbed. This can sig- nificantly influence the volume of gas contained in the unit, in that the coal can contain a much greater volume of gas than can bone or bony shale. In general, the lithologies of the noncoal units and individual samples varied to a great- er extent from location to location than did the coal units and associated samples. For that reason, it is recognized that, in many cases, the rock samples collected at simi- lar heights above the Lower Kittanning Coalbed are not directly equivalent between holes.
As shown in figure 3, in almost every case the gas con- tents of stratigraphically equivalent coalbeds decrease with greater influence of mining, both laterally (left to right, figure 3) and vertically (top to bottom, figure 3), as would be expected. The only si&icant discrepancy in this trend is the Lower Freeport Coalbed in coreholes 10 and 9, where the corehole in the location least affected by mining (corehole 10) has a gas content 34 pct less than in core- hole 9. It seems that the Lower Freeport results from both coreholes do not coincide with the general increase in gas contents expected and generally shown in figure 3 at increasing distances above the coalbed mined. To fit the general trend, the Lower Freeport value from core- hole 10 should be higher and the value from corehole 9 should perhaps be less. No apparent reason can be deduced to explain this discrepancy, except that it is possible that an undetected leak occurred in the canister containing the Lower Freeport coal sample from corehole 10, thereby producing a lower-than-actual gas content value. This of course does not explain the apparent higher-than-expected value for the Lower Freeport Coal- bed in corehole 9.
One particularly interesting set of gas content numbers shown in figure 3 are those for the Lower Kittanning Coalbed from the two before-mining coreholes (10 and 9). The gas content values of 18 and 7 ft3/st are extremely low when compared with an expected virgin gas content of approximately 300 ft3/st as measured for this coalbed at locations in nearby Indiana County, PA (2). While these two coreholes were drilled into areas where the Lower Kittanning had not yet been extracted, the longwall panels had in fact been outlined by the development entries in preparation for longwall mining. The development entries around panel 1 (fig. 1) to the northwest of corehole 9 were mined approximately 9 months prior to the drilling of the corehole, and those to the southeast were mined about 3 months prior to drilling. The development entries sur- rounding corehole 10 on panel 2 were mined as long as 16 months prior to the drilling of the corehole. It is likely
that some of the gas in the Lower Kittanning had migrated out of the outlined panels to the surrounding entries prior to the drilling of the coreholes. The release of gas ad- sorbed in the internal structure of coal is initiated by the lowering of the reservoir pressure of the coalbed (10-11). Since mining of entries into the coalbed and the use of exhaust ventilation systems in the mine creates a very effi- cient pressure sink, a mechanism for initiating and sustain- ing gas flow from the outlined panels, as well as the virgin coal downdip, exists in the area of investigation. A second factor that has probably contributed to the formation of a pressure sink up dip of the new longwall panels is mining in the Upper Kittanning Coalbed (fig. 1).
Looking beyond the area of the development entries immediately surrounding the longwall panels, it is seen that entries updip and less than 500 ft away to the northwest were mined out in the Lower Kittanning Coal- bed as long as 22 years ago (fig. 1). Entries at the end of panel 1 closest to corehole 9 and less than 500 ft away were mined 14 years prior to drilling of the coreholes, and those at the end of panel 2 closest to corehole 10 and less than 500 ft away were mined 6.5 years prior to drilling. With such a large area of old workings surrounding three sides of the area of new panel development in the Lower Kittanning Coalbed, it is quite likely that gas has been migrating out of that coalbed to the large preexisting pressure sink created by the old workings. The most likely explanation then for the extremely low gas contents in the Lower Kittanning Coalbed in the study area is the long- term migration of gas to the old workings updip from the new panels and the more recent migration to the new de- velopment entries surrounding the panels.
The maximum in-place gas contents measured for coalbeds in the four coreholes drilled for this study are nearly 300 ft3/st in the Upper Freeport Coalbed and rider coal in corehole 10, the corehole least affected by mining. This value is in the range expected for these coalbeds at this depth as reported for virgin samples (3). The gas contents for the Upper Freeport Coalbed and rider coal in corehole 10 are assumed to be at or near virgin conditions. Comparing these gas contents with the gas contents from the other coreholes indicates that coalbeds as much as 200 ft above a longwall can contribute gas to the gob and mine ventilation system. In addition to the gas drainage induced by previous mining in the Lower Kittanning Coal- bed, mining in the Upper Kittanning Coalbed, 100 ft above the Lower Kittanning and approximately 1,200 ft updip from the new longwall panels (fig. I), probably contributed to the gas content reduction in the overlying strata.

VOLUMETRIC CALCULATIONS OFOVERBURDENGAS
To fully evaluate the source of longwall gob gas within the study area, the total gas in place in the overburden was calculated for various points in the mining cycle, repre- sented by the data from each corehole. To make these calculations, an assumption had to be made as to the shape and size of the zone of gas emissions, defined as that volume of rock from which gas will migrate to the longwall panel. A substantial effort has been made over the years in European and Russian coal mining districts to define the shape of the zone of gas emissions as part of their efforts to develop models to predict gas emissions from longwall mining (12). Generally, the zone of gas emissions has been represented as a prism of some shape overlying (and in some cases also underlying) the longwall panel. Most methods have assumed a rectangular prism; however, triangular prisms and semicylinders have also been used. The base of the zone of emissions is generally assumed to coincide with the shape and size of the extract- ed longwall panel. For purposes of this analysis and the material balance calculations to be presented in the next section, the shape of the zone of gas emissions will be portrayed as a rectangular prism overlying the long- wall panel (fig. 4). Since comparative gas content data for strata underlying the panel is not available, no deter- mination or calculation of gas reduction in the underlying strata can be made.
For calculation and discussion purposes, the total gas volume in the zone of gas emissions is subdivided into two categories: gas in coal, which includes bone and bony coal, and gas in rock, which includes the remaining non- coal strata. All gas contents and unit thicknesses as actu- ally measured were used in the gas in-place calculations, with the exception of those from the Upper Freeport Coal- bed. Because of the varying character of this coalbed, in particular the large amount of bone and small amount of coal in corehole 11, an average thickness based on the values from the other three cores was used in the calcu- lations. It was thought that this would give a more rea- sonable evaluation for the panel as a whole. In several cases where the gas contents of thin coalbeds were not measured, values were assumed, based on representative values from other coalbeds. Since, in general, only one rock sample was tested for every 20-ft core run, the gas content of the closest similar lithology was assigned to any lithology not actually tested in a particular core run.
The calculated total gas volumes and the coal and rock subdivided gas volumes based on the gas contents for each corehole are given in table 1 and plotted in graphical form in figure 5. The zone of emission was defined as a rec- tangular prism with its base equal to the size of the long- wall panel (600 by 4,150 ft) and its height at 275 ft (fig. 4). The gas in-place values for each stratigraphic unit shown
in table 1 were calculated by multiplying the appropriate measured gas content (tables A-1 through A-4) by the vol- ume of rock contained in each stratigraphic unit. The values in table 1 are arranged in order of increasing influence of mining on in-place gas volume from left to right, same as for figure 3. The volume and percentage of gas reduction between coreholes is given in table 2. As would be expected, the in-place gas volumes decrease with increased influence of mining. The total gas volume esti- mated to have been in place within the zone of gas emis- sion at the start of mining panel 1, based on the corehole least affected by mining (corehole lo), is 420 MMcf. The total in-place gas volume based on the corehole represent- ing the greatest influence of mining (corehole l l ) , drilled 7.5 months after mining, is 90 MMcf.
Table IrCalculated in-place gas volumes (in million cubic feet) for 600- by 4,150- by 275-ft zone
of gas emissions, panel 1
Stratigraphic unit Core- Core- Core- Core- hole 10 hole9 hole 13 hole 11
Coal to 275 fi . . . . . . . . . . . . NAp .03 1.1 NAp Rock to 275 fi . . . . . . . . . . . 9.0 3.2 10.1 4.4 Upper Freeport rider . . . . . . . 40.7 40.5 17.1 18.6 Intervening rock . . . . . . . . . . 3.3 1.1 2.4 .3 Upper Freeport Coalbed . . . . 127.1 63.4 49.9 '11.6 Intervening rock . . . . . . . . . . 8.0 4.8 2.7 2.4 Lower Freeport Coalbed . . . . 46.8 38.4 11.5 13.4 Intervening rock . . . . . . . . . . 8.4 16.6 6.3 1 .O Upper Kittanning Coalbed . . 87.0 38.7 24.2 22.2 lntervening coal . . . . . . . . . . 42.7 1.9 NAp '2.9 intervening rock . . . . . . . . . . 12.2 8.1 10.1 6.4 Lower Kittanning rider . . . . . 21.7 13.5 5.6 24.5 Intervening rock . . . . . . . . . . 2.3 3.7 4.0 Lower Kittanning Coalbed . . 7.6 3.6 (3) X
Total coal . . . . . . . . . . . . 375.0 200.0 110.0 75.0 Total rock . . . . . . . . . . . . 45.0 35.0 35.0 15.0
Cumulative total . . . . 420.0 235.0 145.0 90.0
NAp Not applicable. 'Based on normalized coal thickness. '~ased on estimated gas content. 3 ~ i n e d out.
NOTE.-Data may not add to totals shown because of inde- pendent rounding.
- - 2oo-
l L i
U Z
2 loo.
Mined out ' Figure 4.-Proposed zone of gas emissions.
Freeport Freeport Kittann~ng
Kittonn~ng
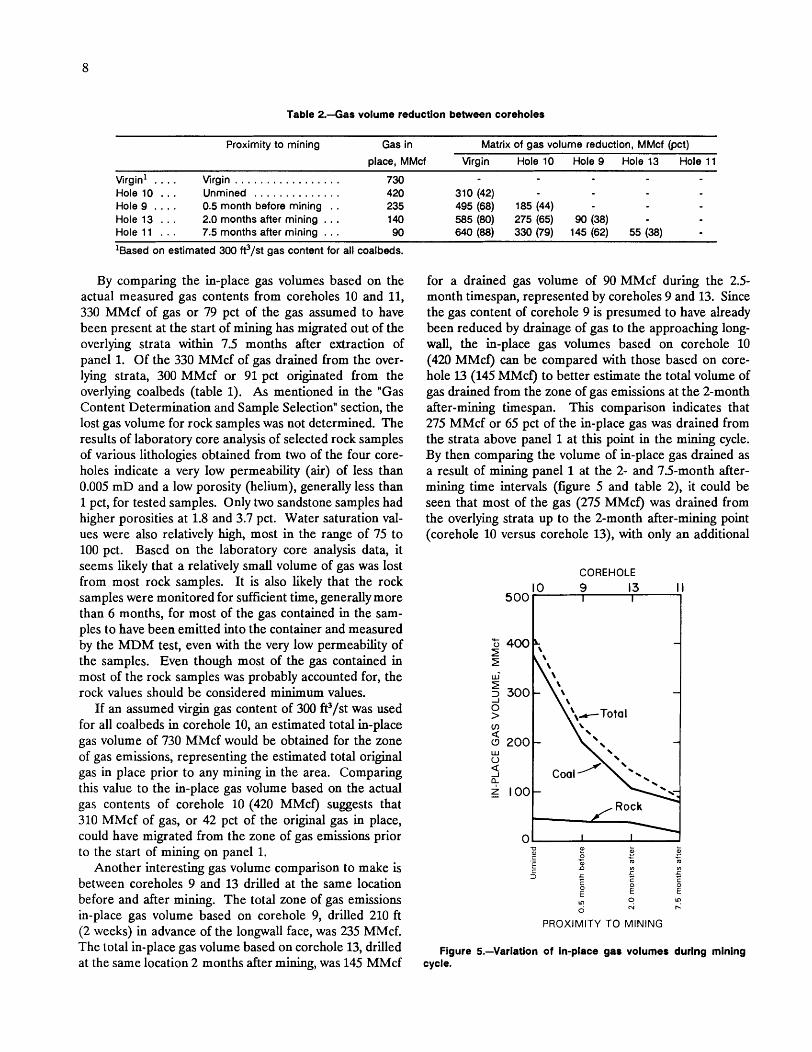
Table 2.--Gas volume reduction between coreholes
Proximity to mining Gas in Matrix of gas volume reduction, MMcf (pct)
place, MMcf Virgin Hole 10 Hole 9 Hole 13 Hole 11
. . . . . . . . . . . . . . . . . . . . . wrginl Wrgin 730 . . . . . . . . . . . . . . Hole 10 . . . Unmined 420
Hole 9 . . . . 0.5 month before mining . . 235 . . . Hole 13 . . . 2.0 months after mining 1 40
Hole 11 . . . 7.5 months after mining . . . 90
'~ased on estimated 300 e l s t gas content for all coalbeds.
By comparing the in-place gas volumes based on the actual measured gas contents from coreholes 10 and 11, 330 MMcf of gas or 79 pct of the gas assumed to have been present at the start of mining has migrated out of the overlying strata within 7.5 months after extraction of panel 1. Of the 330 MMcf of gas drained from the over- lying strata, 300 MMcf or 91 pct originated from the overlying coalbeds (table 1). As mentioned in the "Gas Content Determination and Sample Selection" section, the lost gas volume for rock samples was not determined. The results of laboratory core analysis of selected rock samples of various lithologies obtained from two of the four core- holes indicate a very low permeability (air) of less than 0.005 mD and a low porosity (helium), generally less than 1 pct, for tested samples. Only two sandstone samples had higher porosities at 1.8 and 3.7 pct. Water saturation val- ues were also relatively high, most in the range of 75 to 100 pct. Based on the laboratory core analysis data, it seems likely that a relatively small volume of gas was lost from most rock samples. It is also likely that the rock samples were monitored for sufficient time, generally more than 6 months, for most of the gas contained in the sam- ples to have been emitted into the container and measured by the MDM test, even with the very low permeability of the samples. Even though most of the gas contained in most of the rock samples was probably accounted for, the rock values should be considered minimum values.
If an assumed virgin gas content of 300 ft3/st was used for all coalbeds in corehole 10, an estimated total in-place gas volume of 730 MMcf would be obtained for the zone of gas emissions, representing the estimated total original gas in place prior to any mining in the area. Comparing this value to the in-place gas volume based on the actual gas contents of corehole 10 (420 MMcf) suggests that 310 MMcf of gas, or 42 pct of the original gas in place, could have migrated from the zone of gas emissions prior to the start of mining on panel 1.
Another interesting gas volume comparison to make is between coreholes 9 and 13 drilled at the same location before and after mining. The total zone of gas emissions in-place gas volume based on corehole 9, drilled 210 ft (2 weeks) in advance of the longwall face, was 235 MMcf. The total in-place gas volume based on corehole 13, drilled at the same location 2 months after mining, was 145 MMcf
for a drained gas volume of 90 MMcf during the 2.5- month timespan, represented by coreholes 9 and 13. Since the gas content of corehole 9 is presumed to have already been reduced by drainage of gas to the approaching long- wall, the in-place gas volumes based on corehole 10 (420 MMcf) can be compared with those based on core- hole l3 (145 MMcf) to better estimate the total volume of gas drained from the zone of gas emissions at the 2-month after-mining timespan. This comparison indicates that 275 MMcf or 65 pct of the in-place gas was drained from the strata above panel 1 at this point in the mining cycle. By then comparing the volume of in-place gas drained as a result of mining panel 1 at the 2- and 7.5-month after- mining time intervals (figure 5 and table 2), it could be seen that most of the gas (275 MMcf) was drained from the overlying strata up to the 2-month after-mining point (corehole 10 versus corehole 13), with only an additional
COREHOLE
5000
L
In 0 z r
PROXIMITY TO MINING
Figure 5.-Variation of in-place gas volumes durlng mining cycle.

55 MMcf of gas drained in the next 5.5 months (core- hole 13 versus corehole 11). As discussed previously, a larger volume of methane (310 MMcf) was potentially drained from the zone of gas emissions over an extended time period prior to mining of panel 1 (table 2).
As can be seen from the data in table 1 and plotted in figure 5, there were generally minimal changes in the volume of gas drained from the rocks as opposed to the volume drained from the coalbeds in the presumed zone of gas emissions. By comparing the rock in-place gas values from the least mining influenced corehole (10) to the most influenced corehole ( l l ) , it was determined that the gas volume drained was 30 MMcf, or 67 pct of the presumed original total. The biggest change in rock gas volumes was seen in the two after-mining coreholes (13 versus l l ) , where 20 MMcf of gas, or 44 pct of the total rock in-place gas, was drained in the 2- to 7.5-month time- span after mining.
MATERIAL BALANCE CALCULATIONS
The final set of relationships to be considered are material balance calculations, based on the available data, that will help refine the evaluation of the source and migration patterns of longwall gob gas in the study area. Gob gas produced by longwall mining of the Lower Kittanning Coalbed at the study site in the Cambria No. 33 Mine can be removed in two ways, by the mine's ventila- tion system or through gob gas vent holes. Mining on panel 1 began on March 6, 1989, and was completed on November 22,1989. This timespan encompasses 261 days, of which 152 days were actual coal production days. The nonproduction days included a strike, days the panel was shut down because of high gas emissions, and vacation and weekend days when production was not scheduled. Venti- lation data supplied by the mine were used to calculate daily gas emission volumes for the various production and nonproduction days as described above. A total of 175 MMcf of gas was calculated to have been removed by the ventilation system during the 261 days required to complete mining of longwall panel 1. During this same time period, the 12 gob gas vent holes produced 655 MMcf of gas from the panel (fig. 6). By adding the two gas production volumes calculated above, the total gas pro- duction from panel 1 is then 830 MMcf for the 261 days required to mine the panel. Comparing this value to the previously calculated value of 330 MMcf of gas drained from the zone of gas emissions (hole 10 versus 11) during the mining of panel 1 leaves 500 MMcf or 60 pct of the gas production unaccounted for.
One way to account for the 500 MMcf of gas shortfall in the material balance calculations would be to simply enlarge the zone of gas emissions until the volume of gas drained from that zone equalled the 830 MMcf of gas calculated to have been vented from panel 1. This would
seem to be a valid premise, since there is no reason to believe that gas could only be released from overlying strata confined by an area equal only to the size of the extracted panel itself. The mining of the coal and the subsequent fracturing of the overlying strata to form the gob certainly extends some distance laterally beyond the perimeter of the panel. It would also follow that a zone of reduced reservoir pressure would extend laterally beyond the perimeter of the extracted panel, and as discussed previously, the release of gas from coal, which has been shown in this study to be the primary source of gob gas, is initiated by lowering the reservoir pressure. It is also pos- sible, if not probable, that the source of some of the unac- counted for 500 MMcf of gas production is coalbeds in the underlying strata. As discussed previously, it is not pos- sible to estimate the volume of gas drained from the strata underlying the Lower Kittanning Coalbed with the avail- able core data.
By adding 350 ft on all sides of the original zone of emissions, whose base was defined as the size of the extracted panel, and keeping the height the same, the volume of drained gas would equal the volume of vented gas. The base of the new zone of gas emissions would be 1,300 by 4,850 ft, as shown in figure 7. Increasing the size of the zone of gas emissions is probably the best way to reconcile the volume of gas drained from the overlying strata and the volume of gas vented from the panel. However, the shape and position of the base of the zone of gas emissions is probably not as shown in figure 7. As can be seen in figure 7, the extent of the larger zone of gas emissions overlaps onto areas mined out 7 to 16 years ago on three sides of the panel and approaches within about 150 ft of workings that are 21 years old. It is likely that gas released from the overlying strata in these areas migrated to those old workings both prior to and during the mining of panel 1. It seems more likely that the actual shape of the base of the zone of gas emissions extends further in the direction of panel 2 and less in the other three directions.
2 V
u Mar. June Sept. Dec. Mar. June Sept. 1989 1990
Figure 6.--Cumulative gas production from gob gas vent holes, panel 1.

-474 114.8 . 174-1
I
d Direction of ninlng
LEGEND Dole of mlnlng' 6-30-68
Corehole Gob vent hole Plllors exlrocled Before mlnlng A
After mlnlng A 0
Proposed muhone dminaps systams . Vertiml well Horizonlal hole
~&&& cross-measure holes
Figure 7.-Mine map of study area with zone of gas emission and proposed methane drainage borehole systems.
The extension of the zone of gas emissions preferen- tially to the southeast in the direction of the development of future longwall panels may actually provide the explana- tion for the increased gas emissions experienced during the mining of panels 1 and 2. The presence of the old work- ings on three sides of the area developed for the new long- wall panels, in particular those updip to the northwest of panel 1, which are present in both the Lower and Upper Kittanning, has probably induced a substantial downdip pressure reduction gradient. That pressure gradient, which on the basis of the material balance calculations could easily extend into and perhaps beyond panel 2, could have been inducing the desorption and flow of gas from the Lower Kittanning Coalbed as well as coalbeds in the over- lying (and perhaps underlying) strata for as long as 21 years (fig. &I).
If, indeed, a flow of gas to the old workings in the Cambria No. 33 Mine had been established through the strata (primarily coalbeds) overlying the area of new panel
r : ' z z 60
a3 Eg 4 0 L~esorption K g 2 0 ' pressure -Actual
Panel 1 Panel 2
a3 Desorption pressure
Ponel 3
Figure 8.--Schematic of speculated pressure gradients In study area. A, Prior to start of mining on panel 1; 6-C, pro- gressive increase in pressure gradient if successive panels are mined faster than Initial pressure gradient can reestablish itself.

development (fig. 7), then it is possible that the gas in transit to the old workings could be diverted to the closer, newly created pressure sink of the mine void and gob of panel 1. It is also possible that the free gas in transit through the strata overlying the panels would preferentially flow to the much larger area of the mine void instead of the small area represented by the twelve 4- to 6-in-diameter gob gas vent holes, thus resulting in the higher-than- expected mine emissions and lower efficiency of the gob gas vent holes.
The long-term flow of gas for relatively long distances through coalbeds and overlying strata to a created pressure
sink has been documented previously by Bureau research (13). In that study, an area of reduced pressure gradients and gas flow from coalbeds was shown to extend at least 3,400 ft and perhaps as much as 5,000 ft from a pattern of stimulated vertical coalbed gas drainage wells that had been producing from the Blue Creek Coalbed for 10 years. The study showed that of the 3.2 billion ft3 of gas pro- duced by the 23 wells, only 1.14 billion ft3 came from the Blue Creek Coalbed within the perimeter of the pattern and the remaining 2.06 billion ft3 or 64 pct of the gas production migrated to the pattern both laterally and vertically from the surrounding strata.
RECOMMENDATIONS
If the flow of gas in transit to the old mine workings is indeed the cause of the higher-than-normal gas emissions, then several approaches to the problem are possible. The first would be to essentially do nothing. If a reduced pressure gradient and free gas flow has been established as speculated, then at some point beyond the currently mined panels virgin pressures must exist. If the mining of successive panels to the southeast can be achieved at a faster rate than the pressure gradient can decline to pressures as low as were adjacent to panel 1 when it was mined, then it should be possible to eventually mine coal that is higher on the pressure gradient (fig. 8B-C) where less gas would be in transit to be diverted to the current workings. A series of pressure monitoring holes could be drilled to the southeast at increasingly greater distances away from the panel being mined to evaluate the presence, magnitude, and changes in a gradient of reduced pressure with time. Data from such a system of monitoring holes could be used to forecast when methane emissions might return to normal. Should it become evident that sufficient progress is not being made in overcoming the gradient of reduced pressure, then it may be necessary to consider additional corrective measures.
Corrective measures beyond simply mining faster than the pressure gradient declines would generally require another approach: the drilling of a system of methane drainage boreholes, downdip of current mining, to inter- cept the gas that would be flowing updip to the panel being extracted. There are basically three choices for methane drainage boreholes: stimulated vertical wells drilled from the surface, horizontal holes, and cross- measure holes, the latter two drilled from inside the mine. The vertical wells would have the advantage of being drilled from the surface instead of the more restrictive underground environment, and they could be completed to drain gas from all the major coalbeds in advance of mining to provide the greatest relief. If the vertical wells were
drilled in the proper locations, they could be used as gob gas vent holes on future panels (fig. 7), thereby defraying some of the costs. It is also possible that the gas produced from the wells could be sold to further reduce the cost to the company.
Horizontal or cross-measure holes drilled underground would most likely be less costly initially than stimulated vertical wells and would probably be the option of choice to control immediate or short-term emission problems. Horizontal holes could perhaps be drilled into the roof strata from the opposite end of the panel from which min- ing is advancing (fig. 7). Drilling the holes in this manner would allow gas to be continually drained away from the advancing longwall face area and, depending on the length of the holes, could provide gas drainage for a substantial period of time. Using this system would probably require that the horizontal holes be manifolded to a gas gathering system that would transport the gas to the surface and not dump the gas underground. The gathering system would have to be kept under sufficient negative pressure by using exhausters on the surface so that gas could not backflow to the longwall face. Horizontal holes of this type could be drilled on the panel actually being mined to provide immediate relief and/or on the next panel to be mined downdip to intercept any migrating gas before it reaches the area of active mining. It might be necessary to drill several horizontal holes at different levels above the longwall panel to provide the greatest relief.
The cross-measure holes, like the horizontal holes, could either be drilled over the panel currently being mined and/or over the next panel to intercept gas migrating updip. The cross-measure holes would be drilled from the development entries along the length of the panel (fig. 7), angled up into the roof strata above the longwall panel (fig. 9). A series of cross-measure holes has actually been drilled at this mine previously and were shown to be effective in reducing face emissions (14-15).

Upper Freeport rider
180 Upper ~reeport - . Lower Free port 1
[Upper Kittanning
4 - t o 5-pct dip J KEY Longwall panel 4 Coalbed 0 40 80
lbIl Entry W Migrating gas Scale, ft
/ Cross- measure hole
Figure 9.--Cross-sectional view of proposed cross-measure gas drainage holes.
These holes were drilled at an angle of about 30" for a total hole length of about 280 ft. Maximum height above the Lower Kittanning Coalbed generally ranged from 140 to 170 ft, which would put the end of the gas drainage hole above the Lower Freeport Coalbed. Holes of similar length drilled at 45" would easily reach the Upper Freeport Coalbed if necessary (fig. 9).
It would also be possible to use a combination of horizontal and cross-measure holes, perhaps with the
cross-measure holes providing relief at the beginning of a panel and the horizontal holes being used at the com- pletion end to whatever maximum length they could be drilled toward the advancing face (fig. 7). Assuming that the gas from these systems was manifolded and trans- ported to the surface and that the gas was not contam- inated with air to any great extent, it would be possible to sell this gas to help defray the cost of implementation.
CONCLUSIONS
The primary sources of longwall gob gas resulting from the mining of the Lower Kittanning Coalbed are the coal- beds in the overlying strata. As much as 91 pct of the longwall gob gas originated in the overlying coalbeds, with those as high as 200 ft above the mined coalbed contribut- ing gas to the gob. Material balance calculations indicated that the volume of gas drained from the strata directly overlying the longwall panel could only account for 40 pct of the total volume of gas vented by the ventilation system and gob gas vent holes. It is concluded that most of the additional gas migrated from strata downdip from the new longwall panels. This migration of gas resulted from the presence of a large area of old mine workings that
created a pressure sink, both in the Lower and Upper Kit- tanning Coalbeds, that facilitated the desorption and flow of gas updip to the old workings. It is possible that the flow of gas through the area of the new longwall panel development may be responsible for the higher- than- expected methane emissions that led to this study. The high methane emission levels may decline if mining can advance downdip at a faster rate than the reduced reservoir pressure gradient can reestablish itself. The alternative is to employ one of the several available and effective methane drainage techniques to intercept the free gas in transit before it reaches the active longwall panel.

REFERENCES
1. Uiery, J. P., and D. M. Hyman. The Modified Direct Method of Gas Content Determination: Applications and Results. Paper 9163 in The 1991 Coalbed Methane Symposium Proceedins (Tuscaloosa, AL, May 13-17, 1991). Univ. AL, Tuscaloosa, AL, 1991, pp. 489-500.
2. Schatzel, S. J., D. M. Hyman, A. Sainato, and J. C. LaScola. Methane Contents of Oil Shale From the Piceance Basin, CO. BuMines RI 9063, 1987, 32 pp.
3. Diamond, W. P., J. C. LaScola, and D. M. Hyman. Results of the Direct-Method Determination of the Gas Content of U.S. Coalbeds. BuMines IC 9067, 1986, 95 pp.
4. Kisseli, F. N., C. M. McCulloch, and C. H. Elder. The Direct Method of Determining Methane Content of Coalbeds for Ventilation Design. BuMines RI 7767, 1973, 17 pp.
5. Sevenster, P. G. Diffusion of Gases Through Coal. Fuel, v. 38, 1959, p. 403.
6. Mazza, R L., and M. P. Molinar. Reducing Methane in Coal Mine Gob Areas With Vertical Boreholes (contract H0322851, Continen- tal Oil Co.). BuMines OFR 142-77,1977,145 pp.; NTIS PB 272 768 AS.
7. Davis, J. G., and S. Krickovic. Gob Degasification Research-A Case History. Paper in Methane Control in Eastern U.S. Coal Mines. BuMines IC 8621, 1973, pp. 66-72.
8. Thakur, P. C., and J. G. Davis. How To Plan for Methane Con- trol in Underground Coal Mines. Min. Eng., v. 29, No. 10, Oct. 1977, pp. 4145.
9. Hasenfus, G. J., K. L. Johnson, and D. W. H. Su. A Hydrogeo- chemical Study of Overburden Aquifer Response to Longwall Mining. Paper in Ground Control in Mining (Proc. 7th Int. Conf., Morgantown, WV, Aug. 3-5, 1988). WV Univ., Morgantown, WV, 1988, pp. 149-162.
10. Kissell, F. N., and J. C. Edwards. Two-Phase Flow in Coalbeds. BuMines RI 8066, 1975, 16 pp.
11. Kuuskraa, V. A., and C. F. Brandenburg. Coalbed Methane Sparks a New Energy Industry. Oil and Gas J., v. 87, Oct. 9, 1989, pp. 49-56.
12. Curl, S. J. Methane Prediction in Coal Mines. IEA Coal Re- search, London, England, Rep. ICI'IS/TR 04, Dec. 1978, 80 pp.
13. Diamond, W. P., W. R Bodden 111, M. D. Zuber, and R A. Schraufnagel. Measuring the Extent of Coalbed Gas Drainage After 10 Years of Production at the Oak Grove Pattern, AL. Paper 8961 in Proceedins of the 1989 Coalbed Methane Symposium (Tuscaloosa, AL, Apr. 17-20, 1989). Univ. AL, Tuscaloosa, AL, 1989, pp. 185-193.
14. Garcia, F., and J. Cervik. Methane Control on Longwalls With Cross-Measure Boreholes (Lower Kittanning Coalbed). BuMines RI 8985,1985,17 pp.
15. Campoli, A. A., J. C e ~ k , and S. J. Schatzel. Control of Long- wall Gob Gas With Cross-Measure Boreholes (Upper Kittanning Coal- bed). BuMines RI 8841, 1983, 17 pp.
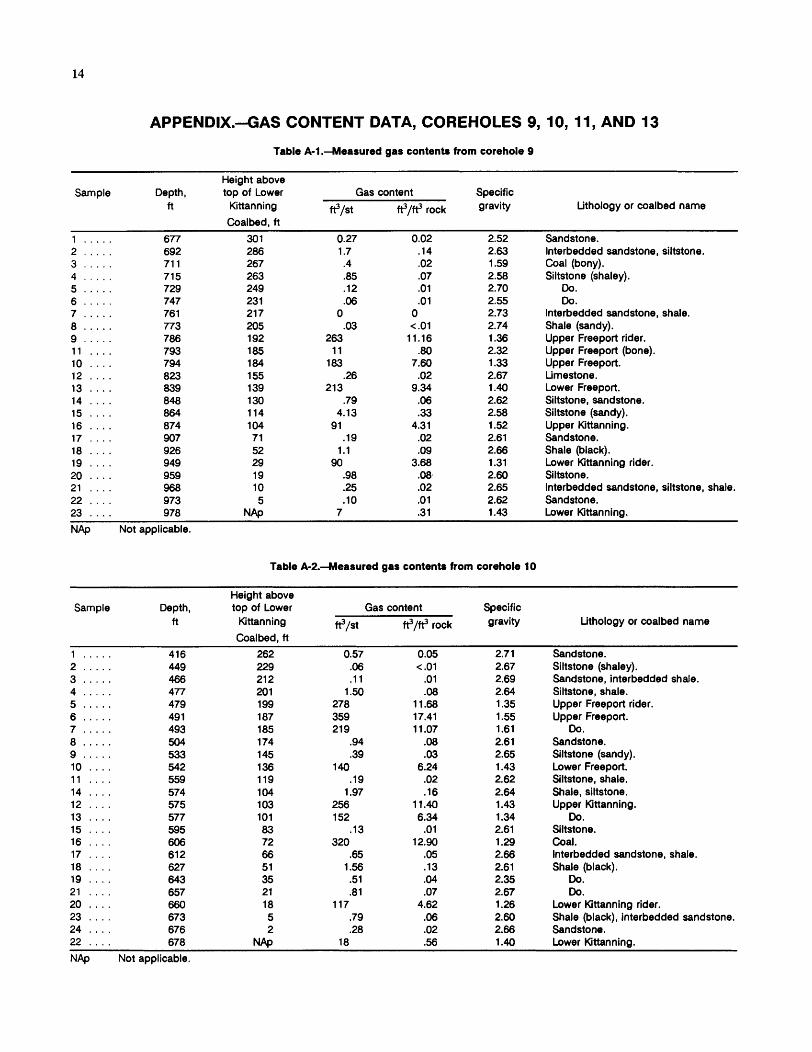
APPENDIX.--GAS CONTENT DATA, COREHOLES 9,10,11, AND 13
Table A-1.4easured gas contents from corehole 9
Height above Sample Depth, top of Lower Gas content Specific
ft Kittanning @/st @/@ rock gravity Lithology or walbed name
Coalbed, ft
1 . . . . . 677 301 0.27 0.02 2.52 Sandstone. 2 . . . . . 692 286 1.7 -14 2.63 lnterbedded sandstone, siltstone. 3 . . . . . 71 1 267 .4 .02 1.59 Coal (bony). 4 . . . . . 715 263 .85 .07 2.58 Siltstone (shaley). 5 . . . . . 729 249 .12 .O1 2.70 Do. 6 . . . . . 747 23 1 .06 .O1 2.55 Do. 7 . . . . . 76 1 21 7 0 0 2.73 lnterbedded sandstone, shale. 8 . . . . . 773 205 .03 < .O1 2.74 Shale (sandy). 9 . . . . . 786 192 263 11.16 1.36 Upper Freeport rider. 1 1 . . . . 793 1 85 1 1 .80 2.32 Upper Freeport (bone). 10 . . . . 794 1 84 1 83 7.60 1.33 Upper Freeport. 12 . . . . 823 155 .26 .02 2.67 Limestone. 13 . . . . 839 139 21 3 9.34 1 .# Lower Freeport. 14 . . . . 848 130 .79 .06 2.62 Siltstone, sandstone. 15 . . . . 864 114 4.13 .33 2.58 Siltstone (sandy). 16 . . . . 874 104 91 4.3 1 1.52 Upper Kittanning. 17 . . . . 907 71 .19 .02 2.61 Sandstone. 18 . . . . 926 52 1.1 .09 2.66 Shale (black). 19 . . . . 949 29 90 3.68 1.31 Lower Kittanning rider. 20 . . . . 959 19 .98 .08 2.60 Siltstone. 21 . . . . 968 10 .25 .02 2.65 lnterbedded sandstone, siltstone, shale. 22 . . . . 973 5 .I0 .O 1 2.62 Sandstone. 23 . . . . 978 NAP 7 .3 1 1.43 Lower Kittanning.
NAp Not applicable.
Table A-2.4easured gas contents from corehole 10
~~~~~~
Height above Sample Depth, top of Lower Gas content Specific
ft Kittanning @/st @/@ rock gravity Lithology or coalbed name
Coalbed, ft
1 . . . . . 416 262 0.57 0.05 2.7 1 Sandstone. 2 . . . . . 449 229 .06 < .O1 2.67 Siltstone (shaley). 3 . . . . . 466 21 2 .ll .O1 2.69 Sandstone, interbedded shale. 4 . . . . . 477 201 1.50 .08 2.64 Siltstone, shale. 5 . . . . . 479 199 278 11.68 1.35 Upper Freeport rider. 6 . . . . . 49 1 187 359 17.41 1.55 Upper Freeport. 7 . . . . . 493 185 21 9 1 1.07 1.61 Do. 8 . . . . . 504 174 .94 .08 2.61 Sandstone. 9 . . . . . 533 145 .39 .03 2.65 Siltstone (sandy). 10 . . . . 542 136 140 6.24 1.43 Lower Freeport. 1 1 . . . . 559 119 .19 .02 2.62 Siltstone, shale. 14 . . . . 574 104 1.97 .16 2.64 Shale, siltstone. 12 . . . . 575 103 256 11.40 1.43 Upper Kittanning. 13 . . . . 577 101 152 6.34 1.34 Do. 15 . . . . 595 83 .13 .O1 2.61 Siltstone. 16 . . . . 606 72 320 12.90 1.29 Coal. 17 . . . . 612 66 .65 .05 2.66 lnterbedded sandstone, shale. 18 . . . . 627 51 1.56 .13 2.61 Shale (black). 19 . . . . 643 35 .51 .04 2.35 Do. 21 . . . . 657 21 -81 .07 2.67 Do. 20 . . . . 660 18 117 4.62 1.26 Lower Kittanning rider. 23 . . . . 673 5 .79 .06 2.60 Shale (black), interbedded sandstone. 24 . . . . 676 2 .28 .02 2.66 Sandstone. 22 . . . . 678 NAI> 18 .56 1 .# Lower Kittanning. NAp Not applicable.

Table A-3.--Measured gas contents from corehole 11
Height above Sample Depth, top of Lower Gas content Specific
ft Kittanning elst VIP gravity Lithology or coalbed name
Coalbed, ft
Sandstone. lnterbedded siltstone, shale. Sandstone.
Do. Sandstone, interbedded shale. Upper Freeport rider. Upper Freeport. Limestone, sandstone. Sandstone (shaley). Lower Freeport. Siltstone. Upper Kittanning. Sandstone. Shale (sandy). lnterbedded shale, siltstone. Shale (black). lnterbedded siltstone, shale. Sandstone.
Table A-4.-Measured gas contents from corehole 13
Height above Sample Depth, top of Lower Gas content Specific
ft Kittanning *lst ft3lft3 rock gravity Lithology or coalbed name
Coalbed, ft
1 . . . . 69 1 290 0.93 0.08 2.61 lnterbedded sandstone, shale. 2 . . . . 71 8 263 .65 .05 2.57 Siltstone. 3 . . . . 73 1 250 .21 .02 2.63 Do. 4 . . . . 75 1 230 .19 .02 2.64 Do. 5 . . . . 763 21 8 .04 <.01 2.67 Shale, interbedded sandstone. 6 . . . . 774 207 .15 .O 1 2.67 Shale. 7 . . . . 788 193 102 4.30 1.35 Upper Freeport rider. 9 . . . . 797 184 30 2.26 2.42 Upper Freeport (bone). 8 . . . . 798 1 83 118 4.95 1.34 Upper Freeport. 10 . . . 823 158 .18 .01 2.59 Limestone. 11 . . . 84 1 140 60 2.69 1.44 Lower Freeport. 12 . . . 852 1 29 .56 .05 2.59 Sandstone. 13 . . . 862 119 .60 .05 2.69 Siltstone. 14 . . . 877 104 6 1 2.58 1.36 Upper Kittanning. 15 . . . 904 77 .47 .04 2.60 Siltstone. 16 . . . 910 71 .17 .O 1 2.65 Sandstone. 17 . . . 929 52 2.21 .17 2.53 Shale (black). 18 . . . 952 29 39 1.57 1.29 Lower Kittanning rider. 19 . . . 964 17 .15 .O 1 2.61 Shale (silty). 20 . . . 972 9 .14 .O1 2.64 Shale, interbedded sandstone.