determining the size of a sample. ch 132 sample accuracy sample accuracy: refers to how close a...
TRANSCRIPT
Determining the Size of a Sample
Ch 13 2
Sample Accuracy
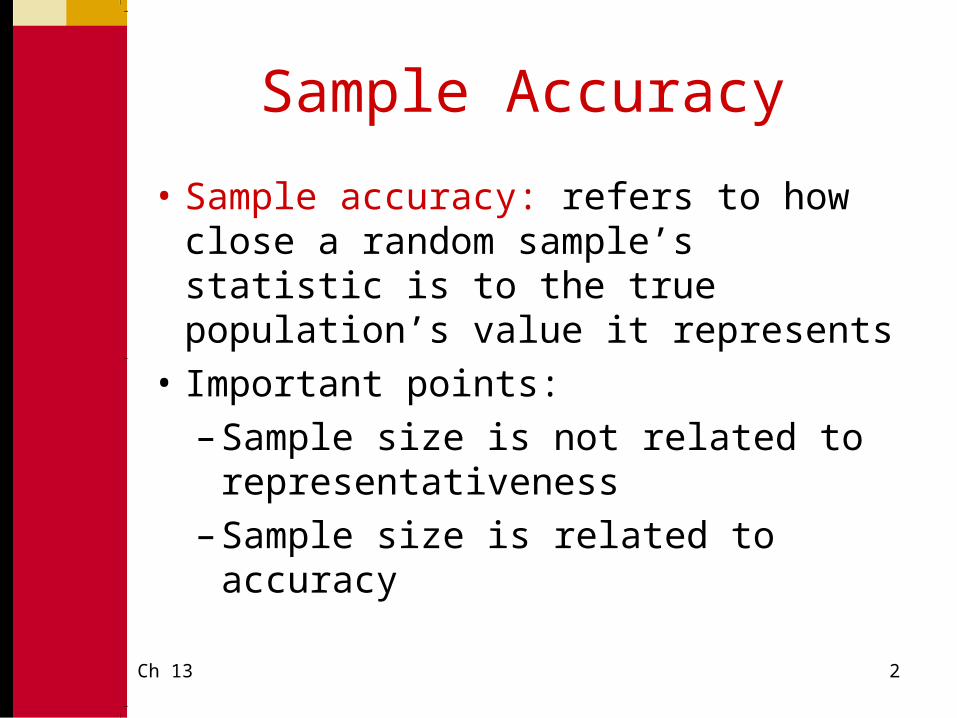
• Sample accuracy: refers to how close a random sample’s statistic is to the true population’s value it represents
• Important points:
– Sample size is not related to representativeness
– Sample size is related to accuracy
Ch 13 3
Sample Size and Accuracy
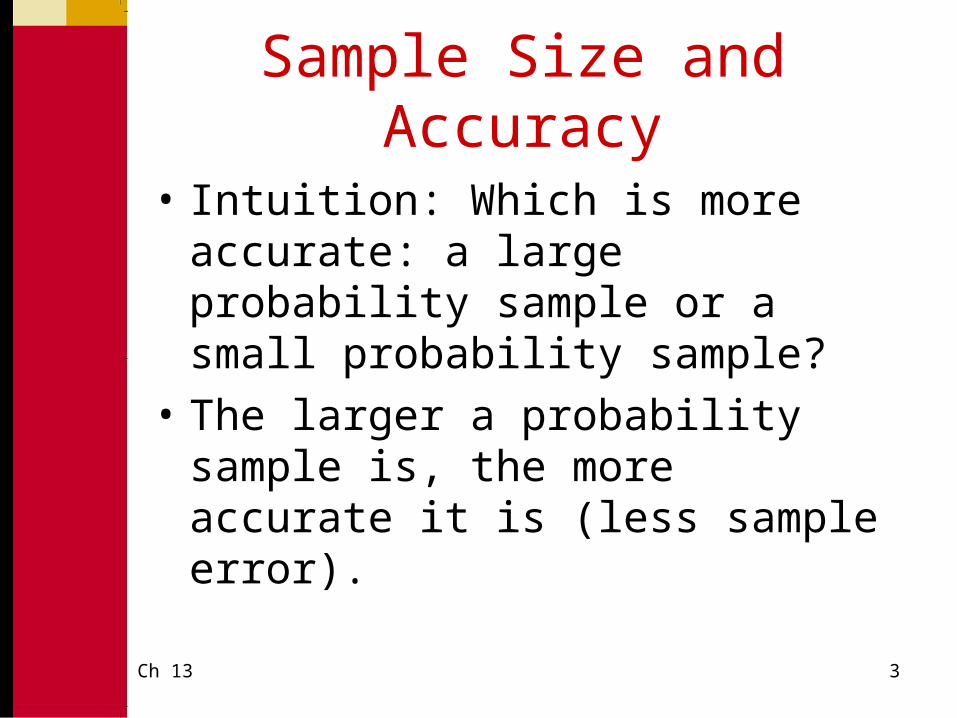
• Intuition: Which is more accurate: a large probability sample or a small probability sample?
• The larger a probability sample is, the more accurate it is (less sample error).
Ch 13 4
A Picture Says 1,000 Words
Sample Size and Accuracy
0%2%4%6%8%
10%12%14%16%
Sample Size
Accu
racy
±
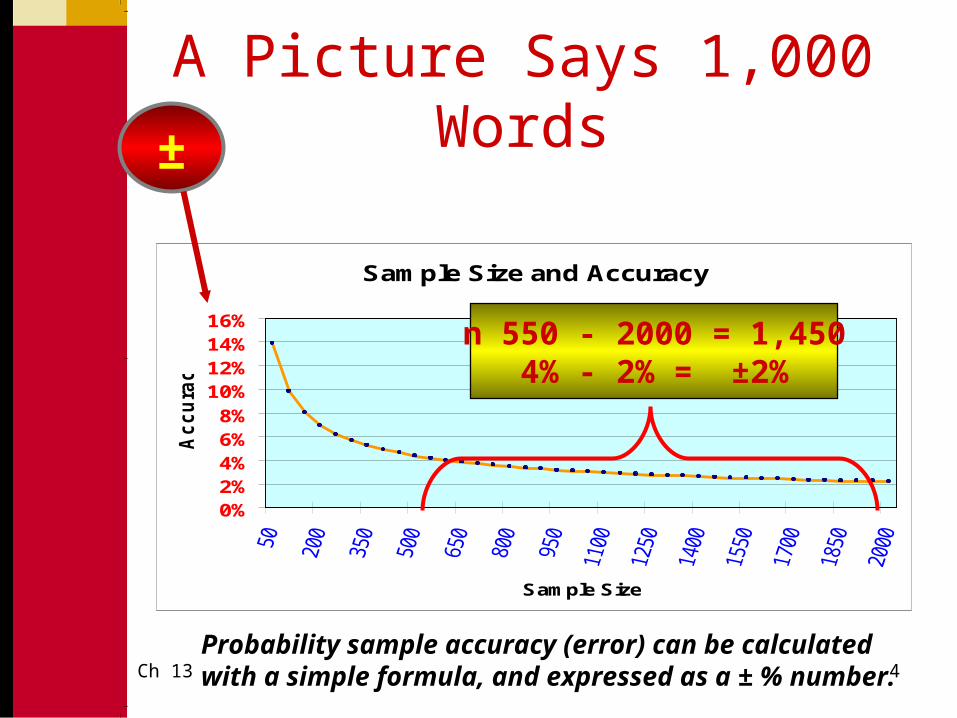
Probability sample accuracy (error) can be calculated with a simple formula, and expressed as a ± % number.
n 550 - 2000 = 1,4504% - 2% = ±2%
Ch 13 5
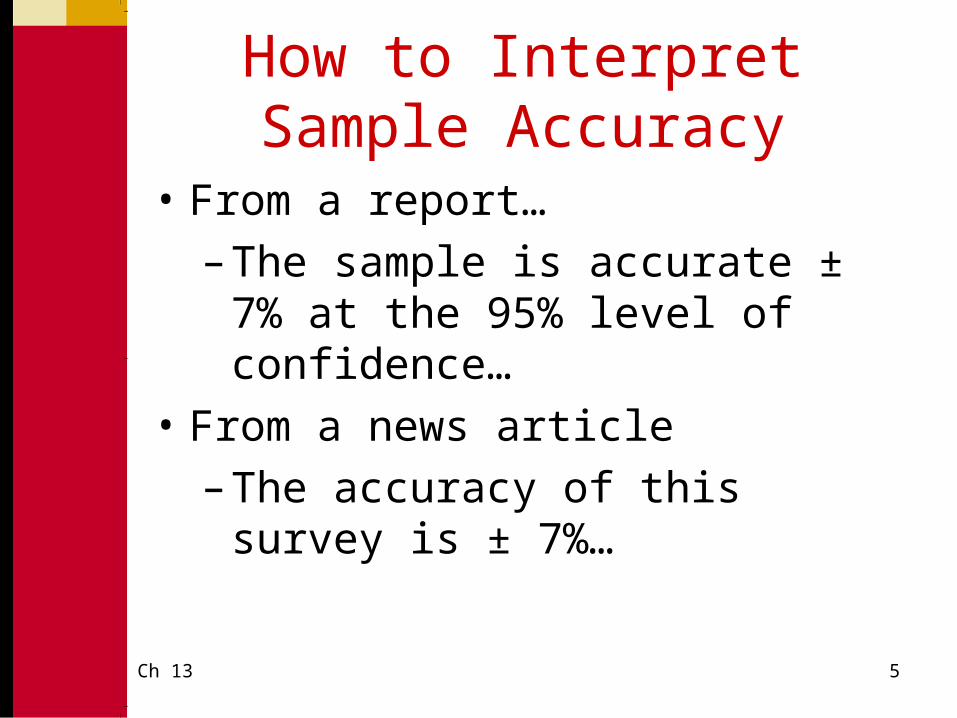
How to Interpret Sample Accuracy
• From a report…
– The sample is accurate ± 7% at the 95% level of confidence…
• From a news article
– The accuracy of this survey is ± 7%…
Ch 13 6
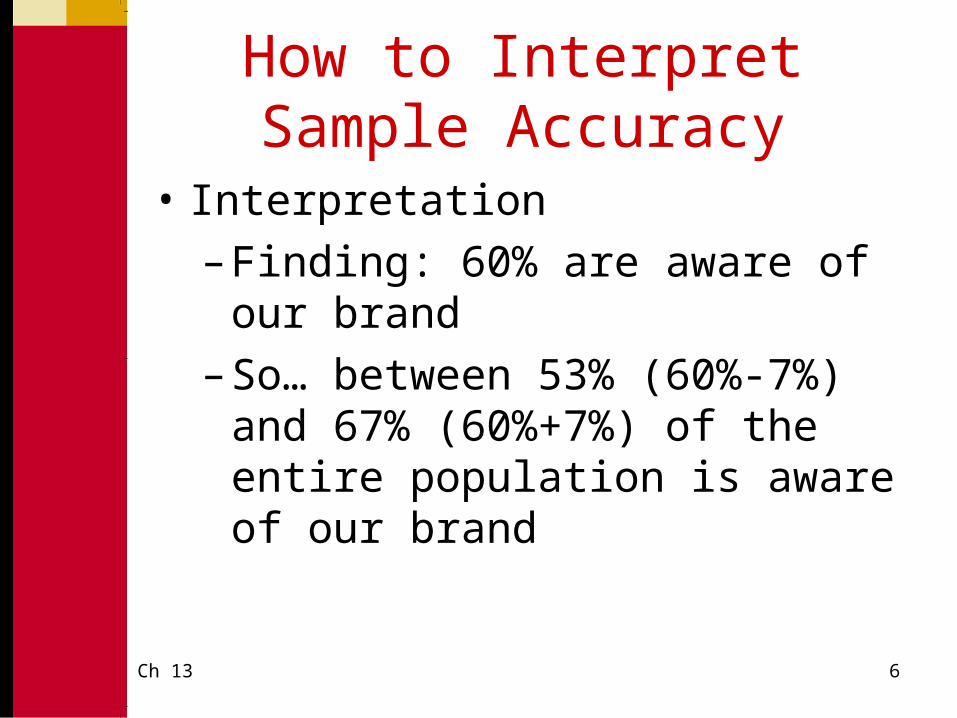
How to Interpret Sample Accuracy
• Interpretation
– Finding: 60% are aware of our brand
– So… between 53% (60%-7%) and 67% (60%+7%) of the entire population is aware of our brand
Ch 13 7
Sample Size Axioms
• To properly understand how to determine sample size, it helps to understand the following axioms…
Ch 13 8
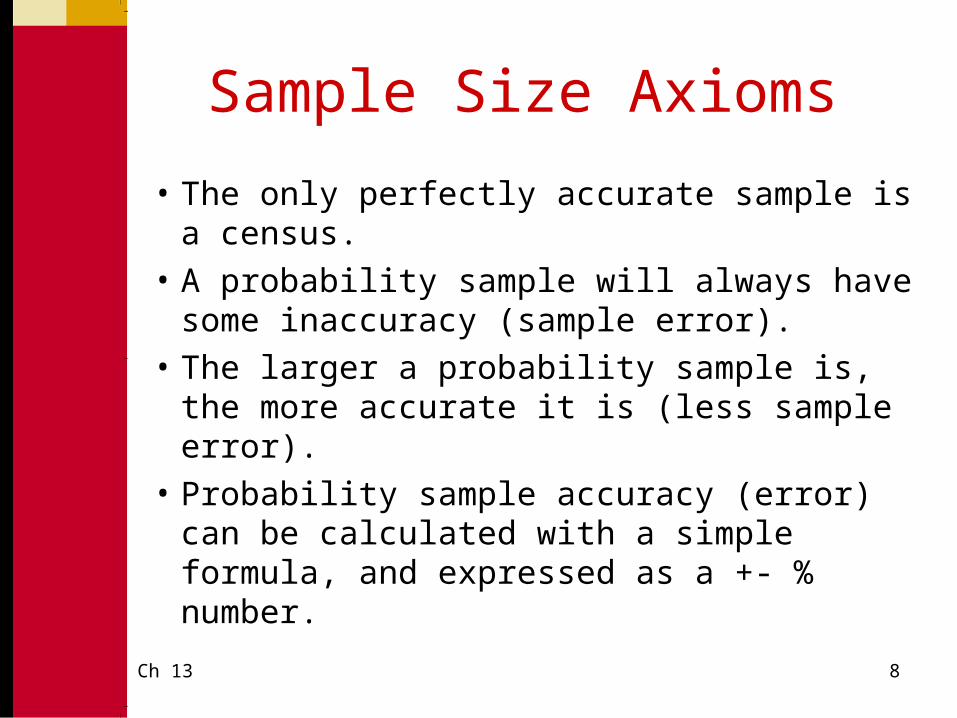
Sample Size Axioms
• The only perfectly accurate sample is a census.
• A probability sample will always have some inaccuracy (sample error).
• The larger a probability sample is, the more accurate it is (less sample error).
• Probability sample accuracy (error) can be calculated with a simple formula, and expressed as a +- % number.
Ch 13 9
Sample Size Axioms
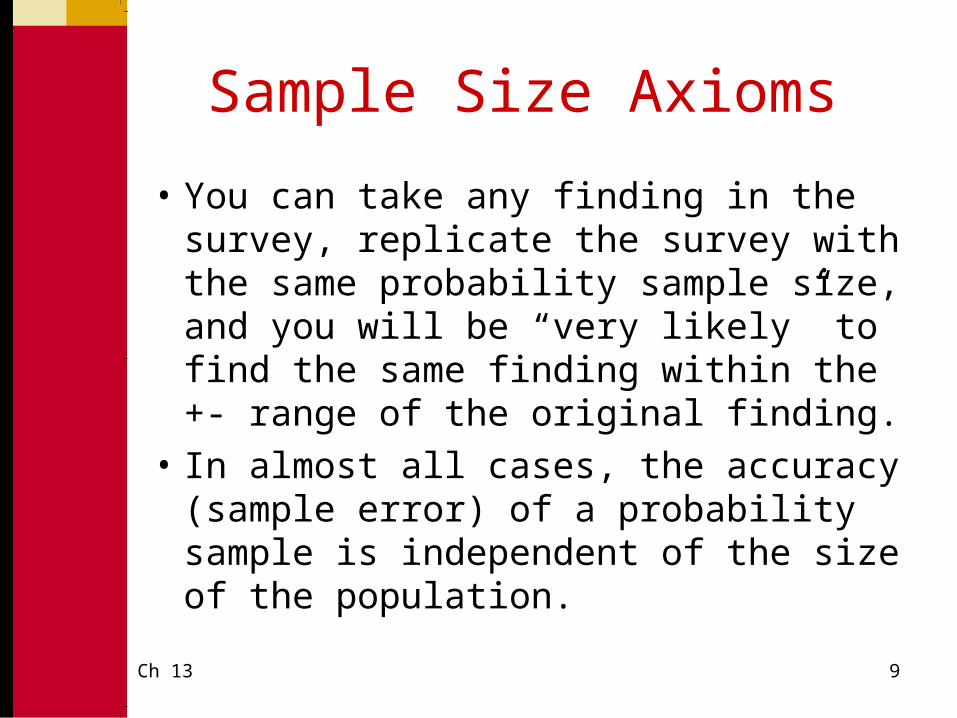
• You can take any finding in the survey, replicate the survey with the same probability sample size, and you will be “very likely” to find the same finding within the +- range of the original finding.
• In almost all cases, the accuracy (sample error) of a probability sample is independent of the size of the population.
Ch 13 10
Sample Size Axioms
• A probability sample can be a very tiny percentage of the population size and still be very accurate (have little sample error).
Ch 13 11
Population Size
e=±3% Sample Size
e=±4% Sample Size
10,000 ____ ____
100,000 ____ ____
1,000,000 ____ ____
100,000,000
____ ____
Sample Size and Population Size
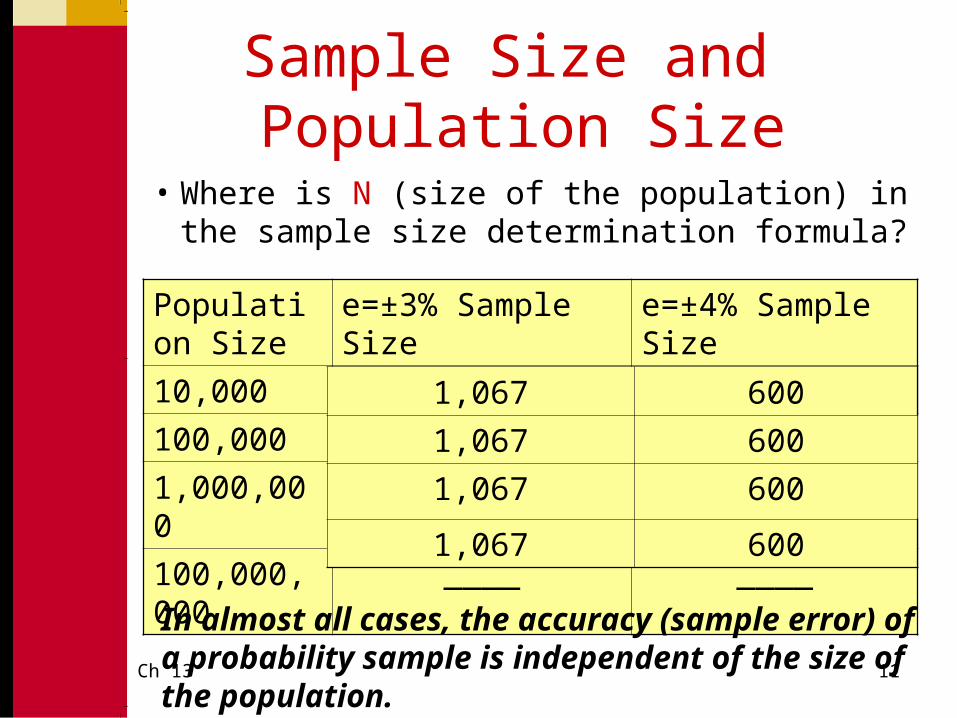
• Where is N (size of the population) in the sample size determination formula?
1,067 600
1,067 600
1,067 600
1,067 600
In almost all cases, the accuracy (sample error) of a probability sample is independent of the size of the population.
Ch 13 12
Sample Size and Population Size
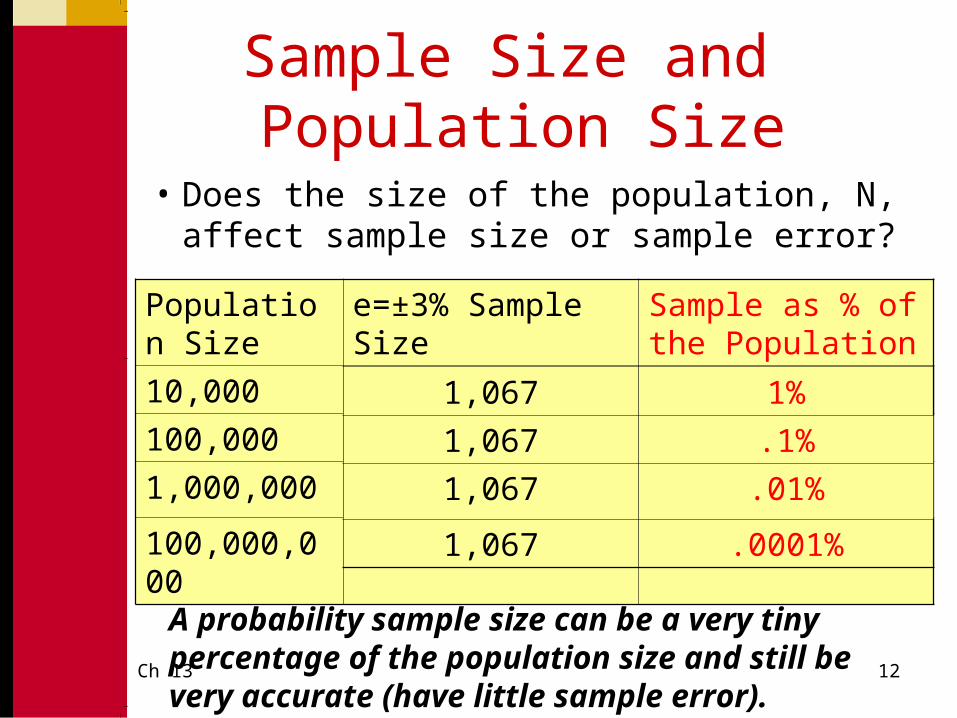
• Does the size of the population, N, affect sample size or sample error?
A probability sample size can be a very tiny percentage of the population size and still be very accurate (have little sample error).
Population Size
e=±3% Sample Size
Sample as % of the Population
10,000 ____ ___%
100,000 ____ ___%
1,000,000 ____ ___%
100,000,000 ____ ___%
1,067 1%
1,067 .1%
1,067 .01%
1,067 .0001%

Ch 13 13
Sample Size Axiom
• The size of the probability sample depends on the client’s desired accuracy (acceptable sample error) balanced against the cost of data collection for that sample size.
Ch 13 14
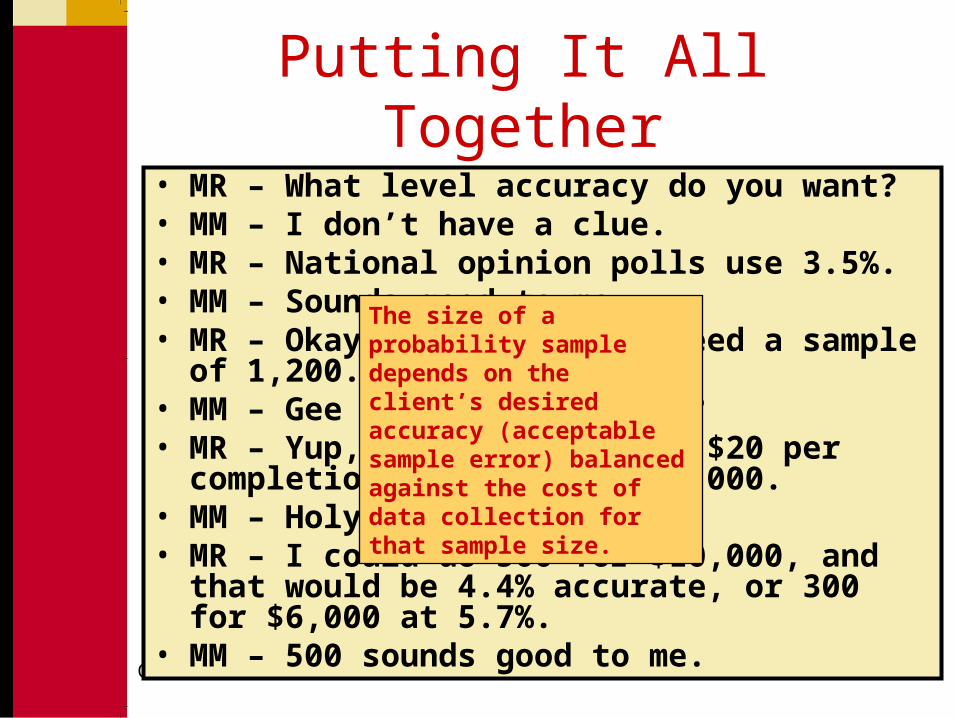
Putting It All Together
• MR – What level accuracy do you want?• MM – I don’t have a clue.• MR – National opinion polls use 3.5%.• MM – Sounds good to me.• MR – Okay, that means we need a sample of
1,200.• MM – Gee Whiz. That small?• MR – Yup, and at a cost of $20 per completion, it
will be $24,000.• MM – Holy Cow! That much?• MR – I could do 500 for $10,000, and that would
be 4.4% accurate, or 300 for $6,000 at 5.7%.• MM – 500 sounds good to me.
The size of a probability sample depends on the client’s desired accuracy (acceptable sample error) balanced against the cost of data collection for that sample size.
Ch 13 15
• There is only one method of determining sample size that allows the researcher to PREDETERMINE the accuracy of the sample results…
The Confidence The Confidence Interval Method of Interval Method of
Determining Sample Determining Sample SizeSize
Ch 13 16
The Confidence Interval Method of Determining Sample Size
• This method is based upon the Confidence Interval and the Central Limit Theorem…
• Confidence interval: range whose endpoints define a certain percentage of the response to a question

Ch 13 17
The Confidence Interval Method of Determining Sample Size
• Confidence interval approach: applies the concepts of accuracy, variability, and confidence interval to create a “correct” sample size
• Two types of error:– Nonsampling error: pertains to all
sources of error other than sample selection method and sample size
– Sampling error: involves sample selection and sample size
Ch 13 18
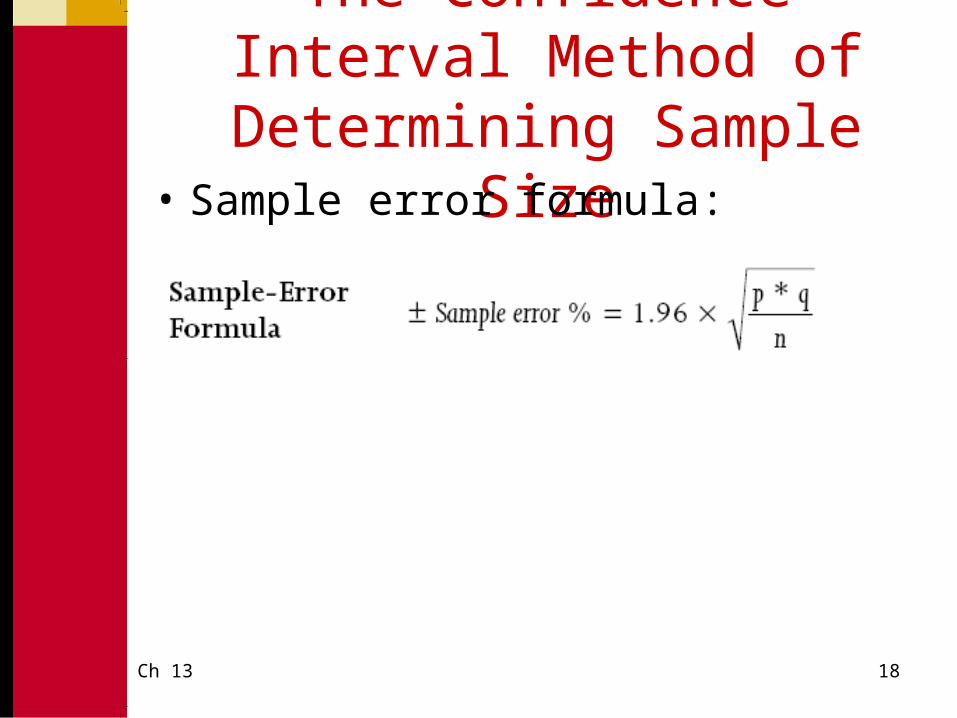
The Confidence Interval Method of Determining Sample Size
• Sample error formula:
Ch 13 19
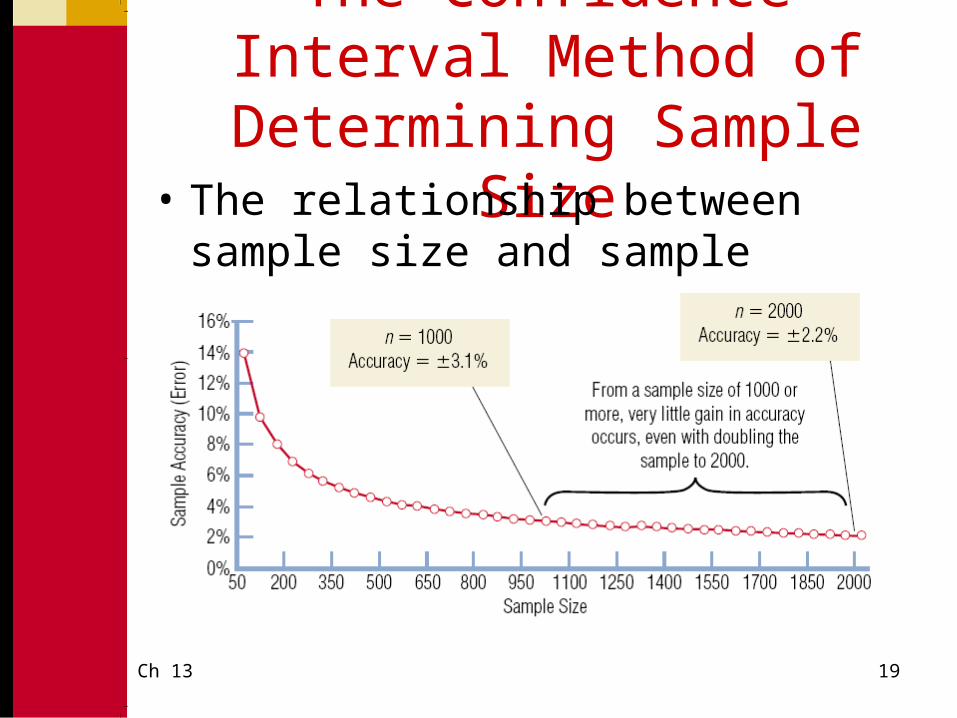
The Confidence Interval Method of Determining Sample Size
• The relationship between sample size and sample error:
Ch 13 20
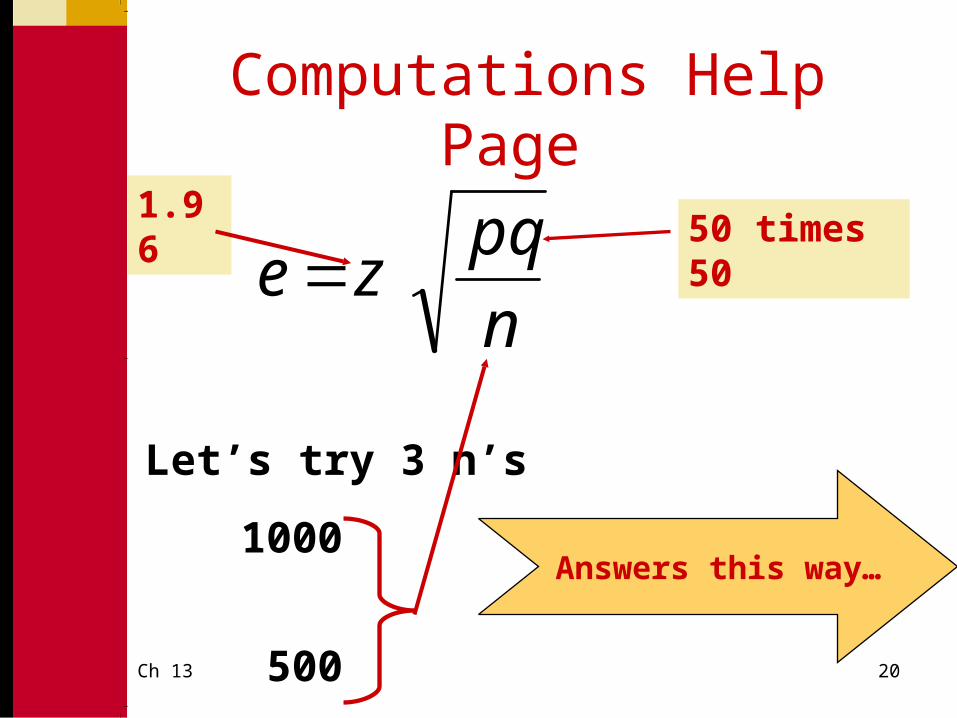
Computations Help Page
n
pqze
Let’s try 3 n’s
1000
500
100
1.9650 times 50
Answers this way…
Ch 13 21
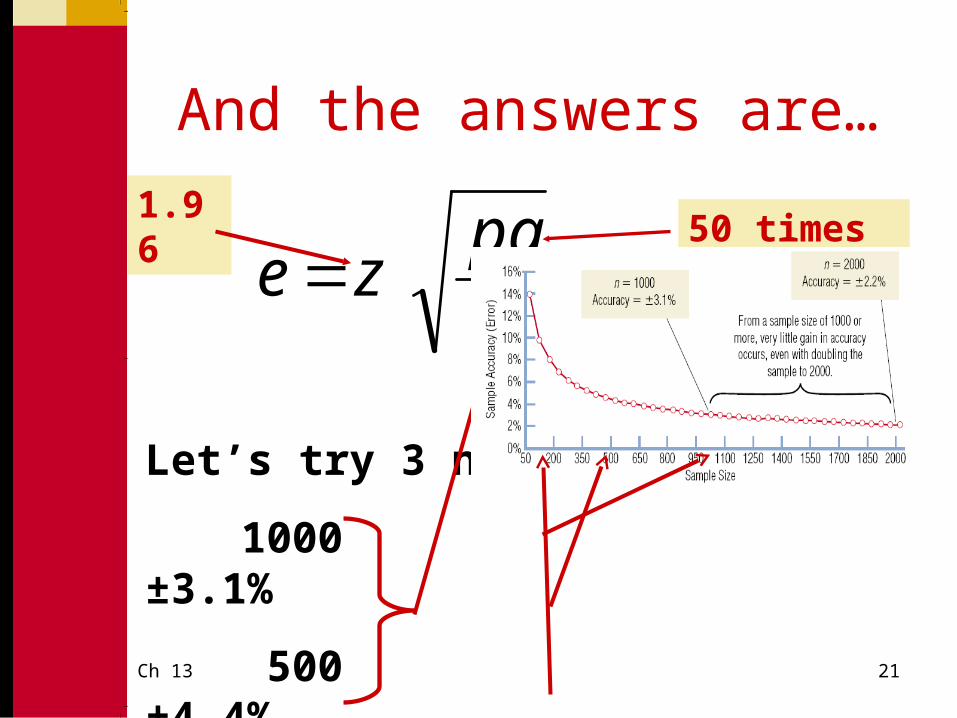
And the answers are…
n
pqze
Let’s try 3 n’s
1000 ±3.1%
500 ±4.4%
100 ±9.8%
1.9650 times 50
Ch 13 22
Review: What does sample accuracy mean?
• 95% Accuracy
– Calculate your sample’s finding, p%
– Calculate your sample’s accuracy, ± e%
– You will be 95% confident that the population percentage (π) lies between p% ± e%
Ch 13 23
Review: What does sample accuracy mean?
• Example
– Sample size of 1,000
– Finding: 40% of respondents like our brand
– Sample accuracy is ± 3% (via our formula)
– So 37% - 43% like our brand
Ch 13 24
The Confidence Interval Method of Determining Sample Size
• Variability: refers to how similar or dissimilar responses are to a given question
• P: percent• Q: 100%-P• Important point: the more variability in
the population being studied, the higher the sample size needed to achieve a stated level of accuracy.
Ch 13 25
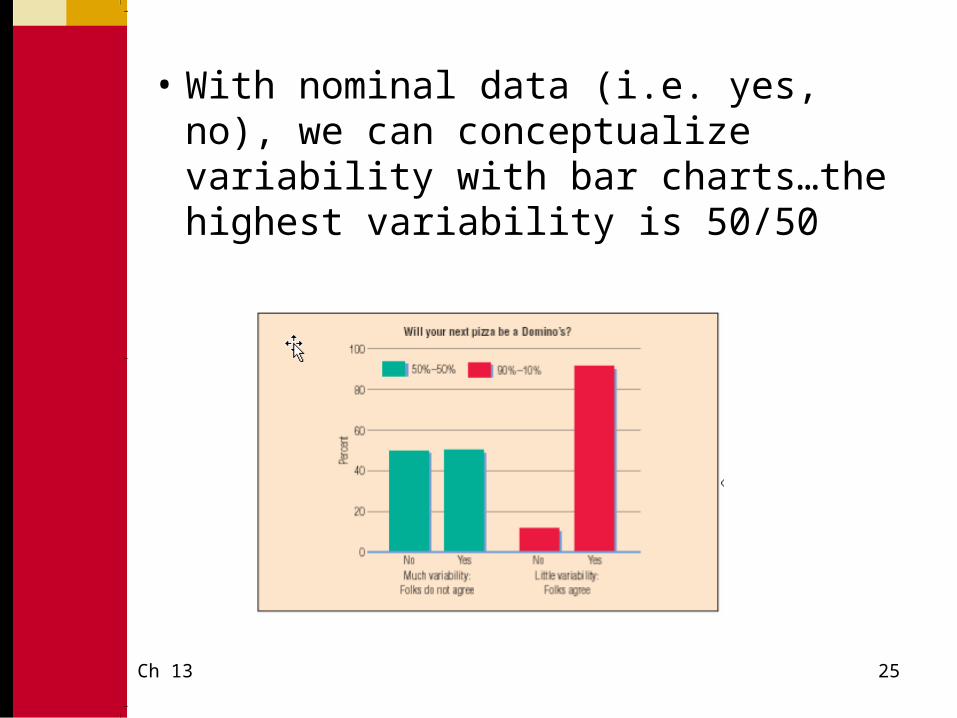
• With nominal data (i.e. yes, no), we can conceptualize variability with bar charts…the highest variability is 50/50
Ch 13 26
Confidence Interval Approach
• The confidence interval approach is based upon the normal curve distribution.
• We can use the normal distribution because of the CENTRAL LIMITS THEOREM…regardless of the shape of the population’s distribution, the distribution of samples (of n at least =30) drawn from that population will form a normal distribution.
Ch 13 27
Central Limits Theorem
• The central limits theorem allows us to use the logic of the normal curve distribution.
• Since 95% of samples drawn from a population will fall + or – 1.96 x sample error (this logic is based upon our understanding of the normal curve) we can make the following statement…
Ch 13 28
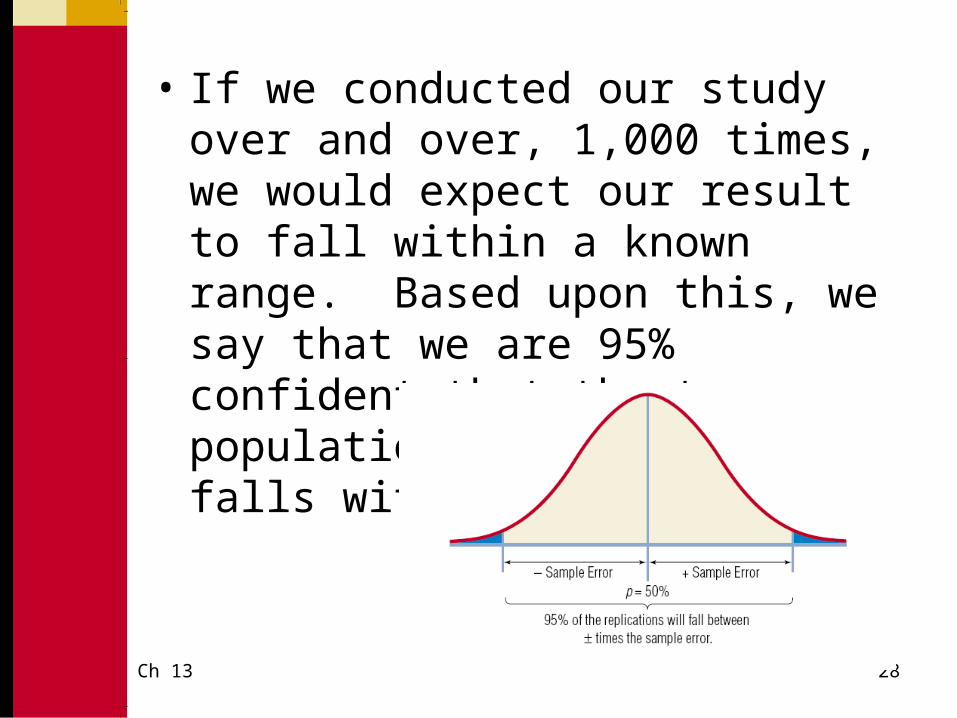
• If we conducted our study over and over, 1,000 times, we would expect our result to fall within a known range. Based upon this, we say that we are 95% confident that the true population range value falls within this range.
Ch 13 29
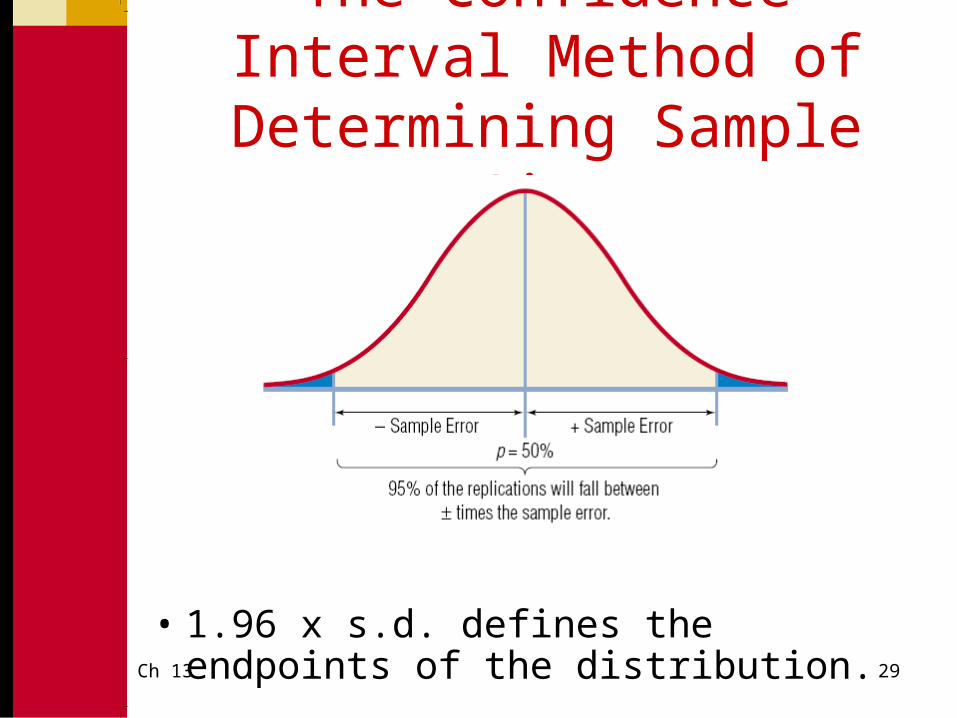
The Confidence Interval Method of Determining Sample Size
• 1.96 x s.d. defines the endpoints of the distribution.
Ch 13 30
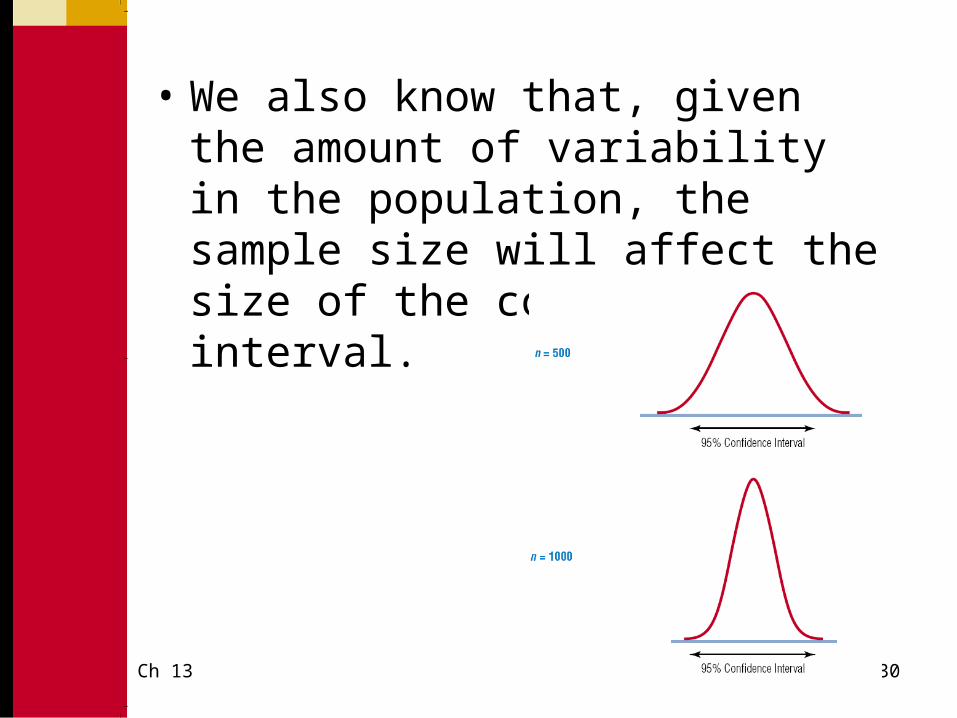
• We also know that, given the amount of variability in the population, the sample size will affect the size of the confidence interval.
Ch 13 31
So, what have we learned thus far?
• There is a relationship between:– The level of confidence we wish to
have that our results would be repeated within some known range if we were to conduct the study again, and…
– Variability in the population and…
– The amount of acceptable sample error (desired accuracy) we wish to have and…
– The size of the sample!
Ch 13 32
Sample Size Formula• Fortunately, statisticians have given us a
formula which is based upon these relationships.– The formula requires that we
• Specify the amount of confidence we wish
• Estimate the variance in the population• Specify the amount of desired accuracy we
want.
– When we specify the above, the formula tells us what sample we need to use…n
Ch 13 33
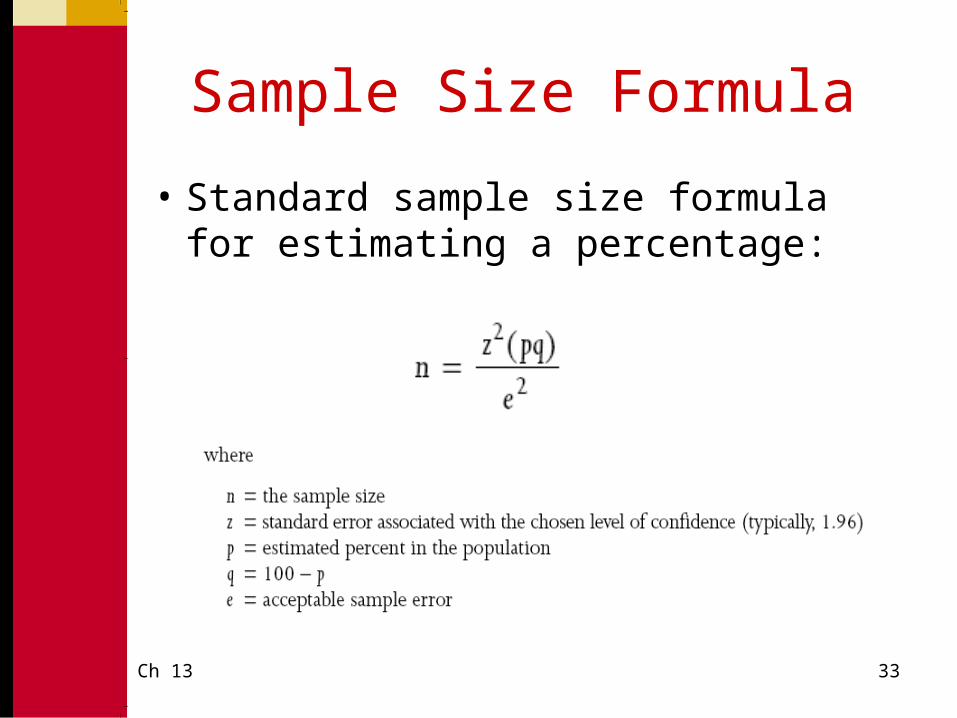
Sample Size Formula
• Standard sample size formula for estimating a percentage:
Ch 13 34
Practical Considerations in Sample Size Determination
• How to estimate variability (p times q) in the population
– Expect the worst cast (p=50; q=50)
– Estimate variability: Previous studies? Conduct a pilot study?
Ch 13 35
Practical Considerations in Sample Size Determination
• How to determine the amount of desired sample error
– Researchers should work with managers to make this decision. How much error is the manager willing to tolerate?
– Convention is + or – 5%
– The more important the decision, the more (smaller number) the sample error.

Ch 13 36
Practical Considerations in Sample Size Determination
• How to decide on the level of confidence desired– Researchers should work with
managers to make this decision. The more confidence, the larger the sample size.
– Convention is 95% (z=1.96)– The more important the decision,
the more likely the manager will want more confidence. 99% confidence, z=2.58.
Ch 13 37
ExampleEstimating a Percentage in the Population• What is the required sample size?
– Five years ago a survey showed that 42% of consumers were aware of the company’s brand (Consumers were either “aware” or “not aware”)
– After an intense ad campaign, management wants to conduct another survey and they want to be 65% confident that the survey estimate will be within ±5% of the true percentage of “aware” consumers in the population.
– What is n?
Ch 13 38
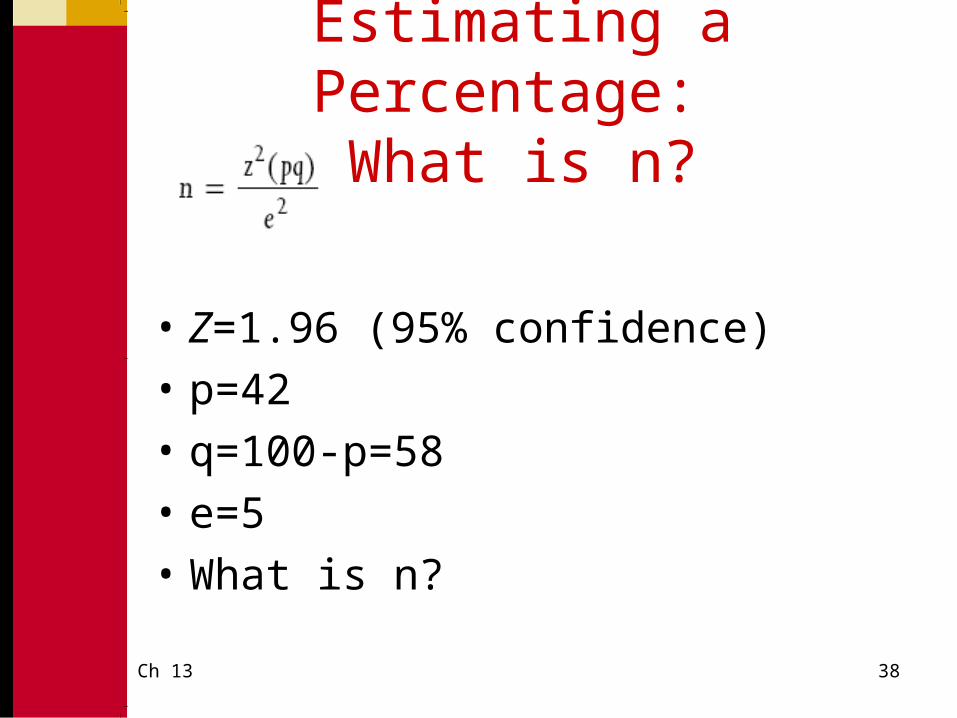
Estimating a Percentage: What is n?
• Z=1.96 (95% confidence)
• p=42
• q=100-p=58
• e=5
• What is n?
Ch 13 39
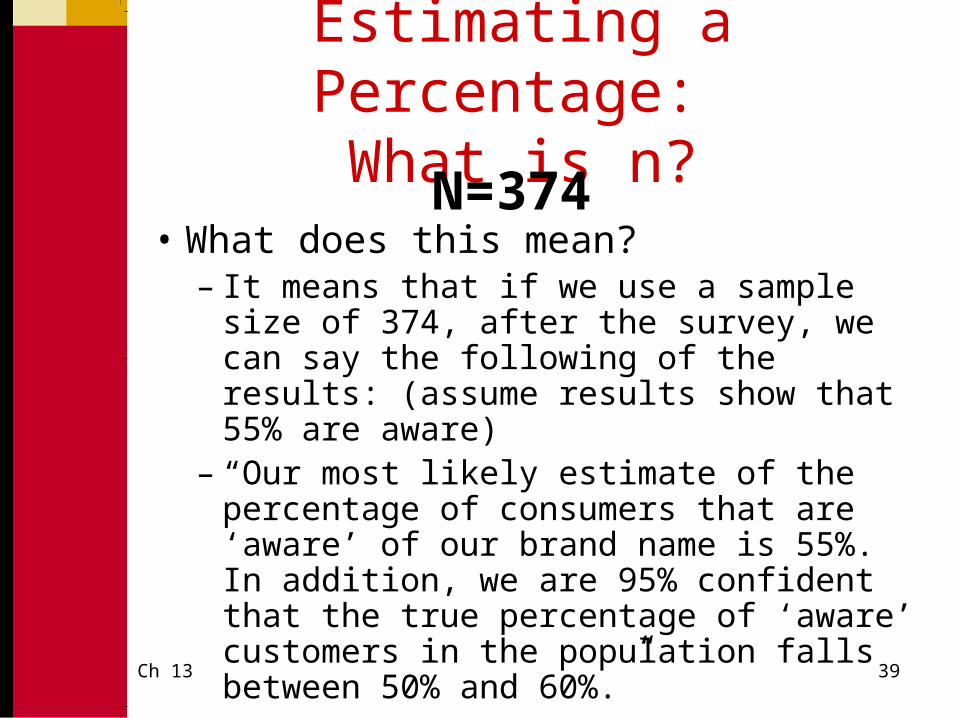
Estimating a Percentage: What is n?
• What does this mean?– It means that if we use a sample size of
374, after the survey, we can say the following of the results: (assume results show that 55% are aware)
– “Our most likely estimate of the percentage of consumers that are ‘aware’ of our brand name is 55%. In addition, we are 95% confident that the true percentage of ‘aware’ customers in the population falls between 50% and 60%.”
N=374
Ch 13 40
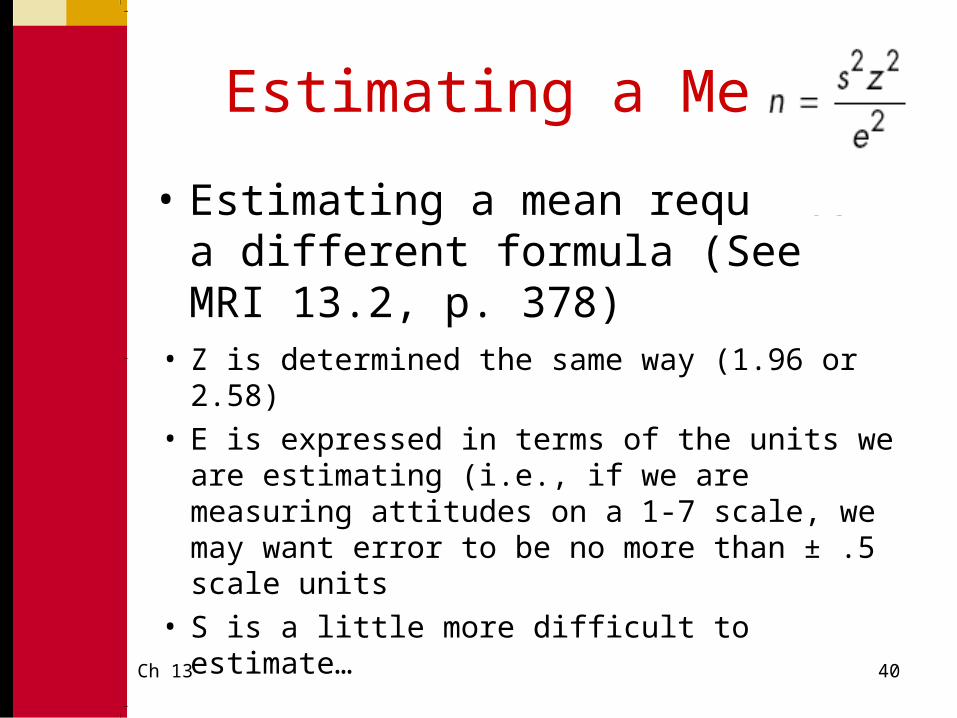
Estimating a Mean
• Estimating a mean requires a different formula (See MRI 13.2, p. 378)
• Z is determined the same way (1.96 or 2.58)
• E is expressed in terms of the units we are estimating (i.e., if we are measuring attitudes on a 1-7 scale, we may want error to be no more than ± .5 scale units
• S is a little more difficult to estimate…
Ch 13 41
Estimating s
• Since we are estimating a mean, we can assume that our data are either interval or ratio. When we have interval or ratio data, the standard deviation, s, may be used as a measure of variance.
Ch 13 42
Estimating s
• How to estimate s?– Use standard deviation from a
previous study on the target population.
– Conduct a pilot study of a few members of the target population and calculate s.
– Estimate the range the value you are estimating can take on (minimum and maximum value) and divide the range by 6.
Ch 13 43
Estimating s
– Why divide the range by 6?• The range covers the entire
distribution and ± 3 (or 6) standard deviations cover 99.9% of the area under the normal curve. Since we are estimating one standard deviation, we divide the range by 6.
Ch 13 44
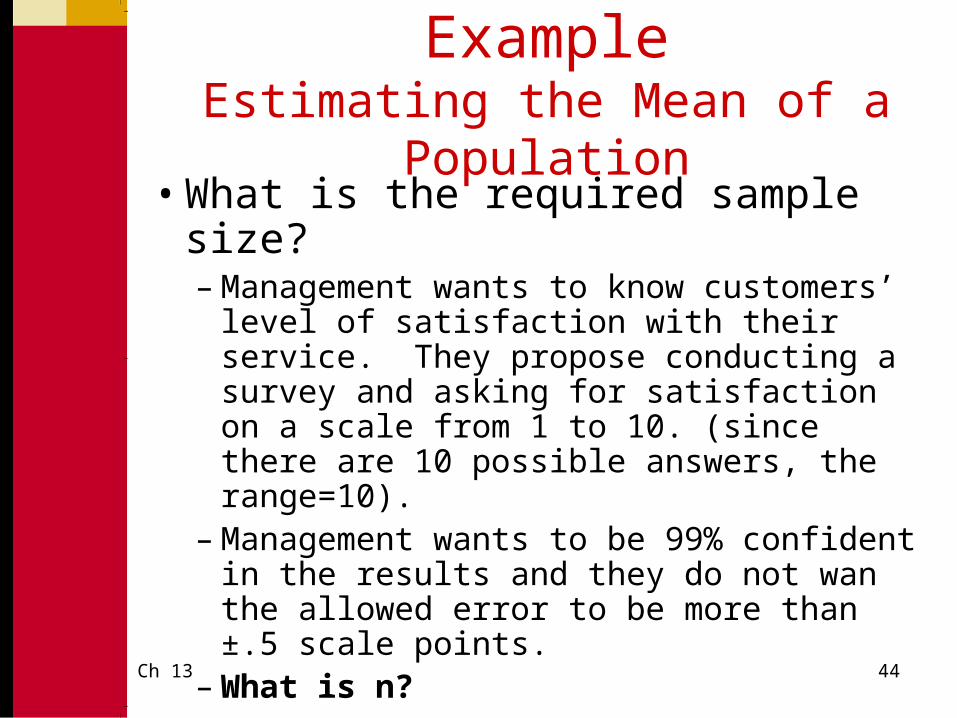
ExampleEstimating the Mean of a Population
• What is the required sample size?– Management wants to know customers’
level of satisfaction with their service. They propose conducting a survey and asking for satisfaction on a scale from 1 to 10. (since there are 10 possible answers, the range=10).
– Management wants to be 99% confident in the results and they do not wan the allowed error to be more than ±.5 scale points.
– What is n?
Ch 13 45
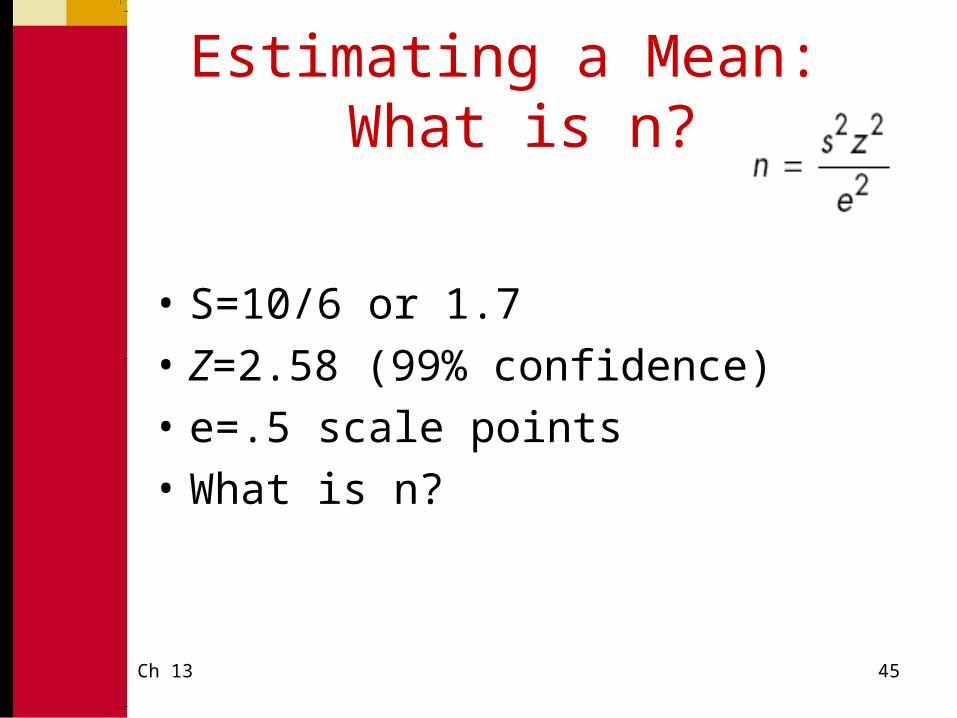
Estimating a Mean: What is n?
• S=10/6 or 1.7
• Z=2.58 (99% confidence)
• e=.5 scale points
• What is n?
Ch 13 46
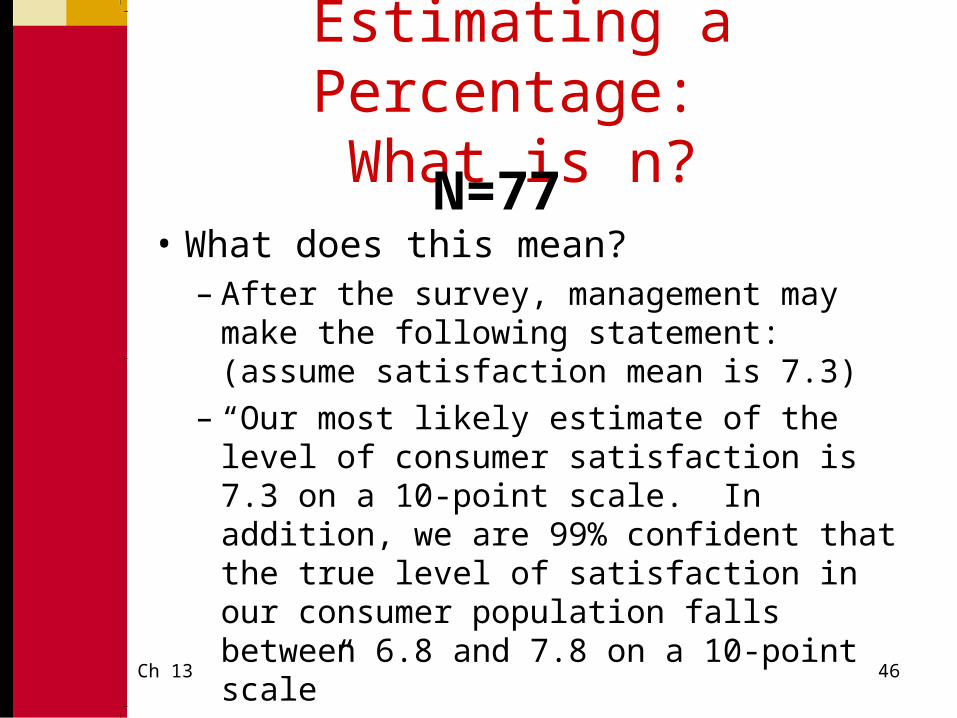
Estimating a Percentage: What is n?
• What does this mean?– After the survey, management may make
the following statement: (assume satisfaction mean is 7.3)
– “Our most likely estimate of the level of consumer satisfaction is 7.3 on a 10-point scale. In addition, we are 99% confident that the true level of satisfaction in our consumer population falls between 6.8 and 7.8 on a 10-point scale”
N=77

Ch 13 47
Other Methods of Sample Size Determination
• Arbitrary “percentage of thumb” sample size:
– Arbitrary sample size approaches rely on erroneous rules of thumb.
– Arbitrary sample sizes are simple and easy to apply, but they are neither efficient nor economical.
Ch 13 48
Other Methods of Sample Size Determination
• Conventional sample size specification:
– Conventional approach follows some convention: or number believed somehow to be the right sample size.
– Using conventional sample size can result in a sample that may be too large or too small.
– Conventional sample sizes ignore the special circumstances of the survey at hand.
Ch 13 49
Other Methods of Sample Size Determination
• Statistical analysis requirements of sample size specification:
– Sometimes the researcher’s desire to use particular statistical technique influences sample size
Ch 13 50
Other Methods of Sample Size Determination
• Cost basis of sample size specification:
– “All you can afford” method
– Instead of the value of the information to be gained from the survey being primary consideration in the sample size, the sample size is determined by budget factors that usually ignore the value of the survey’s results to management.
Ch 13 51
Special Sample Size Determination Situations
• Sampling from small populations:– Small population: sample exceeds
5% of total population size– Finite multiplier: adjustment factor for
sample size formula– Appropriate use of the finite
multiplier formula will reduce a calculated sample size and save money when performing research on small populations.
Ch 13 52
Special Sample Size Determination Situations
• Sample size using nonprobability sampling:
– When using nonprobability sampling, sample size is unrelated to accuracy, so cost-benefit considerations must be used.

Ch 13 53
Practice Examples
• We will do some examples from the questions and exercises at the end of the chapter on sample size…question 5 on page 386.
Ch 13 54
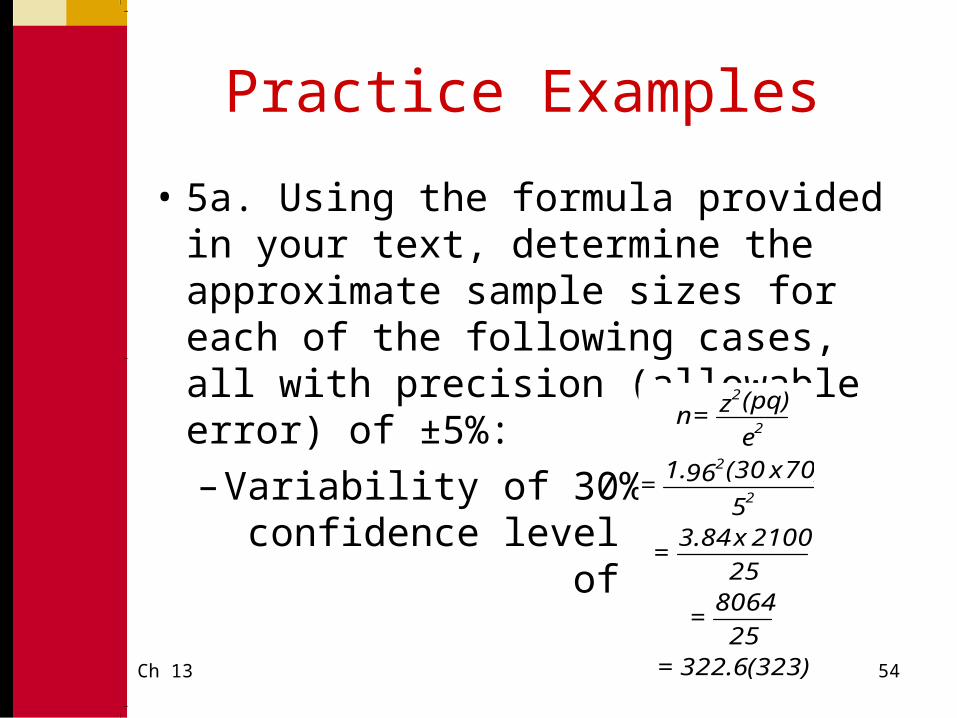
Practice Examples
• 5a. Using the formula provided in your text, determine the approximate sample sizes for each of the following cases, all with precision (allowable error) of ±5%:
– Variability of 30%, confidence level of 95%
(323) 322.6 =25
8064 =
25
2100 x 3.84 =
5
70) x (30961. =
e
(pq)z = n
2
2
2
2
Ch 13 55
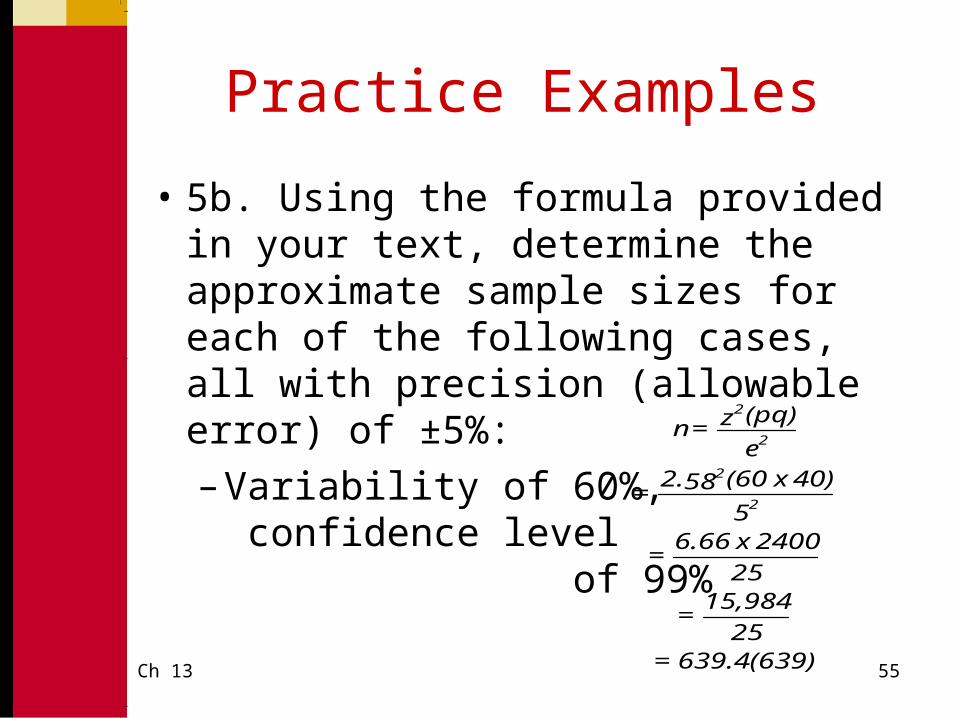
Practice Examples
• 5b. Using the formula provided in your text, determine the approximate sample sizes for each of the following cases, all with precision (allowable error) of ±5%:
– Variability of 60%, confidence level of 99%
(639) 639.4 =25
15,984 =
25
2400 x 6.66 =
5
40) x (60582. =
e
(pq)z = n
2
2
2
2
Ch 13 56
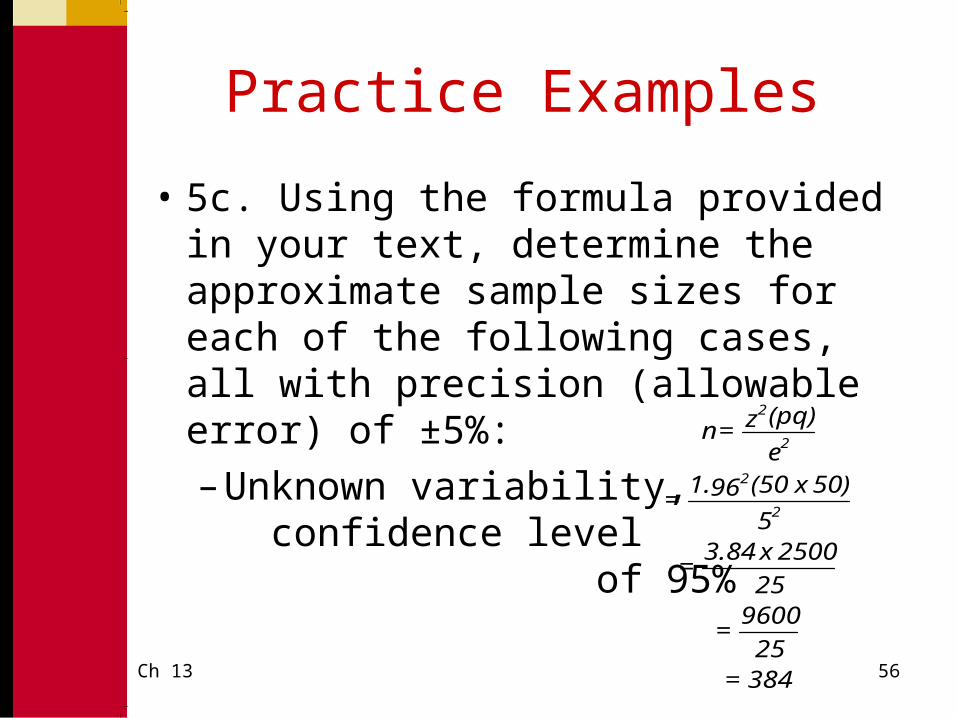
Practice Examples
• 5c. Using the formula provided in your text, determine the approximate sample sizes for each of the following cases, all with precision (allowable error) of ±5%:
– Unknown variability, confidence level of 95%
384 =25
9600 =
25
2500 x 3.84 =
5
50) x (50961. =
e
(pq)z = n
2
2
2
2